Article

Modeling, Energy Performance and Economic Analysis of Rooftop Solar Photovoltaic System for Net Energy Metering Scheme in Malaysia

by
Muhammad Firdaus Mohd Zublie
1,2,
Md. Hasanuzzaman
1,* and
Nasrudin Abd Rahim
1
1
Higher Institution Centre of Excellence (HICoE), UM Power Energy Dedicated Advanced Centre (UMPEDAC), Level 4, Wisma R&D UM, Jalan Pantai Baharu, Kuala Lumpur 59990, Malaysia
2
Institute for Advanced Studies, University of Malaya, Kuala Lumpur 50603, Malaysia
*
Author to whom correspondence should be addressed.
Energies 2023, 16(2), 723; https://doi.org/10.3390/en16020723
Submission received: 13 December 2022 / Revised: 30 December 2022 / Accepted: 4 January 2023 / Published: 7 January 2023
(This article belongs to the Section A2: Solar Energy and Photovoltaic Systems)

Abstract

:
Energy is one of the essential inputs for modernization and social development. Energy demand is increasing, and the primary energy source is fossil fuels, which negatively impact the environment. Energy saving and renewables are the potential solutions which could minimize environmental impact. This paper investigates the energy-saving and solar photovoltaic energy potential of an educational institution, Politeknik Sultan Azlan Shah (PSAS), Malaysia. The feasibility analysis was conducted by assuming that PSAS joined the Net Energy Metering (NEM 3.0) program, where PSAS, as a NEM consumer, has a tripartite supply agreement with renewable energy (SARE) with a distribution licensee known as Tenaga National Berhad (TNB). This paper focuses on zero capital expenditure (CAPEX) saving through a 20-year contract. This paper proposes a rooftop solar photovoltaic diagram using a NEM meter installed in the ring distribution system at PSAS. The estimated savings to be obtained by PSAS in the 20 years that the contract is in force are calculated based on the assumption that the installed solar system has a capacity of 688 kW. The maximum value of power generated by the system for a year is 990,720 kWh. The feasibility analysis found that the cumulative net savings estimate for PSAS based on the overall calculation for 21 years of solar use is RM 3,534,250. Meanwhile, the cumulative assessment of carbon emission reduction obtained in the same period is 14,559,760 kg CO2 or 14,559.76 tons of CO2, which would save 363,994 mature trees from being cut down.

1. Introduction

Environmental issues related to the problem of world energy use began to be discussed officially at the global level through the United Nations Conference on the Human Environment in Stockholm in 1972. This was the first time that this global discussion focused on the world’s energy policy to reduce environmental pollution. Based on that policy, environmental issues began to be listed among the major problems [1] that the international community should consider seriously. In 1992, the United Nations Convention on Climate Change (UNFCCC) was held in Rio de Janeiro, Brazil [2]. The main objective of the UNFCCC is to stabilize the concentration of greenhouse gases in the world’s climate system, while ensuring that it is at a safe level [3]. Therefore, Malaysia signed a declaration at a convention on climate change known as the Conference of the Parties (COP) at a meeting in Rio de Janeiro in 1992 [4]. Malaysia is strongly committed to reducing carbon dioxide emissions and other gases, and ratified the Kyoto Protocol in 1997 [5].
The Kyoto Protocol aims to limit and reduce greenhouse gas (GHG) emissions in each country that ratifies this convention. The Kyoto Protocol sets emission reduction target binding on 37 industrialized countries and economies in transition, and the European Union [6]. Nowadays, human activity is found to be one of the main contributors to greenhouse gas (GHG) emissions through the burning of fossil fuels [7]. Greenhouse gases consist of carbon dioxide (CO2), sulfur dioxide (SO2) and nitrogen dioxide (NO2) [8]. Among greenhouse gases, CO2 is the dominant contributor to total greenhouse gas emissions, at around 60% [9]. In addition, carbon dioxide emissions are also identified as the primary driver of global climate change [10]. Based on World Bank data from 1972 to 2021, it was found that Malaysia’s CO2 emissions in 1972 amounted to 14.7 million tons, and increased to 251.6 million tons in 2021. The increase in these emissions is at an average annual rate of 6.12% [11]. In the context of increasing economic growth, Malaysia’s greenhouse gas emissions were projected to increase by 74% from 2005 to 2020. This scenario illustrates the challenge facing Malaysia to reduce the level of pollution without affecting the achievement of economic growth [12]. Therefore, Malaysia committed in 2030, compared with 2005, to reduce the intensity of greenhouse gas emissions for the gross domestic product (GDP) by 45% [13,14]. Reduction in greenhouse gas emissions can be achieved by implementing energy conservation measures, improving energy efficiency and using renewable energy [15].
Further research on the application of renewable energy is one of the best options to implement now. This study’s findings on renewable or clean energy will be valuable information for the Malaysian government to save money through energy-saving measures while reducing the impact of greenhouse gases. The building sector dominates the transition to clean energy production. The 2018 Global Status Report mentioned that the construction and building operations sector accounts for 36% of global final energy consumption. As a result, the industry contributed almost 40% of carbon dioxide (CO2) emissions to the atmosphere in 2017 [16]. Creating green building construction is one of the most effective strategies to reduce energy consumption and greenhouse gas emissions. Therefore, existing buildings must be redesigned [17] to meet green building standards. Research on the transformation of buildings to green can focus on three types of building: office, residential and educational buildings. The category of academic buildings refers to buildings either in universities, colleges or schools [18]. Many studies have concluded that the effect of reducing gas emissions on campus is directly proportional to the implementation of measures to reduce energy consumption in educational institutions [19,20,21]. Research on existing educational buildings shows that moving towards green academic building status has significantly reduced energy consumption. The Renewable Energy Act was enforced in 2011 to accelerate renewable resources’ contribution to Malaysia’s electricity-generation mix [22].
In 2016, the Malaysian government introduced a new net energy metering (NEM) [23,24,25] to increase the use of renewable energy in the country. NEM is a mechanism that allows eligible users to install solar PV systems with priority-generated energy for their use, and excess energy (kWh) to be exported to the grid. The extra energy will be offset by kWh from the power supplied by distribution licensee, Tenaga National Berhad (TNB) to electricity consumers during the relevant billing period [26]. The comparison of differences between NEM schemes in Malaysia is shown in Table 1.
The introduction of the NEM 3.0 scheme demonstrates the government’s commitment to ensure that solar energy generation will continue to be the focus of renewable energy initiatives in Malaysia. NEM 3.0 is divided into three new categories, namely NEM Rakyat (domestic or residential buildings), NEM GoMEn (government buildings) and NOVA (net offset virtual aggregation) for the commercial and industrial sectors [27,28].
Research by [29] presents a method to measure the economic impact of NEM policy implementation in Brazil. This method allows researchers and policymakers worldwide to improve their NEM schemes while increasing the sustainable development of PV systems. Studies related to NEM have been conducted worldwide, and among the focus of the study is an economic analysis involving the current policy of NEM. In addition, a case study on the cost-effectiveness of NEM conducted in Bangladesh found that a total investment of 22,545.63 USD would bring a profit to investors of 26,881.78 USD, within a payback period of 6.85 years [30].
Mainly, the related studies chose a research location to perform feasibility analysis under the NEM scheme at an educational institution [31,32,33,34,35]. All the analysis uses simulation software, such as HOMER, RETScreen, PVsyst software, and PVWatts, to produce the results. Therefore, based on the literature review, this paper highlights the performance of a feasibility analysis on educational institutions in Malaysia, using the NEM 3.0 scheme under the category of NEM GoMEn initiatives. This paper does not follow the simulation software methodology to make the analysis. Still, it uses estimation calculation [36,37] based on guidelines [38] issued by the Energy Commission and the utility bill of an educational institution known as Politeknik Sultan Azlan Shah (PSAS). The research objective is to model energy performance and present an economic analysis of the rooftop solar photovoltaic system at PSAS under the NEM GoMEn scheme. Based on entire calculations for 21 years of solar use, the feasibility analysis estimates the cumulative net savings obtained, including carbon emission reductions.

2. Methodology

2.1. PSAS Background

Malaysian Polytechnic POLYGreen Blueprint 2015 is the primary reference for the implementation plan and strategic direction for green technology practices in polytechnics nationwide. As Polytechnic Sultan Azlan Shah (PSAS) is an educational institution under the structure of Polytechnic Malaysia, this institution is responsible for improving green technology practices on campus. The PSAS campus is located in Behrang, Perak, Malaysia, in a hilly landscape. It has 47 buildings, consisting of academic, non-academic and residential buildings. PSAS covers a broad area of 100 acres with a gross floor area (GFA) of 97,975 m2, and receives an 11kV supply from the national grid.

2.2. Feasibility of Renewable Energy Generation Based on Energy Sources Available

Assessing the potential of suitable renewable energy sources to be utilized by PSAS is vital in reducing greenhouse gas emissions. Studying the possibility of renewable energy generation in these institutions will help predict the energy consumption and savings that can be obtained in the future. Research results suggest increasing energy efficiency is an effective strategy for reducing energy consumption in educational buildings. However, other methods are also effective in reducing energy consumption by a building, namely through the installation of renewable energy systems. Renewable energy sources involve natural energy sources that are obtained from our environment. These natural resources are hydropower, bioenergy, wind, geothermal and ocean energy [39]. The position and location of this institution should be considered when exploring the type of renewable energy sources suitable to generate an alternative power supply in PSAS. Based on the geographical location of Malaysia, located on the equator, the country experiences hot and humid weather, receiving a lot of rainfall throughout the year. Malaysia records a lot of solar radiation throughout the year, with most places having average daily solar radiation of 4.7–6.5 kWh/m2 [40]. The weather conditions and rainfall in PSAS are within the range stated above. PSAS is located in Behrang, Perak, with latitude coordinates 3.770015 and longitude 101.450107 [41].
Based on the geographical location of PSAS, the renewable energy sources that are suitable to be considered for generating alternative energy sources are hydro energy and solar energy only. Nevertheless, it was found that installing a solar system is the most practical and relevant when considering the potential of solar energy available in the proposed location. Information about the possibility of solar energy at the proposed site in the institution is determined from global radiation values (kWh/m2/day), PV-type area energy generation (kWh/year), and sunshine duration (hours) [39]. The selection of a study location with maximum solar radiation is also essential for placing solar panels or collectors according to the latitude and longitude of the location [42]. Although this educational institution has a small lake that allows a hydropower source to be selected, the absence of a river in the surrounding area makes implementing small-scale hydro projects less suitable. Therefore, using solar energy to generate electricity is the best option for PSAS because practical geographical factors support it. In addition, solar energy is also becoming more popular in Malaysia because of the excellent climate in the country. The geographical location at Perak, Malaysia, receives an annual average solar irradiation of 1643 kWh/m2 [43]. Besides that, the effect of rain in Malaysia is ideal for installing solar PV systems, due to the frequent auto cleaning and cooling down of solar panels that can still produe power in rain showers. In addition, the goal of reducing energy consumption in government buildings by installing solar energy generation systems is a practical solution at this time [44]. This study focused on two types of designs, where a comparison of the new modified design with the conventional design of the solar system was made. This study adapted ideas from a study conducted by [45] after solar energy sources were confirmed as an option.

2.3. Data Set of a Utility Bill

Predicting energy consumption for the coming year is closely related to PSAS’s current energy consumption data. Several data sets are needed to help identify past and current PSAS energy consumption patterns. Therefore, the data set collected in this study refers to the monthly data of energy consumption (kWh) and energy demand (kW) obtained from PSAS utility bills issued by TNB. The data set involves 36 months from January 2019 to December 2021, and is shown in Table 2. This table shows the energy consumption pattern and energy demand for three years.

2.4. Baseline Data

The PSAS utility bill from TNB for 2019 is the primary reference that provides the baseline data to calculate the solar electricity generation and accumulated net savings during the 20 years that the contract is in effect [46]. Table 2 shows the data from the PSAS utility bill for 2019 until 2021. The average maximum demand (kW) from the utility bill for the year 2019 is used to perform the analysis. The adequate date replacement from NEM 2.0 to NEM 3.0 is February 2021, and the past year’s utility bill is supposed to be 2020. Although the latest energy consumption data from the PSAS utility bill is from the year 2021, the data cannot be used as reference data in this study. Likewise, data for the year 2020 cannot be used as reference data, because that year was the start of the COVID-19 pandemic that spread worldwide [47].

2.5. NEM 3.0 (NEM GoMEn)

NEM 3.0 is divided into three different programs, each allocating its quota for a specific market sector [48]. NEM 3.0 offers a quota of 800 megawatts (MW) from 2021 to 2023. NEM 3.0 consists of three programs: NEM Rakyat, NEM GoMEn and NEM NOVA. The NEM Rakyat quota allocation is 100 MW, the NEM GoMEn quota allocation is 100MW and the NEM NOVA quota allocation is 600 MW [28]. Through the Ministry of Energy and Natural Resources (KeTSA), the Malaysian government hopes that implementing NEM 3.0 will open up wider opportunities for more citizens to participate. The government encourages Malaysians, government agencies, houses of worship, local companies and entrepreneurs to get involved in the country’s renewable energy development agenda and reduce their respective electricity bills. NEM GoMEn is one of three programs under the NEM 3.0 scheme, where NEM GoMEn stands for government ministries and entities; this initiative only involves government buildings.
Only government agencies, such as ministries, departments or statutory bodies established by the government are eligible to participate in this program or initiative. The offer period of this program is three years, effective from the 1 February 2021 to 31 December 2023. The total quota offered is 100 MW, and the installed capacity limit is 1 MWac per agency account. The program also applies a ten-year one-to-one offset rate [23,28,49]. NEM GoMEn program aims to reduce electricity bills in government buildings through solar PV systems. The government has prepared a quota of 100 MW to be applied for this program. It is estimated that 100 government agencies in Peninsular Malaysia will enjoy a monthly reduction in electricity bills amounting to RM6 million [50]. The NEM 3.0 Program is the initiative for PSAS to install solar PV on the rooftop of their premises primarily for its use. During the first ten years of operation, any excess energy not consumed due to operational constraints or monthly or seasonal variation in load demands at said premises may be exported to the distribution system. PSAS may use the credit received for such excess energy to offset part of the electricity bill for energy provided by the distribution licensee (TNB) during the applicable billing period. NEM GoMEn refers to a program for entities under a government, such as PSAS, which had not participated in any prior solar programs [51].

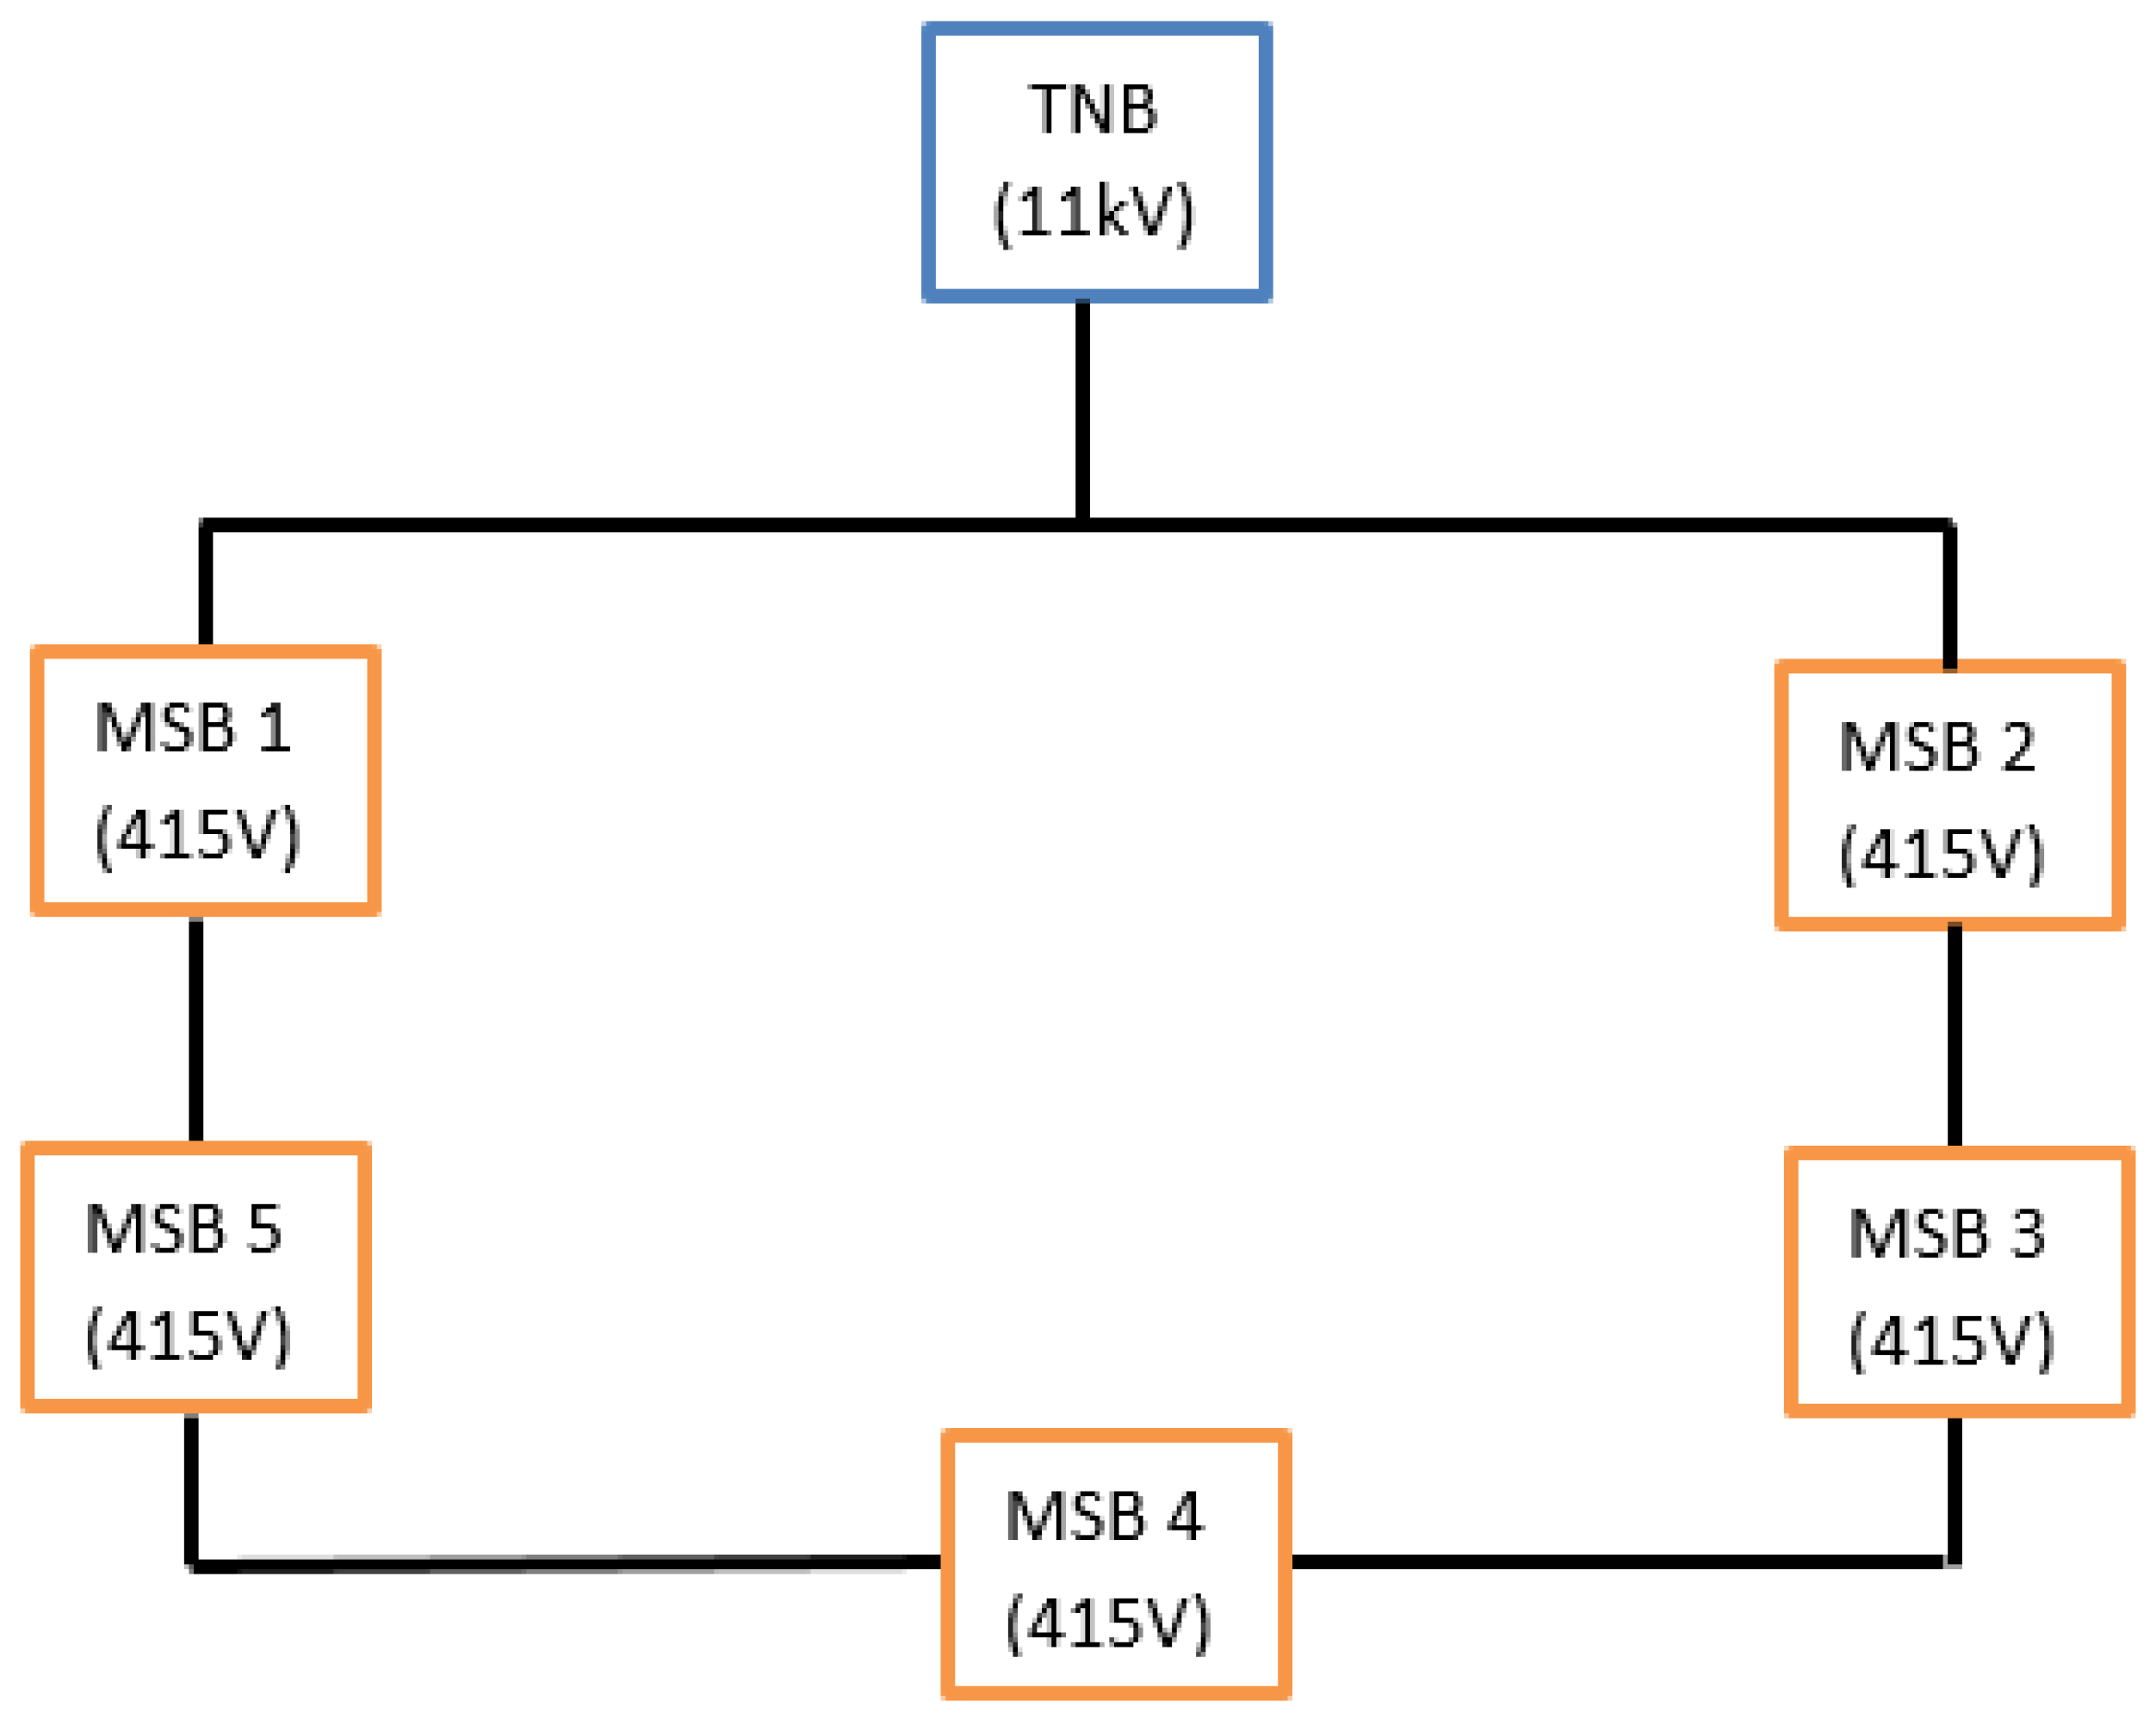
2.6. Electricity Distribution Connection System in PSAS

The electricity distribution system at PSAS currently uses a type of connection known as a ring connection, as shown in Figure 1. PSAS receives an 11 kV supply from Tenaga National Berhad (TNB) through the national grid, which is then downgraded to 415 V through PSAS’s five main switchboards (MSB). Figure 2 shows the proposed electricity distribution system according to the new layout, where modifications are made to the current distribution layout shown in Figure 1. The proposed new distribution model is equipped with rooftop solar photovoltaics, inverters and NEM meters connected to the existing distribution system at PSAS. The ring system allows solar energy generation by any building or location fitted with a rooftop PV solar system and connected to the distribution system within PSAS. The solar energy generated will be distributed to the five MSBs, as shown in Figure 2. If there is excess power, it will be exported to the TNB grid system through the NEM meter.

2.7. Mathematical Equation

In Malaysia, most power plant generation burns fossil fuels to produce electricity. Burning fossil fuels produces greenhouse gas emissions (GHG) such as CO2, SO2, and CO [7]. However, based on the energy-saving strategy implemented in the PSAS building, the GHG reduction occurs according to the percentage of electricity generation in Malaysia that involves different parts of the fuel mix. Besides that, the estimated calculation of GHG emission will include the element of electricity percentages generated by each type of fuel, such as hydro, gas, coal, and diesel, plus emission factors in a power station referring to Malaysian conditions [52]. Energy savings strategies are directly related to emission reductions, estimated value according to fuel type, the percentage of electricity generated by the specific fuel and the fuel emission factor for producing the electricity, which is found by using the following mathematical Equation (1) [36,37]. The emission factors per unit of energy generation for the four fuel types were taken from the reference [36,37] and are shown in Table 3. The electricity generation mix in Malaysia has been taken from Malaysia Energy Statistics Handbook 2017, the reference source from the Energy Commission. The electricity generation mix is about 13.0%, 42.5%, 0.4%, 43.5% and 0.6% from hydro, coal, petroleum, natural gas and others, respectively, for the year 2016 [52].
EMy = EPy (PEy1 × Emp1 + PEy2 × Emp2 + PEy3 × Emp3 + … PEyn × Empn)
where EMy is the total amount of carbon emission (ton), EPy is the amount of electricity production in the year y, PEyn is the electricity generation percentage in the year y according to recommended type n fuel. Empn is the emission factor per unit of energy generation of fuel type n.

3. Results

3.1. Historical Energy Consumption and Maximum Demand at PSAS

Figure 3 shows the history of PSAS energy analysis for three years (2019–2021). Figure 3 is generated from data in Table 2, which show that energy consumption decreased from 4,231,412 kWh in 2019 to 3,167,783 kWh in 2020, and further decreased to 2,976,720 kWh in 2021. Based on the reference value of energy consumption in 2019, it was found that the following year, 2020, recorded a decrease in total annual energy consumption to 1,063,629 kWh with a percentage decrease of around 25%. Meanwhile, the year 2021 recorded a decrease in total annual energy consumption to 1,254,692 kWh, with a percentage decrease of approximately 30%.

3.2. Analysis of Energy Demand at PSAS

The feasibility analysis starts by identifying the highest monthly energy consumption in 1 year, as shown by Table 2, as an input to design a solar PV system that meets the objective of reducing energy consumption and annual energy bills by about 20% of the baseline data for PSAS. This research uses a ratio of 20:80, where 20 refers to the electricity produced by the solar PV system, while 80 refers to the electricity supplied by TNB. Table 2 shows that the highest energy consumption in 2019 was in September, while the lowest was in June. The reading in September was 412,774 kWh, while in June, it was 238,018 kWh. The difference between the highest versus the lowest total energy consumption is about 1,063,629 kWh. This rather significant difference is because the polytechnic education system involves two activity modes: lecture sessions and semester breaks (either mid-semester or end-of-semester breaks). The energy analysis in this section is divided into two categories. The first category of analysis is named “normal time”, which involves lecture sessions, and the second category is “on-leave time” (semester break).
After examining the approximate value during normal time and on-leave time, the PV system proposed to be installed in this study is based on the calculation during normal time. From the analysis below, the total monthly energy consumption drops by 42% during the semester break. Therefore, PV systems are designed based on the total energy consumption at normal times. The excess energy produced by the PV system during the on-leave time will be transferred to the grid system through the installed NEM meter. Additionally, the average maximum demand (MD) recorded for 2019 was 1,488 kW. This highest monthly value is referenced in the calculation process of designing solar PV systems. The proposed solar system capacity size to be installed is 688 kW. This capacity value is obtained by multiplying the daily energy consumption value of 13,760 kWh by 20% and dividing the result by 4 h. The calculation to determine the capacity of a solar PV system is as follows.
  • Normal time:
    • Energy consumption per day = (412,774 kWh)/(30 days) = 13,760 kWh/day;
    • 20% of daily energy consumption supplied by solar = 2752 kWh/day; and
    • PV system = (2752 kWh)/(4 h) = 688 kW.
  • On-leave time:
    • Energy consumption per day = (238,018 kWh)/(30 days) = 7934 kWh/day;
    • 20% of daily energy consumption supplied by solar = 1587 kWh/day; and
    • PV system = (1587 kWh)/(4 h) = 397 kW.

3.3. Main Components’ Capacity in Proposed Solar PV Systems

Table 4 summarizes the main components’ capacity in the proposed rooftop solar PV systems at PSAS. A total of 69 solar PV panels and three inverters are needed to generate electricity that can cover 20% of the electricity needs in PSAS.

3.4. Feasibility Analysis of Zero Capital Expenditure Saving for SARE between PSAS and TNB

Table 5 shows the detailed feasibility analysis of zero capital expenditure savings for SARE between PSAS and TNB, named GSPARX Sdn Bhd (GSPARX). GSPARX is a wholly owned subsidiary of TNB Renewable Sdn Bhd (TRe), which is a company in TNB. GSPARX focuses on the green retail generation business by investing in solar PV systems for retail electricity customers [53]. Table 5 shows the number of years calculated for the cost–benefits of the project, involving a calculation for 21 years, where 20 years is the calculation during the contract’s enforcement, and the 21st year is the calculation after the contract ends.

3.5. Carbon Emission Reduction

Table 6 shows the summary of carbon emission reduction for PSAS after joining the NEM GoMEn program. The estimated cumulative carbon emission reduction over 21 years is 14,559,760 kg of CO2, 122,556 kg of SO2 and 60.045 kg of CO. New research has found that reductions in greenhouse gas emissions around the world have led to improvements in air quality. This situation brings benefits to human health and prevents economic losses. In the long term, these emissions reductions also help to prevent disastrous climate change [54].

4. Discussion

4.1. Historical Energy Analysis at PSAS

Based on the overall pattern of energy consumption and maximum demand shown in Figure 3, it was found that there was a decrease and an increase in energy for each year evaluated. The growth and decline in energy consumption value are closely related to the current number of PSAS residents, consisting of staff and students, in the year under review. Usually, the number of staff is almost the same yearly; only the number of students records a significant difference. This situation is due to the number of student intakes that vary each year, affecting the formation of the graph pattern. As a result, the reading of the energy graph in the study’s time interval shows an increase and a decrease. However, from April 2020, there was a drastic decrease in energy consumption and demand, where the total energy consumption and energy demand, respectively plunged to the lowest level in the three-year history of the assessment with a record of 89,752 kWh and 181 kW. This situation is related to the spread of the coronavirus disease 2019 (COVID-19) that is attacking the world. COVID-19 was officially announced by the World Health Organization on 12 January 2020, and was detected to have originated in Wuhan before becoming an epidemic that spread worldwide [55]. In January 2020, the first three cases of COVID-19 were detected in Malaysia and were confirmed by the Malaysian Ministry of Health, where they were categorized as imported cases. The first wave of the COVID-19 outbreak in Malaysia involved a cumulative total of 22 cases. The second epidemic wave began on 27 February, with the cumulative number of cases reaching 129 on 10 March [56]. As of 16 March 2020, the accumulated cases have surpassed 500 cases, where the first death was recorded on 17 March 2020 [57]. Following the sudden increase in positive cases and difficulty tracing close contacts, the Malaysian Government implemented a Movement Control Order (MCO) on 18 March 2020 [55,56,58]. The implementation of the MCO by the National Security Council helped to curb the spread of the COVID-19 epidemic. When this MCO was implemented, all educational institutions were ordered to close [59]. All face-to-face learning and teaching sessions were not allowed, and were switched to online learning mode. In addition, the government also enforced a 100% work-from-home order involving academic and non-academic staff. All staff were not allowed to be in the office except to perform essential services, and had to obtain special permission for this. The implementation of the work-from-home instruction and online learning was identified as a significant contributing factor influencing the load profile of educational institutions such as PSAS [60]. This situation has led to a substantial decrease in energy consumption on campus [61]. The series of conditions experienced justifies the selection of utility data in 2019 as reference data, even though the latest year is 2021. In addition, the analysis results related to energy consumption in PSAS during the MCO are in line with the findings of studies conducted by other parties around the world [59,62]. The reduction in energy consumption on campus is directly proportional to the reduction in CO2 production. Therefore, measures to avoid CO2 emissions are among the important issues that educational institutions need to pay attention to. Carbon emission reduction is discussed in more detail in Section 4.3.

4.2. Feasibility Analysis of Rooftop Solar PV by Implementing NEM 3.0 (NEM GoMEn)

In the current system, the distribution system in PSAS uses a ring connection that allows the power transfer from one or more paths, also known as parallel lines [63], between the distribution substation and the load. The ring system results in better utilization and improves the voltage stability in the distribution system [64]. PSAS currently has a single TNB power meter that uses the tariff value according to the medium voltage general commercial tariff (C1). The electricity consumption charge rate is based on a flat rate value of RM 0.365/kWh, while the maximum demand charge (MD) is RM 30.3/kW [65]. The feasibility analysis was conducted assuming that PSAS signed a Tripartite Supply Agreement with Renewable Energy (SARE) with TNB. The analysis will focus on zero capital expenditure (CAPEX) saving throughout a 20-year contract [46]. Through this agreement, PSAS does not have to incur any upfront capital expenditure to install a rooftop photovoltaic system, known as zero upfront cost. After the 20 years of the contract ends, the system is wholly owned by PSAS. As long as the contract is in effect, PSAS will only be charged for the energy generated by the PV system according to the fixed solar tariff rate of RM 0.31 [66] compared with RM 0.365. The energy generated by PSAS will be used first, reducing the amount of energy imported from TNB. Under this NEM 3.0 program, any excess power generated will be exported to the utility grid and paid for on a “one-to-one” offset basis [28]. This means that every 1 kWh exported to the grid system will be offset by 1 kWh imported from the grid [67]. As an educational institution, PSAS usually does not operate on weekends or public holidays. Therefore, a situation of excess energy generated will occur. This surplus energy is ideal for export to the grid.
Nevertheless, the priority of the energy produced is the institution’s own use. The credit from TNB that is allowed for a maximum rollover is for 12 months, according to NEM 1:1 ratio [28]. According to Figure 2, a bi-directional meter [68] will be installed on the ring connection in the distribution power system at PSAS. The ring system allows solar energy generation to be performed by any building or place with a rooftop PV solar system installed and connected to the system. The solar energy generated will be distributed to all MSBs, and if there is a surplus of power, it will be exported to the TNB grid system via NEM meters. The estimated savings that PSAS will obtain during the 20 years that the contract is in force are calculated based on the assumption that the size of the installed solar system has a generating capacity of 688 kW. The maximum value of solar PV capacity allowed by the Energy Commission for solar PV connected to grid systems for commercial buildings such as PSAS is 75% of the maximum demand (MD), according to annual utility bills [38] in 2019. Calculations are made by referring to the value shown in Table 2. This analysis relates to the average value of MD in 2019 [28], which recorded a value of 1488 kW. The 75% of maximum demand from annual utility bills as per the Energy Commission’s guidelines for grid-connected solar PV for the commercial customer is equivalent to 1,607,040 kWh (1488 kW × 4 h × 30 days × 12 months × 0.75). However, this feasibility analysis does not use the maximum value of 75% of this MD, because another condition in the NEM GoMEn sets the installed capacity limit for government buildings to 1 MWac [69]. This means that an account in the name of PSAS can only install a solar PV system that generates a maximum of 1 MWac of electricity. However, the proposed solar PV system can produce a maximum annual energy consumption for the first year of 990,720 kWh (688 kW × 4 h × 30 days × 12 months). The value of 4 h is taken after reviewing all the research findings that several previous researchers have presented.
Based on the solar radiation curve [70] and the position of PSAS, which is located in the tropical region of Peninsular Malaysia, it was found that the average number of hours of full sunlight under normal conditions, as stated by the author, is in the range of 4 to 6 h a day. In addition, research by [71] states that the sun’s peak is 6 h, while other authors also state that the period is between 4 and 6 h [72]. Based on [73], Malaysia’s average peak sun hours are between 4.0 and 5.4 h depending on the sunlight’s location. Considering the rapid movement of clouds and the hot and humid conditions throughout the year in Malaysia, it was found that the average duration of peak sunlight hours in this research was only 4 h. The justification for this period of 4 h is taken because most studies state that 4 h is the lowest value. In addition, 4 h is in line with the practical values used in calculations in the solar-related industry. In addition, using this 4 h value can help avoid system design situations that cannot meet the power generation requirements as theoretically calculated.
Using a value of 6 h in the calculation can produce a system design categorized as under-designed. Solar capacity is calculated by dividing the total daily load by 4 h. The inverter used in this solar power generation system is an inverter with a maximum power point-tracking (MPPT) controller type. The capacity of the hybrid inverter is 8 kW [74], where the inverter’s maximum power point (MPP) has a two-channel MPPT where each channel can receive 5000 W with a maximum PV input voltage of 500 V (5000 W/500 V). One channel can support the output of 10 solar PV panels where each input is 50 V (50 V × 10 panels = 500 V). To ensure that the inverter specifications are matched to receive the power generated by the solar panel, a calculation of the number of inverters needs to be made. The inverter load is calculated based on the highest monthly maximum demand value for 2019, as stated in Table 2, which is 1717 kW. A 20% portion of 1717 kW equals 343 kW. The number of solar panels required to generate a solar power supply of 20% of PSAS’s total daily energy consumption is calculated by multiplying the value of 20% of the value of solar capacity, which is 688 kW, and dividing by the power for one solar panel, 500 W. This research applies standard-size solar panels for industrial use with a capacity of 500 W/50 V. The number of inverters required by the PSAS building can be divided into 20 solar panels (two MPPT channels).

4.3. Cost–Benefit and Environmental Impact of Using Solar Energy

Cost benefits are calculated assuming that PSAS has established cooperation through a 20-year agreement with TNB GSPARX, a subsidiary of TNB responsible for NEM GoMEn-related matters. Calculations for the first year show that the total electricity generated by the solar PV system is 990,720 kWh. This value is obtained from 20% of the daily energy consumption supplied by solar at regular times, which is 688 kW multiplied by 4 h × 30 days × 12 months. For the second and subsequent years, the annual degradation of solar PV panel energy production decreased by 0.5% per year.
Using TNB and solar tariffs, energy cost is calculated and presented in Table 5. Referring to TNB’s current tariff, the value of energy cost for category C1 buildings is RM 0.365/kWh. At the same time, the solar tariff rate is RM 0.31, a fixed tariff that will be used throughout the 20-year contract in force. The value of energy cost is calculated by assuming that the annual degradation of solar PV panel energy production is 0.5% per year, with a TNB tariff increase of 9% every three years [75]. The year four energy cost using a TNB tariff becomes RM 0.398, and increases to RM 0.434 in year 7. The results involving the overall calculation for 21 years of solar use are shown in Table 5. After the 20-year contract expires, the cost of energy using solar tariffs becomes zero. The cost of energy using TNB or solar tariffs is obtained by multiplying the annual value of solar generation with the relevant tariff value. The analysis results from Table 5 show that the difference between the total cost of energy using the TNB tariff and the solar tariff is RM 3,589,250, equivalent to the amount of energy savings in PSAS.
As long as this agreement is in effect, PSAS does not have to pay the cost of the solar PV system’s operation and maintenance (O&M), because TNB GSPARX bears all the related fees. After the contract expires, PSAS will start paying O&M costs estimated at RM 55,000 per year. Based on the analysis results, the estimated accumulated net savings for PSAS during the 20 years of the contract is RM 3,534,250. The added value gained through this zero CAPEX solution program is helping PSAS enjoy immediate monthly electricity bill savings when allowing TNB GSPARX to use PSAS’s roof to install solar PV. In addition, selecting the zero CAPEX solution program under NEM GoMEn protects PSAS from experiencing tariff increases in the coming year. Other advantages are also gained, including aspects of development such as power system studies, project management, insurance, PV system design and certification, online system monitoring and staff training and authorization on operation, maintenance and troubleshooting. Installing rooftop solar PV systems on certain buildings leads to savings in total energy consumption at PSAS. This installation also significantly impacts environmental sustainability by reducing greenhouse gas emissions such as CO2, SO2, and CO while supporting the vision of maintaining a green environment. The CO2, SO2, and CO emission reduction analysis results confirm that installing solar PV systems positively impacts environmental sustainability. The amount of solar generation in Table 5 equals the annual energy savings data obtained by PSAS. The carbon emission reduction for PSAS was calculated using Equation (1) and the yearly energy savings data from Table 6.
In the first year of electricity generation, a 20% contribution from the solar PV system can reduce as much as 728,625 kg of CO2 emissions. This saving is also equivalent to 728.6 tons of CO2 [76] and equivalent to 18,215 mature trees, which were successfully saved from being cut down. This calculation is based on the 1 ton of CO2 not absorbed being equivalent to 25 mature trees cut down. The term mature tree refers to 25 trees per hectare of commercial species with a diameter of 45 cm or more that help restore cultivated forests [77]. Based on Table 6, the decrease in total carbon emissions over 21 years is equivalent to 14,559.76 tons of CO2, which saves 363,994 mature trees from being cut down. The analysis results clearly show that the rooftop solar PV system proposed to be installed in PSAS can positively impact environmental sustainability. PSAS’s participation in the NEM 3.0 (NEM GoMEn) program aligns with the government’s initiative to reduce the nation’s CO2 emissions by 2030. Feasibility analysis on cost–benefits and environmental impact clearly show that the proposed installation of this modified power distribution system is practical, and can help achieve the energy-saving objectives set. Most importantly, the analysis results also align with and support the policy stated in the Malaysia Polytechnic Action Plan 2015–2020 and the SmartGreen Polytechnic Community College (PolyCC) Action Plan 2021–2026 regarding the implementation of green technology on campus to make what is known as an innovative campus.

5. Conclusions

A feasibility analysis of sustainable clean power generation using rooftop solar PV for PSAS referred to the NEM 3.0 mechanism known as NEM GoMEn. Based on the assumption that the size of the installed solar system has a capacity of 688 kW, the maximum capacity of the solar power generation system proposed is 990,720 kWh, which is a value not exceeding the installed capacity limit of 1 MWac for the NEM GoMEn scheme. It is also equivalent to the energy generated by a solar PV system for the first year. The proposed distribution model allows the solar energy generated to be used by institutions or sold to TNB. When participating in the CAPEX program under the NEM scheme, energy saving performance provides energy savings of RM 3,589,250 due to the difference between TNB tariffs and solar tariffs. The final result of the economic analysis found that the estimated value of accumulated net savings for PSAS during the 21 years is about RM 3.53 million. The cumulative estimate of greenhouse gas reductions obtained over 21 years is 14,559,760 kg of CO2, 122,556 kg of SO2 and 60.045 kg of CO. The total reduction in carbon emissions for 21 years is equivalent to 14,559.76 tons of CO2, meaning that 363,994 mature trees have been saved from being cut down. The analysis proves that CO2 reduction has a vital significance in installing clean energy generation through the solar PV system at PSAS. Through the feasibility analysis, it was found that educational institutions such as PSAS will obtain many other benefits when participating in the NEM GoMEn program under NEM 3.0 in addition to saving energy and saving on utility bills. In addition, the results of the feasibility analysis carried out through the NEM GoMEn program coincide with and support the aspirations set out in the Malaysia Polytechnic Action Plan 2015–2020 and the SmartGreen Polytechnic Community College (PolyCC) Action Plan 2021–2026 regarding the existence of green campuses. Finally, the findings of this study prove that any institution of higher education in Malaysia with features such as PSAS can obtain energy and cost-saving benefits with zero upfront capital cost for the installation of rooftop solar systems by participating in the CAPEX program under the latest NEM scheme.

Author Contributions

Conceptualization, M.F.M.Z., M.H. and N.A.R.; writing—original draft preparation: M.F.M.Z.; writing—review and editing, M.H. and N.A.R.; supervision, M.H. and N.A.R.; project administration, M.H. and N.A.R.; funding acquisition, M.F.M.Z., M.H. and N.A.R. All authors have read and agreed to the published version of the manuscript.

Funding

This research received no external funding.

Data Availability Statement

Not applicable.

Acknowledgments

The authors thank the technical and financial assistance of UM Power Energy Dedicated Advanced Centre (UMPEDAC) and the Higher Institution Centre of Excellence (HICoE) Program Research Grant, UMPEDAC—2020 (MOHE HICOE—UMPEDAC), Ministry of Education Malaysia, IF006-2021, RU002-2021, University of Malaya. The authors also would like to thank the Director of PSAS, who allowed us to conduct a feasibility study on their institution.

Conflicts of Interest

The authors declare no conflict of interest.

Abbreviation

CAPEXzero capital expenditure
COcarbon monoxide
CO2carbon dioxide
COPConference of the Parties
COVID-19coronavirus disease 2019
GDPgross domestic product
GHGgreenhouse gas emissions
GFAgross floor area
GoMEngovernment ministries and entities
HOMERhybrid optimization model for multiple energy resources
KeTSAMinistry of Energy and Natural Resources
kgkilogram
kWkilowatt
kWhkilowatt hour
MSBmain switchboard
MDmaximum demand
MCOMovement Control Order
MPPmaximum power point
MPPTmaximum power point tracking
NEMnet energy metering
NOVAnet offset virtual aggregation
PSASPoliteknik Sultan Azlan Shah
PVphotovoltaic
RMRinggit Malaysia
SAREsupply agreement with renewable energy
SSBsub-switch board
SO2sulfur dioxide
TNBTenaga National Berhad
UNFCCCUnited Nations Convention on Climate Change
USDUnited States Dollar

References

  1. UN. Delivering on the Vision of the 1972 Stockholm Declaration and Achieving the 2030 Agenda for Sustainable Development. 2022. Available online: https://unemg.org/wp-content/uploads/2022/06/UNEP_EMG_Delivering-on-the-vision-of-the-1972-Stockholm-Declaration-Rev3.pdf (accessed on 3 December 2022).
  2. Kusumadewi, T.V.; Limmeechokchai, B. CO2 mitigation in residential sector in Indonesia and Thailand: Potential of renewable energy and energy efficiency. Energy Procedia 2017, 138, 955–960. [Google Scholar] [CrossRef]
  3. UNFCCC. The Convention. 2019. Available online: https://unfccc.int/process-and-meetings/the-convention/what-is-the-united-nations-framework-convention-on-climate-change (accessed on 5 May 2019).
  4. Balibar, S. Energy transitions after COP21 and 22. C. R. Phys. 2017, 18, 479–487. [Google Scholar] [CrossRef]
  5. Böhringer, C. The Kyoto protocol: A review and perspectives. Oxf. Rev. Econ. Policy 2003, 19, 451–466. [Google Scholar] [CrossRef]
  6. UN. What Is the Kyoto Protocol? 2022. Available online: https://unfccc.int/kyoto_protocol (accessed on 3 December 2022).
  7. Habib, M.A.; Hasanuzzaman, M.; Hosenuzzaman, M.; Salman, A.; Mehadi, M.R. Energy consumption, energy saving and emission reduction of a garment industrial building in Bangladesh. Energy 2016, 112, 91–100. [Google Scholar] [CrossRef]
  8. Salahudin, S.N.; Abdullah, M.; Newaz, N. Emissions: Sources, policies and development in Malaysia. Int. J. Educ. Res. 2013, 1, 1–12. [Google Scholar]
  9. Farabi, A. Energy consumption, carbon emissions and economic growth in Indonesia and Malaysia. Int. J. Energy Econ. Policy 2019, 9, 338–345. [Google Scholar] [CrossRef]
  10. Ritchie, H.; Roser, M.; Rosado, P. CO2 and Greenhouse Gas Emissions. Our World in Data. 2020. Available online: https://ourworldindata.org/co2-and-other-greenhouse-gas-emissions (accessed on 5 May 2022).
  11. Knoema. Malaysia—CO2 Emissions. 2022. Available online: https://knoema.com/atlas/Malaysia/CO2-emissions (accessed on 3 December 2022).
  12. Tan, C.-C.; Tan, S. Energy consumption, CO2 emissions and economic growth: A causality analysis for Malaysian industrial sector. Int. J. Energy Econ. Policy 2018, 8, 254. [Google Scholar]
  13. Suruhanjaya Tenaga. National Energy Balance; Energy Commission: Putrajaya, Malaysia, 2016.
  14. Raihan, A.; Tuspekova, A. Toward a sustainable environment: Nexus between economic growth, renewable energy use, forested area, and carbon emissions in Malaysia. Resour. Conserv. Recycl. Adv. 2022, 15, 200096. [Google Scholar] [CrossRef]
  15. JPPKK. BluePrint POLYGreen Politeknik Malaysia; Department of Polytechnic and Community College Education: Putrajaya, Malaysia, 2015. [Google Scholar]
  16. IEA. 2018 Global Status Report; International Energy Agency: Paris, France, 2018. [Google Scholar]
  17. Soon, C.K.; Zaini, Z.; Mohd Ujang, A.; Nagapan, S.; Abdullah, A.H.; Hasmori, M.F.; Rassiah, K. A case study of green building in Malaysia: Cost saving analysis. Innovation 2017, 10, 9. [Google Scholar]
  18. Shafiei, M.; Abadi, H. The Impacts Of Green Building Index Towards Energy Consumption In Malaysia. Aust. J. Basic Appl. Sci. 2017, 11, 131–139. [Google Scholar]
  19. Getu, B.N.; Attia, H. Electricity audit and reduction of consumption: Campus case study. IJAER 2016, 11, 4423–4427. [Google Scholar]
  20. Vásquez, L.; Iriarte, A.; Almeida, M.; Villalobos, P. Evaluation of greenhouse gas emissions and proposals for their reduction at a university campus in Chile. J. Clean. Prod. 2015, 108, 924–930. [Google Scholar] [CrossRef]
  21. Hu, M. Optimal renovation strategies for education buildings—A novel BIM–BPM–BEM framework. Sustainability 2018, 10, 3287. [Google Scholar] [CrossRef] [Green Version]
  22. Mansur, T.; Baharudin, N.; Ali, R. Technical and economic analysis of net energy metering for residential house. Indones. J. Electr. Eng. Comput. Sci. 2018, 11, 585–592. [Google Scholar] [CrossRef]
  23. Husain, A.A.F.; Phesal, M.H.A.; Ab Kadir, M.Z.A.; Amirulddin, U.A.U.; Junaidi, A.H.J. A Decade of Transitioning Malaysia toward a High-Solar PV Energy Penetration Nation. Sustainability 2021, 13, 9959. [Google Scholar] [CrossRef]
  24. Yatim, Y.; Yahya, M.W.; Tajuddin, M.F.N.; Ismail, B.; Sulaiman, S.I. Tecno-economic analysis of PV module selection for residential BIPV with net metering implementation in Malaysia. In Proceedings of the 2017 IEEE 15th Student Conference on Research and Development (SCOReD), IEEE, Putrajaya, Malaysia, 13–14 December 2017. [Google Scholar]
  25. Razali, A.H.; Abdullah, P.; Hassan, M.Y.; Hussin, F. Comparison of new and previous net energy metering (NEM) scheme in Malaysia. ELEKTRIKA-J. Electr. Eng. 2019, 18, 36–42. [Google Scholar] [CrossRef]
  26. SEDA. Net Energy Metering. 2022. Available online: https://www.seda.gov.my/misc/frequently-asked-questions/net-metering-nem-faq/ (accessed on 5 March 2022).
  27. Muda, W.; Anang, N.; Muslim, A. NEM schemes analysis based on installed grid-connected PV system for residential sector in Malaysia. Int. J. Energy Prod. Manag. 2021, 6, 382–394. [Google Scholar] [CrossRef]
  28. SEDA. Net Energy Metering (NEM) 3.0. 2022. Available online: http://www.seda.gov.my/reportal/nem/ (accessed on 25 January 2022).
  29. Komeno, A.S.F.; Filho, A.D.L.F.; Domingues, E.G.; Vieira, D.; Raggi, L.M.D.R. Method for analyzing the economic viability of net energy metering regulation based on risk analysis. Energy Sustain. Dev. 2022, 69, 11–30. [Google Scholar] [CrossRef]
  30. Saquib, F.R.; Chakma, A.; Rahman, A.Y.; Sneha, F.H.; Shiblee, M.S.A.A.F.; Riad, M.R. A Case Study on the Cost-effectiveness of Net Energy Metering of Residential Grid-Connected Photovoltaic in the Context of Bangladesh. In Proceedings of the 2021 5th International Conference on Electrical Engineering and Information & Communication Technology (ICEEICT), IEEE, Dhaka, Bangladesh, 18–20 November 2021. [Google Scholar]
  31. Podder, A.K.; Das, A.K.; Hossain, E.; Kumar, N.M.; Roy, N.K.; Alhelou, H.H.; Karthick, A.; Al-Hinai, A. Integrated modeling and feasibility analysis of a rooftop photovoltaic systems for an academic building in Bangladesh. Int. J. Low-Carbon Technol. 2021, 16, 1317–1327. [Google Scholar] [CrossRef]
  32. Ali, M.F.M.; Abdullah, M. Feasibility Study of the Technical and Economic Performance of Grid-Connected PV System for Selected Rooftops in UTHM. J. Electron. Volt. Appl. 2021, 2, 45–56. [Google Scholar]
  33. Mansur, T.; Baharudin, N.; Ali, R. A comparative study for different sizing of solar PV system under net energy metering scheme at university buildings. Bull. Electr. Eng. Inform. 2018, 7, 450–457. [Google Scholar] [CrossRef]
  34. Agrawal, M.; Saxena, B.; Rao, K. Estimation of energy production and net metering of Grid connected rooftop photovoltaic system in Rajasthan. In Proceedings of the 2017 International Conference on Circuit, Power and Computing Technologies (ICCPCT), IEEE, Kollam, India, 20–21 April 2017. [Google Scholar]
  35. Tarigan, E. Simulation and feasibility studies of rooftop PV system for university campus buildings in Surabaya, Indonesia. Int. J. Renew. Energy Res. 2018, 8, 895–908. [Google Scholar]
  36. Zublie, M.F.M.; Hasanuzzaman, M.; Rahim, N. Feasibility Analysis of Solar Power Generation System for Office Building in Academic Institution. In IOP Conference Series: Materials Science and Engineering; IOP Publishing: Bristol, UK, 2021. [Google Scholar]
  37. Zublie, M.; Hasanuzzaman, M.; Rahim, N. Feasibility analysis of rooftop solar photovoltaic for non-academic building in an educational institution in Malaysia. In IOP Conference Series: Earth and Environmental Science; IOP Publishing: Bristol, UK, 2021. [Google Scholar]
  38. Suruhanjaya Tenaga. Guidelines for Solar Photovoltaic Installation Under the Programme of NEM Rakyat and NEM GoMEn in Peninsular Malaysia; Energy Commission: Putrajaya, Malaysia, 2021.
  39. Owusu, P.A.; Asumadu-Sarkodie, S. A review of renewable energy sources, sustainability issues and climate change mitigation. Cogent Eng. 2016, 3, 1167990. [Google Scholar] [CrossRef]
  40. Petinrin, J.; Shaaban, M. Renewable energy for continuous energy sustainability in Malaysia. Renew. Sustain. Energy Rev. 2015, 50, 967–981. [Google Scholar] [CrossRef]
  41. Distancesto. Coordinates Finder. 2021. Available online: https://www.distancesto.com/coordinates/my/politeknik-sultan-azlan-shah-latitude-longitude/history/373980,html (accessed on 19 June 2021).
  42. Kumar, P.G.; Vigneswaran, V.S.; Balaji, K.; Vinothkumar, S.; Prabakaran, R.; Sakthivadivel, D.; Meikandan, M.; Kim, S.C. Augmented v-corrugated absorber plate using shot-blasting for solar air heater–Energy, Exergy, Economic, and Environmental (4E) analysis. Process Saf. Environ. Prot. 2022, 165, 514–531. [Google Scholar] [CrossRef]
  43. Wahid, S.S.A.; Ramli, M.S.; Noorden, Z.A.; Hassan, K.K.; Azli, S.A. A review on highlights and feasibility studies on solar energy utilization in Malaysia. In Proceedings of the AIP Conference, St. Petersburg, Russia, 19–21 May 2017; AIP Publishing LLC: New York, NY, USA, 2017. [Google Scholar]
  44. Tsalikis, G.; Martinopoulos, G. Solar energy systems potential for nearly net zero energy residential buildings. Sol. Energy 2015, 115, 743–756. [Google Scholar] [CrossRef]
  45. Poongavanam, G.K.; Panchabikesan, K.; Leo, A.J.D.; Ramalingam, V. Experimental investigation on heat transfer augmentation of solar air heater using shot blasted V-corrugated absorber plate. Renew. Energy 2018, 127, 213–229. [Google Scholar] [CrossRef]
  46. GSPARX. Ushering in a Rooftop Solar Revolution. 2022. Available online: https://www.gsparx.com/NewsEvents/news_events_info/USHERING-IN-A-ROOFTOP-SOLAR-REVOLUTION (accessed on 25 January 2022).
  47. Busaña, M.A. Hybrid Solar Energy System as Alternative Power Supply in Mindanao State University-Sulu: Impact on Quality Services. Open Access Indones. J. Soc. Sci. 2021, 4, 486–500. [Google Scholar] [CrossRef]
  48. Husain, A.A.F.; Phesal, M.H.A.; Ab Kadir, M.Z.A.; Amirulddin, U.A.U. Techno-Economic Analysis of Commercial Size Grid-Connected Rooftop Solar PV Systems in Malaysia under the NEM 3.0 Scheme. Appl. Sci. 2021, 11, 10118. [Google Scholar] [CrossRef]
  49. Solarvest. Program NEM GoMEn. 2021. Available online: https://solarvest.my/2021/05/03/net-energy-metering-3-program/ (accessed on 9 March 2022).
  50. BERNAMA. KeTSA Introduces Three Initiatives to Encourage Use of Solar PV. 2020. Available online: https://www.mida.gov.my/mida-news/ketsa-introduces-three-initiatives-to-encourage-use-of-solar-pv/ (accessed on 28 November 2022).
  51. Shafie, S.M.; Hassan, M.G.; Sharif, K.I.M.; Numan, A.N.; Yusuf, N.N.A.N. An economic feasibility study on solar installation for university campus: A case of universiti Utara Malaysia. Int. J. Energy Econ. Policy 2022, 12, 54–60. [Google Scholar] [CrossRef]
  52. Suruhanjaya Tenaga. Malaysia Energy Statistics Handbook; Energy Commission: Putrajaya, Malaysia, 2017.
  53. GSPARX. Who We Are. 2022. Available online: https://www.gsparx.com/Pages/AboutUs#:~:text=(GSPARX)%20is%20a%20wholly%20owned,Nasional%20Berhad%20(TNB)%20Group (accessed on 27 November 2022).
  54. Shindell, D.; Ru, M.; Zhang, Y.; Seltzer, K.; Faluvegi, G.; Nazarenko, L.; Schmidt, G.A.; Parsons, L.; Challapalli, A.; Yang, L.; et al. Temporal and spatial distribution of health, labor, and crop benefits of climate change mitigation in the United States. Proc. Natl. Acad. Sci. USA 2021, 118, e2104061118. [Google Scholar] [CrossRef] [PubMed]
  55. Shah, A.U.M.; Safri, S.N.A.; Thevadas, R.; Noordin, N.K.; Abd Rahman, A.; Sekawi, Z.; Ideris, A.; Sultan, M.T.H. COVID-19 outbreak in Malaysia: Actions taken by the Malaysian government. Int. J. Infect. Dis. 2020, 97, 108–116. [Google Scholar] [CrossRef]
  56. Hashim, J.H.; Adman, M.A.; Hashim, Z.; Radi, M.F.M.; Kwan, S.C. COVID-19 Epidemic in Malaysia: Epidemic Progression, Challenges, and Response. Front. Public Health 2021, 9, 560592. [Google Scholar] [CrossRef] [PubMed]
  57. Aziz, N.A.; Othman, J.; Lugova, H.; Suleiman, A. Malaysia’s approach in handling COVID-19 onslaught: Report on the Movement Control Order (MCO) and targeted screening to reduce community infection rate and impact on public health and economy. J. Infect. Public Health 2020, 13, 1823–1829. [Google Scholar] [CrossRef]
  58. Tang, K.H.D. Movement control as an effective measure against Covid-19 spread in Malaysia: An overview. J. Public Health 2020, 30, 583–586. [Google Scholar] [CrossRef] [PubMed]
  59. Tunku Mansur, T.M.N.; Baharudin, N.H.; Ali, R.; Nizal Sharif, S. Impact of movement control order implementation on electricity consumption: A case study of university buildings. Int. J. Nonlinear Anal. Appl. 2022, 13, 673–684. [Google Scholar]
  60. Edomah, N.; Ndulue, G. Energy transition in a lockdown: An analysis of the impact of COVID-19 on changes in electricity demand in Lagos Nigeria. Glob. Transit. 2020, 2, 127–137. [Google Scholar] [CrossRef] [PubMed]
  61. Jiang, P.; Van Fan, Y.; Klemeš, J. Impacts of COVID-19 on energy demand and consumption: Challenges, lessons and emerging opportunities. Appl. Energy 2021, 285, 116441. [Google Scholar] [CrossRef]
  62. Tan, C.; Ong, M.; Nomanbhay, S.; Shamsuddin, A.; Show, P. The Influence of COVID-19 on Global CO2 Emissions and Climate Change: A Perspective from Malaysia. Sustainability 2021, 13, 8461. [Google Scholar] [CrossRef]
  63. Deyhimi, N.; Torkaman, H.; Shadaei, M.; Shabanirad, M.; Kermani, M. Comparative Multi-objective Investigation of Radial and Ring Distribution System in the Presence of DGs. In Proceedings of the 2021 IEEE International Conference on Environment and Electrical Engineering and 2021 IEEE Industrial and Commercial Power Systems Europe (EEEIC/I&CPS Europe), Bari, Italy, 7–10 September 2021. [Google Scholar]
  64. Patel, P.; Shah, A.; Velani, K. Voltage Stability Improvement in Ring Main Underground Distribution Network. In Proceedings of the 2019 IEEE 1st International Conference on Energy, Systems and Information Processing (ICESIP), IEEE, Chennai, India, 4–6 July 2019. [Google Scholar]
  65. TNB. Commercial Tariff. 2022. Available online: https://www.tnb.com.my/commercial-industrial/pricing-tariffs1 (accessed on 25 January 2022).
  66. MESTECC. The Net Energy Metering (NEM) Scheme. 2022. Available online: https://www.buysolar.my/resources/articles/236-the-net-energy-metering-nem-scheme (accessed on 25 January 2022).
  67. Vaka, M.; Walvekar, R.; Rasheed, A.K.; Khalid, M. A review on Malaysia’s solar energy pathway towards carbon-neutral Malaysia beyond Covid-19 pandemic. J. Clean. Prod. 2020, 273, 122834. [Google Scholar] [CrossRef]
  68. TNB-NEM. Net Energy Meter. 2022. Available online: https://www.mytnb.com.my/renewable-energy/net-energy-metering (accessed on 25 January 2022).
  69. KeTSA. Program Net Energy Metering 3.0 (NEM 3.0) Tawar Kuota Solar 500MW untuk 3 Inisiatif Baharu; Ministry of Energy and Natural Resources: Putrajaya, Malaysia, 2020.
  70. Rajendran, P.; Smith, H. Modelling of solar irradiance and daylight duration for solar-powered UAV sizing. Energy Explor. Exploit. 2016, 34, 235–243. [Google Scholar] [CrossRef] [Green Version]
  71. Shavalipour, A.; HakemZadeh, M.H.; Sopian, K.; Haris, S.M.; Zaidi, S.H. New formulation for the estimation of monthly average daily solar irradiation for the tropics: A case study of Peninsular Malaysia. Int. J. Photoenergy 2013, 2013, 174671. [Google Scholar] [CrossRef]
  72. Pitech. 4 Types of Solar System in Malaysia That Actually Work. 2020. Available online: https://pitech.com.my/types-of-solar-system-in-malaysia/ (accessed on 15 November 2021).
  73. TNBX. 3 Easy Steps to Estimate Solar Size. 2020. Available online: https://www.tnbx.com.my/post/3-easy-steps-to-estimate-solar-size (accessed on 30 November 2021).
  74. de Brito, M.A.G.; Alves, M.; Canesin, C. Hybrid MPPT Solution for Double-Stage Photovoltaic Inverter. J. Control Autom. Electr. Syst. 2019, 30, 253–265. [Google Scholar] [CrossRef]
  75. Suruhanjaya Tenaga. Electricity Tariff Review in Peninsular Malaysia for Regulatory Period 2 (RP2: 2018–2020) under Incentive-Based Regulation (IBR) Mechanism; Energy Commission: Putrajaya, Malaysia, 2018.
  76. ClimateChangeConnection. CO2 Equivalents. 2022. Available online: https://climatechangeconnection.org/emissions/co2-equivalents/ (accessed on 17 January 2022).
  77. JPNK. Pengurusan Hutan. 2022. Available online: http://www.kedforestry.gov.my/ms/pengurusan-hutan-2.html (accessed on 4 September 2022).
Figure 1. The current distribution system layout based on a ring-type connection.
Energies 16 00723 g001
Figure 2. Proposed new layout of a modified based on a ring type connection.
Energies 16 00723 g002
Figure 3. Historical energy analysis of PSAS for three years (2019–2021).
Energies 16 00723 g003
Table 1. Comparison of differences between NEM schemes in Malaysia.
NEM
Version
Year OfferedQuota
Allocation
Advantages Disadvantages
NEM 1.02016–2018500 MW
  • Beneficial for low-load consumption [27]
  • Failed to meet its growth target due to less response from electricity customers in Malaysia [25,27]
  • The scheme did not offer attractive financial returns or help return investment results [23,25]
  • Does not provide savings to small users [25]
NEM 2.02019–2020500 MW
  • Offers better cost savings in most cases compared with NEM 1.0 [25]
  • Only large users and some medium users achieve significant cost savings
  • Does not provide savings to small users [25]
  • Only applies to users in Peninsular Malaysia who are registered with TNB only [27]
NEM 3.02021–2023800 MW
  • The consumer is encouraged to fully utilise PV production [27]
  • Introduces three new categories under NEM 3.0
  • Now in the implementation phase; the implementation period has not yet ended. Therefore, the scheme’s shortcomings are not yet suitable to be evaluated
Table 2. PSAS Utility bill data for three years (2019–2021).
201920202021
MonthEnergy ConsumptionMaximum DemandEnergy ConsumptionMaximum DemandEnergy ConsumptionMaximum Demand
(kWh) (kW) (kWh) (kW) (kWh) (kW)
January412,1091710362,4781540270,8251180
February327,2931537361,7571554245,5531074
March396,6521523265,3641541310,2391243
April409,313158189,752181259,835871
May 274,3231133149,894875199,679909
Jun 238,0181253229,2801018141,696389
July402,7461606207,737987168,385842
August360,3501524337,1011487227,8911033
September412,7741717341,5401449259,8361101
October405,4101626265,7821149276,1271279
November278,1211240278,5001116284,6851249
December314,3031408278,5981090331,9691273
Total4,231,41217,8583,167,78313,9872,976,72012,443
Average352,6181488263,9821166248,0601037
Table 3. Emission factor per unit of energy used for various types of fuels [7].
Fuels Emission Factors (kg/kWh)
CO2SO2CO
Hydro000
Coal1.180.01390.002
Petroleum0.850.01640.002
Natural gas0.530.00050.005
Table 4. Main components’ capacity in proposed rooftop solar PV systems.
Percentage of Solar Generation for PSAS Use (%)Solar Capacity (kW)Load of the Inverter (kW)No. of Solar Panels (Units)No. of Inverters (Units)
20688343693
Table 5. Summary of zero capital expenditure saving for SARE between PSAS and TNB.
YearSolar
Generation (kWh/Year)
TNB Tariff
(RM/kWh)
Solar Tariff
(RM/kWh)
Energy Cost
Using TNB
Tariff (RM)
Energy Cost
Using solar
Tariffs, including Operation and Maintenance Costs (RM)
Operation and Maintenance Cost (RM)Net
Saving per Year (RM)
Accumulated Net Saving (RM)
1990,7200.3650.31361,613307,123054,49054,490
2985,7660.3650.31359,805305,588054,217108,707
3980,8380.3650.31358,006304,060053,946162,653
4975,9330.3980.31388,275302,539085,736248,389
5971,0540.3980.31386,334301,027085,307333,696
6966,1980.3980.31384,402299,522084,881418,576
7961,3670.4340.31416,903298,0240118,879537,456
8956,5610.4340.31414,819296,5340118,285655,740
9951,7780.4340.31412,745295,0510117,694773,434
10947,0190.4730.31447,642293,5760154,066927,500
11942,2840.4730.31445,404292,1080153,2961,080,796
12937,5720.4730.31443,177290,6470152,5301,233,326
13932,8850.5150.31480,648289,1940191,4531,424,779
14928,2200.5150.31478,244287,7480190,4961,615,275
15923,5790.5150.31475,853286,3090189,5441,804,819
16918,9610.5620.31516,086284,8780231,2092,036,027
17914,3660.5620.31513,506283,4540230,0532,266,080
18909,7940.5620.31510,939282,0360228,9022,494,982
19905,2460.6120.31554,138280,6260273,5122,768,494
20900,7190.6120.31551,368279,2230272,1453,040,639
21896,2160.6120.00548,611055,000493,6113,534,250
Total19,797,077 9,448,5175,859,267 3,534,250
Table 6. Carbon emission reduction for PSAS after joint the NEM GoMEn program.
YearSolar Generation (kWh/Year)Emission Reduction (kg)
CO2SO2CO
1990,720728,62561333005
2985,766724,98261022990
3980,838721,35760722975
4975,933717,75060422960
5971,054714,16160112945
6966,198710,59159812930
7961,367707,03859512916
8956,561703,50359222901
9951,778699,98558922887
10947,019696,48558632872
11942,284693,00358332858
12937,572689,53858042844
13932,885686,09057752829
14928,220682,65957462815
15923,579679,24657182801
16918,961675,85056892787
17914,366672,47156602773
18909,794669,10856322759
19905,246665,76356042746
20900,719662,43455762732
21896,216659,12255482718
Total19,797,07714,559,760122,55660,045
Disclaimer/Publisher’s Note: The statements, opinions and data contained in all publications are solely those of the individual author(s) and contributor(s) and not of MDPI and/or the editor(s). MDPI and/or the editor(s) disclaim responsibility for any injury to people or property resulting from any ideas, methods, instructions or products referred to in the content.

