
High-Sensitivity Detection Method for Metal Foreign Objects Based on Frequency Optimization in Wireless Electric Vehicles Charging


Abstract
:1. Introduction
- (i)
- The excitation frequency of the previous research is always set as about 1 MHz [21,22,23,24]. The detailed reasons have not been analyzed in-depth, so it is uncertain whether 1 MHz is the optimal frequency to achieve the optimal detect effect or not. The impact of the excitation frequency on detection sensitivity is unclear.
- (ii)
- For a given foreign object, how to determine the excitation frequency that realizes the optimal detection results for detection coils with different self-inductances is worth studying.
- (iii)
- For the existing methods, the detection sensitivity within the edge area of the detection coil needs to be improved to eliminate the blind area.
2. System Analysis
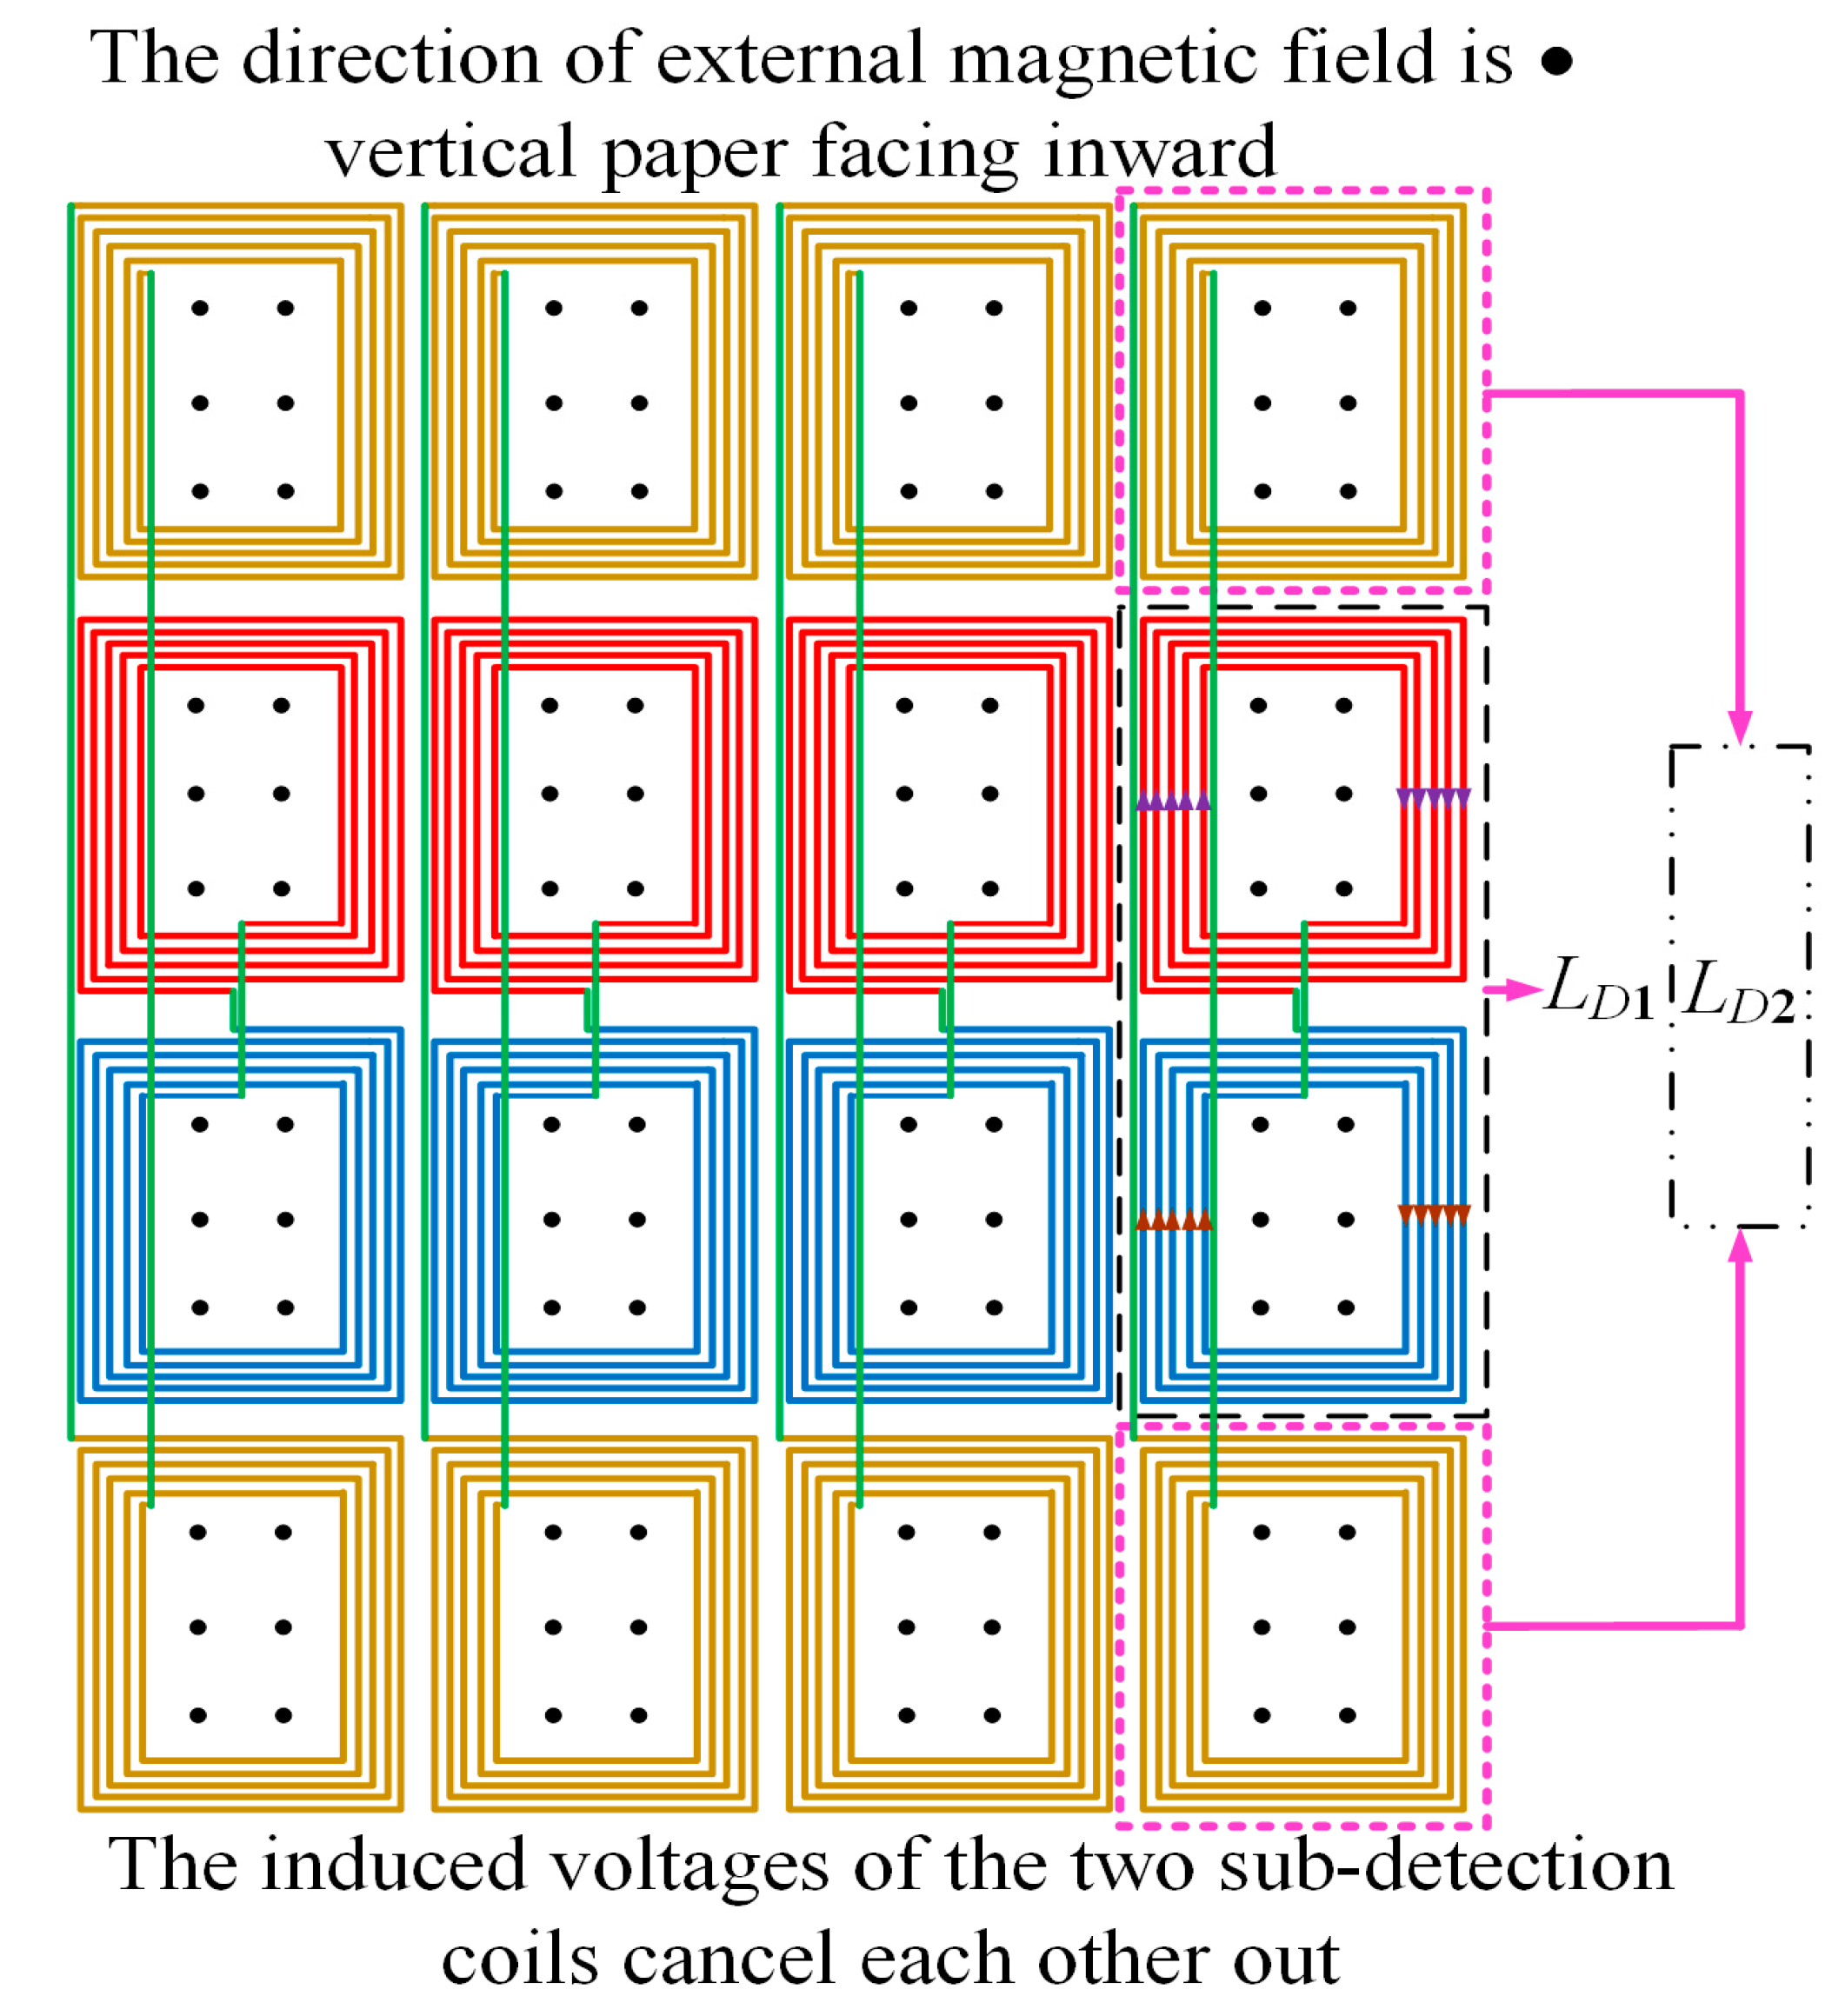
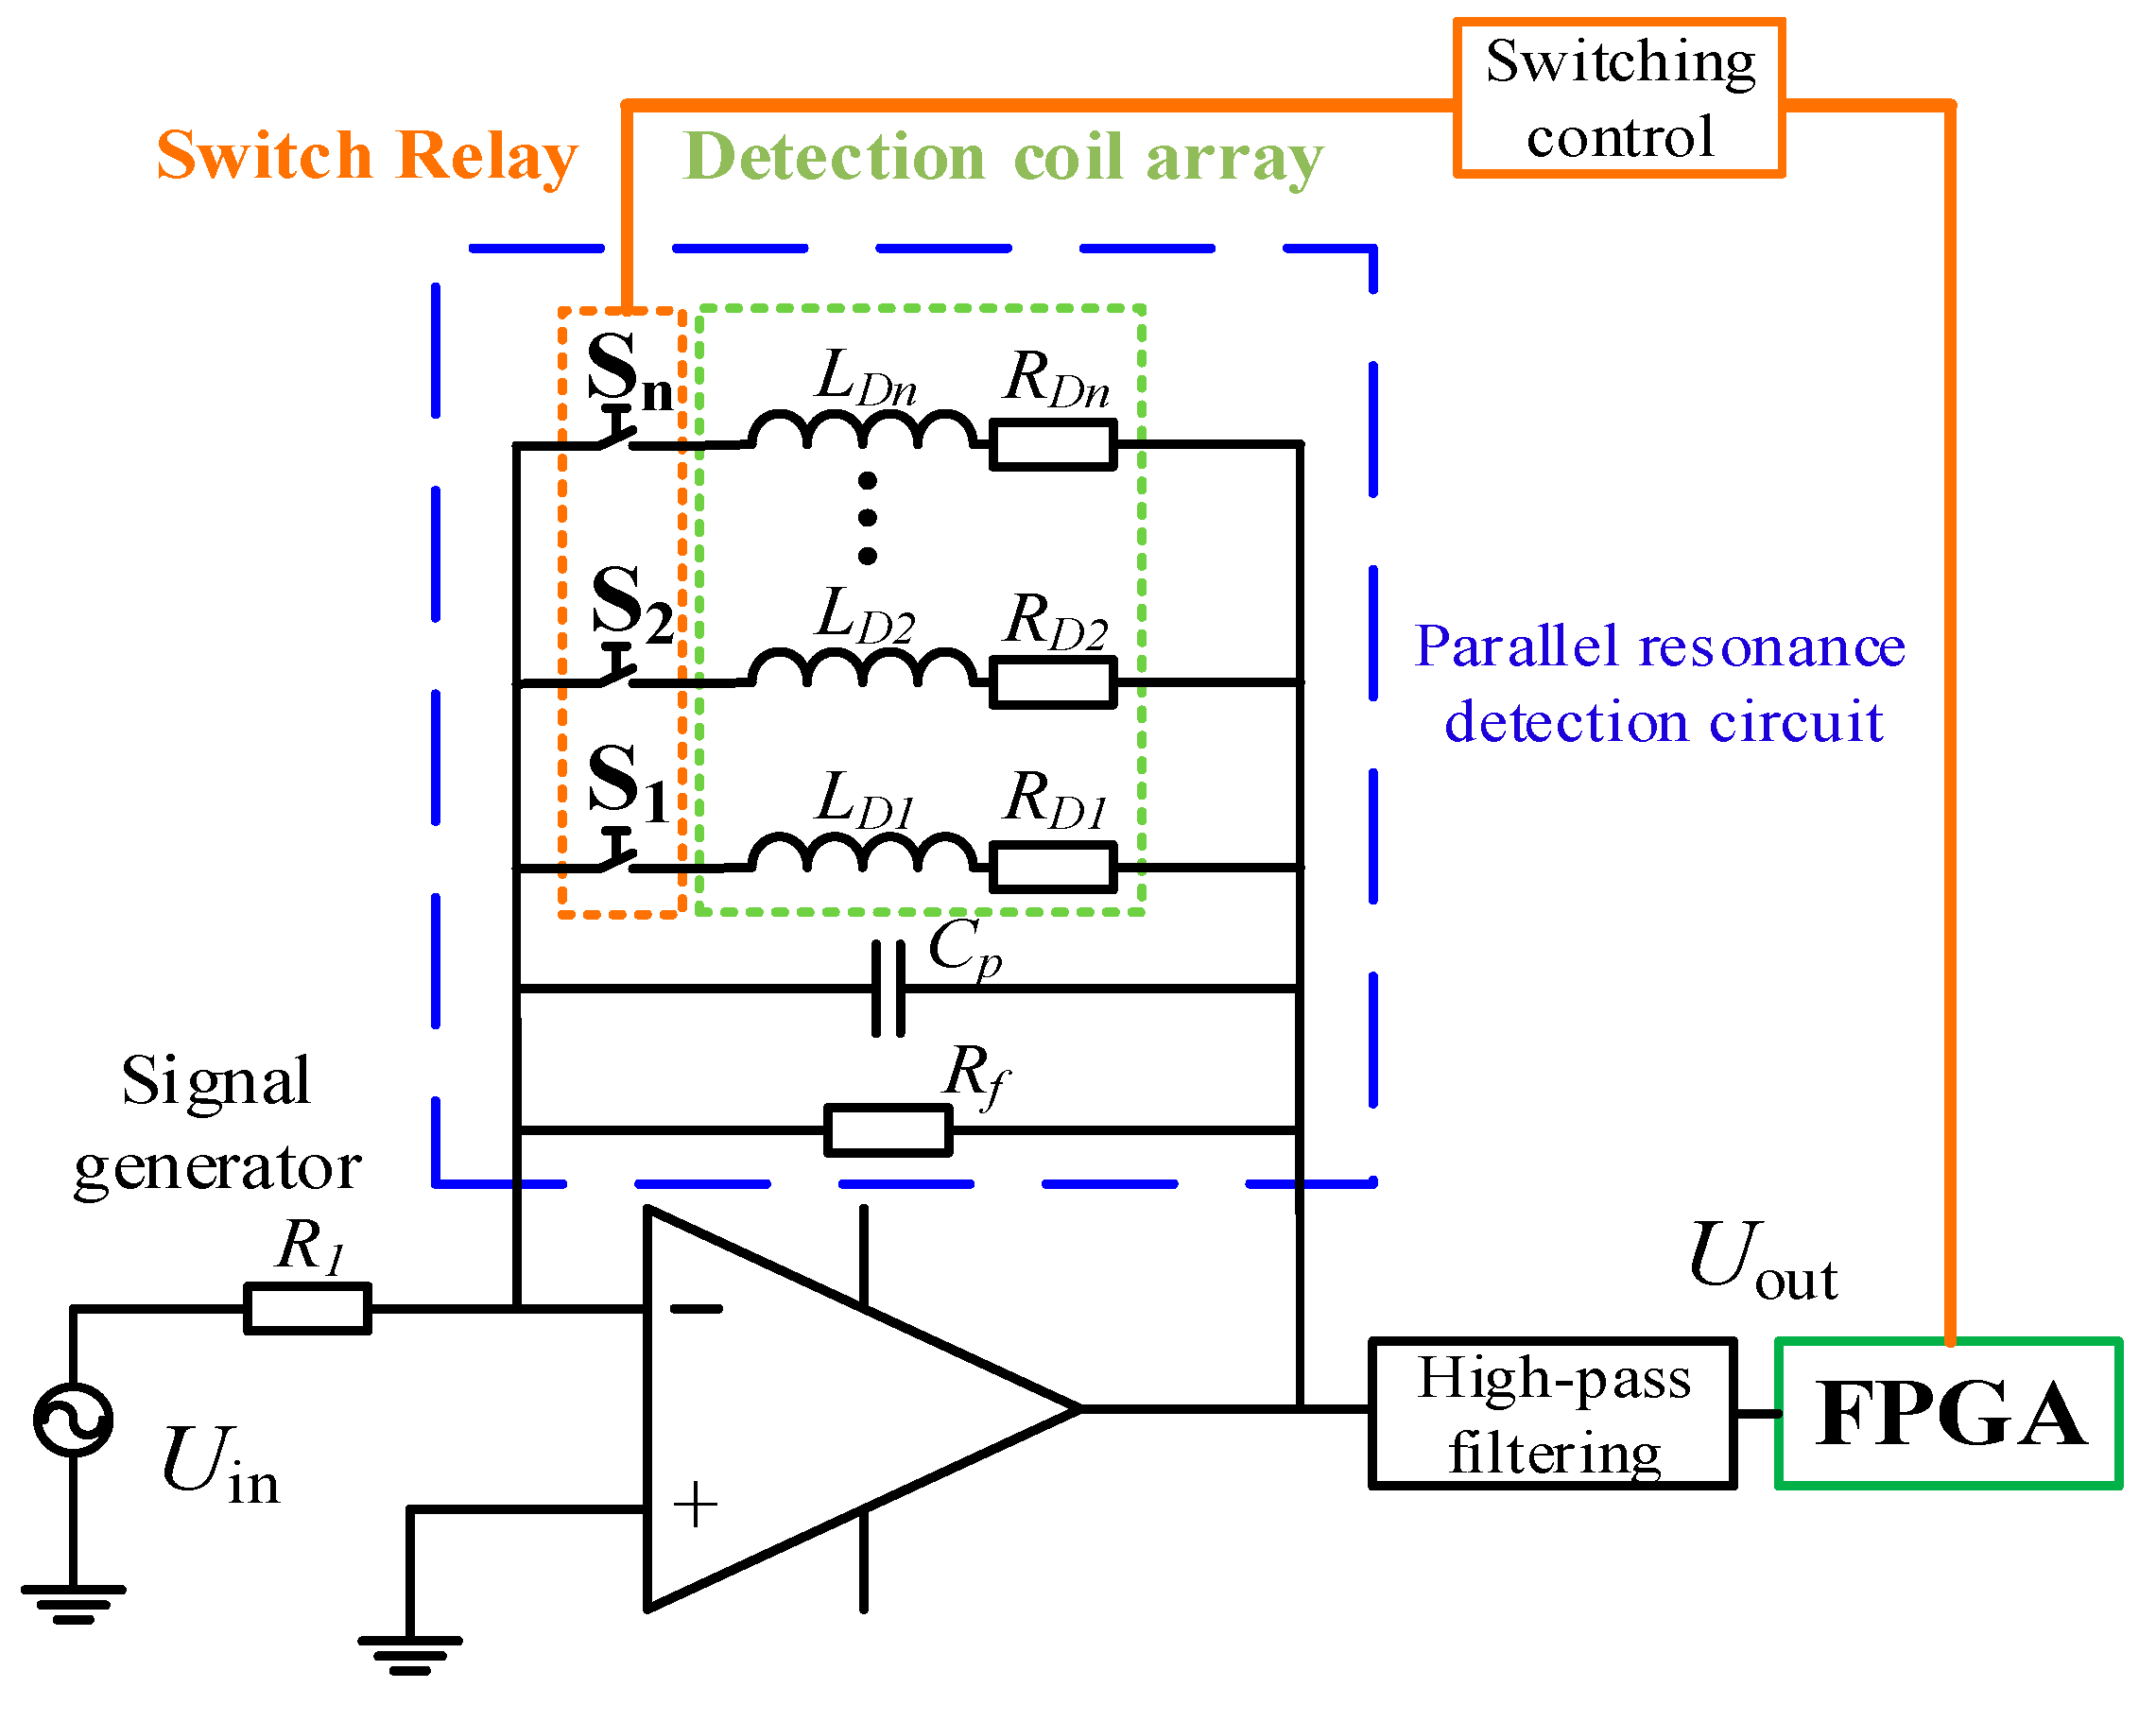
2.1. Detection Principle Analysis
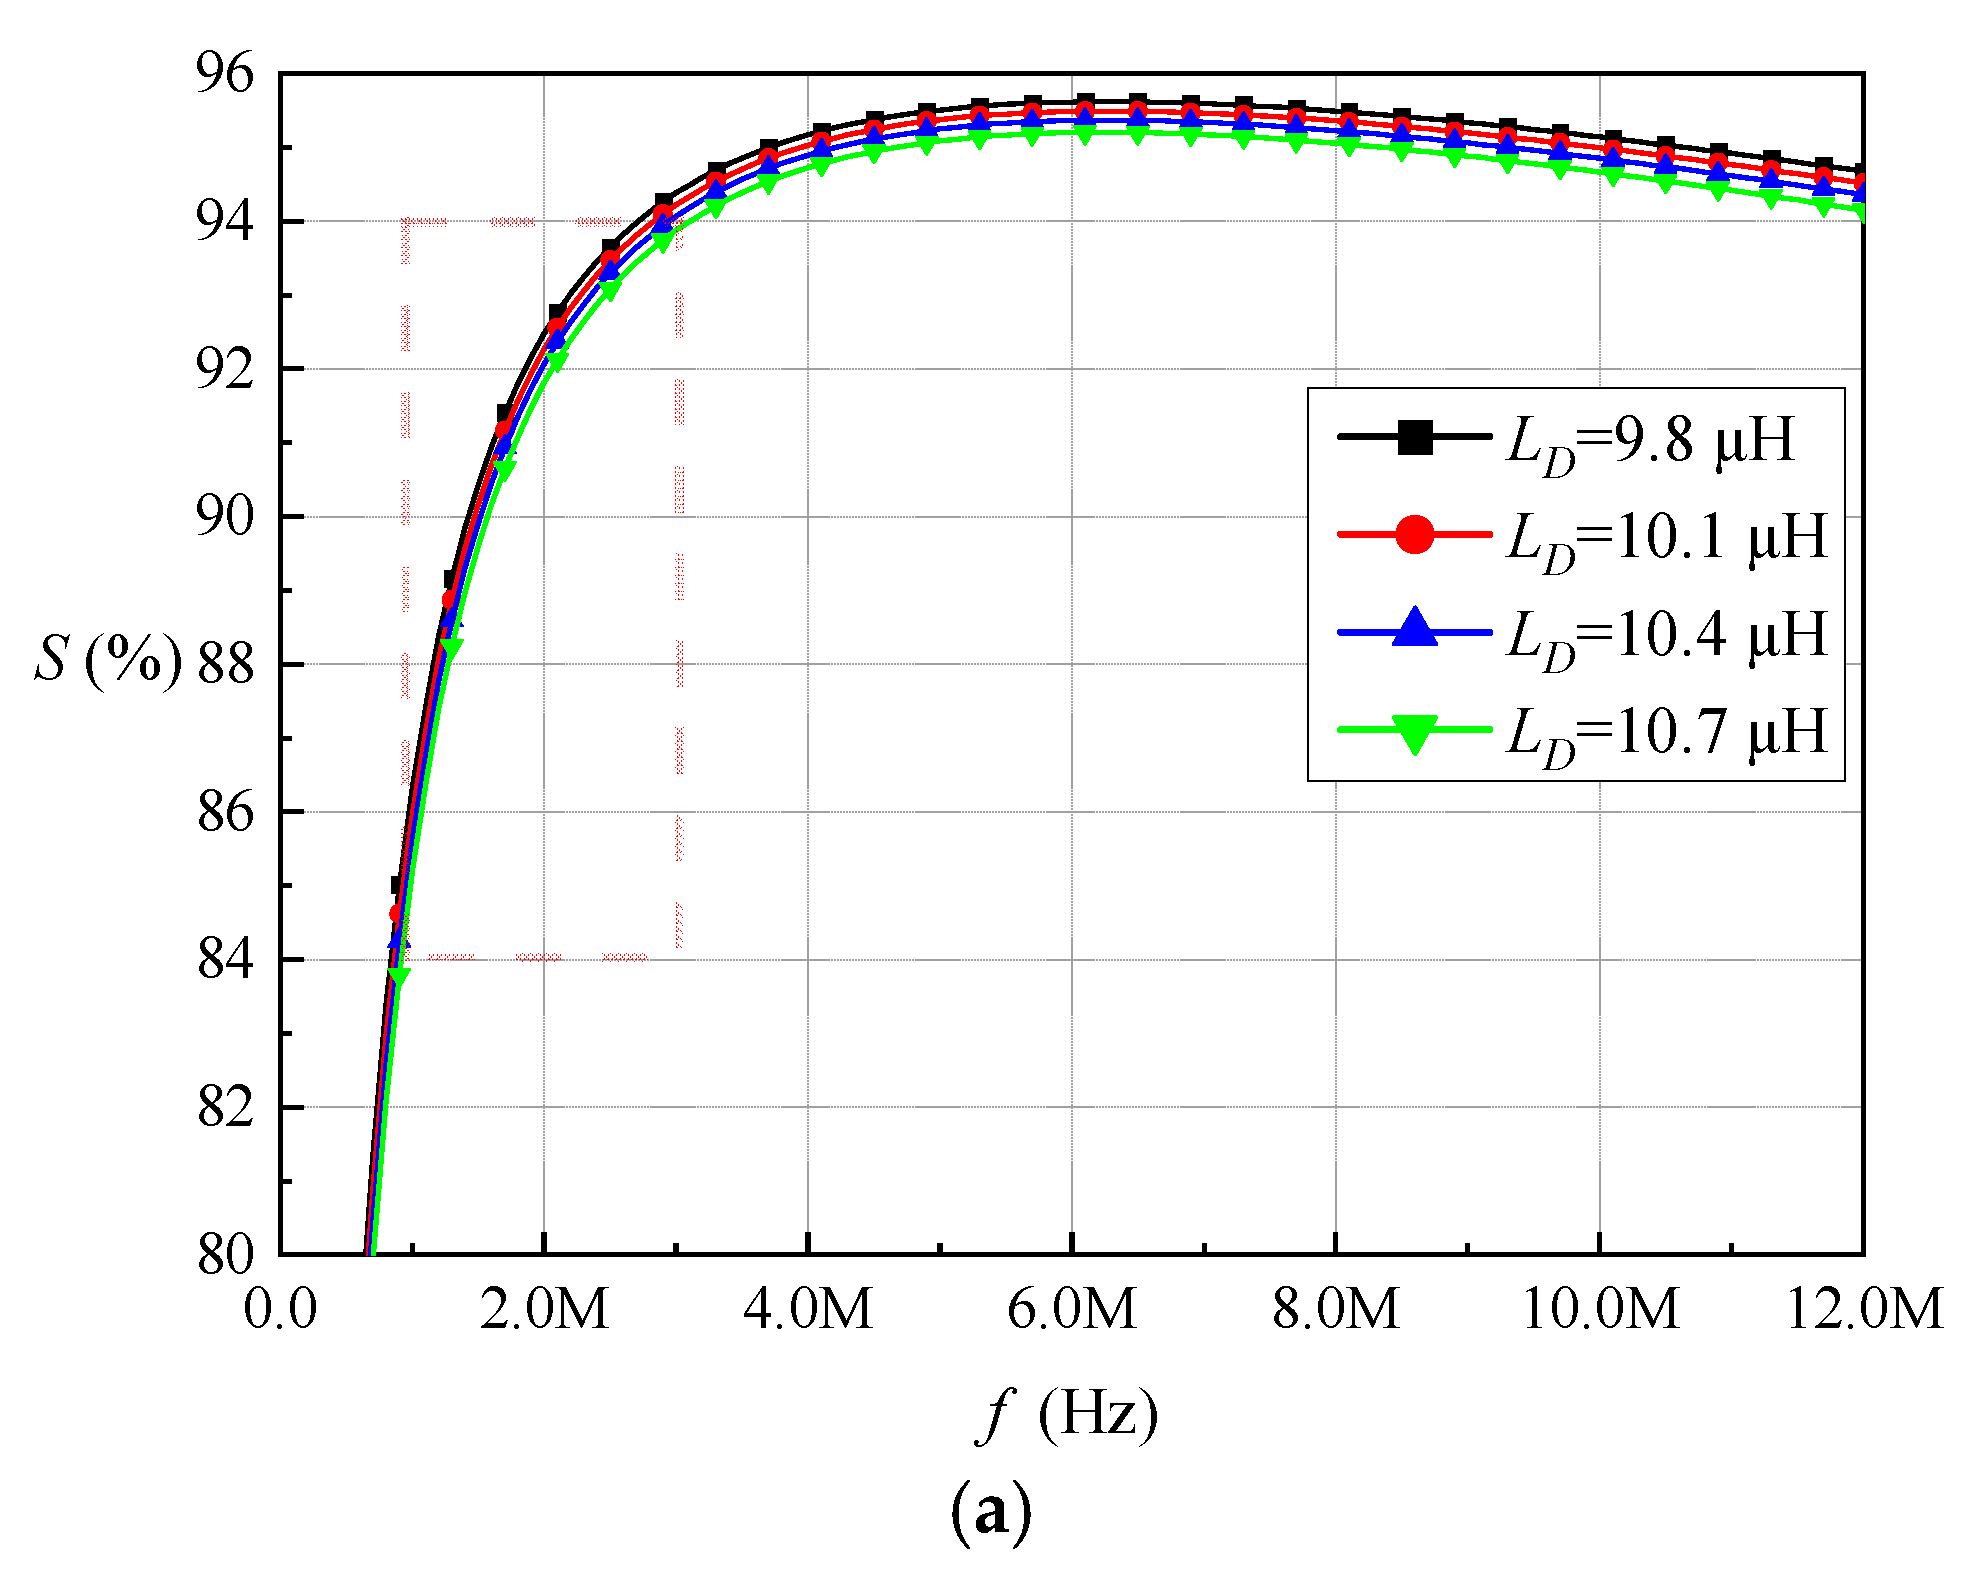
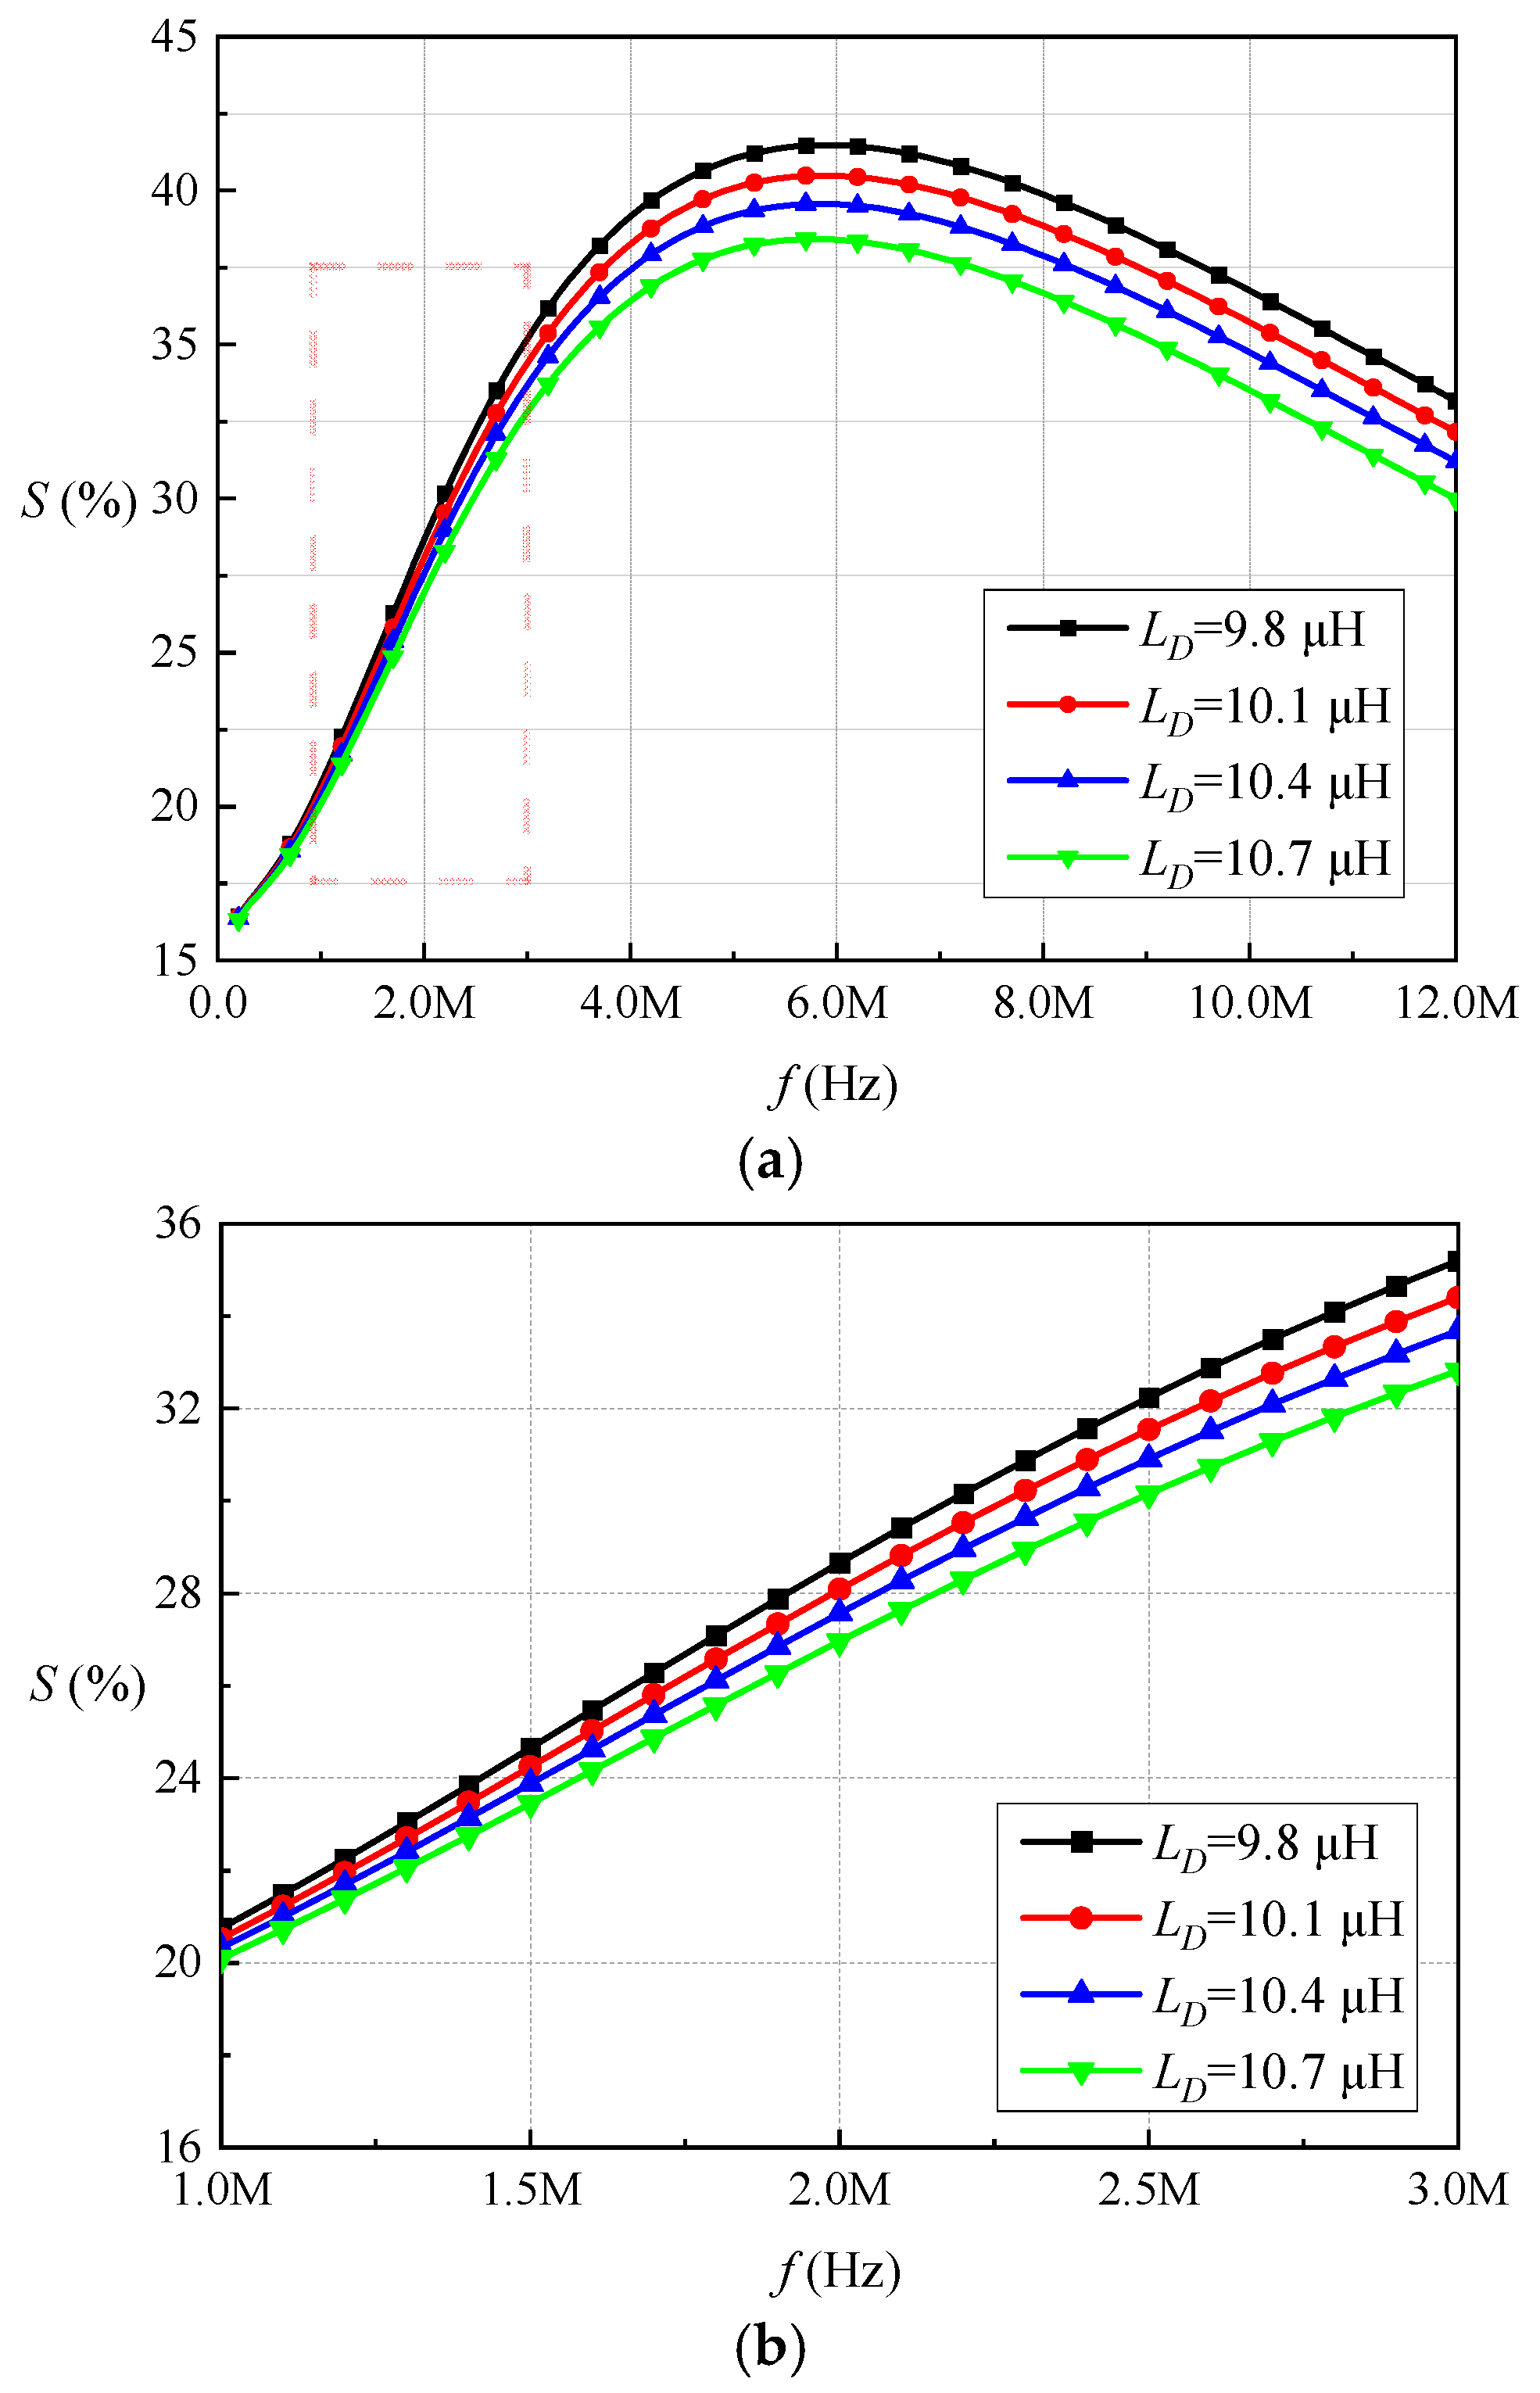
2.2. Frequency Characteristics of Detection Sensitivity
- The detection coil with different self-inductance values will have an optimal excitation frequency to maximize the detection sensitivity.
- The optimal excitation frequency of the detection coil with a high self-inductance value is lower than that of the detection coil with a low self-inductance value.
- At the same excitation frequency, the S of the detection coil with high self-inductance value is lower than that of the detection coil with a low self-inductance value. Although, the optimal excitation frequency of the detection coil with a high self-inductance value is lower.
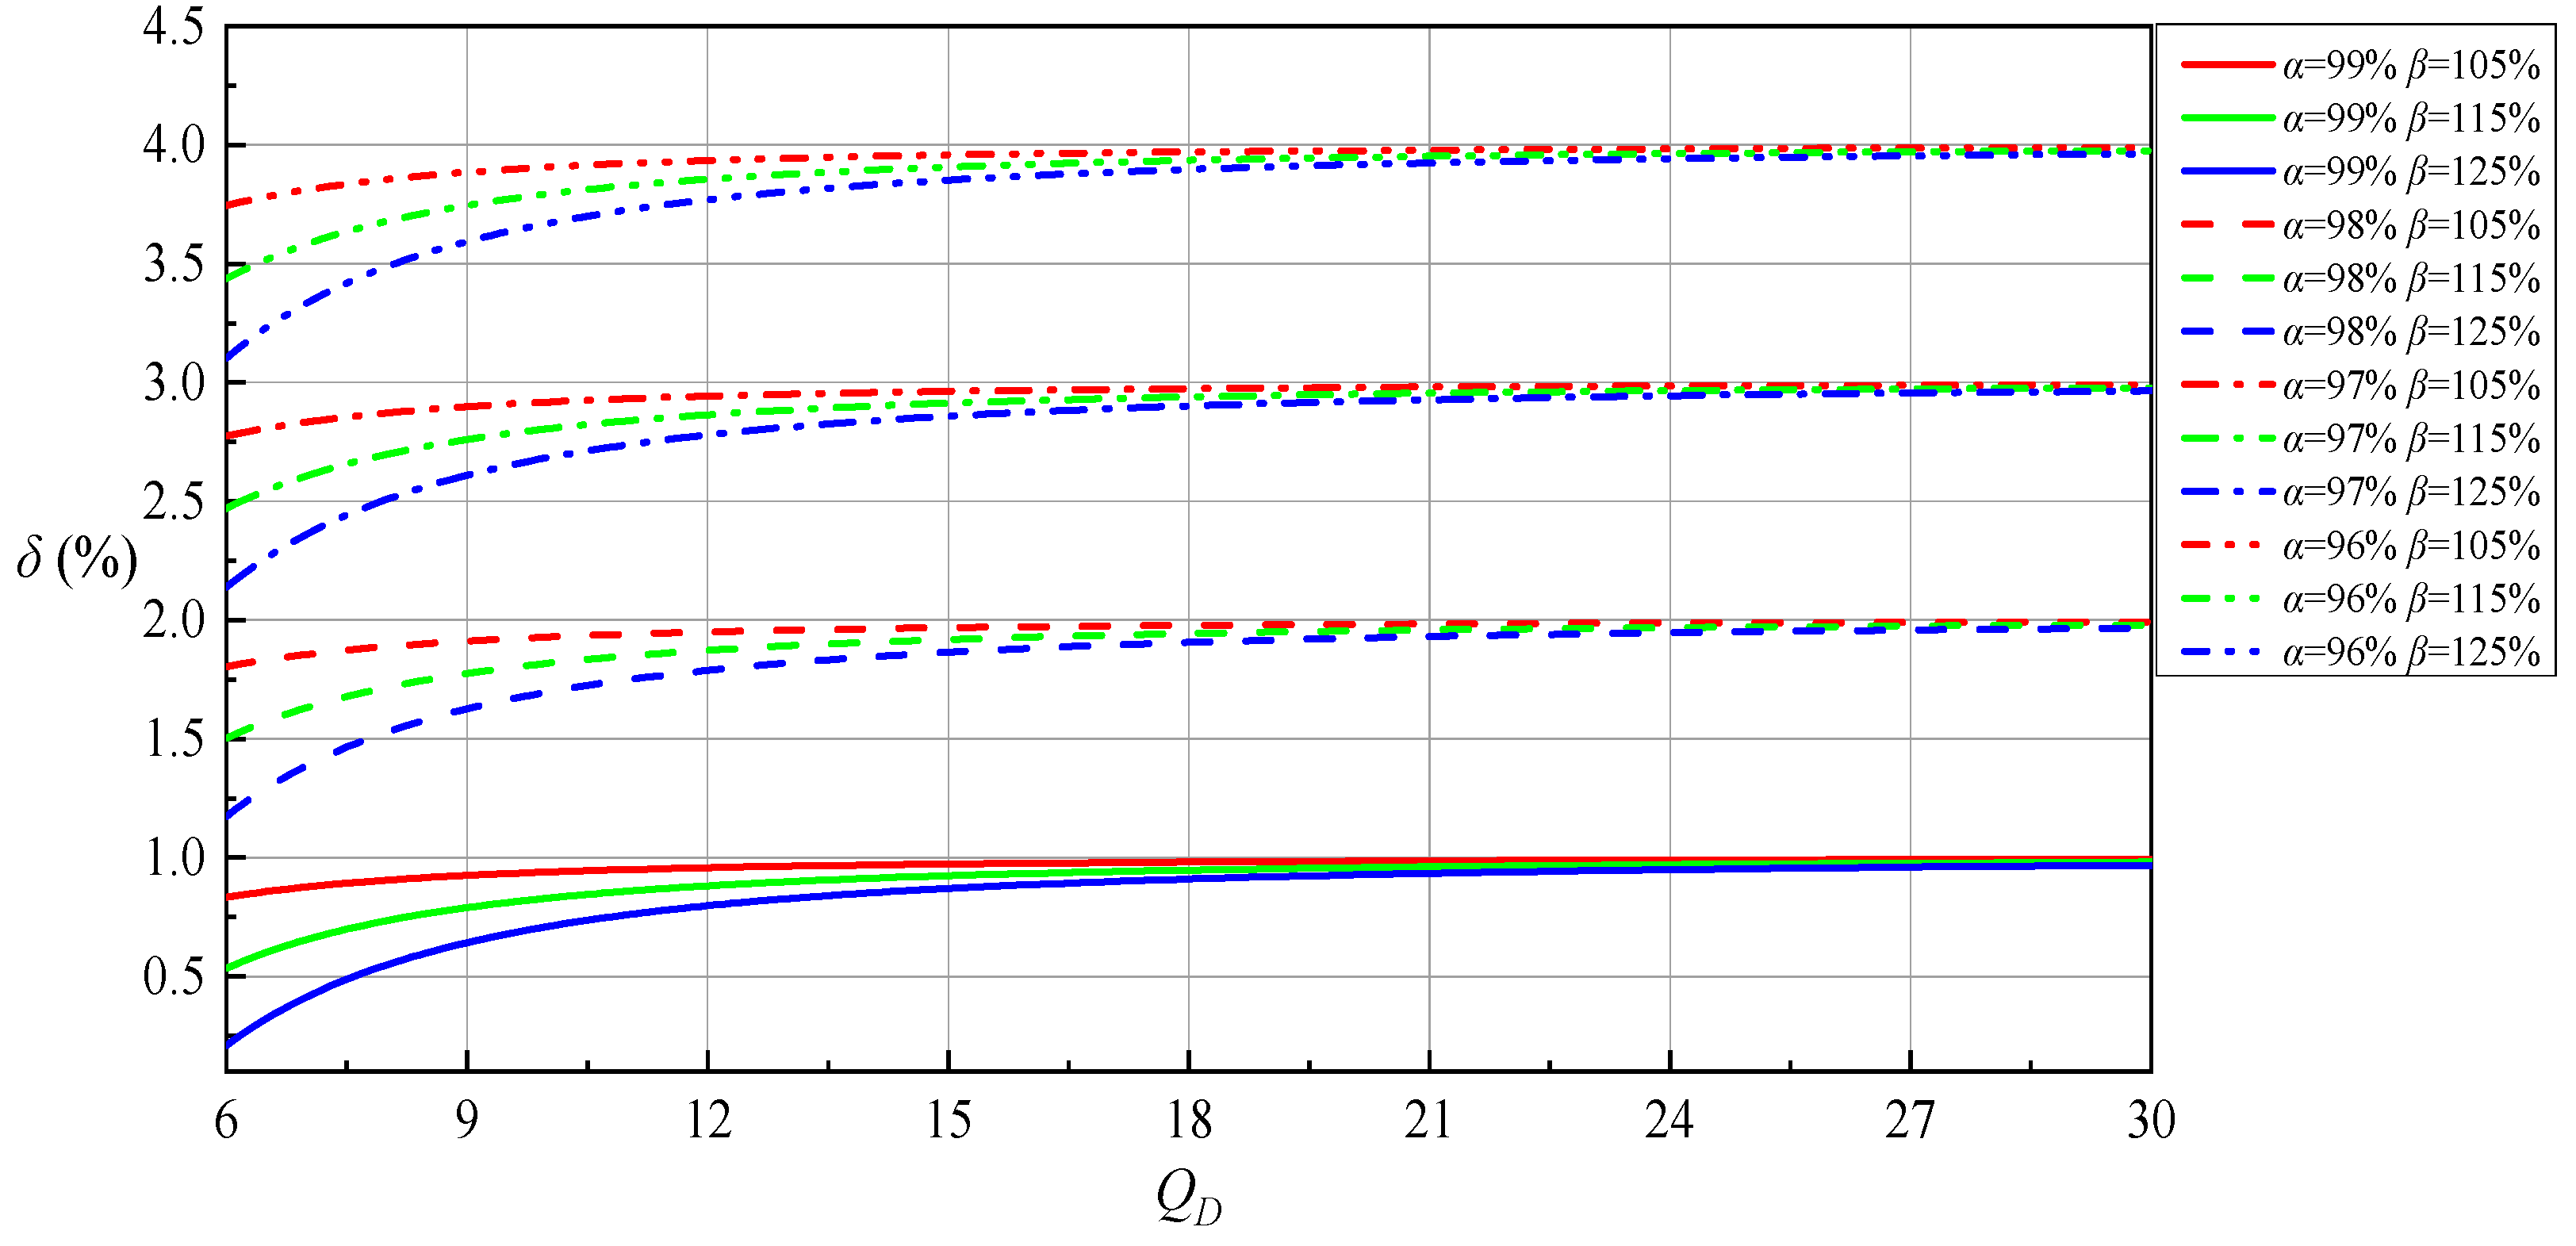
- As α reduces and β increases, which represents the foreign object approaching the center area, the detection sensitivity S will increase accordingly tending to 100%.
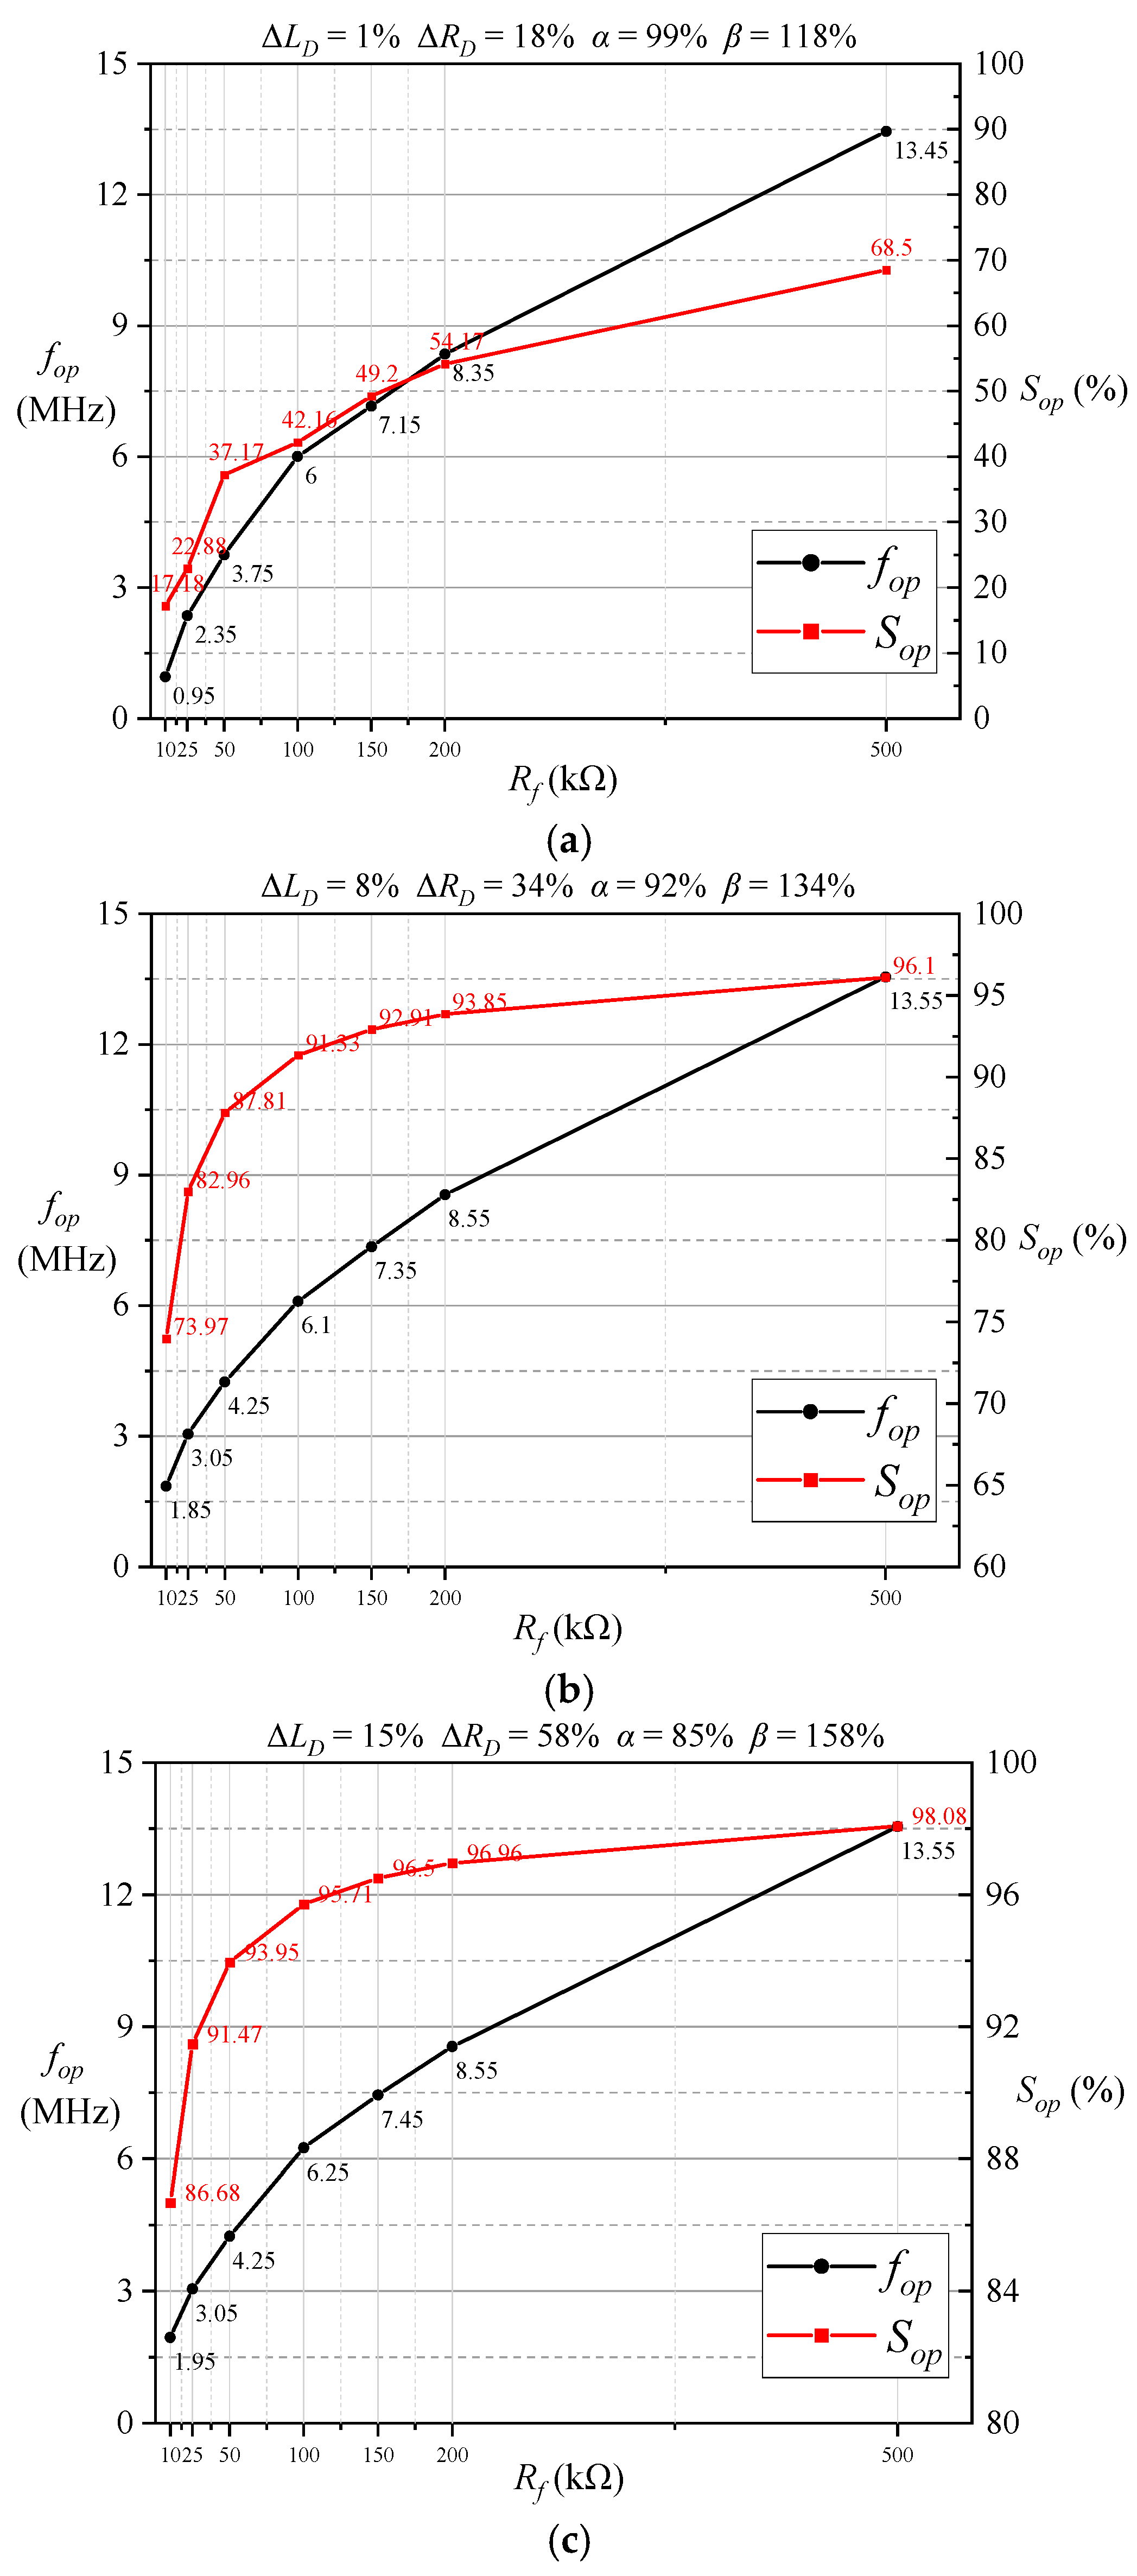
- At the same α and β, with the Rf increasing, the fop and Sop will both increase.
- With the Rf increasing, the fop under different combinations of α and β are gradually identical. In other words, when the Rf is big enough, the large change scale or the large range combination of α and β will not affect fop basically.
3. Detection Coil Design and Excitation Frequency Selection
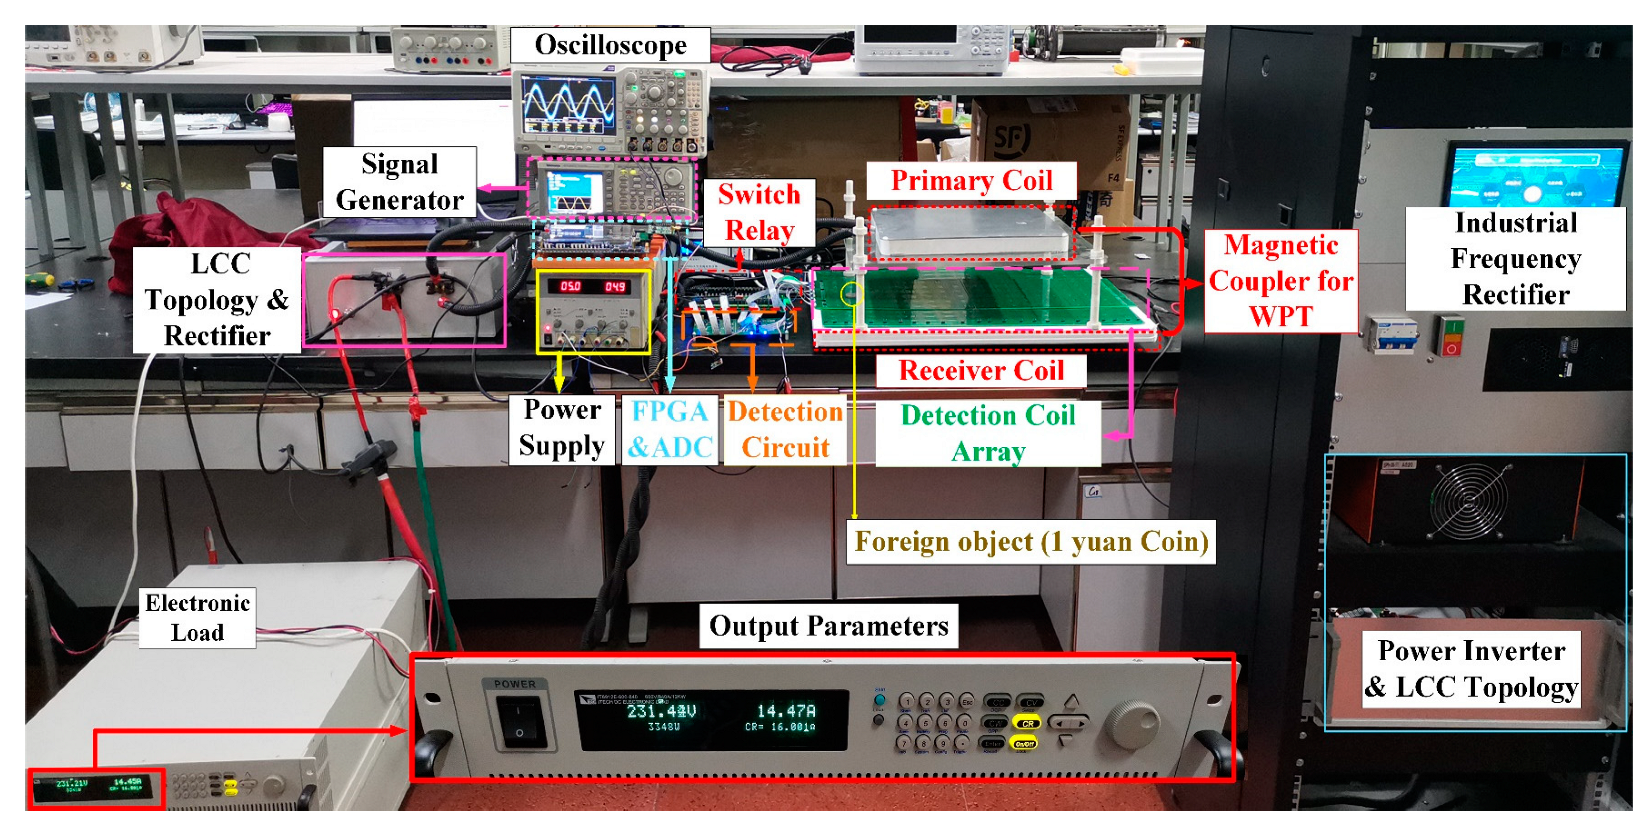
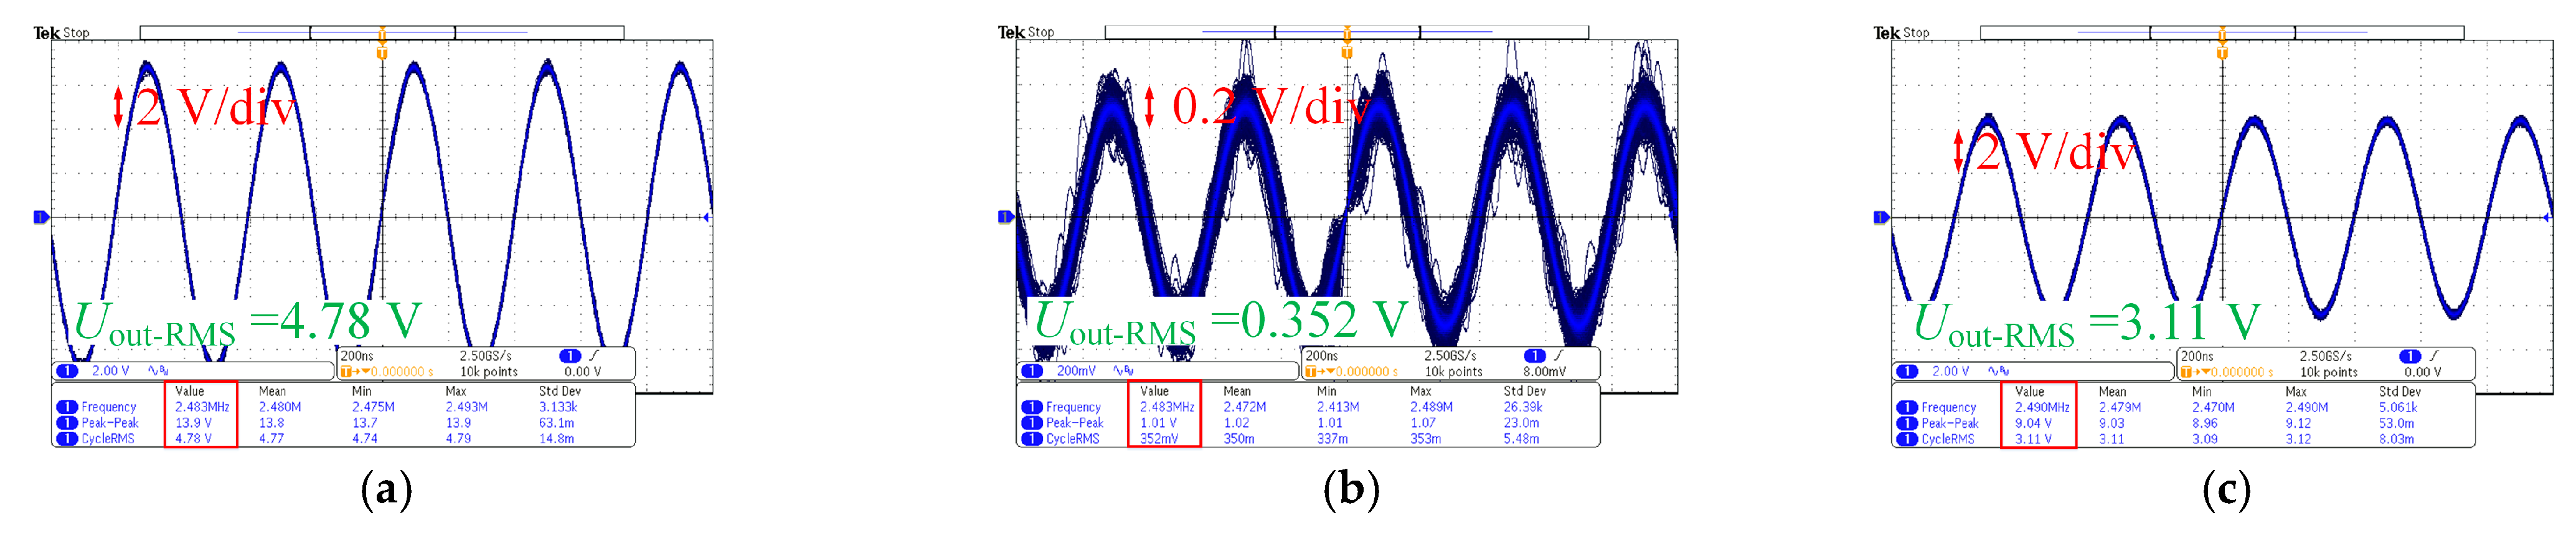
4. Experimental Verification
5. Conclusions
Author Contributions
Funding
Data Availability Statement
Conflicts of Interest
References
- Li, Z.; Song, K.; Jiang, J.; Zhu, C. Constant Current Charging and Maximum Efficiency Tracking Control Scheme for Supercapacitor Wireless Charging. IEEE Trans. Power Electron. 2018, 33, 9088–9100. [Google Scholar] [CrossRef]
- Li, Z.; Zhu, C.; Jiang, J.; Song, K.; Wei, G. A 3-kW Wireless Power Transfer System for Sightseeing Car Supercapacitor Charge. IEEE Trans. Power Electron. 2017, 32, 3301–3316. [Google Scholar] [CrossRef]
- Zucca, M.; Squillari, P.; Pogliano, U. A Measurement System for the Characterization of Wireless Charging Stations for Electric Vehicles. IEEE Trans. Instrum. Meas. 2021, 70, 9001710. [Google Scholar] [CrossRef]
- Teeneti, C.R.; Truscott, T.T.; Beal, D.N.; Pantic, Z. Review of Wireless Charging Systems for Autonomous Underwater Vehicles. IEEE J. Ocean. Eng. 2021, 46, 68–87. [Google Scholar] [CrossRef]
- Cai, C.; Wu, S.; Zhang, Z.; Jiang, L.; Yang, S. Development of a Fit-to-Surface and Lightweight Magnetic Coupler for Autonomous Underwater Vehicle Wireless Charging Systems. IEEE Trans. Power Electron. 2021, 36, 9927–9940. [Google Scholar] [CrossRef]
- Wang, D.; Cui, S.; Zhang, J.; Bie, Z.; Song, K.; Zhu, C. A Novel Arc-Shaped Lightweight Magnetic Coupler for AUV Wireless Power Transfer. IEEE Trans. Ind. Appl. 2022, 58, 1315–1329. [Google Scholar] [CrossRef]
- Yan, Z.; Song, B.; Zhang, Y.; Zhang, K.; Mao, Z.; Hu, Y. A Rotation-Free Wireless Power Transfer System with Stable Output Power and Efficiency for Autonomous Underwater Vehicles. IEEE Trans. Power Electron. 2019, 34, 4005–4008. [Google Scholar] [CrossRef]
- Tang, S.C.; Lun TL, T.; Guo, Z.; Kwok, K.W.; McDannold, N.J. Intermediate Range Wireless Power Transfer with Segmented Coil Transmitters for Implantable Heart Pumps. IEEE Trans. Power Electron. 2017, 32, 3844–3857. [Google Scholar] [CrossRef]
- Liu, C.; Jiang, C.; Song, J.; Chau, K.T. An Effective Sandwiched Wireless Power Transfer System for Charging Implantable Cardiac Pacemaker. IEEE Trans. Ind. Electron. 2019, 66, 4108–4117. [Google Scholar] [CrossRef]
- Available online: http://standards.sae.org/J2954_201904 (accessed on 30 July 2020).
- IEC 61980-3 ED1; IEC TC 69: Electric Road Vehicles and Electric Indust-Rial Trucks. IEC: Geneva, Switzerland, 2022.
- Available online: https://www.icnirp.org/en/publications/article/icnirp-publications-1992-2004.html (accessed on 24 March 2020).
- Hall, K.L.; Kesler, M.P.; Fiorello, R.; Schatz, D.A.; Kulikowski, K.J.; Soljacic, M. Vehicle Charger Safety System and Method. U.S. patent Appl.14/087,512, 27 March 2014. [Google Scholar]
- Briz, A.G.; Gilbert, A.M.; Ombach, G. Methods and Systems for Object Detection and Sensing for Wireless Charging Systems. U.S. patent Appl.14/307,285, 15 August 2017. [Google Scholar]
- Widmer, H.; Sieber, L.; Daetwyler, A.; Bittner, M. Systems, Methods, and Apparatus for Radar-Based Detection of Objects in A Predetermined Space. U.S. patent Appl.14/335,296, 26 September 2017. [Google Scholar]
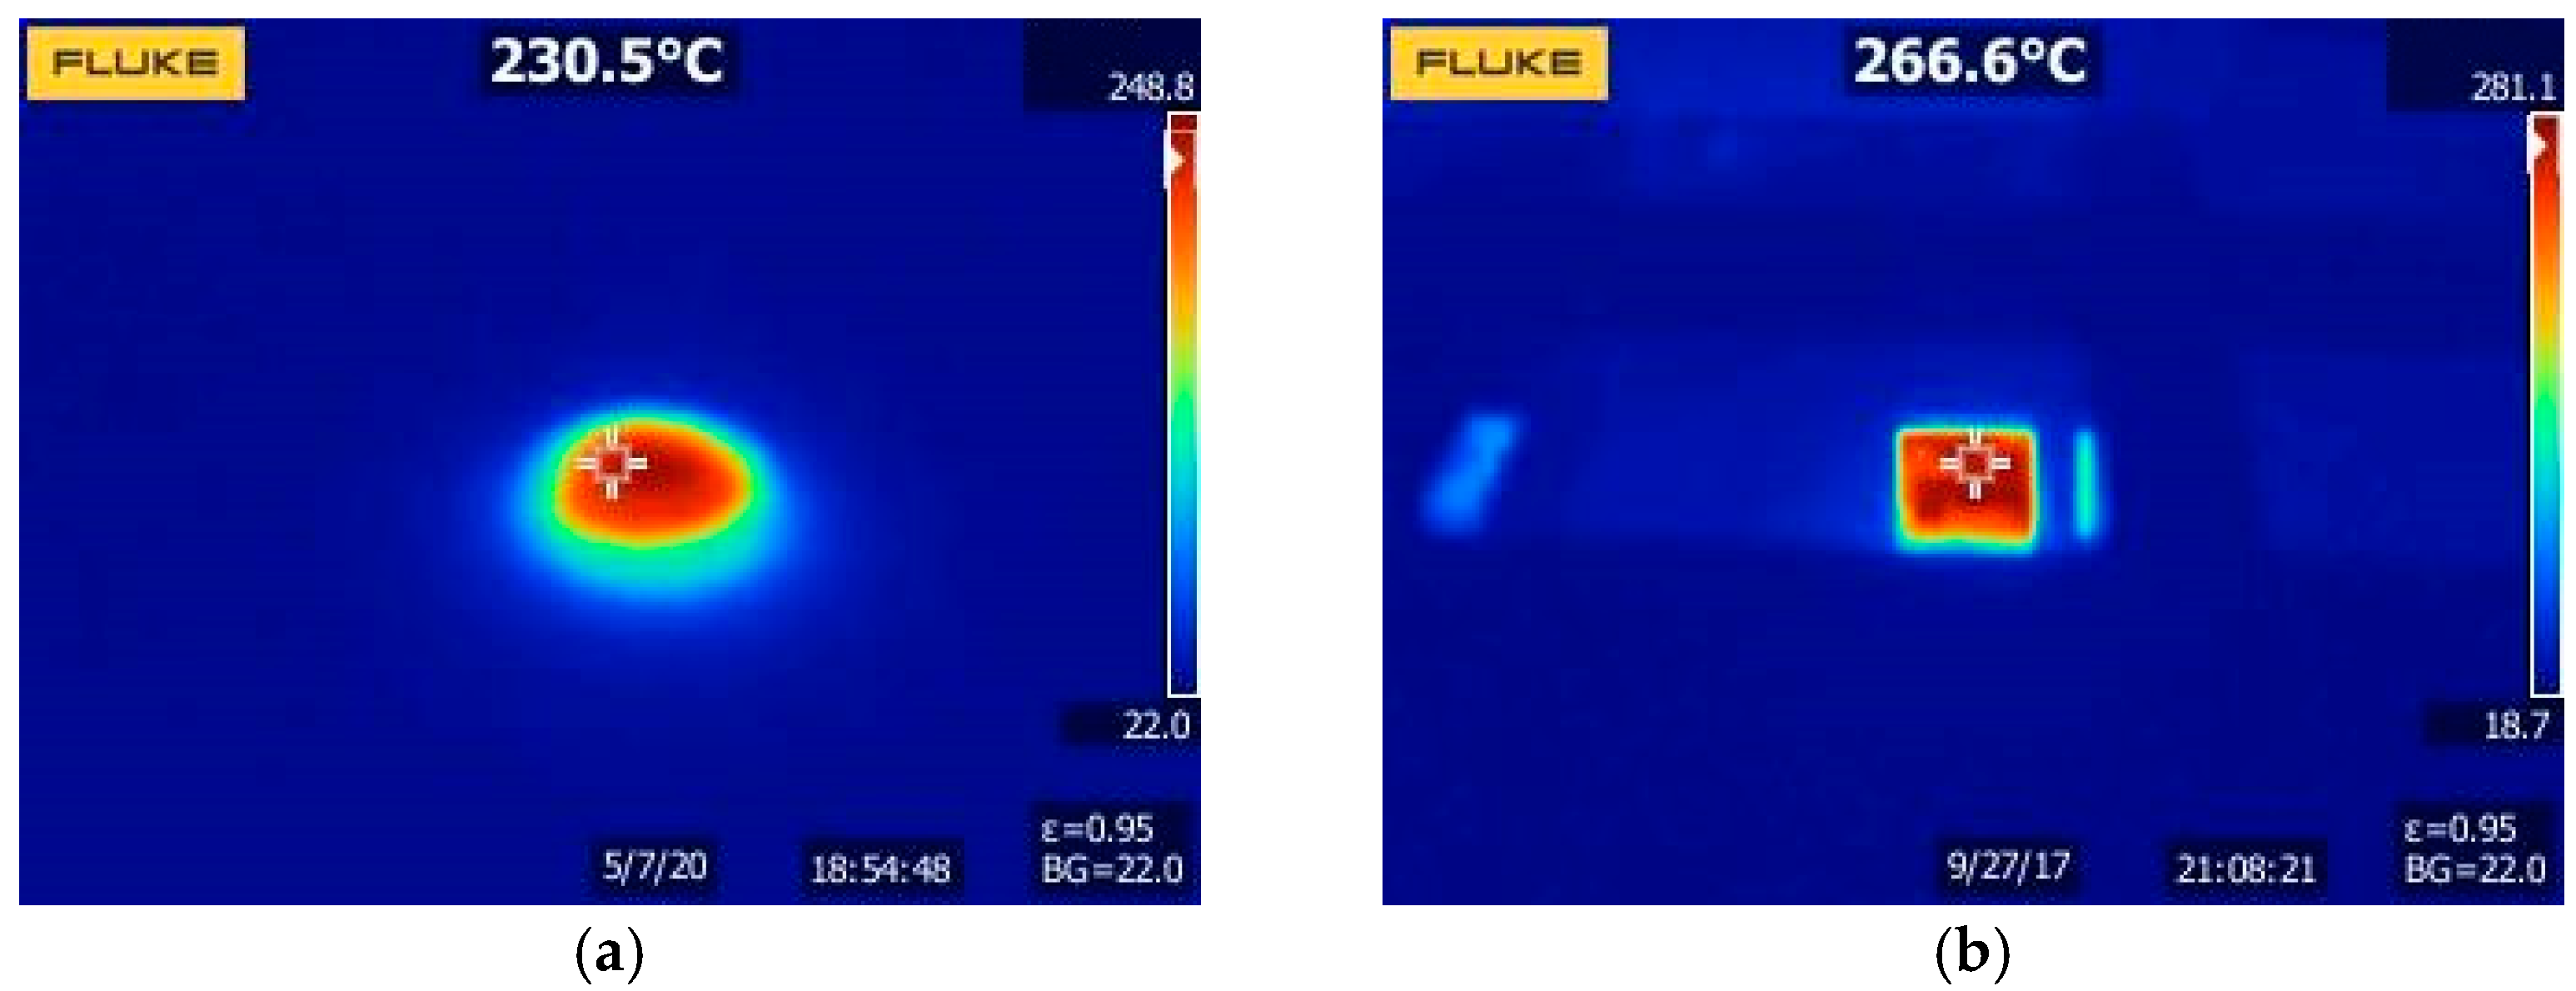
- Sonnenberg, T.; Stevens, A.; Dayerizadeh, A.; Lukic, S. Combined Foreign Object Detection and Live Object Protection in Wireless Power Transfer Systems via Real-Time Thermal Camera Analysis. In Proceedings of the 2019 IEEE Applied Power Electronics Conference and Exposition (APEC), Anaheim, CA, USA, 17–21 March 2019; pp. 1547–1552. [Google Scholar] [CrossRef]
- Karanth, A.; Dorairaj, H.H.K.; Kumar, R.B.R. Foreign object detection in inductive coupled wireless power transfer environment using thermal sensors. U.S. patent Appl.13/808,786, 27 June 2013. [Google Scholar]
- Jeong, S.Y.; Kwak, H.G.; Jang, G.C.; Choi, S.Y.; Rim, C.T. Dual-Purpose Nonoverlapping Coil Sets as Metal Object and Vehicle Position Detections for Wireless Stationary EV Chargers. IEEE Trans. Power Electron. 2018, 33, 7387–7397. [Google Scholar] [CrossRef]
- Thai, V.X.; Jang, G.C.; Jeong, S.Y.; Park, J.H.; Kim, Y.S.; Rim, C.T. Symmetric Sensing Coil Design for the Blind-Zone Free Metal Object Detection of a Stationary Wireless Electric Vehicles Charger. IEEE Trans. Power Electron. 2 0202, 35, 3466–3477. [Google Scholar] [CrossRef]
- Xiang, L.; Zhu, Z.; Tian, J.; Tian, Y. Foreign Object Detection in a Wireless Power Transfer System Using Symmetrical Coil Sets. IEEE Access 2019, 7, 44622–44631. [Google Scholar] [CrossRef]
- Jeong, S.Y.; Thai, V.X.; Park, J.H.; Rim, C.T. Metal Object Detection System with Parallel-mistuned Resonant Circuits and Nullifying Induced Voltage for Wireless EV Chargers. In Proceedings of the 2018 International Power Electronics Conference (IPEC-Niigata 2018-ECCE Asia), Niigata, Japan, 20–24 May 2018; pp. 2564–2568. [Google Scholar] [CrossRef]
- Jeong, S.Y.; Thai, V.X.; Park, J.H.; Rim, C.T. Self-Inductance-Based Metal Object Detection With Mistuned Resonant Circuits and Nullifying Induced Voltage for Wireless EV Chargers. IEEE Trans. Power Electron. 2019, 34, 748–758. [Google Scholar] [CrossRef]
- Thai, V.X.; Park, J.H.; Jeong, S.Y.; Rim, C.T.; Kim, Y.S. Equivalent-Circuit-Based Design of Symmetric Sensing Coil for Self-Inductance-Based Metal Object Detection. IEEE Access 2020, 8, 94190–94203. [Google Scholar] [CrossRef]
- Cheng, B.; Lu, J.; Zhang, Y.; Pan, G.; Chabaan, R.; Mi, C.C. A Metal Object Detection System with Multilayer Detection Coil Layouts for Electric Vehicle Wireless Charging. Energies 2020, 13, 2960. [Google Scholar] [CrossRef]
- Shi, W.; Grazian, F.; Dong, J.; Soeiro, T.B.; Bauer, P. Detection of Metallic Foreign Objects and Electric Vehicles Using Auxiliary Coil Sets for Dynamic Inductive Power Transfer Systems. In Proceedings of the 2020 IEEE 29th International Symposium on Industrial Electronics (ISIE), Delft, The Netherlands, 17–19 June 2020; pp. 1599–1604. [Google Scholar] [CrossRef]
- Shi, W.; Dong, J.; Soeiro, T.B.; Bauer, P. Integrated Solution for Electric Vehicle and Foreign Object Detection in the Application of Dynamic Inductive Power Transfer. IEEE Trans. Veh. Technol. 2021, 70, 11365–11377. [Google Scholar] [CrossRef]
- Shi, W.; Dong, J.; Bandyopadhyay, S.; Grazian, F.; Soeiro, T.B.; Bauer, P. Comparative Study of Foreign Object and Misalignment in Inductive Power Transfer Systems. In Proceedings of the IECON 2019—45th Annual Conference of the IEEE Industrial Electronics Society, Lisbon, Portugal, 14–17 October 2019; pp. 2634–2639. [Google Scholar] [CrossRef]


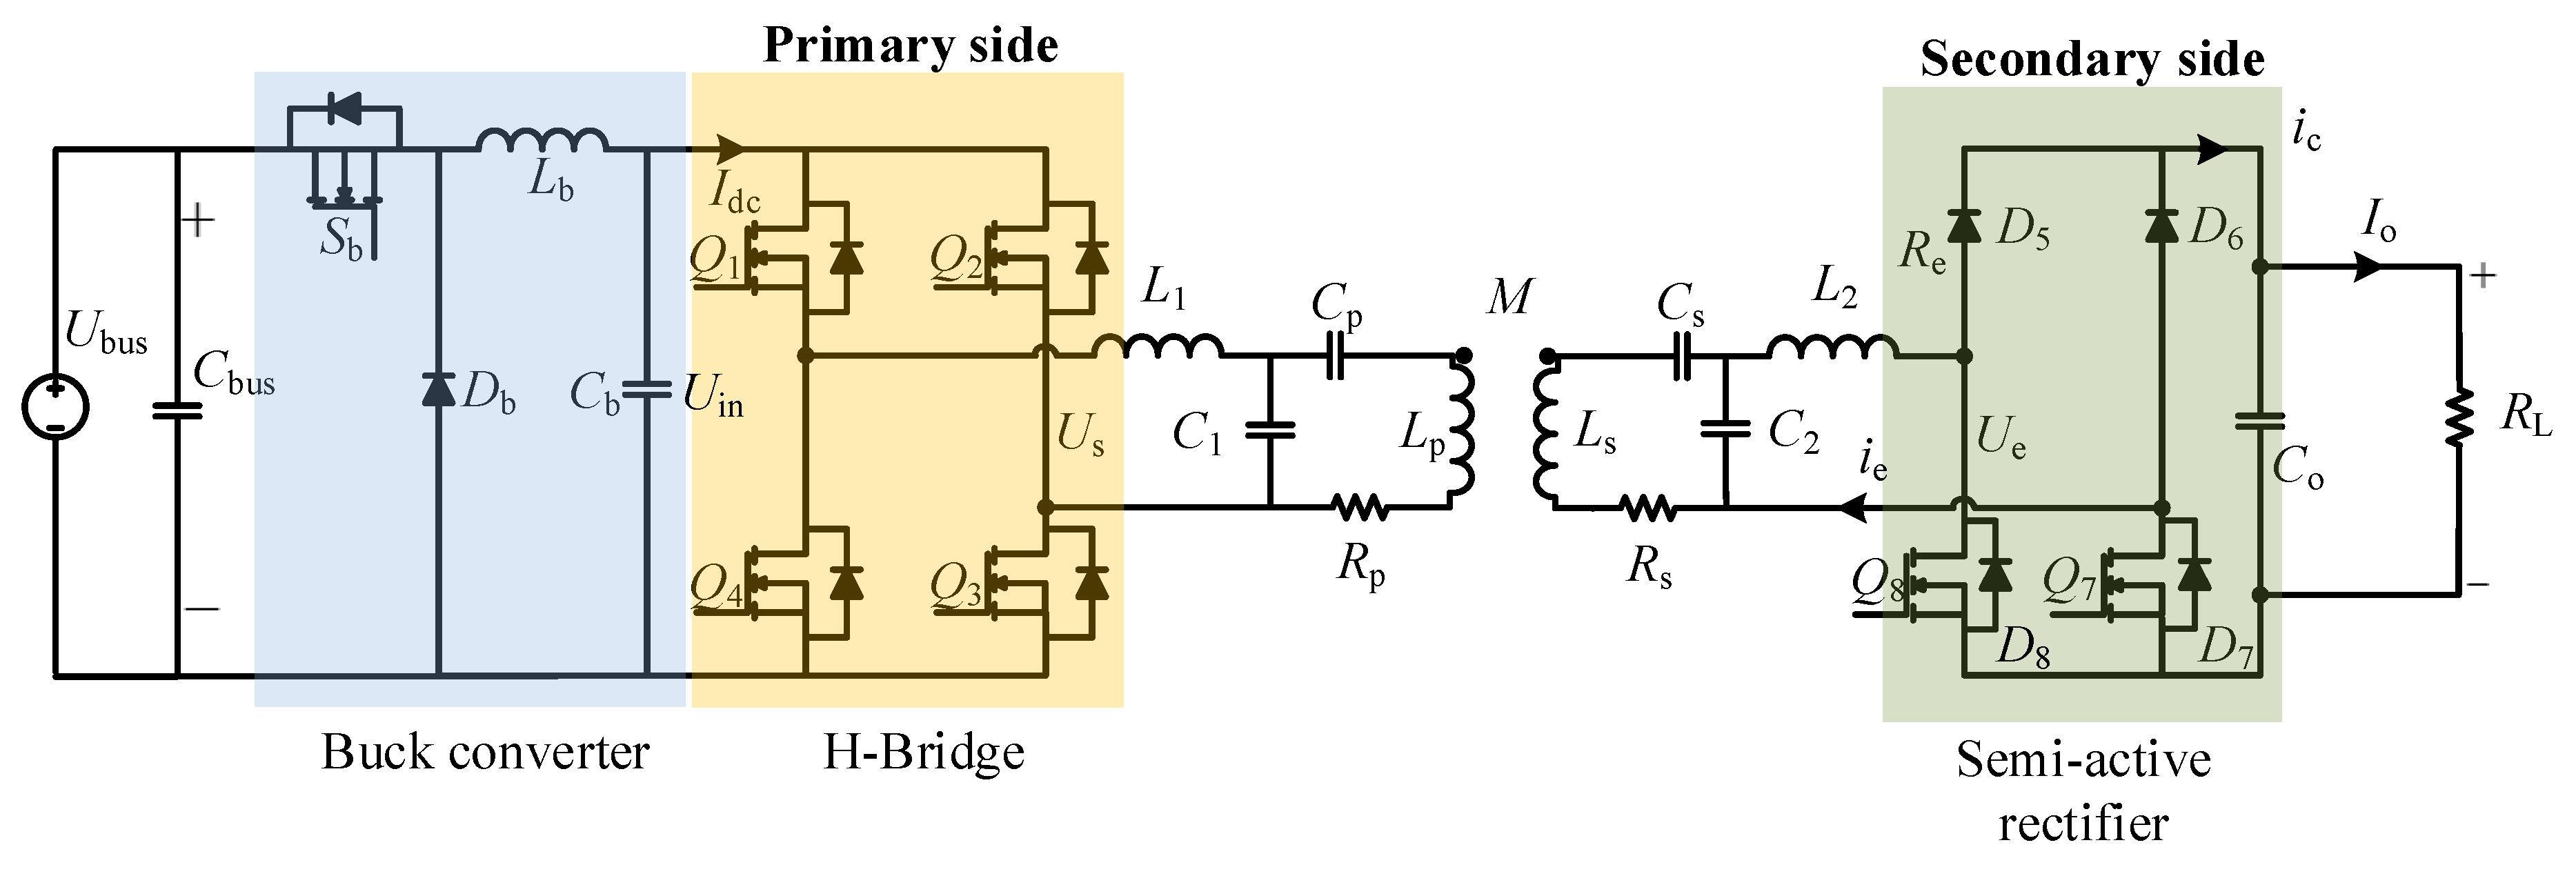
| Parameter | Value |
|---|---|
| L1 | 19.8 μH |
| Cp | 157.1 nF |
| C1 | 177.1 nF |
| L2 | 7.1 μH |
| Cs | 109.8 nF |
| C2 | 493.0 nF |
| Lp | 42.2 μH |
| Ls | 38.9 μH |
| M | 7.75 μH |
| Ip(RMS) | 15.0 A |
| Is(RMS) | 56.2 A |
| RL | 16 Ω |
| Gap | 12 cm |
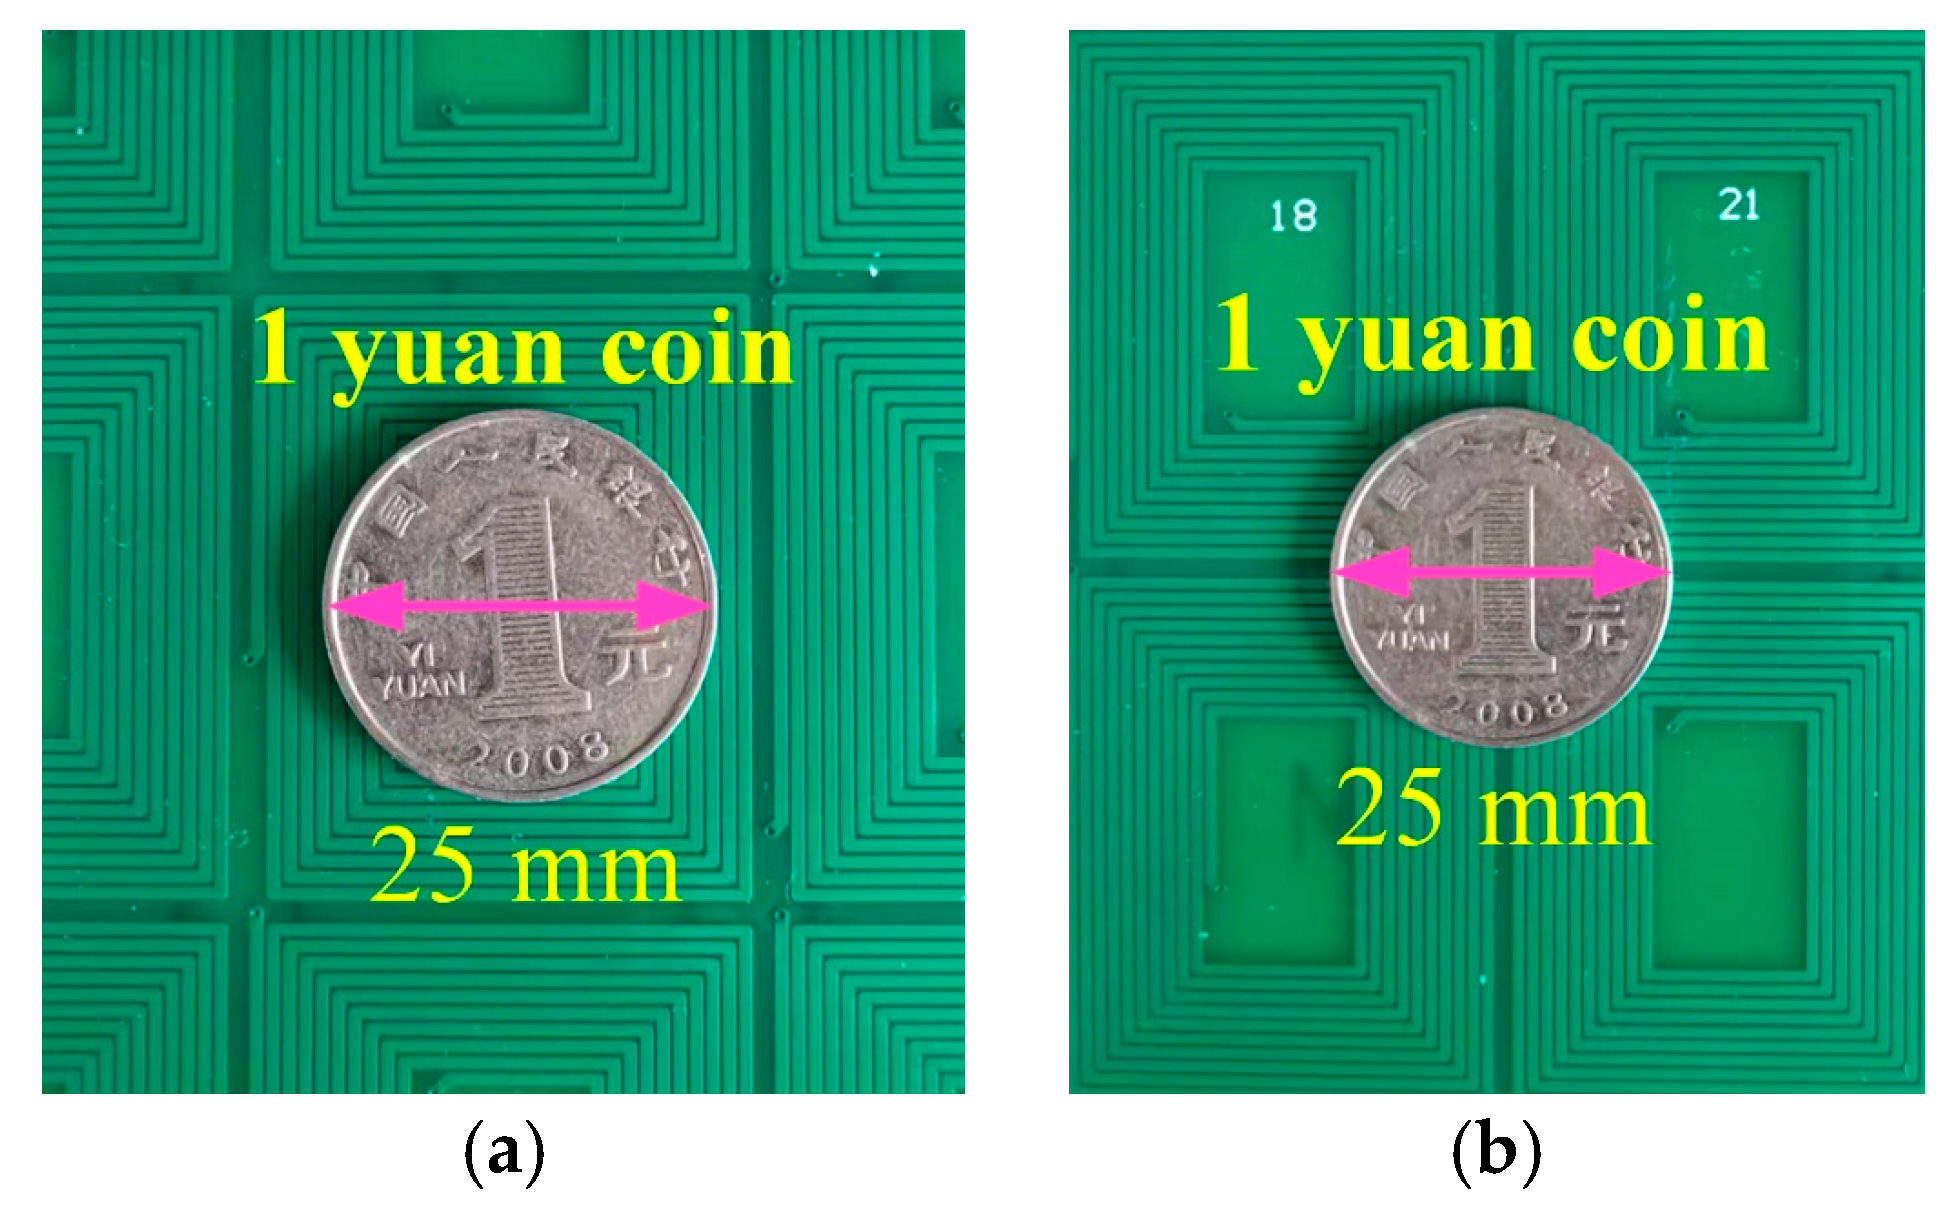
| Coin | Material | Diameter (mm) | Thickness (mm) | Conductivity (Siemens/m) | Relative Permeability |
|---|---|---|---|---|---|
| 1-yuan | Stainless steel with nickel plating on surface | 25 | 2 | 1.1 × 10⁶ | 70 |
| 5-jiao | Stainless steel with copper plating on surface | 20.5 | 2 | 1.1 × 10⁶ | 70 |
| 1-jiao | Stainless steel | 19 | 2 | 1.1 × 10⁶ | 70 |
Disclaimer/Publisher’s Note: The statements, opinions and data contained in all publications are solely those of the individual author(s) and contributor(s) and not of MDPI and/or the editor(s). MDPI and/or the editor(s) disclaim responsibility for any injury to people or property resulting from any ideas, methods, instructions or products referred to in the content. |
© 2023 by the authors. Licensee MDPI, Basel, Switzerland. This article is an open access article distributed under the terms and conditions of the Creative Commons Attribution (CC BY) license (https://creativecommons.org/licenses/by/4.0/).
Share and Cite
Sun, Y.; Zhou, T.; Jiang, J.; Wei, G.; Zhu, C.; Song, K. High-Sensitivity Detection Method for Metal Foreign Objects Based on Frequency Optimization in Wireless Electric Vehicles Charging. Energies 2023, 16, 741. https://doi.org/10.3390/en16020741
Sun Y, Zhou T, Jiang J, Wei G, Zhu C, Song K. High-Sensitivity Detection Method for Metal Foreign Objects Based on Frequency Optimization in Wireless Electric Vehicles Charging. Energies. 2023; 16(2):741. https://doi.org/10.3390/en16020741
Chicago/Turabian StyleSun, Ying, Tian Zhou, Jinhai Jiang, Guo Wei, Chunbo Zhu, and Kai Song. 2023. "High-Sensitivity Detection Method for Metal Foreign Objects Based on Frequency Optimization in Wireless Electric Vehicles Charging" Energies 16, no. 2: 741. https://doi.org/10.3390/en16020741
APA StyleSun, Y., Zhou, T., Jiang, J., Wei, G., Zhu, C., & Song, K. (2023). High-Sensitivity Detection Method for Metal Foreign Objects Based on Frequency Optimization in Wireless Electric Vehicles Charging. Energies, 16(2), 741. https://doi.org/10.3390/en16020741