Abstract
The transport sector generates more than 35% of total CO2 emissions. Electric vehicles are the future of transportation systems, and the demand for electric vehicles has grown considerably in the last few years due to government support. Companies worldwide are investing heavily in electric car charging stations based on renewable energy. This research study presents a complete design (including an appropriate energy management strategy) for a photovoltaic energy-based electric vehicle charging station (EVCS) with or without the support of a fuel cell and electrolyzer system. The parameters considered for designing the necessary capacity of the battery pack to support the required load are relative to the location-specific solar radiation (using RETScreen® Clean Energy Management Software, Version 9.0, Government of Canada, Toronto, Canada), the efficiency of the solar panel, the used strategy, etc. The battery capacity in the EVCS design based on a power-following strategy is about 20 times smaller than that resulting in the reference design. Additionally, the cost for an EVCS design based on a power-following strategy is almost half that resulting in the reference design. An analysis of the power-following strategy was carried out according to three EVCS operating scenarios.
1. Introduction
With the everyday growth of developing technologies and many useful tools, today, electric cars are on a rising path when it comes to popularity and units sold every month. This is because almost every major car manufacturer possesses an affordable electric vehicle (EV) with good autonomy, or at least such vehicles are at different stages of implementation [1,2]. Considering the challenges and opportunities of owning and using an electric vehicle, one of the biggest problems that remains is finding an optimal solution for charging it [3,4]. By using different algorithms and strategies, there are many proposed solutions and directions. There are many configurations of charging stations, technologies, and standards that combine grid power, energy storage systems, battery swapping technology, renewable energy, and even off-grid charging solutions. This paper focuses on analyzing an EV charging station solution using photovoltaic energy with or without the support of a fuel cell (FC) and electrolyzer (ELZ) system and evaluating the required capacity of the battery pack to sustain a variable load under an appropriate energy management strategy [1,2,3,4,5].
Photovoltaics (PV) is a technology that is constantly growing in terms of reliability, advantages, and impact on the environment. This technology can be a perfectly suitable answer for vehicle owners who currently cannot find a cheap and fast way to charge their cars [6,7]. Until recently, since few people had an electric car, they would charge it at a dedicated station in the parking lot of a grocery store until they did their shopping and did not have to wait in line. Now, the waiting lines are quite long due to the growing number of electric car purchases because there are affordable electric vehicles on the market. Thus, many countries in the world offer different “green” programs that can help those who want to use the benefits of solar energy with up to 90% of the total costs. In the future, these programs should be extended to residential blocks, not only to residential houses, company buildings, or remote locations [8].
So, in this paper, we analyze two energy management strategies for an EV charging station based on photovoltaic energy with or without the support of FC and ELZ systems. The PV potential and battery capacity for an EV charging station (EVCS) are estimated for the considered case studies.
The first case study is focused on the battery capacity design at a specific location where five electric vehicles can use charging stations with an installed PV power of 50 kW. In this case, from the start, we had to impose a limit to using the charging stations efficiently so that the total consumption did not exceed the maximum available PV energy. In this smart parking lot, five electric vehicles were introduced to ensure the balance of power so that the battery’s state of charge (SOC) was controlled within the limits imposed by the energy management strategy. Using the FC and ELZ strategy ensures control of the power generated by the FC system (up to maximum value when the PV power is lower than the load power) consumed by the ELZ (over 10% of the nominal value when there is an excess of PV power), and the battery SOC is monitored in both operating regimes. These are the main objectives of an energy management strategy (EMS) for a hybrid EVCS based on renewable energies, as highlighted in the next section.
In order to avoid SOC battery monitoring, an EMS based on ensuring the power balance in a DC bus and battery operation in a sustained charge mode is proposed, which requires generated FC power and consumed ELZ power to follow the power difference between the PV power and load power in the two operating modes. Thus, the second case study analyzes the proposed power-following strategy for the FC–electrolyzer unit to sustain the dynamics of the power flows on a DC bus in all operating cases (the variable profile of PV power and DC load demand is the EV charging power). As a result, the battery of the charging station operates in a sustained charging mode (with an almost constant SOC). In this case, the beneficial results are a lower battery capacity and a reduced number of charge–discharge cycles, which increases its life. Briefly, the FC stack is controlled in real time to generate the power required to compensate for power flows on the DC bus when the PV power is less than the EV charging power (< ), and the electrolyzer is supplied when > to generate hydrogen (which is stored in pressure fuel tanks and utilized by the FC pack when necessary).
The novelty and main contributions of this research study are the following:
- A power-following strategy for the FC–electrolyzer unit is proposed for an EVCS;
- The performance of the EVCS design based on the power-following strategy is compared with the reference design [8];
- The effectiveness and safe operation of the EVCS based on power-following is analyzed in three operating cases;
- In all operating modes, the required battery capacity is much lower in the case of the EVCS design based on the power-following strategy than the reference design or other EVCS designs based on strategies proposed in the literature;
- The system cost is determined for both EVCS models, and the cost of EVCS implementation based on the power-tracking strategy is about half of that of the reference implementation.
The paper is structured as follows. Section 2 presents and discusses the papers published in recent years to create a benchmark and define the research objectives for EVCS implementation. Section 3 details the design of an electric vehicle charging station based on photovoltaic energy and evaluates some performance indicators. Section 4 presents the power-tracking strategy for an electric vehicle charging station based on the PV power and a fuel cell–electrolyzer unit. The conclusion section presents the main findings and the next research work.
2. Related Work
When discussing electric vehicles and the potential of charging them by using renewable energy, many research papers have tried to propose and develop this topic based on various key points. So, this section is a concise literature review of technical research papers from the last few years to highlight the research need clearly, describe the working hypotheses, and define the research questions.
To start this literature review, it is necessary to understand the main benefits that arise, as stated in paper [9], when a photovoltaic energy storage charging station combines PV power generation with energy storage systems and charging station construction. So, by introducing an energy management strategy based on a detailed flow chart and a benefits analysis model, the paper reveals serious benefits for three major actors: society, the power grid, and the charging station. For society, there are, of course, environmental benefits through clean energy and energy-saving benefits. At the same time, for the power grid, advantages are traduced in reducing power loss and generation cost and delaying the network’s capacity expansion. For the charging station, the main gains are the results of the sales income of charging for photovoltaics, PV subsidy income, and income of surplus PV on the grid.
By taking advantage of these above benefits, there have been many proposed solutions, such as the one stated in [10], where various configurations of DC microgrids for charging electric cars are debated. Four configurations are presented here, each of which has a PV-based microgrid and energy storage system (ESS). The differences among these four configurations come from a direct connection or a bidirectional DC/DC converter connection for the ESS and from using a three-port DC/AC/AC converter only for the PV and ESS or paired with an AC/DC converter to connect the DC bus to the charging stations. The results in [10] showed an increased reliability performance and that using one converter for each source was the perfect balance among sizing, operation, and costs, although higher costs were accrued due to dedicated converters used for each configuration.
Another solution proposed in [11] revealed the actual implementation of a residential electric vehicle charger using a PV array-powered grid that can hold both the charging station and the in-house loads. The control strategy is robust, generating a sinusoidal voltage with total harmonic distortion smaller than 5% due to the use of an active power filter.
The study in [12] proposes a framework for peak load reduction using a PV-based smart microgrid and vehicle-to-building (V2B) concept. This solution utilizes a rooftop PV array, battery ESS, various loading, and advanced metering and communication infrastructure. The simulations showed that the proposed solution effectively reduced (or shaved) the peak load, with a huge gain of satisfying the EV owners’ needs and handling uncertainties under renewable power production.
Paper [6] analyzed the electric vehicle charging stations in photovoltaic parking lots, where these cars are parked for most of the day, highlighting that 26% of charging stations around the world are built into parking lots. This paper discussed electric car batteries and charging strategies, the photovoltaics and electric vehicles market, and the technology and conditions for economic benefits, air pollution reduction, and augmented system reliability for a proposed solution.
Another study [11] researched how PV-based microgrid charging stations behave under different solar irradiation in India, and a solar radiation map was presented with significant differences between regions of the country. The results showed that the optimal configuration and investment efficiency in each region or city is roughly affected by the solar irradiation and that electric vehicles charging stations are feasible and worth investing in only where there are high solar irradiation conditions.
Next, the study presented in [13] proposed a solution for an autonomous mode of DC fast-charging stations through a supervisory controller when the utility grid is unavailable. The proposed architecture relies on a PV-based microgrid. Similar to the solution in [14], it can operate in both the island mode or grid-connected mode with a smooth transition between them and without affecting the process of electric car charging. Simulations revealed good stability of the controller at various discrete events and large signal disturbances.
The study in [15] aimed to develop coordinated scheduling of electric cars in charging stations supported by microgrids. So, by taking advantage of the potential of renewable energy, the proposed model promised high flexibility and a stable operation of electric vehicles in microgrid-based charging stations.
Another scheduling technique is illustrated in paper [15], where a new method for parking lot microgrids to deliver day-ahead peak shaving is proposed. This method consists of a rooftop PV array, smart charging stations, and multiple loads to cover, such as lighting, escalators, air conditioning, and heat ventilation considering the scenario of a shopping mall with a parking lot. The results of this study indicated high flexibility and a robust optimization plan.
From another point of view of coordinated car charging scheduling, another paper [16] stated that an integrated DC microgrid solution for electric vehicle fleet management is a more general solution than those in [14,15]. This solution integrates PV rooftops, energy storage, and electric vehicle stations in a DC microgrid. The results showed an affordable and low-cost energy supply to the electric vehicles and specific control of the energy exchange in line with increased system resilience and efficient management of island mode [16].
Another paper [17] presented a system architecture for the grid integration of battery-enabled DC fast-charging stations suitable for electric vehicles. The proposed enabled electric car fast-charging station consists of a PV array, battery ESS, and a robust control system. The fast-charging station can perform in either island mode or grid-connected mode and ensures reliability and performance under uncertain parameters and operating point changes.
Going by a similar solution to renewable energy, a hybrid system feasibility test was conducted in [18], where a mixed solar–wind grid was connected to an electric vehicle charging station. The proposed solution demonstrated efficiency and the strength of the idea that hybrid renewable energy systems possess the potential to provide electricity reliably and economically.
Another hybrid-based microgrid charging station was presented in [19], with an efficient planning algorithm for allocating smart electric car charging stations in remote communities. As a result, the proposed method satisfied the mixed microgrid constraints for power flow and reliability and sustainability.
Paper [20] presented a solution for charging electric vehicles to maximize the social welfare of all the system players and the renewable energy resources’ power-based utilization. Simulations of the proposed algorithm showed that the overall services performed by car owners increased, and there was proper balance between the power produced by the PV array and the power consumed by the electric vehicles.
In summary, the analysis carried out highlights that there are several solutions for the implementation of an electric vehicle charging station based on renewable energy sources (RES), each of them with advantages and disadvantages. Photovoltaic systems used as rooftops over residential buildings or parking lots as a reliable source for electric vehicle charging stations represent a feasible and efficient solution that must be implemented in the near future, as long as the technology evolves and the multiple challenges and technical constraints are overcome, and overall, as long as our way of life, education, and progress maintain a line of positive growth.
The papers presented and discussed above as an on-topic literature review of the last few years are depicted in a summary table below (Table 1):

Table 1.
Summary table with recent papers regarding the topic of this study.
For a PV power comparable to other proposals, it was observed that the proposed design provides a lower battery capacity than that obtained in [16]. For the other cases, after creating PV power comparable to other proposals and adjusting the Cbatt accordingly, it is noted that the proposed design generally gives a lower battery capacity than those obtained in [9,12,17,18,20] but not in [11]. The simulation carried out in this study showed that the battery capacity can be reduced to 10 Ah, which is about 26 times lower compared to that in [11] for the same installed PV power. However, note that when different battery technologies and voltages are used to build the battery stack, the results shown in the last column of Table 1 are for information only.
3. Design of an Electric Vehicle Charging Station Based on PV Energy
3.1. PV Panel Area
Romania has high energy potential from photovoltaic panels (PVs). In a year, there are 210 sunny days. In Romania, the best locations for a PV area are the south-east, the west, the center, and the east. Solar radiation can be converted into electrical energy using photovoltaic panels.
The best location in Romania to install PVs is in the south of the country, which has solar radiation between 1241 and 1387 kWh/m2 [21,22,23].
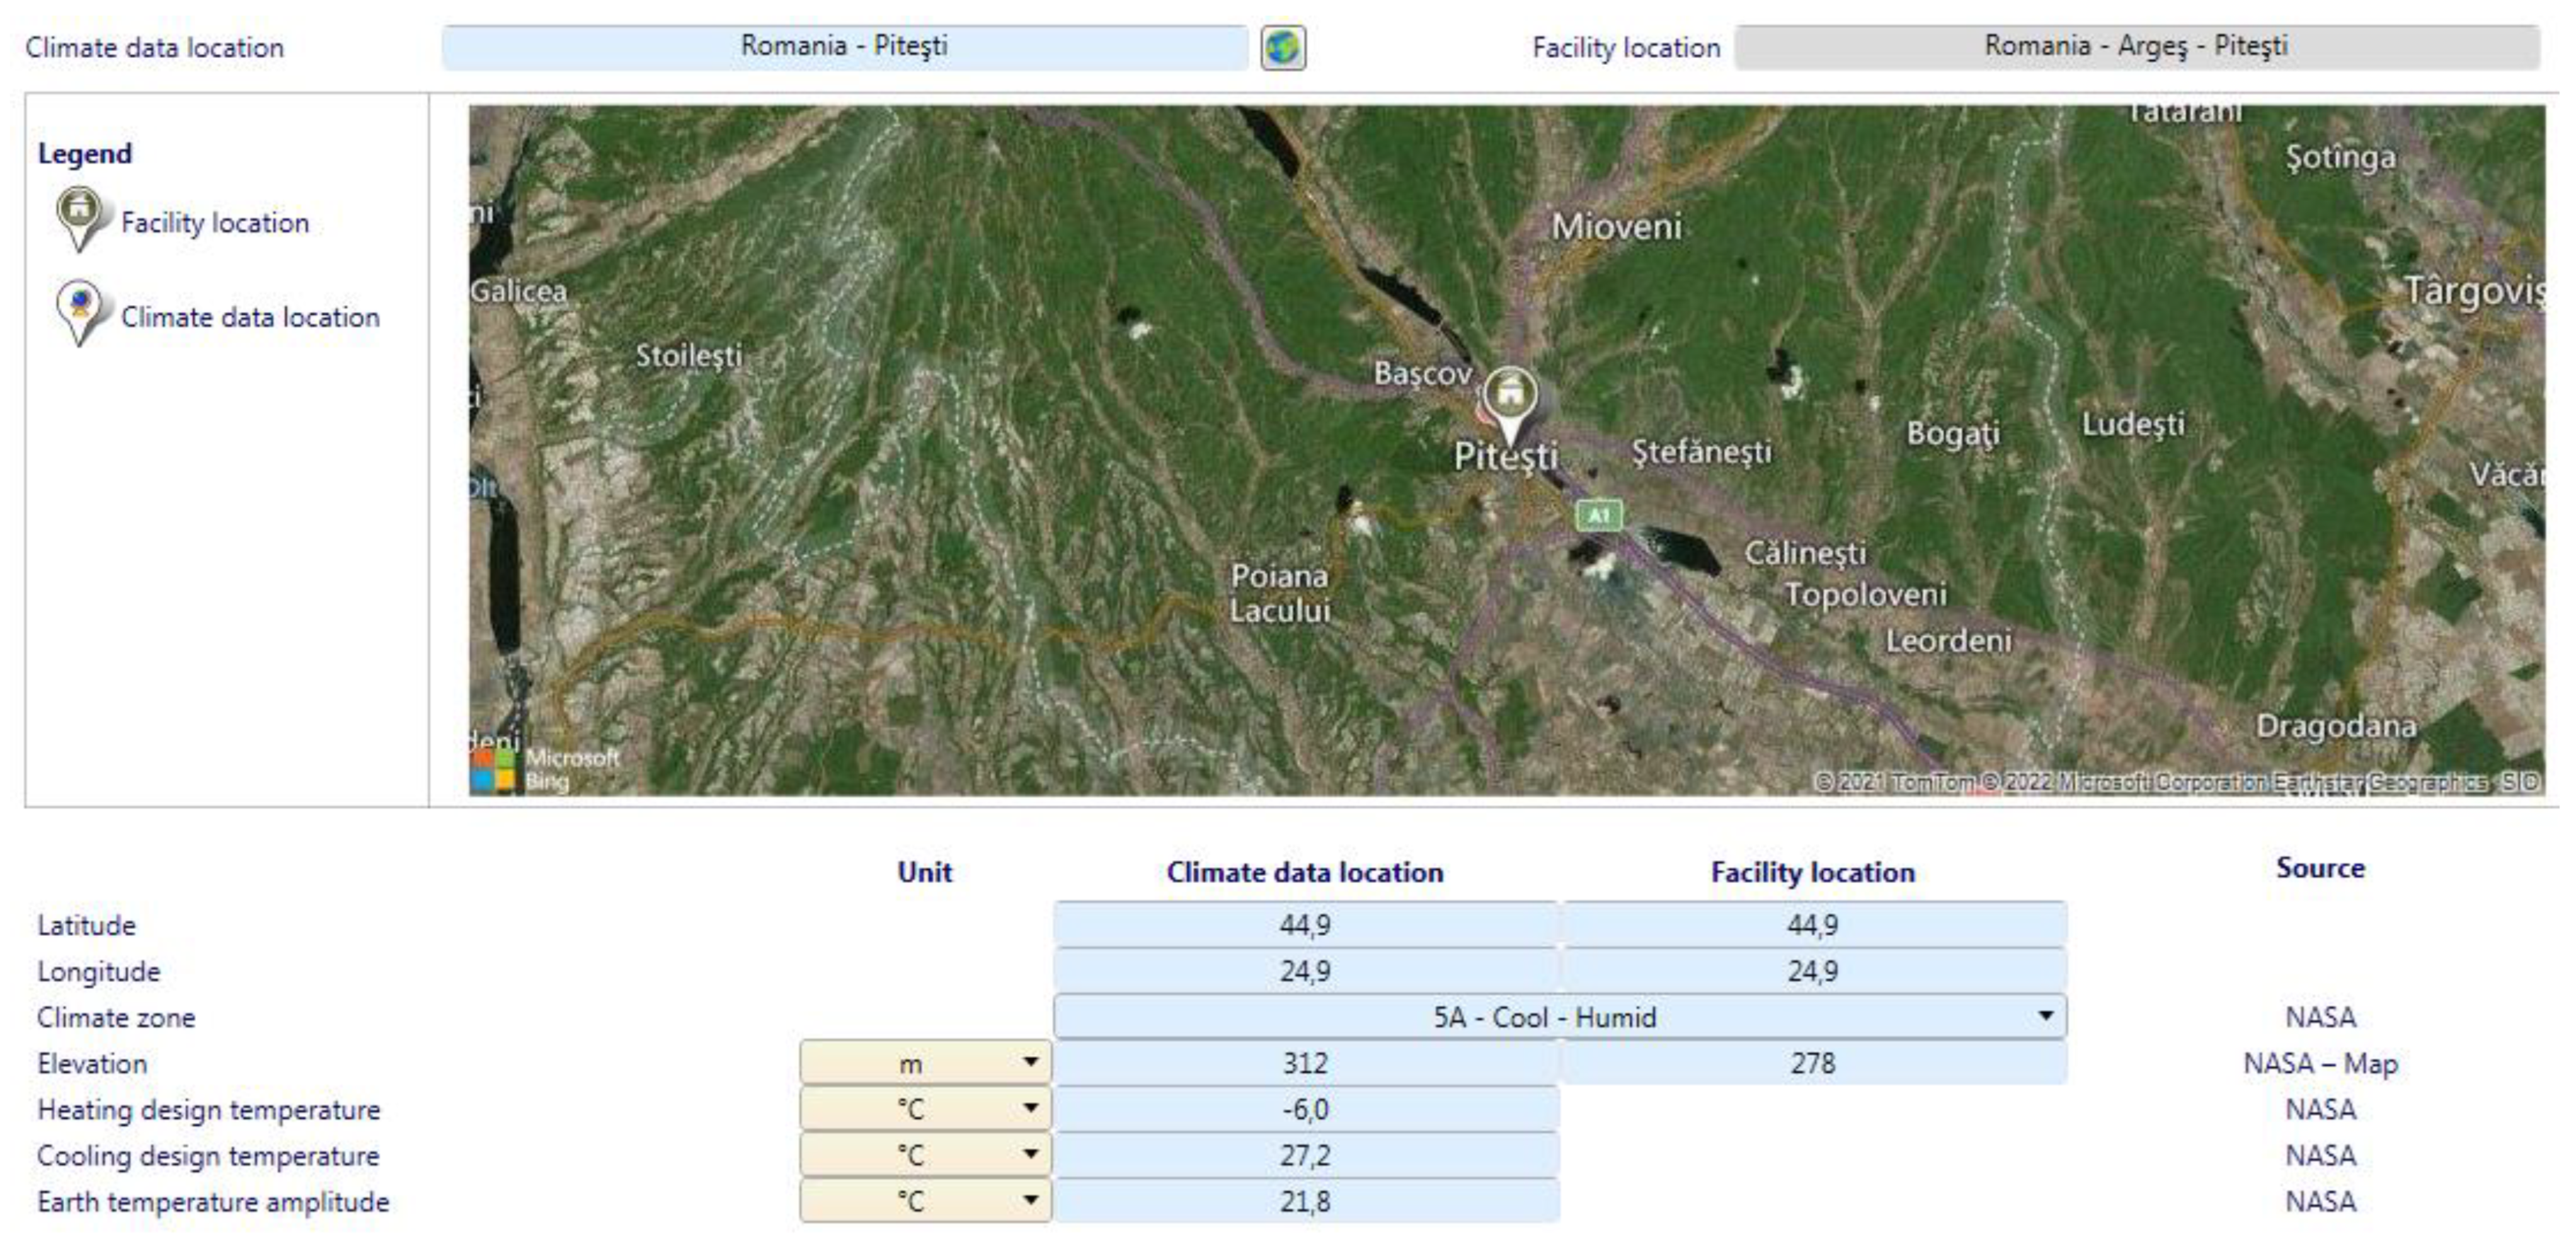
Based on the solar radiation, and using RETScreen (Clean Energy Management Software®, Version 9.0, Toronto, Government of Canada, ) [24], the total energy produced by a photovoltaic panel area was calculated. In this case study, the photovoltaic panel area was located in Pitesti city, Romania, with the location coordinates shown in Figure 1.
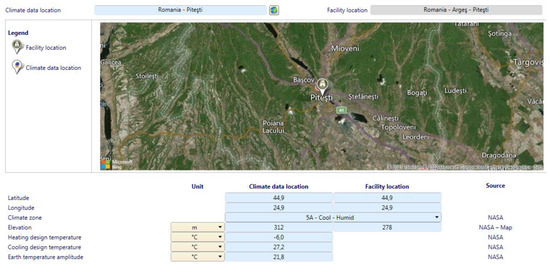
Figure 1.
Coordinates and place of PV area.
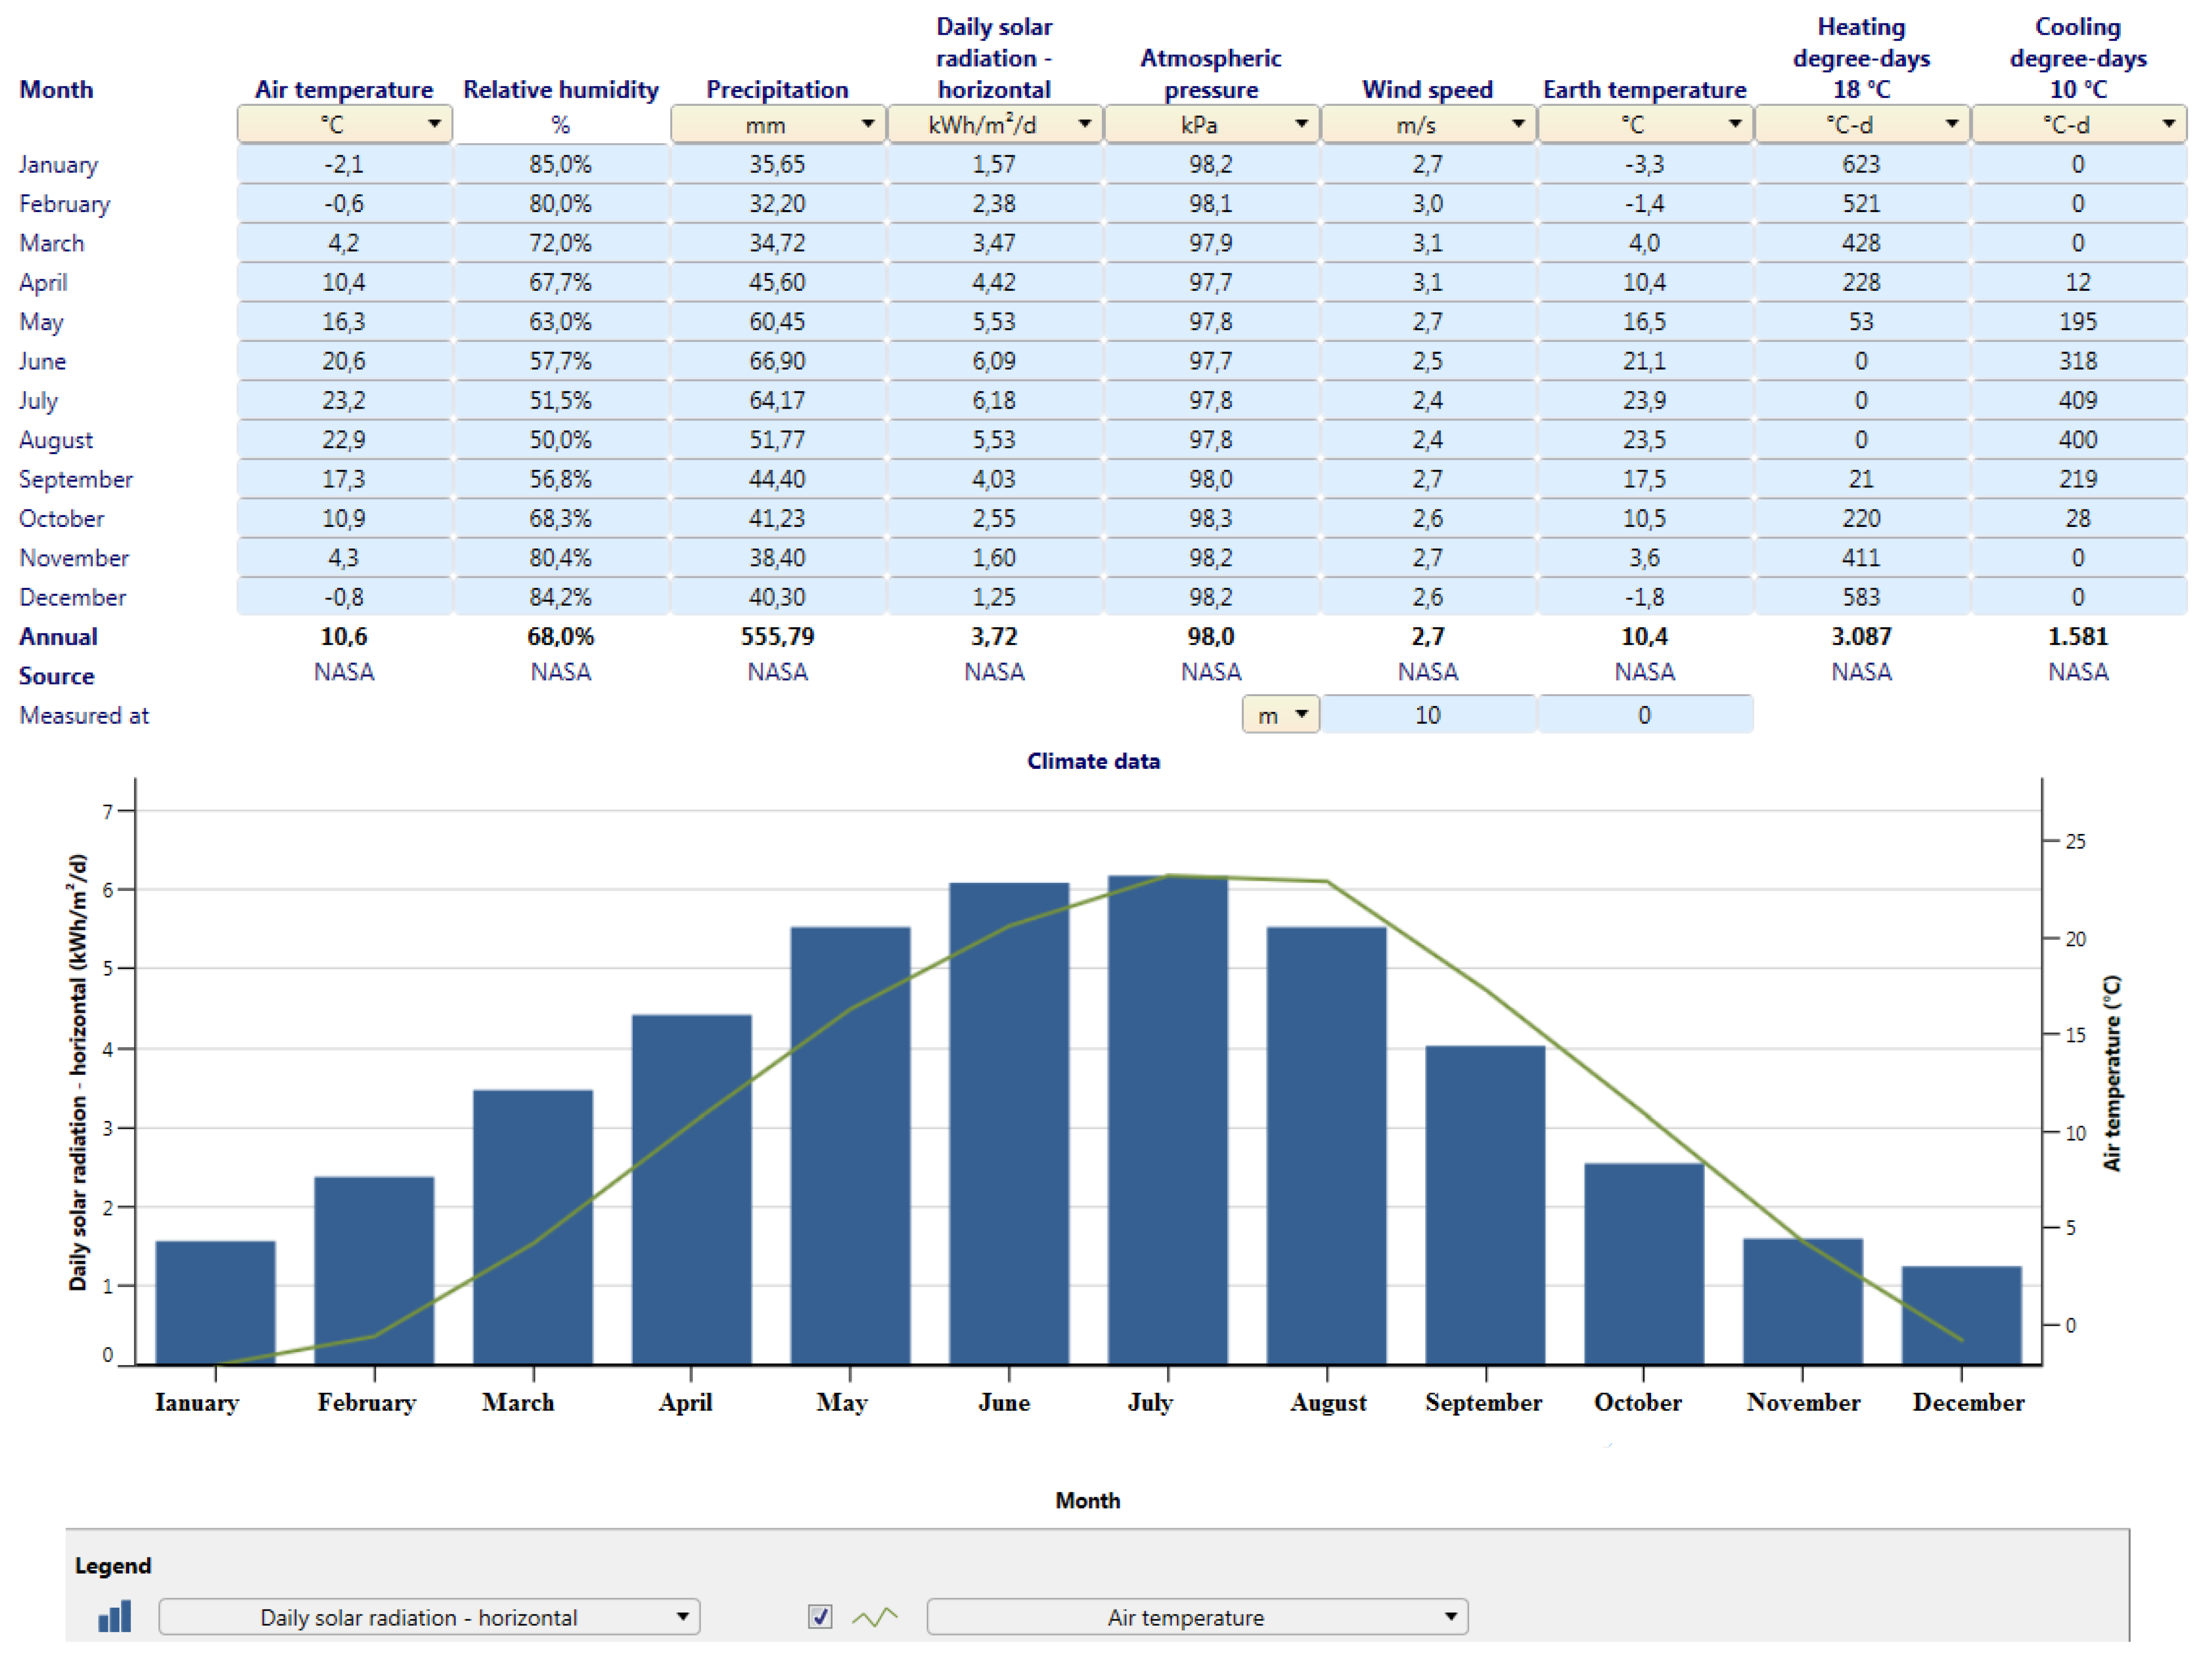
The average solar radiation in this location in a year is represented in Figure 2.
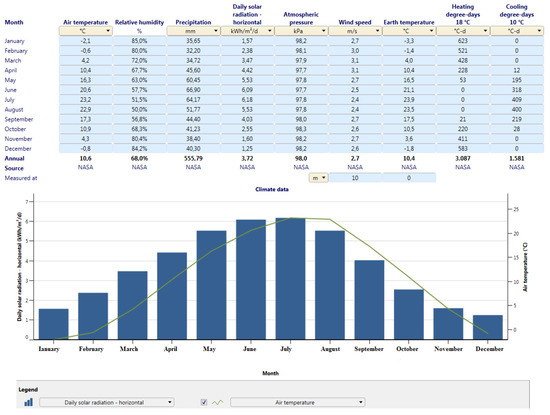
Figure 2.
The values of the main parameters (top) and the representation per month in a year (bottom) for solar radiation (bar graph) and air temperature (green line).
It was observed that the highest values were in June and July (with a maximum value of 6.18 kWh/m2), and in January and December, the lowest values were obtained (with a minimum value of 1.25 kWh/m2).
The electricity produced by the photovoltaic area was estimated by multiplying the number of PV panels used (n) with the energy corresponding to a panel, which depends on the solar radiation and its technical characteristics.
The battery size and hydrogen tank were designed for the worst case (five winter days with a lot of snow).
The energy management of the PV area is as follows: if the PV energy is less than the load (charging station), then the FC system provides the energy difference; if the photovoltaic energy is greater than the load (charging station), then the excess energy is converted into hydrogen with the help of the electrolyzer.
If the PV energy is less than the load (charging station) for a longer period than five winter days, the FC system provides the energy difference (as long as it has hydrogen in the tank), and then the battery does (until the SOC is higher than the minimum SOC).
If the PV energy is greater than the load (charging station) for a longer period than five winter days, then the excess energy is converted into hydrogen until the tank is completely filled, and then the battery is fully charged.
The technical characteristics of the photovoltaic panels (SIV SERIES 535W monocrystalline PERC) used in this study are presented in Table A1 presented in Appendix A.
3.2. EV Charging Station Design
The sizing of the EV charging station to achieve the reference design was carried out according to the steps below [25].
If the number of electric vehicles (EVs) increases, the distributed energy resources will not have the ability to provide the energy needed. Taking into account all the disadvantages, it is difficult to convince people to buy an electric car. The existing grid is outdated today, as it was not designed to ensure the energy needed to supply a large number of EV charging stations or to supply fast charging stations. The dimensions of EV charging stations (EVCSs) are based on the following parameters: types of EVs, battery capacity, and state of charging of the battery. A major problem is how efficiently PV energy can be used [25,26].
In this research study, a charging station was designed with an installed power of 50 kW and five individual places for pluggable EVs. If an EVCS place is occupied by an electric vehicle, it will not use the total installed power (50 kW), only the power it needs. So, during this time, another electric vehicle can use a free plug from the charging station. In our study, green energy was supplied from PV panels. The technical characteristics of five types of electric vehicles were analyzed (see Table 2 [27,28]): Dacia Spring, Hyundai Ioniq, Renault Zoe ZE50 R110, Volkswagen e-Golf, and Opel Corsa-e (one EV from each type, NL = 1).
Table 2.
Technical characteristics of electric vehicles.
In Table 3, the main values of the EV parameters (the battery capacity and charging autonomy using alternating current (AC) and direct current (DC), respectively, for EVCS) are presented for the design of the EVCS.
Table 3.
Battery capacity and autonomy to charge for 1 h from AC or DC.
The system was designed considering the net energy needs of an alternative current home electrical vehicle charging station (380 VRMS/50 Hz) by using a value of 10% for small vehicles for losses in the batteries and charger. Table 4 presents the net energy needed (PnL), the loading time (tz), and daily net energy needed (Ez(needed)) for each EV analyzed using (1):
Table 4.
Net energy needed and loading time for each EV model.
So, the total EVCS power is about 50 kW and the total net energy needed (Ez(total needed)) for all five electric vehicles is:
3.2.1. Photovoltaic Panel Systems
The daily energy generated by photovoltaic panels must cover the total energy needed and the power losses that mainly occur in the battery charging/discharging process (), the battery charger () circuit, and the inverter ().
So, the daily energy generated by photovoltaic panels (EPV) is estimated using (3):
In this case study, the energy is produced by the PV system described in Section 3.1 (with nominal PV panel power of ) and an average solar time of tSM = 5 h/day (for the chosen location, Pitesti City, Romania). The number of needed PV panels is given by (4):
So, 122 PV panels will be installed.
3.2.2. Batteries
- The type and number of batteries depend on the energy received from the PV, the number of days of reserve, and the working voltage of the PV installation. The working voltage of the batteries must be the same as that of the PV array. A reservation for 1 day was chosen (nzr = 1 day), which means that the energy stored in the batteries was sufficient to supply the EVCS loads for one day. In addition, to extend the life of the batteries, it was considered that they should be discharged to no more than 20% of the maximum stored energy. As a result, the energy stored () in the batteries was increased by 25% (see Equation (5)):
- Thus, for batteries with a nominal voltage ()) and capacity () of 12 V and 1000 Ah, respectively (for example, Rolls S-1400EX DEEP-CYCLE), the total capacity of the batteries () and the number of the needed batteries () are given by (6) and (7):
- So, 32 batteries will be installed.
3.3. Performance Evaluation
3.3.1. Investment Cost
Table 5 shows the costs of the EVCS components.
Table 5.
Estimation of the investment cost.
3.3.2. Amortization Period
For example, considering a price (PE) of 0.28 EUR/kW for 1 kWh generated by the PV system, the amortization period (AP) of the investment is estimated in Table 6, where the Ez(needed) was taken from Table 4. The number of sunny days per year (Ndays) is about 210 for the location considered in Romania (www.parcaripitesti.ro, accessed on 20 December 2022) [32].
Table 6.
Amortization period for EVs connected to EVCS.
4. Electric Vehicle Charging Station Based on a Power-Following Strategy
4.1. Design of the Power-Following Strategy
Based on the input data presented, a series of computational simulations were performed using iHOGA software (Version 3.4®, University of Zaragoza, Zaragoza, Spain) [33,34], resulting in the optimal size of the energy system (PV area, electrolyzer, and battery), as shown in Figure 2. The primary energy is provided by the photovoltaic area, and the FC system is a backup energy source. Additionally, two energy storage systems (hydrogen tank and battery) are used. This energy system was dimensioned for autonomy for at least five winter days. The power-following strategy of the FC–electrolyzer unit used in the charging station based on the FC/ELZ/RES DCmG shown in Figure 3 was designed to sustain the variable charging power for EVs () under an available power () obtained mainly from photovoltaic (PV) panels [35,36], but also wind turbines (WT) [37,38].
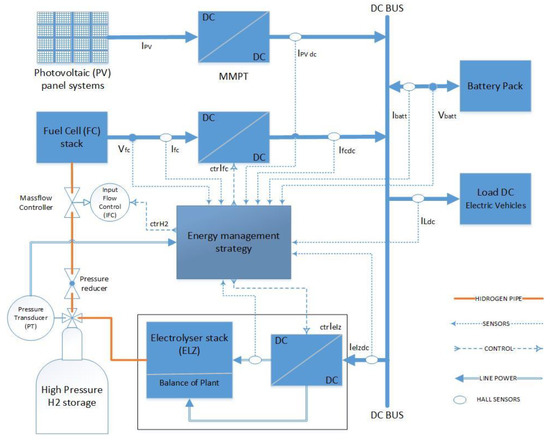
Figure 3.
Schematic of the charging station based on the FC/ELZ/RES DCmG.
The working hypothesis is that with a charge-sustained mode of operation of the battery pack during a load cycle (for example, a day), there is a clear advantage in terms of the size of the battery pack (only a battery of 10 Ah) and its lifespan [39,40] and the cost of the EV charging station. The average (AV) value of the battery power was considered to be approximatively zero (PBatt(AV) ≈ 0) on the DC power flow balance given by (8) [41]:
where is the DC capacitor, and , and are the efficiencies of the power converter that interfaces the FC, ELZ, and RES, respectively.
The power-following strategy was analyzed in three operating cases considering PBatt(AV) ≈ 0:
- If < , then = 0 and (8) is converted to AV values (9):
Thus, the control reference for the FC system () is given by (10):
- 2.
- If >, then the FC pack is operated at minimum power () to avoid complicated FC system start-up procedures but to ensure an acceptable FC efficiency, and (10) is converted to AV values (11):
Consequently, given by (12):
- 3.
- If and are comparable, then both FC and ELZ operate when > and < , respectively.
The reference control of the hysteresis controller for the FC boost converter ensures that . So, the FC power follows the power required to compensate for the DC power flow balance (8) when <. The safe operation of the FC system is ensured by using fueling slopes limited to a maximum of 100 A/s [42,43]. Fuel regulators use the well-known command in the literature called static feed-forward (sFF) based on FC current (), which is already implemented in commercial FC system solutions [44].
Because the subsystems involved in the dynamic compensation of the power flow balance have different time constants (in the order of minutes, seconds, and milliseconds for the battery, FC, and RES, respectively), the power balance during the step load demand is supported by the CDC capacitor and/or ultracapacitors (if available) via a bidirectional DC-DC converter [45,46].
4.2. Results Using the Power-Following Strategy
The operation of the charging station based on the FC/ELZ/RES DCmG was analyzed in three cases:
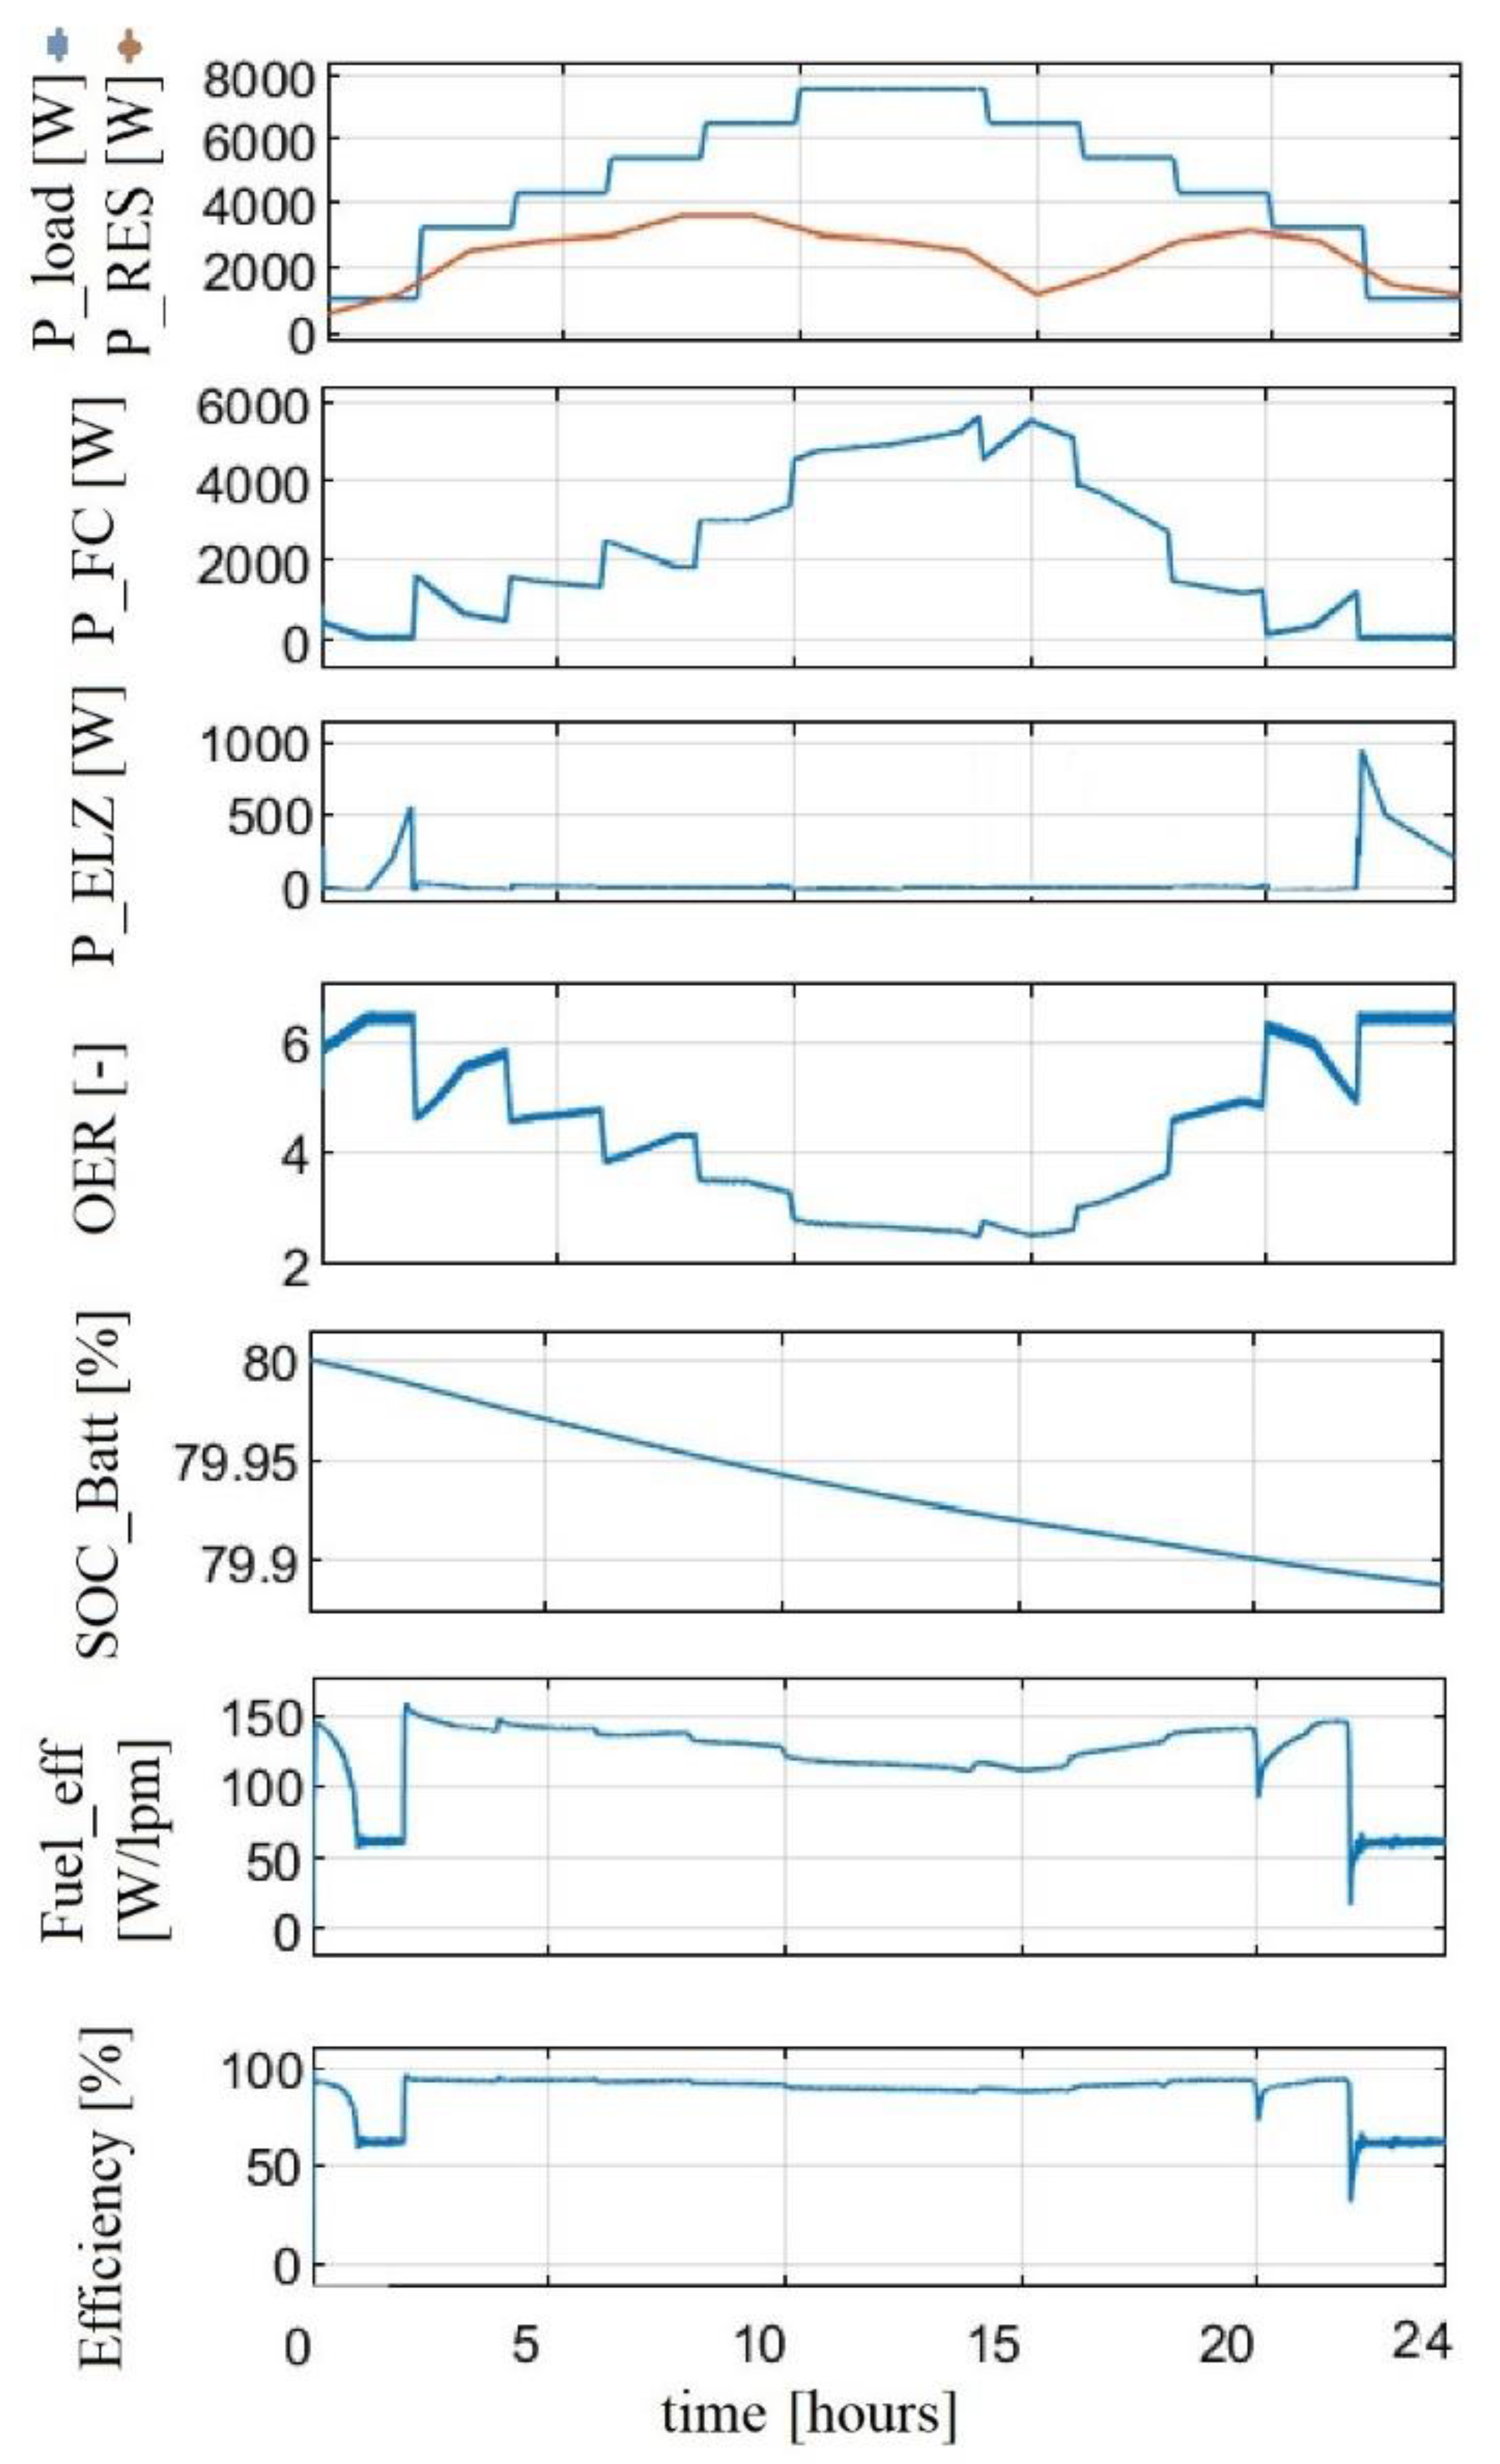
- When < (see Figure 4): in this case, the ELZ is not powered and the FC system sustains the power flow balance (9);
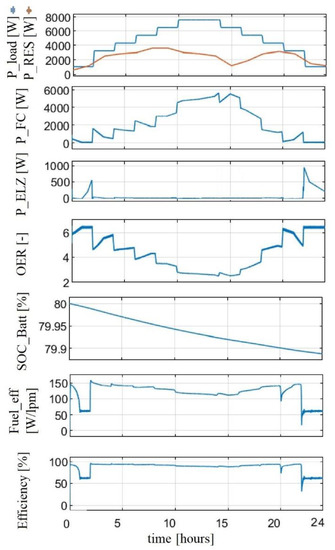 Figure 4. Operation of the charging station based on the FC/ELZ/RES DCmG when pRES < pLoad.
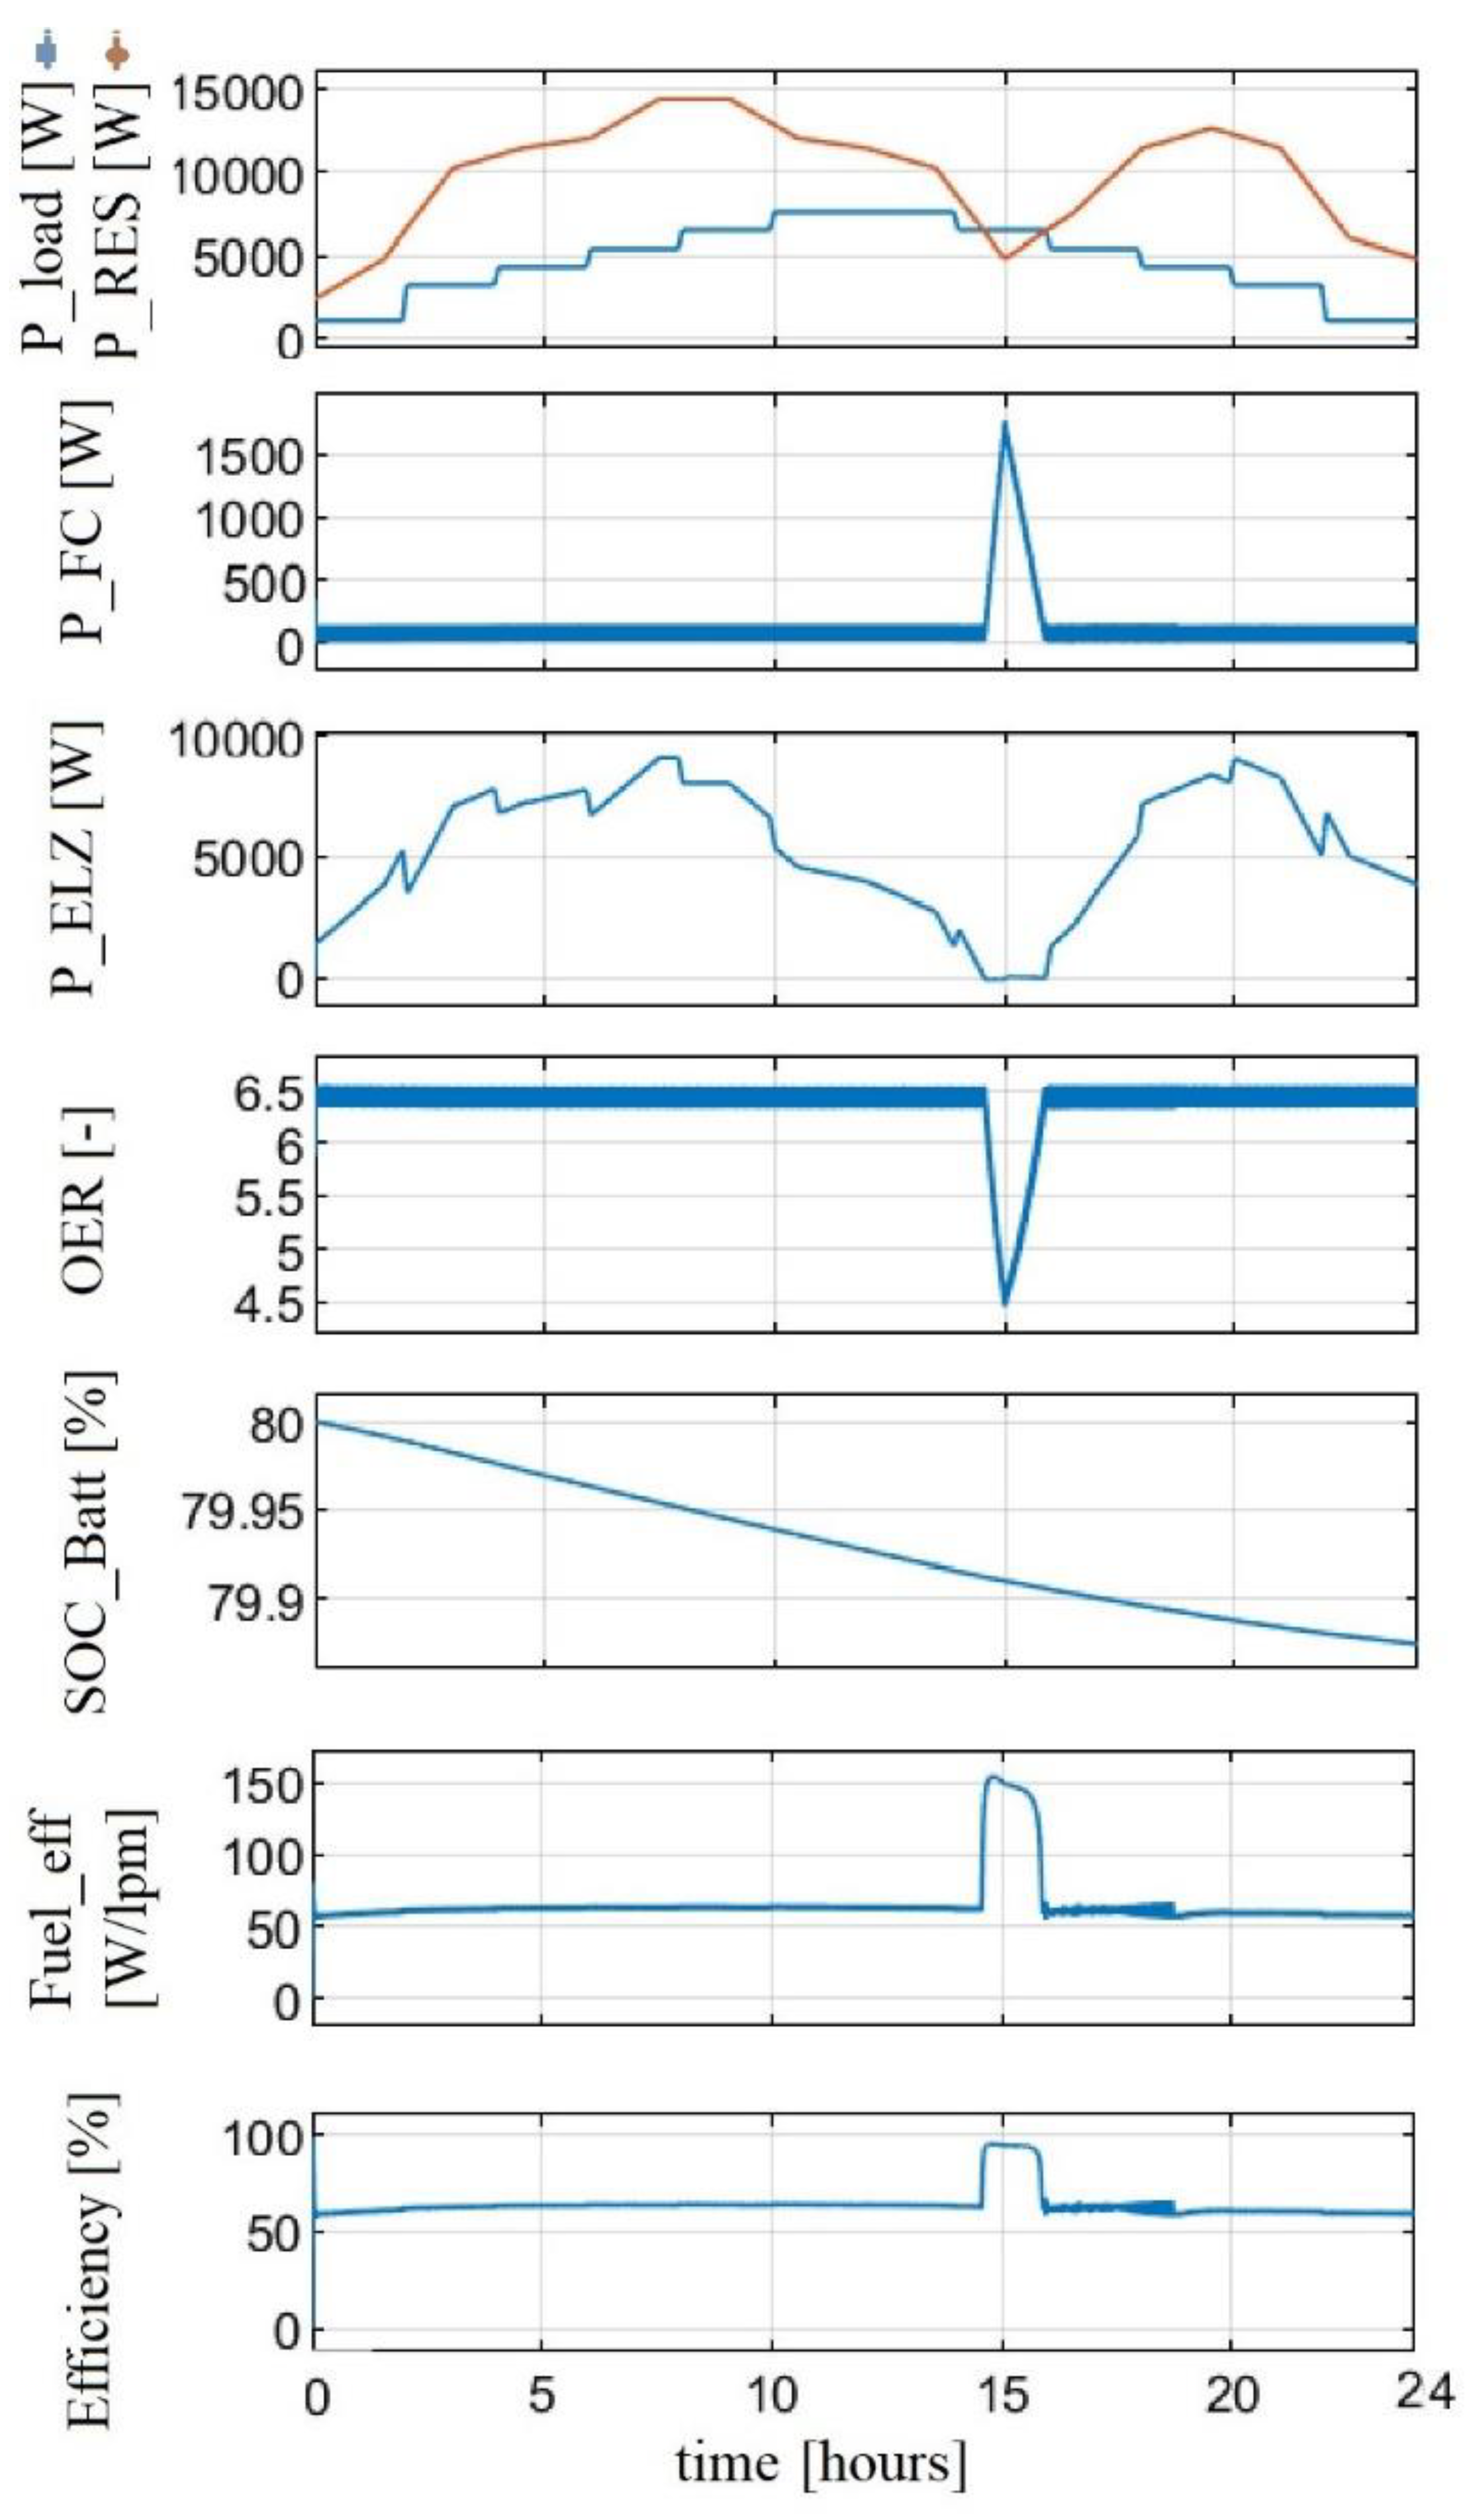
 - When > (see Figure 5): in this case, the ELZ is powered considering (12);
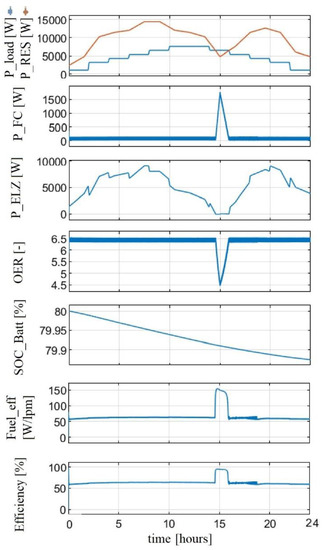 Figure 5. Operation of the charging station based on the FC/ELZ/RES DCmG when pRES > pLoad.
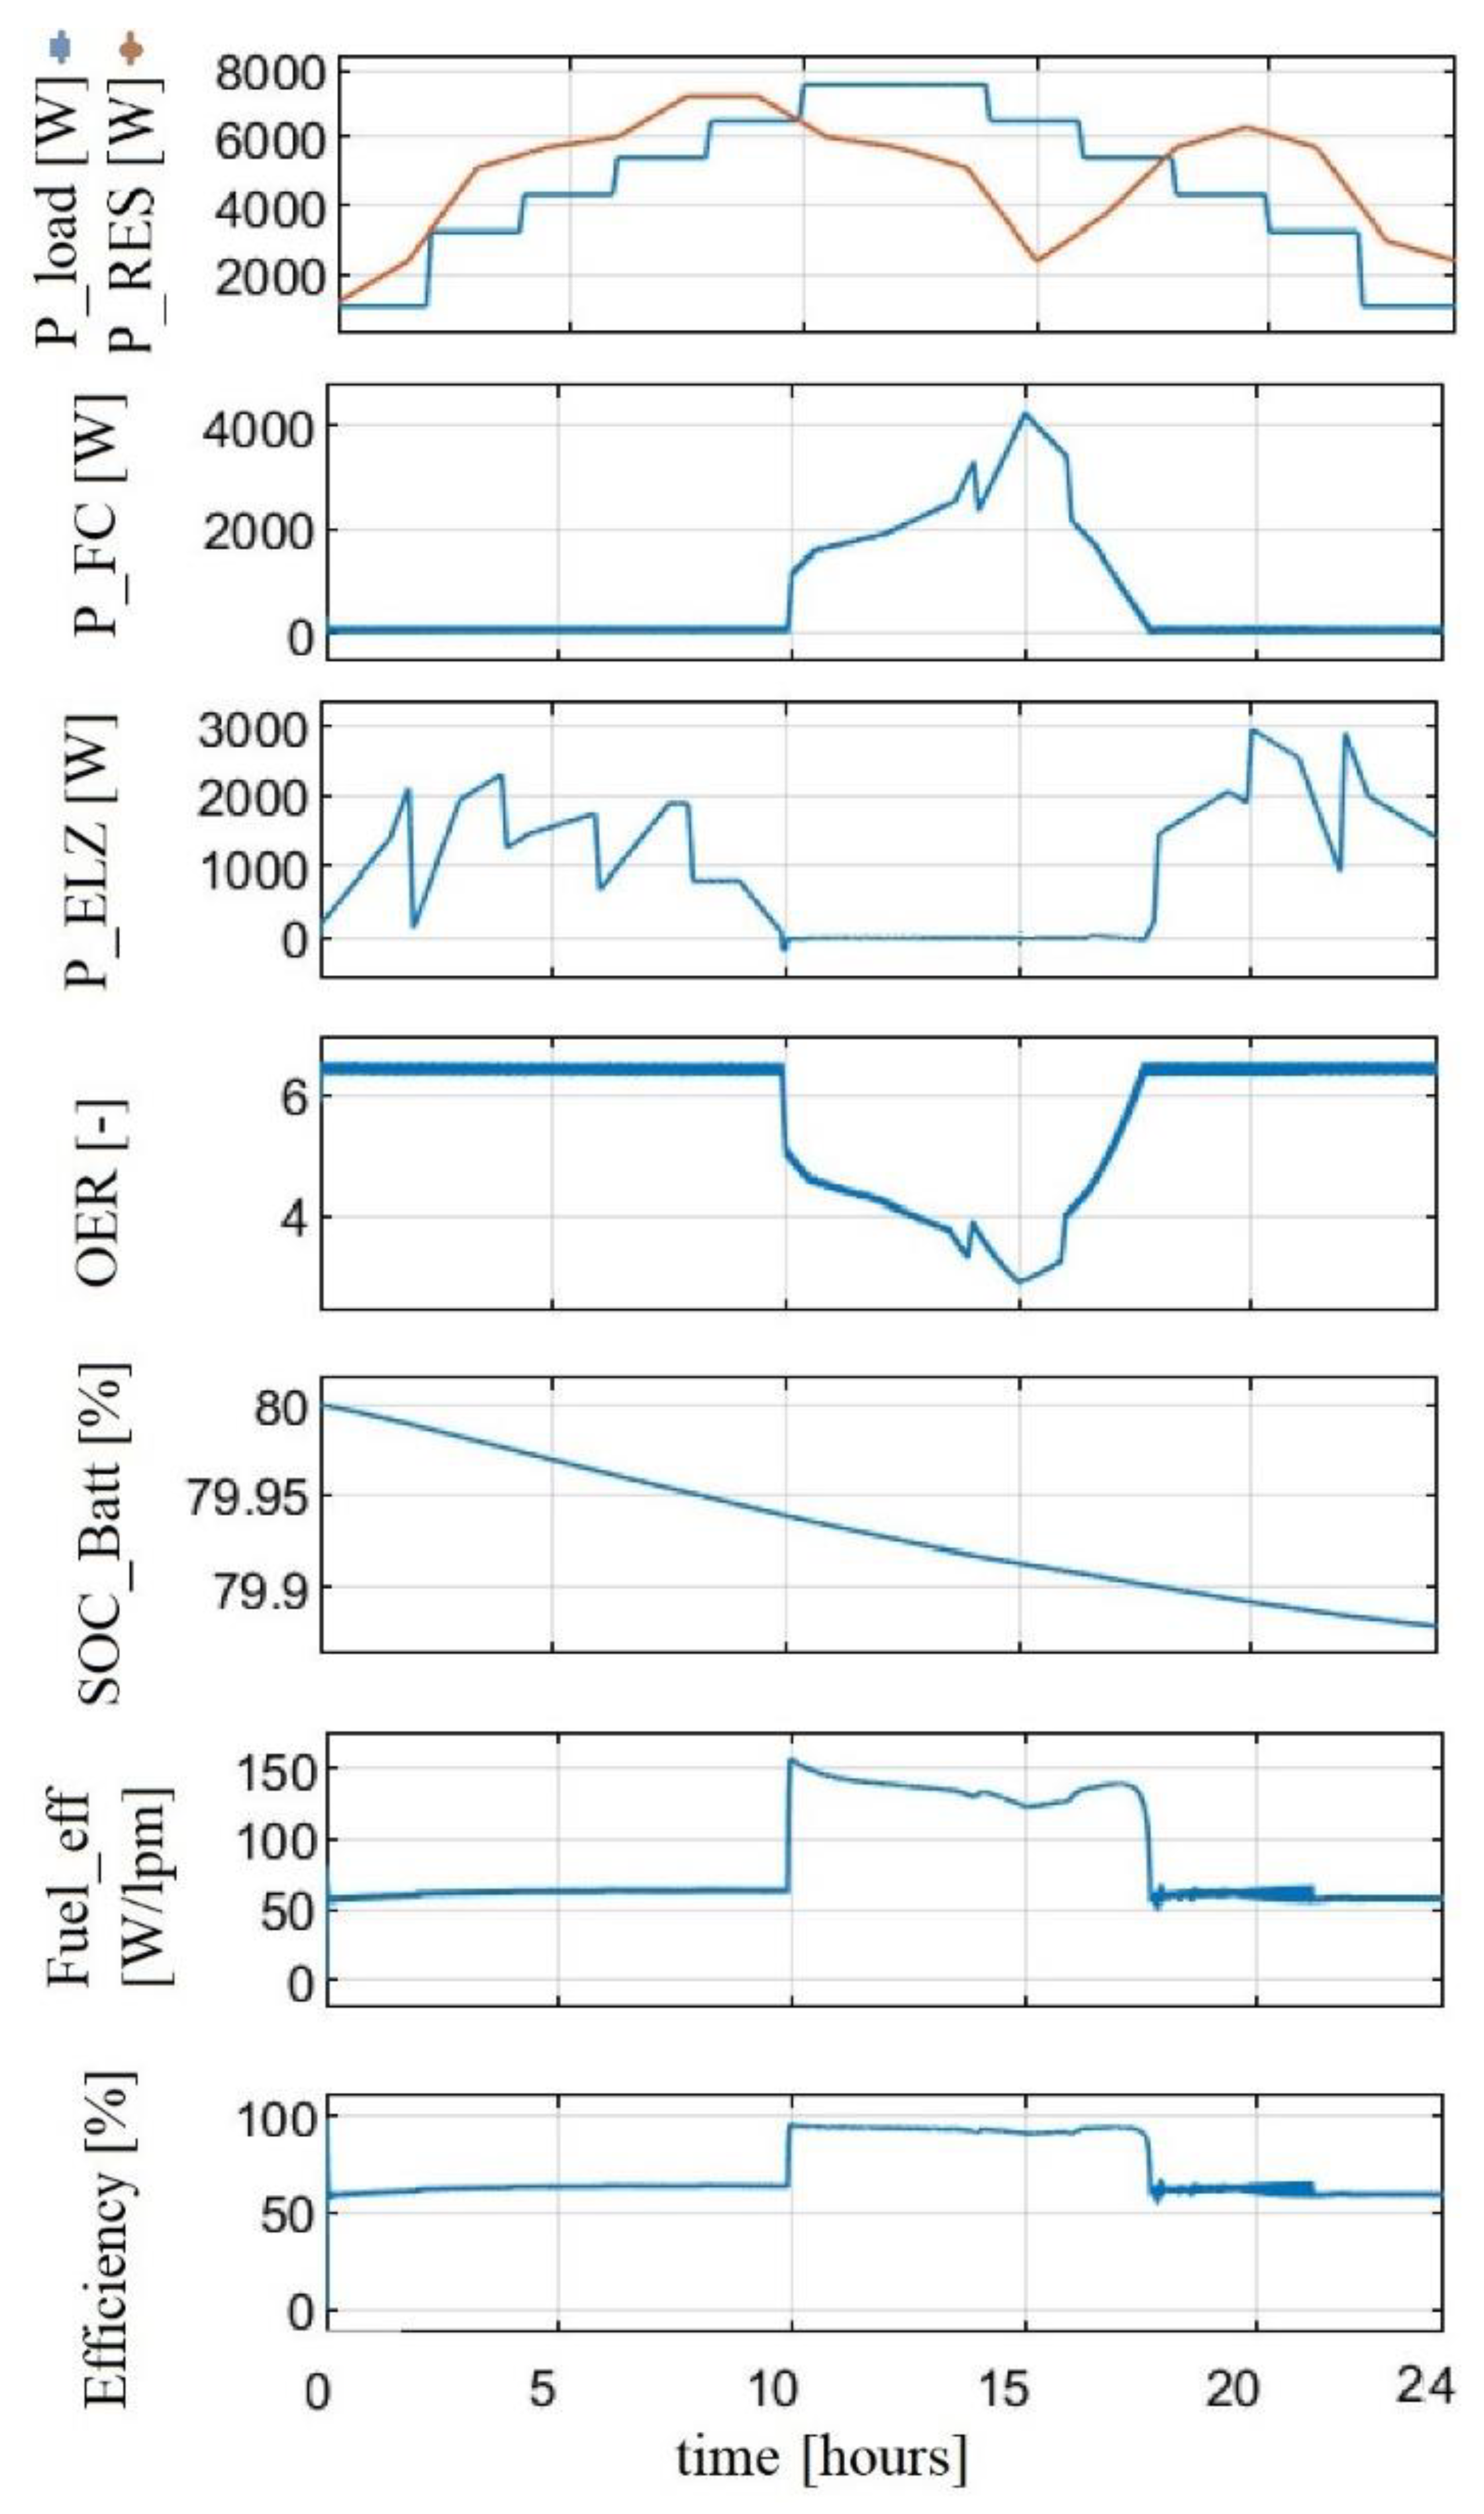
 - When and are comparable, then both FC and ELZ units operate (see Figure 6);
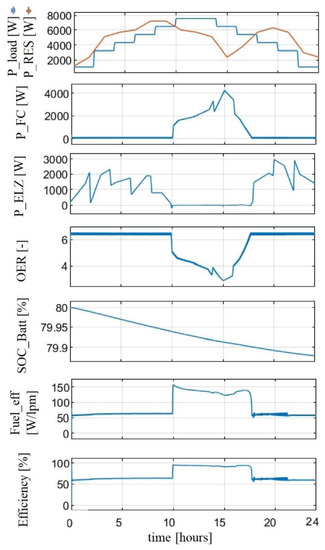 Figure 6. Operation of the charging station based on the FC/ELZ/RES DCmG when and are comparable.
Figure 4, Figure 5 and Figure 6, have the same structure of plots, as follows: Plot 1 shows the and ; Plots 2 and 3 present the and ; Plot 4 shows the oxygen excess ratio (OER); Plot 5 highlights the battery state-of-charge (SOCBatt); the last three plots highlight some FC performance indicators: the total fuel consumption (FuelT) of the FC system during a load cycle, the fuel efficiency (Fueleff), and the FC electrical efficiency. It is worth mentioning that the FC performance may be improved by using appropriate optimization functions considering a mix of these indicators [46], but this aspect is not approached here.
In the first case (Figure 4), , so the SOCBatt remained almost constant (see Plot 5).
The fuel efficiency (Fueleff) was in the range of 100 to 150 W/lpm, the FC efficiency was about 90%, and the FC system was operated safely (OER > 1.5). The ELZ was not powered, except at the start and end of the load cycle, when the FC pack was operated at minimum power, and both the Fueleff and FC efficiency decreased to about 60 W/lpm and 65%.
Plot 2 in Figure 4 shows that when pRES < pLoad, the FC power peak increased but did not exceed the maximum FC power value. In the same period (see Plot 4 in Figure 4), it is evident that the excess oxygen ratio (OER) was greater than 2.5, so the FC system was operating safely. Additionally, Plot 5 in Figure 4 shows how the SOC decreased slowly, so the battery worked in the charge-sustained mode.
In the second case (Figure 5), the ELZ was powered to generate hydrogen for almost the entire load cycle (with one exception, when pRES < pLoad and the FC power increased and decreased with limited slopes). So, the FC system was mainly operated at . Both the Fueleff and FC efficiency increased when the minimum power was set to a higher value of the rated FC power ().
Thus, the ELZ was powered with the excess power given by (18), which is shown in Plot 3 of Figure 5. Additionally, it is worth mentioning that the SOCBatt remains almost constant (see Plot 5 in Figure 5).
In the third case (Figure 6), both the FC system and ELZ were operated based on (15) and (17) to sustain the power flow balance. The FC system was operated at a minimum power chosen to avoid complicated FC system start-up procedures and to maintain the Fueleff and electrical efficiency at set values. Additionally, the SOCBatt remained almost constant (see Plot 5 in Figure 6).
Thus, in all regimes, the OER was higher than the safety limit of 1.5, and the SOCBatt remained almost constant (see Plots 4 and 5 in Figure 6). So, the battery capacity may be less than 10 Ah if used as in the simulation or the battery may even be removed if an ultracapacitor pack is used and controlled by a bidirectional DC-DC converter.
4.3. Performance Evaluation
The maximum daily energy produced by the 8 kW FC system was 8 × 24/0.9 = 213.3 kWh, where 0.9 is the boost converter efficiency. So, the daily energy generated by photovoltaic panels (EPV) was estimated using (13):
The number of needed PV panels is given by (4), as below:
The energy stored () in the batteries is given by (5):
Thus, for the same batteries (Rolls S-1400EX DEEP-CYCLE), the total capacity of the batteries () and the number of needed batteries () are given by (6) and (7), respectively, as below:
So, six PV panels and two batteries were installed.
Table 7 shows the costs of the components for the EVCS based on the FC/ELZ/RES DCmG (EVCS*).
Table 7.
The investment cost for the EVCS based on the FC/ELZ/RES DCmG (EVCS*).
5. Conclusions
Integrating PV energy in a parking lot involves the installation of solar structures that, in addition to generating energy, can provide other facilities such as shading the surrounding area and vehicles [47]. So, the use of PV panels in parking lots for EVs represents safe and efficient investments, with benefits from the point of view of energy savings, the protection of vehicles from bad weather, and the aesthetics of the parking lot. Although many companies want to build solar structures in their parking lots to avoid global warming [48], the cost prevents them from adding them.
This research paper aims to contribute to efficiently implementing RES/FC/ELZ in residential houses and city buildings for EV charging by proposing an EVCS with lower costs than other EVCS designs. The advantages of implementing an RES/FC/ELZ-based EVCS were highlighted by comparing its performance with a reference design for an EVCS based on RES. Thus, the main findings of this research study are as follows:
- The power-following strategy for an RES/FC/ELZ-based EVCS was analyzed in three operating modes, highlighting the effectiveness and safe operation of the FC system;
- The battery capacity for an RES/FC/ELZ-based EVCS using the power-following strategy is about 20 times smaller than the reference design presented here, with the benefit of a smaller size and increased lifespan;
- The investment cost for an RES/FC/ELZ-based EVCS using the power-tracking strategy is about half that of the reference design, with clear benefits for investors.
Further research activities will focus on removing the battery and using an ultracapacitor pack controlled by a bidirectional DC-DC converter to compensate for the power balance in all conditions, using global optimization algorithms to increase the fuel economy, and experimental validation of the proposed strategy will be carried out.
Author Contributions
Conceptualization, F.M.E. and N.B.; methodology, F.M.E. and N.B.; software, F.M.E. and M.S.R.; validation, N.B., M.R., P.T. and F.G.B.; investigation, F.M.E., M.S.R. and N.B.; resources, N.B. and P.T.; data curation, N.B., M.R., and F.G.B.; writing—original draft preparation, F.M.E., F.G.B., M.S.R. and N.B.; supervision, N.B. and P.T.; project administration, N.B.; formal analysis: N.B., F.M.E., M.R., P.T. and F.G.B.; Funding acquisition: N.B. and P.T.; Visualization: N.B., F.G.B., M.R. and M.S.R.; writing—review and editing: N.B., P.T., F.G.B., M.R. and F.M.E. All authors have read and agreed to the published version of the manuscript.
Funding
This work was supported in part by the Framework Agreement between the University of Pitesti (Romania) and King Mongkut’s University of Technology North Bangkok (Thailand), in part by an International Research Partnership “Electrical Engineering—Thai French Research Center (EE-TFRC)” under the project framework of the Lorraine Université d’Excellence (LUE) in cooperation between Université de Lorraine and King Mongkut’s University of Technology North Bangkok, and in part by the National Research Council of Thailand (NRCT) under the Senior Research Scholar Program, Grant No. N42A640328.
Institutional Review Board Statement
Not applicable.
Informed Consent Statement
Not applicable.
Data Availability Statement
Not applicable.
Conflicts of Interest
The authors declare no conflict of interest.
Appendix A
Table A1.
Technical characteristics of photovoltaic panel type SIV SERIES 535W monocrystalline PERC.
Table A1.
Technical characteristics of photovoltaic panel type SIV SERIES 535W monocrystalline PERC.
| Technical Characteristics | Values | Unit |
|---|---|---|
| Nominal voltage, | 52.83 | V |
| Nominal current, | 16.2 | A |
| Short-circuit current, ISC | 17.5 | A |
| Open-circuit voltage, VOC | 64.2 | V |
| Nominal power, | 500 | Wp |
| Efficiency, η | 19.5 | % |
| Mass | 26 | kg |
| Dimensions (L × W × H) | 1956 × 1310 × 45 | mm |
| Operating temperature | −40 to 85 | °C |
| (α) Temperature coefficient of ISC | 0.03 | %/°C |
| (β) Temperature coefficient of VOC | −0.34 | %/°C |
| (γ) Temperature coefficient of | −0.43 | %/°C |
References
- Hemavathi, S.; Shinisha, A. A study on trends and developments in electric vehicle charging technologies. J. Energy Storage 2022, 52, 105013. [Google Scholar] [CrossRef]
- Ho, J.; Huang, Y.-H. Evaluation of electric vehicle power technologies: Integration of technological performance and market preference. Clean. Responsible Consum. 2022, 5, 100063. [Google Scholar] [CrossRef]
- RNarasipuram, P.; Mopidevi, S. A technological overview & design consideration for developing electric vehicle charging stations. J. Energy Storage 2021, 43, 103225. [Google Scholar]
- HDas, S.; Rahman, M.; Li, S.; Tan, C. Electric vehicles standards, charging infrastructure, and impact on grid integration: A technological review. Renew. Sustain. Rev. 2020, 120, 109618. [Google Scholar]
- Unterluggauer, T.; Rich, J.; Andersen, P.; Hashemi, S. Electric vehicle charging infrastructure planning for integrated transportation and power distribution networks: A review. ETransportation 2022, 12, 100163. [Google Scholar] [CrossRef]
- GOsorio, J.; Gough, M.; Lotfi, M.; Santos, S.; Espassandium, H.; Shafie-khah, M.; Catalo, J. Rooftop photovoltaic parking lots to support electric vehicles charging: A comprehensive survey. Electr. Power Energy Syst. 2021, 133, 107274. [Google Scholar]
- Bhatti, A.; Salam, Z.; Aziz, M.; Yee, K.; Ashique, R. Electric vehicles charging using photovoltaic: Status and technological review. Renew. Sustain. Rev. 2016, 54, 34–47. [Google Scholar] [CrossRef]
- Bhatti, A.R.; Salam, Z.; Ashique, R. Electric Vehicle Charging Using Photovoltaic based Microgrid for Remote Islands. Energy Procedia 2016, 103, 213–218. [Google Scholar] [CrossRef]
- Zhang, M.Y.L.; Zhao, Z.; Wang, L. Comprehensive benefits analysis of electric vehicle charging station integrated photovoltaic and energy storage. J. Clean. Prod. 2021, 302, 126967. [Google Scholar]
- Aluisio, B.; Dicorato, M.; Ferrini, I.; Forte, G.; Sbrizzai, R.; Trovato, M. Planning and reliability of DC microgrid configurations for Electric Vehicle Supply Infrastructure. Electr. Power Energy Syst. 2021, 131, 107104. [Google Scholar] [CrossRef]
- Verma, A.; Singh, B.; Chandra, A. Al-Haddad. An Implementation of Solar PV Array Based Multifunctional EV Charger. IEEE Trans. Ind. Appl. 2020, 56, 4166–4178. [Google Scholar]
- Ouammi, A. Peak load reduction with a solar PV-based smart microgrid and vehicle-to-building (V2B) concept. Sustain. Energy Technol. Assess. 2021, 44, 101027. [Google Scholar] [CrossRef]
- Mahfouz, M.; Iravani, R. Autonomous Operation of the DC Fast-Charging Station. IEEE Trans. Ind. Electron. 2022, 69, 3787–3797. [Google Scholar] [CrossRef]
- Chang, S.; Niu, Y.; Jia, T. Coordinate scheduling of electric vehicles in charging stations supported by microgrids. Electr. Power Syst. Res. 2021, 199, 107418. [Google Scholar] [CrossRef]
- Daryabari, M.; Keypour, R.; Golmohamadi, H. Robust self-scheduling of parking lot microgrids leveraging responsive electric vehicles. Appl. Energy 2021, 290, 116802. [Google Scholar] [CrossRef]
- Dicorato, M.; Forte, G.; Trovato, M.; Munoz, C.B.; Coppola, G. An Integrated DC Microgrid Solution for Electric Vehicle Fleet Management. IEEE Trans. Ind. Appl. 2019, 55, 7347–7355. [Google Scholar] [CrossRef]
- Mahfouz, M.; Iravani, M. Grid-Integration of Battery-Enabled DC Fast Charging Station for Electric Vehicles. IEEE Trans. Energy Convers. 2020, 35, 375–385. [Google Scholar] [CrossRef]
- Singh, S.; Chauhan, P.; Singh, N. Feasibility of Grid-connected Solar-wind Hybrid System with Electric Vehicle Charging Station. J. Mod. Power Syst. Clean Energy 2021, 9, 295–306. [Google Scholar] [CrossRef]
- Shaaban, M.; Mohamed, S.; Ismail, M.; Qaraqe, K.; Serpedin, E. Joint Planning of Smart EV Charging Stations and DGs in Eco-Friendly Remote Hybrid Microgrids. IEEE Trans. Smart Grid 2019, 10, 5819–5830. [Google Scholar] [CrossRef]
- Kajanova, M.; Bracinik, P. Social welfare-based charging of electric vehicles in the microgrids fed by renewables. Electr. Power Energy Syst. 2022, 138, 107974. [Google Scholar] [CrossRef]
- Available online: https://www.panourisolareconstanta.ro/harta-radiatia-solara-in-romania (accessed on 16 November 2022).
- Shahzad, U. Critical Analysis for Solar Cell Models Using System Advisor Model Simulations. J. Electr. Eng. Electron. Control. Comput. Sci.-JEEECCS 2023, 9, 23–32. [Google Scholar]
- Enescu, F.; Bizon, N.; Hoarca, C.I. Energy management of the grid connected PV array. In Microgrid Arhitectures, Control and Protection Methods; Tabatabaei, N.M., Kabalci, E., Bizon, N., Eds.; Springer: London, UK, 2020; Chapter 11; pp. 255–288. [Google Scholar] [CrossRef]
- Available online: https://www.nrcan.gc.ca/maps-tools-and-publications/tools/modelling-tools/retscreen/7465 (accessed on 20 December 2022).
- Singh, A.; Shaha, S.S.; Nikhil, P.G.; Sekhar, Y.R.; Saboor, S.; Ghosh, A. Design and Analysis of a Solar-Powered Electric Vehicle Charging Station for Indian Cities. World Electr. Veh. J. 2021, 12, 132. [Google Scholar] [CrossRef]
- Cheikh-Mohama, S.; Sechilariu, M.; Locment, F.; Krim, Y. PV-Powered Electric Vehicle Charging Stations: Preliminary Requirements and Feasibility Conditions. Appl. Sci. 2021, 11, 1770. [Google Scholar] [CrossRef]
- Available online: https://www.auto-data.net/en/dacia-spring-27.4-kwh-45hp-electric-41464 (accessed on 16 November 2022).
- Available online: https://www.auto-spec.ro/hyundai-ioniq (accessed on 16 November 2022).
- Available online: https://www.renault.ro/vehicule-electrice/zoe/date-tehnice.html (accessed on 16 November 2022).
- Available online: https://www.auto-data.net/en/volkswagen-golf-model-896 (accessed on 16 November 2022).
- Available online: https://ro.autodata24.com/opel/corsa/corsa-e-hatchback-5d/details (accessed on 16 November 2022).
- Available online: https://www.parcaripitesti.ro/ (accessed on 16 November 2022).
- Filote, C.; Felseghi, R.-A.; Raboaca, M.S.; Aşchilean, I. Environmental impact assessment of green energy systems for power supply of electric vehicle charging station. Int. J. Energy Res. 2020, 44, 10471–10494. [Google Scholar] [CrossRef]
- Raboaca, M.; Felseghi, R.; Filote, C. Optimal configuration of an electric vehiclecharging station powered by wind energy. In Proceedings of the International Multidisciplinary Scientific GeoConference: SGEM 20, Varna City, Bulgaria, 16–25 August 2020; pp. 137–144. [Google Scholar]
- Ahmed, S.A.M.; El Sattar, M.A. Dynamic Performance and Effectiveness of Voltage Disturbances on the Improvement of Power Quality for Grid-Connected DFIG System Based Wind Farm. J. Electr. Eng. Electron. Control. Comput. Sci.-JEEECCS 2020, 5, 25–30. [Google Scholar]
- Ruchpaul, R.S. Performance Comparison of three PV Technologies under the Effect of Partial Shading and Varying Tilt Angles. J. Electr. Eng. Electron. Control. Comput. Sci.-JEEECCS 2020, 6, 9–18. [Google Scholar]
- Bizon, N. Optimal Operation of Fuel Cell / Wind Turbine Hybrid Power System under Turbulent Wind and Variable Load. Appl. Energy 2018, 212, 196–209. [Google Scholar] [CrossRef]
- Shahzad, U. Application of Machine Learning for Optimal Wind Farm Location. J. Electr. Eng. Electron. Control. Comput. Sci. 2022, 8, 1–8. [Google Scholar]
- Bizon, N. Optimization of the Fuel Cell Renewable Hybrid Power Systems; Springer: London, UK, 2020. [Google Scholar]
- Bizon, N. A new Topology of Fuel Cell Hybrid Power Source for Efficient Operation and High Reliability. J. Power Sources 2011, 196, 3260–3270. [Google Scholar] [CrossRef]
- Bizon, N. Real-time optimization strategies of FC Hybrid Power Systems based on Load-following control: A new strategy and a comparative study of topologies and fuel economy obtained. Appl. Energy 2019, 241C, 444–460. [Google Scholar] [CrossRef]
- Bizon, N. Tracking the maximum efficiency point for the FC system based on extremum seeking scheme to control the air flow. Appl. Energy 2014, 129, 147–157. [Google Scholar] [CrossRef]
- Rai, A.K.; Jandhyala, C.; Shantharama, C. Power Intelligence and Asset Monitoring for System. J. Electr. Eng. Electron. Control. Comput. Sci. (JEEECCS) 2019, 5, 31–36. [Google Scholar]
- Pukrushpan, J.; Stefanopoulou, A.; Peng, H. Control of Fuel Cell Power Systems; Springer: New York, NY, USA, 2004. [Google Scholar]
- Etouke, P.O.; Nneme, L.N.; Mbihi, J. An Optimal Control Scheme for a Class of Duty-Cycle Modulation Buck Choppers: Analog Design and Virtual Simulation. J. Electr. Eng. Electron. Control. Comput. Sci.-JEEECCS 2020, 6, 13–20. [Google Scholar]
- Kom, C.H. Understanding Interphase Power Controller: A Description. J. Electr. Eng. Electron. Control. Comput. Sci.-JEEECCS 2020, 6, 19–24. [Google Scholar]
- How Solar Power Is the Future of Parking Lots. Available online: https://www.vpslp.com/about/insights/how-solar-power-is-the-future-of-parking-lots? (accessed on 16 November 2022).
- Global warming of 1.5 °C, Intergovernmental Panel on Climate Change Report. Available online: https://www.ipcc.ch/site/assets/uploads/sites/2/2019/06/SR15_Full_Report_High_Res.pdf (accessed on 16 November 2022).

Disclaimer/Publisher’s Note: The statements, opinions and data contained in all publications are solely those of the individual author(s) and contributor(s) and not of MDPI and/or the editor(s). MDPI and/or the editor(s) disclaim responsibility for any injury to people or property resulting from any ideas, methods, instructions or products referred to in the content. |
© 2023 by the authors. Licensee MDPI, Basel, Switzerland. This article is an open access article distributed under the terms and conditions of the Creative Commons Attribution (CC BY) license (https://creativecommons.org/licenses/by/4.0/).