Article

Two-Phase Modeling and Simulations of a Polymer Electrolyte Membrane Water Electrolyzer Considering Key Morphological and Geometrical Features in Porous Transport Layers

Department of Mechanical Engineering, Inha University, Incheon 22212, Republic of Korea
*
Author to whom correspondence should be addressed.
Energies 2023, 16(2), 766; https://doi.org/10.3390/en16020766
Submission received: 16 December 2022 / Revised: 2 January 2023 / Accepted: 6 January 2023 / Published: 9 January 2023

Abstract

:
Polymer electrolyte membrane (PEM) electrolysis has a promising future for large-scale hydrogen production. As PEM electrolysis technology develops, larger operating current densities are required. In order to increase current density, more water should be available at the reaction sites. Moreover, the removal rate of oxygen and hydrogen needs to be effectively improved. This, in turn, necessitates a better understanding of the main mass transport and electrochemical processes. On the anode side, mass transport is particularly crucial because water must be supplied to the catalyst layer (CL) while, at the same time, oxygen bubbles must be eliminated in a parallel flow from the reaction sites into the flow channels. Hence, simulating the two-phase bubbly flow across the cell thickness is necessary to predict PEM electrolysis performance more accurately as a function of the operating current density. This study provides a systematic understanding of how morphological and geometrical features contribute to the polarization curve and performance characteristics of a PEM electrolysis cell. Hence, a multi-phase PEM electrolysis model has been implemented using MATLAB R2022a. Polarization curves have been calibrated against experimental data and then assessed to provide a fundamental understanding of the relationship between the two-phase flow and cell performance.

1. Introduction

Alkaline water electrolysis is the most capital-efficient method of producing hydrogen at the moment. It is a reliable and sophisticated technology. However, polymer electrolyte membrane (PEM) electrolysis has greatly improved in terms of cost efficacy, robustness, and implementation feasibility. This makes PEM electrolysis an attractive option for large-scale hydrogen generation, particularly for storing energy in combination with renewable electricity sources, where PEM electrolysis presents significant advantages over alkaline electrolysis [1]. Along with developing new materials for reducing the total cost of the PEM electrolysis and rapid commercialization, a deeper comprehension of the key mass transport and electrochemical processes must be acquired for more accurate predictions. Currently, mathematical models play an important role in facilitating a dynamic connection between the electrolysis system and the intermittent electrical source [2]. As PEM electrolysis technologies mature, even elevated operating current densities are attained. Moreover, owing to safety concerns, operating the cell under high pressure needs high operational current densities [3]. In order to increase the current density, the hydrogen and oxygen removal rates and water availability at the reaction sites must be effectively improved. On the anode side, mass transport is more crucial because water must be carried to the catalyst layer while, concurrently, oxygen must be carried in parallel flow from the reaction sites into the flow channels [1,4].
The porous transport layer (PTL) serves the following purposes: it provides strong mechanical strength, minimal interfacial losses, excellent electrical and thermal conductivity, and support for the flexible catalyst-coated membrane, particularly during operating under a pressure gradient. Additionally, during prolonged operation, the PTL must tolerate the corrosive environment on the anode side without forming a passivating layer that would degrade the PTL [1]. Toghyani et al. [5] studied the effects of operating conditions and design parameters on the performance of high-temperature PEM electrolysis cells. The PTL thickness ranged from 0.2 mm to 0.5 mm at a voltage of 1.65 V, resulting in a decreasing range of current densities from 0.426 A cm−2 to 0.409 A cm−2. A PEM electrolysis cell with a membrane thickness of 50 mm operating at a voltage of 1.6 V reported a 48% higher current density compared with the same cell with a membrane thickness of 200 mm.
Facilitating the two-phase opposing flow of the gas toward the flow channels and water toward the catalyst-coated membrane is another crucial purpose of the PTL. Therefore, the PTL’s microstructure should be improved while considering the trade-off between electron and mass transfer, with thermal performance, mechanical strength, electrical conductivity, and excellent surface contacts as additional restrictions [6,7]. Two-phase flow modeling provides the ability to quickly and affordably predict the impacts of changes in geometry or physical parameters. However, only a small number of studies have offered detailed PEM electrolysis models with two-phase flow. Han et al. [8] developed a two-phase transport model to study the distribution of liquid water within PTL. The effects of PTL properties (porosity, contact angle, and pore size) on the two-phase transport mechanisms were studied. Moreover, the influence of two-phase transport on the overall performance of a PEM electrolysis cell was assessed. Lee et al. [9] studied the influence of contact angle, pore size, and porosity of a PTL-catalyst-coated membrane on two-phase transport under different operating conditions. The authors strongly recommended the implementation of a backing layer, or a microporous layer (MPL), for enhancing the mass transport as well as the interfacial contact between component layers. Based on the concept of an MPL, PTLs with graded porosity that increases toward the flow channels have shown to be effective in PEM fuel cells [10,11]. For PEM electrolysis cells, Kang et al. [12] provided a steady decline in the size of PTL pores by proposing dual-layer PTLs with various pore sizes. The performance was improved by utilizing an improvement layer, which resulted from reduced ohmic resistance and diffusion losses due to the higher number of active sites for the oxygen evolution reaction (OER).
For PEM fuel cells, it has been shown to be practical, stable, and performance-enhancing to add a hydrophobic substance, such as PTFE, to the surface of PTL. The chemical treatment of the surface alters the contact angle of water and gas, favoring the transport of either one in specific areas or across the entire active area [13,14]. So far, limited studies have worked on adjusting the PTL wettability of PEM electrolysis cells [15,16]. The performance of PEM electrolysis utilizing PTFE-treated Toray carbon paper was studied by Kang et al. [17], who showed that performance decreased with increasing hydrophobicity (PTFE content). Using a femtosecond laser, Suermann et al. [18] showed how to generate a high-surface structure on a fibrous titanium PTL, which results in a performance improvement by lowering contact resistance.
Water is transferred through PEMs via diffusion and electro-osmotic drag. Therefore, the level of membrane hydration strongly influences the transport of water and protons. It also affects the lifespan and physical attributes of the membrane [1]. Marangio et al. [19] conducted a comprehensive study on the effects of pressure and temperature on the diffusion coefficient of hydrogen ions. As anticipated, increasing the temperature resulted in a subsequent increase in the diffusion coefficient of hydrogen ions in the PEM. This coefficient is reduced with increasing pressure. Any variation in the membrane thickness of PEM electrolysis cell leads to various diffusion and ohmic losses. Moreover, membrane thickness influences the gases’ cross-over during the electrolysis process and can cause a high risk of mixing hydrogen and oxygen on the anode side, which is dangerous for the overall system performance [4]. Han et al. [20] developed an ohmic loss model for PEM electrolysis. They studied the influence of various operational and design parameters, namely operating pressure, temperature, exchange current density, membrane thickness, electrode thickness, and interfacial resistance, on the performance of PEM electrolysis. Any increase in the operating temperature boosts the performance of the cell; however, increasing the pressure of the cell and the thickness of the membrane leads to negative impacts.
In this paper, we present a rigorous two-phase PEM electrolysis model to investigate the impact of morphological and geometrical features of PTLs on the polarization and performance behavior of PEM electrolysis under various PTL designing and cell operating conditions. The model is first validated against the experimental data measured under different operating temperatures and current densities and further simulated to elucidate the impact of key design variables of PTL and membrane, such as porosity, permeability, thickness, and contact angle. Polarization curves are calibrated against experimental data and then assessed to provide a fundamental understanding of the relationship between the two-phase flow behavior and cell performance, providing PEM electrolysis design guidelines under various operational settings.

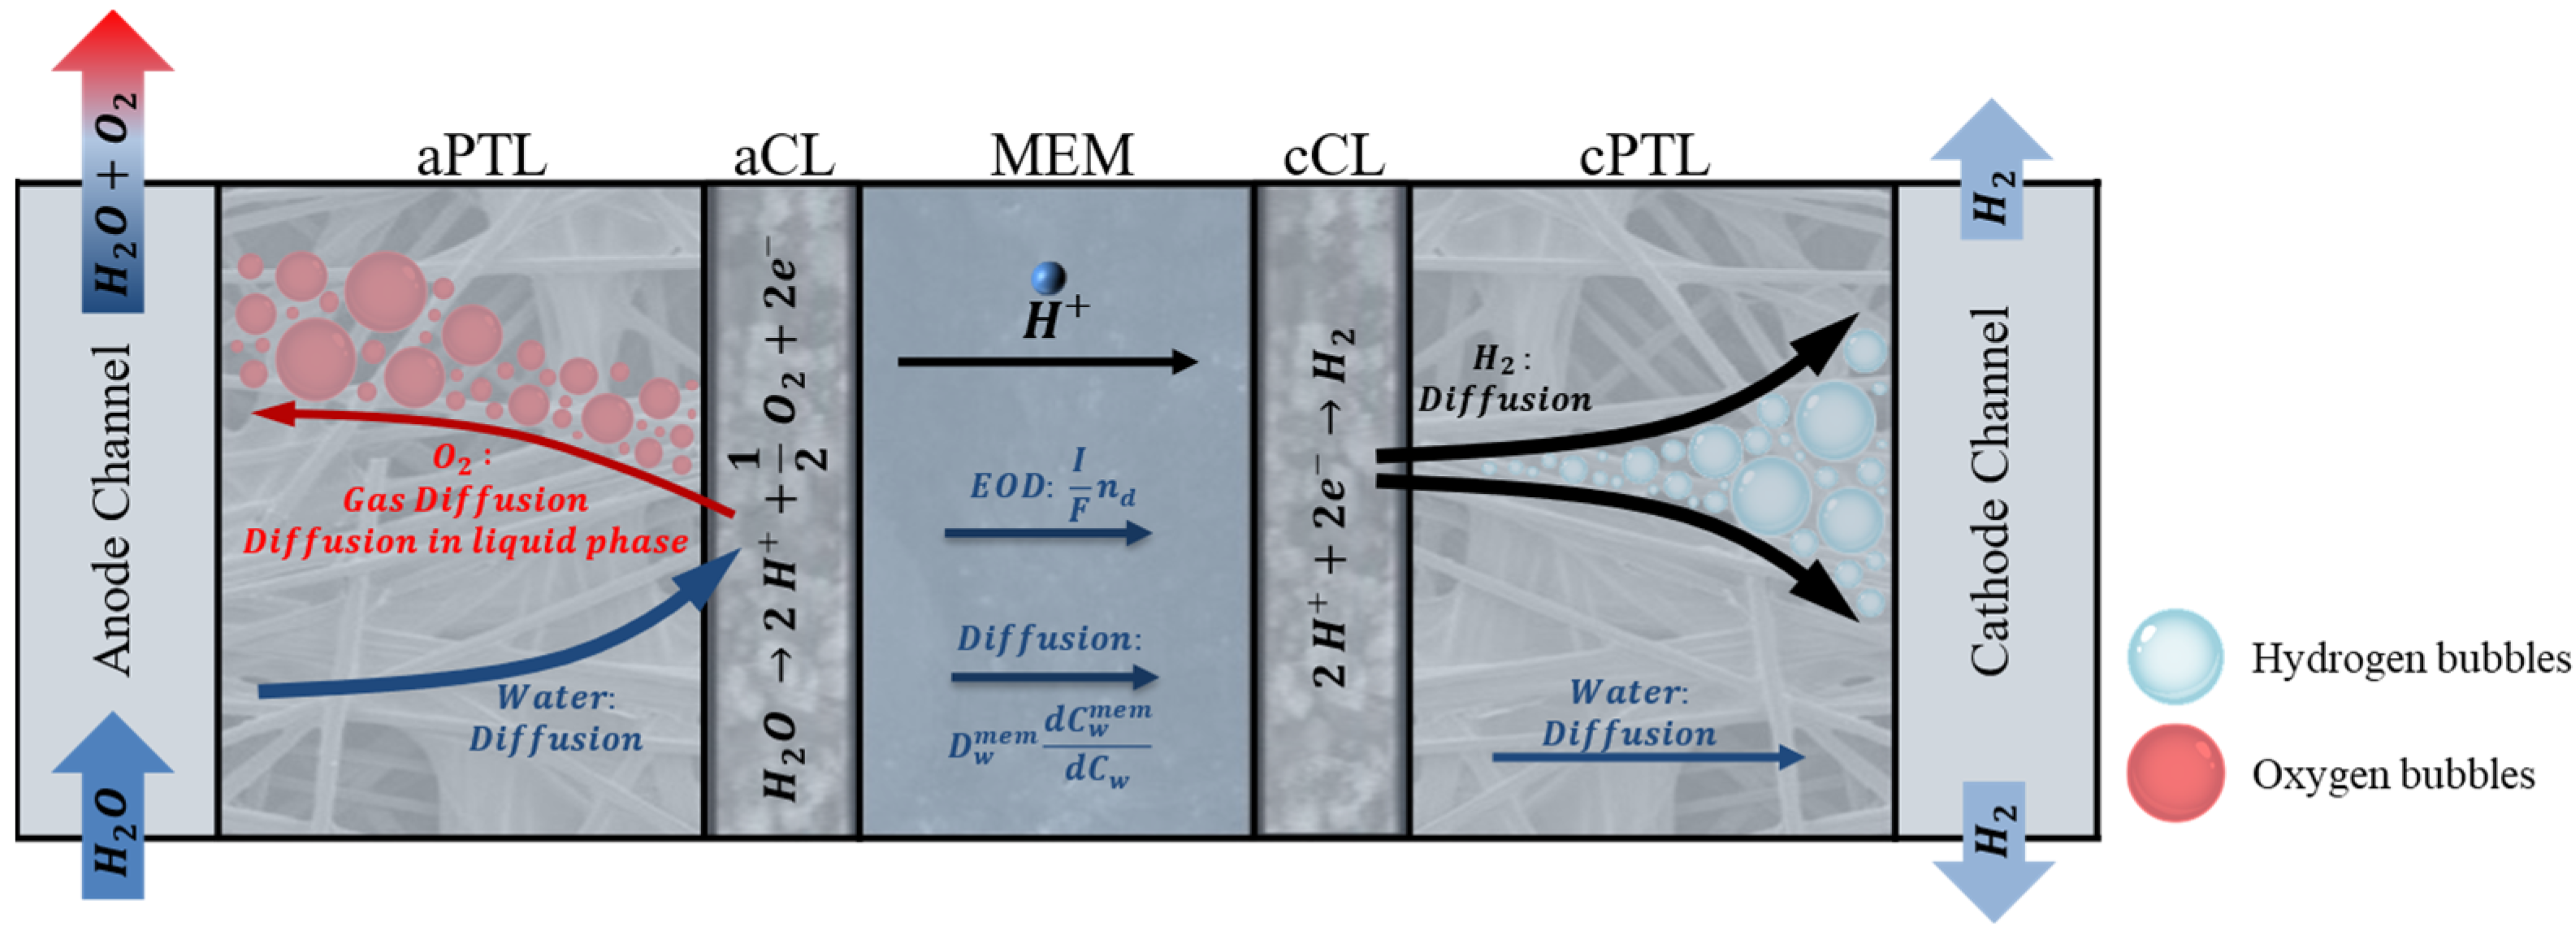
2. Multi-Phase PEM Electrolysis Model

A steady state, one-dimensional (1D), multi-phase PEM electrolysis model has been developed in this work. Figure 1 outlines the main components of the present study including PTLs, CLs, and the proton conductive membrane. The PTL carries liquid water from the channel to the anode CL (aCL), wherein the OER occurs, and then drains out the product oxygen gas. Protons produced from OER along with water travel through the membrane to the cathode side, and then the hydrogen evolution reaction (HER) occurs at the cathode CL (cCL). The product hydrogen gas must be driven out to the cathode channel. Therefore, a 1D geometry was used to analyze the species’ transport within the cell thickness. Section 2.1 lists the model assumptions, and Section 2.2 recaps governing equations. The aforementioned PEM electrolysis model was implemented using MATLAB R2022a.

2.1. Model Assumptions

The 1D multi-phase PEM electrolysis model was developed based on the following assumptions:
  • Ideal gas law was assumed for gas mixtures because of the low pressure in the cell;
  • A laminar and incompressible flow was considered for the gaseous phase;
  • Effects of gravity were neglected;
  • Porous components, including PTLs and CLs, were assumed to be isotropic and were represented using effective porosity and permeability;
  • The effect of bubble blockage on cell performance was neglected. Under this assumption, only tiny bubbles form and travel easily through the anode PTL (aPTL).

2.2. Governing Equations

As per the assumptions above, the following species conservation equations have been considered:
For H 2 and O 2 where C i < C bn ,   i :
0 = x D i e f f C i x + S i
For H 2 and O 2 where C i > C bn ,   i :
0 = x D i e f f C i x x m f i g M i   C i l ρ l   j g   + S i
For C w in anode:
0 = x D w e f f C w l x + S w
For C w < C w sat in cathode:
0 = x D w e f f C w g x + S w
And for C w > C w sat in cathode:
0 = x D w e f f C w g x x m f i l M i   C i g ρ g   j l   + S w
The source terms and boundary conditions for the aforementioned species equations are listed in Table 1.
The correlations for the water transport in the electrolyte have been summarized in Equations (12) through (17).
Saturation pressure for water vapor ( P s a t ) b a r :
log 10 P s a t = 2.1794 + 0.02953 T 273.15 9.1837 × 10 5 T 273.15 2   + 1.4454 × 10 7 T 273.15 3
Membrane water content (λ):
λ g = 0.043 + 17.81 a 39.85 a 2 + 36.0 a 3         for   0 < a 1 λ l = 22
Where a is defined as:
a = C w g R u T P s a t
Electro-osmotic drag (EOD) coefficient of water ( n d ):
n d = 2.5 λ 22
Proton conductivity (κ) [ S   m 1 ]:
κ = 0.5139 λ 0.326 exp 1268 1 303 1 T
Water diffusion coefficient ( D w m e m ) [ m 2   s 1 ]:
D w m e m = 2.692661843 · 10 10 f o r   λ 2 0.87 3 λ + 2.95 λ 2 } · 10 10 · e 7.9728 2416 / T   f o r   2 < λ 3 2.95 4 λ + 1.642454 λ 3 · 10 10 · e 7.9728 2416 / T f o r   3 < λ 4 2.563 0.33 λ + 0.0264 λ 2 0.000671 λ 3 · 10 10 · e 79728 2416 / T f o r   4 < λ λ a = 1 g
The multi-phase model used in this study implements the following equations.
Mixture density kg   m 3 :
ρ = ρ l s l + ρ g 1 s l
Gas mixture density kg   m 3 :
ρ g = P R u T 1 i m i g M i
Mixture velocity kg   m 2   s 1 :
ρ u = ρ l u l + ρ g u g
Mixture mass fraction:
m i = ρ l s l m i l + ρ g 1 s l m i g ρ
Relative permeability:
k r l = s l 3
k r g = ( 1 s l ) 3
Mixture kinematic Viscosity m 2   s 1 :
v = k r l v l + k r g v g 1
Gas composition:
v g = μ g ρ g = 1 ρ g i = 1 n x i μ i j = 1 n x j ϕ i j
ϕ i j = 1 8 1 + M i M j 1 / 2 1 + μ i μ j 1 / 2 M j M i 1 / 4 2
μ i N   s   m 2 = μ H 2 = 0.21 × 10 6 T 0.66 μ w = 0.00584 × 10 6 T 1.29 μ N 2 = 0.237 × 10 6 T 0.76 μ O 2 = 0.246 × 10 6 T 0.78
Relative mobility:
λ l = k r l v l v
λ g = 1 λ l
Diffusive mass flux of liquid phase kg   m 2   s 1 :
j l = ρ l u l λ l ρ u = K v λ l λ g P c a p
Diffusive mass flux of gas phase kg   m 2   s 1 :
j g = ρ g u g λ g ρ u = K v λ l λ g P c a p
Capillary pressure in anode [Pa]:
P c a p = P g P l = 2 σ r b b l O 2
Capillary pressure in cathode [Pa]:
P c a p = P g P l = σ cos θ ε K 1 / 2 J s l
Leverett function for water in the cathode:
J s l = 1.417 1 s l 2.120 ( 1 s l ) 2 + 1.263 ( 1 s l ) 3 1.417 s l 2.120 s l 2 + 1.263 s l 3 if     θ   < 90 if   θ   > 90
Volume fraction of gas phase in the anode:
s g = C O 2   M O 2 ρ O 2 g
Volume fraction of liquid phase in the anode:
s l = 1 s g
Volume fraction of liquid phase in the cathode:
s l = C w C w s a t ρ l M w C w s a t
Volume fraction of gas phase in the cathode:
s g = 1 s l
It should be noted that D i e f f in Equations (1) and (2), which is altered by the Bruggeman correlation, stands for the effective diffusivity of either gaseous hydrogen or oxygen species across the porous layers of the PEM electrolysis cell [21], as follows:
D i e f f = ε 1 s l       τ D i g
The effective diffusivity of water is defined in the following form. For aPTL:
D w e f f = ε τ D w l  
For aCL:
D w e f f = ε τ D w l   + ε e , a τ e D w m e m d C w m e m d C w  
For membrane:
D w e f f = D w m e m d C w m e m d C w  
For cCL:
D w e f f = ε τ D w g   + ε e , c τ e D w m e m d C w m e m d C w  
For cPTL:
D w e f f = ε τ D w g
In Equations (1) and (2), C b n ,   i is the critical gas concentration above which bubbles start to nucleate, as shown in the Equation (45):
C b n ,     i = 2 σ H i e 1 r b n ,
where r b n represents the nucleation bubble radius, e is Euler’s number, and H i denotes Henry’s constant [22].
Here, C w sat in Equations (4) and (5) is a critical concentration for water in the cathode side wherein the water vapor only exists for C w < C w sat with relatively weak water crossover from the anode driven by the EOD and diffusion. However, strong water crossover from the anode can condense the water vapor ( C w > C w sat ) and result in the accumulation of liquid water in the cathode side. This is similar to a phenomenon known as “flooding” in the PEM fuel cells.
Diffusive mass fluxes of the liquid phase, as in Equation (30), and the gas phase, as in Equation (31), are calculated based on the capillary pressure, which is the pressure difference between the gas phase and the liquid phase. As discussed, liquid water can accumulate in the pores of the cathode. Thus, the Leverett function in Equation (34) is used to estimate the capillary pressure of the cathode. However, the capillary pressure of the anode is estimated using the oxygen bubble radius (Equation (32)).
Here, s l and s g in Equations (35)–(38) are defined as the volume fraction of pores filled with liquid and gas phases to characterize the individual phase distributions in PTLs. The electrochemical performance of the cell was assessed as a function of a given current density, I. The cell voltage is then calculated from the theoretical thermodynamic potential, various overpotentials related to the electrochemical kinetics and charge, and mass transport, as follows:
V = E 0 + η a c t , a + η a c t , c + η o h m + η c o n c ,
where E 0 denotes the equilibrium thermodynamic potential between the cathode and anode. It is defined as follows:
E 0 = 1.23 9.0 × 10 4 T 298.15 .
Furthermore, η a c t , a and η a c t , c represent the activation losses for the anode OER and cathode HER, respectively, as follows:
η a c t , a = R u T α a F a r c s i n h j 2 s l     τ j 0 , a ,
η a c t , c = R u T α c F a r c s i n h j 2 j 0 , c ,
where j 0 , a and j 0 , c are the exchange current densities, which describe the kinetics of the electrochemical reactions. They were obtained from previous studies [23] as follows:
j 0 , a = 2.83792 × 10 7 exp 28920.95 8.314 1 T 1 303.15 ,
j 0 , c = 2.15 × 10 2 exp 17000 8.314 1 T 1 303.15 .
Furthermore, s l in Equation (48) is considered to estimate the reduction of the electrochemically active surface area in the aCL, and was obtained using Equation (36).
Ohm’s law was used to calculate the ohmic overpotential as a function of current density and the total resistance of the membrane and CLs, as follows:
η o h m = I δ a C L 2 ε e , a τ κ a C L + δ m e m κ m e m + δ c C L 2 ε e , c τ κ c C L .
The concentration overpotential, η c o n c , which resulted from the accumulation of gaseous bubbles in CLs and PTLs, was determined using the following equations:
η c o n c a = R u T 4 F ln C O 2 C O 2 0
η c o n c c = R u T 2 F ln C H 2 C H 2 0
η c o n c   = η c o n c a + η c o n c c

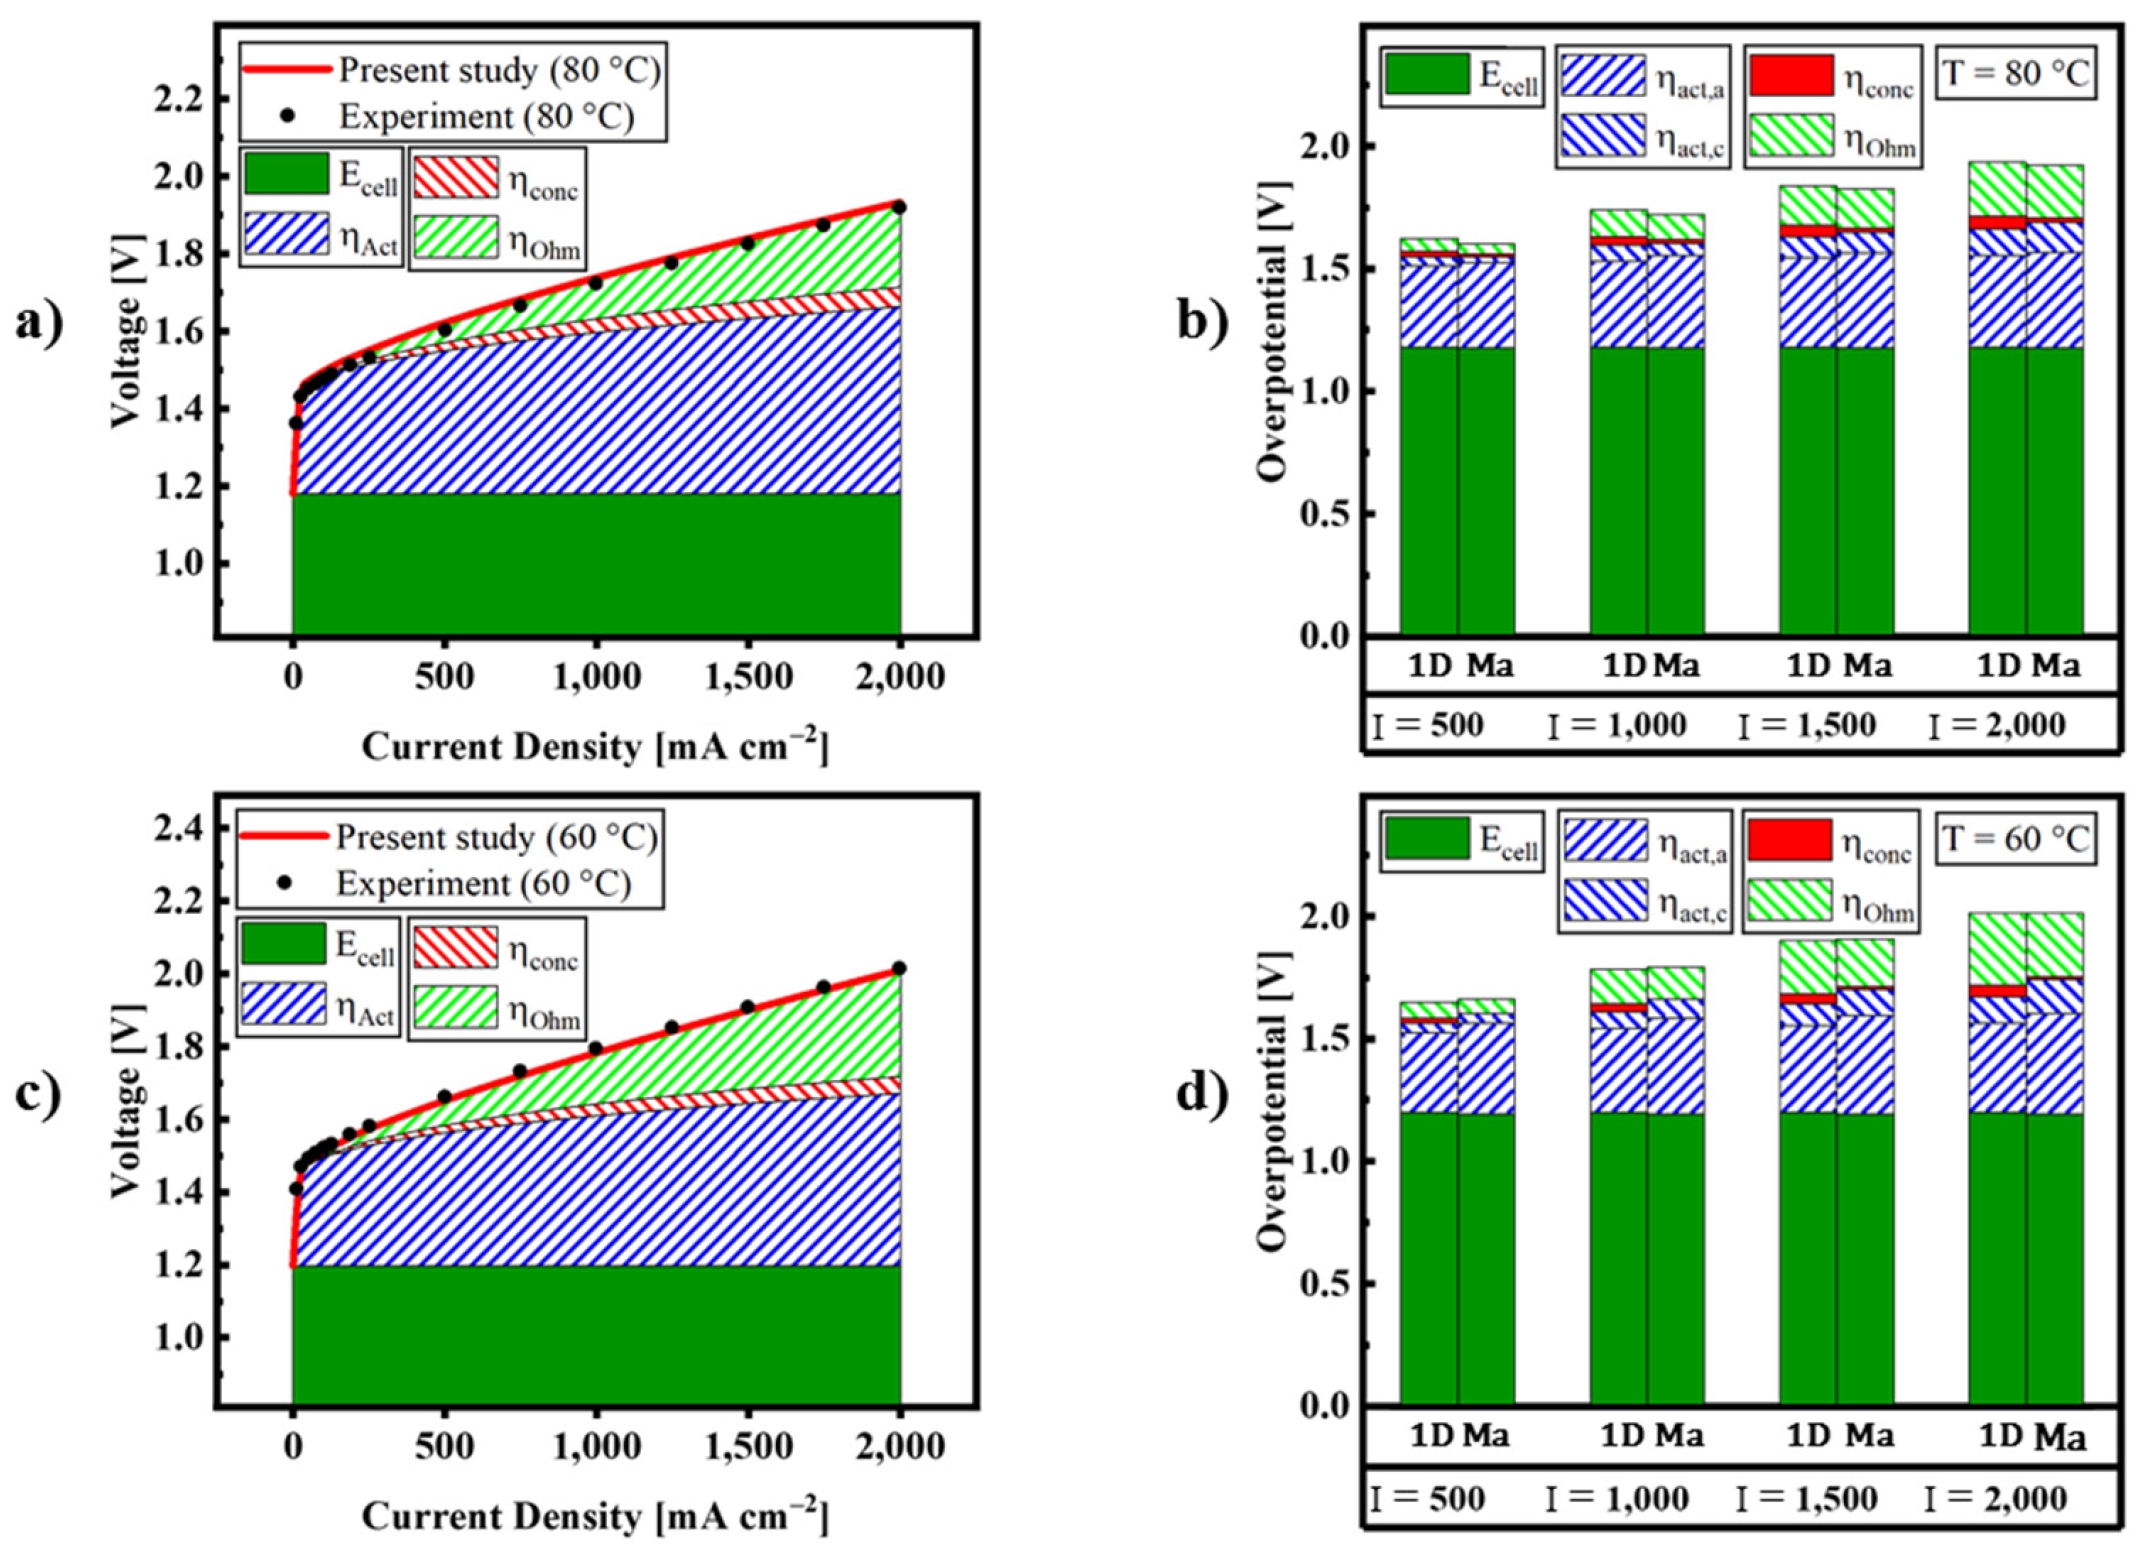
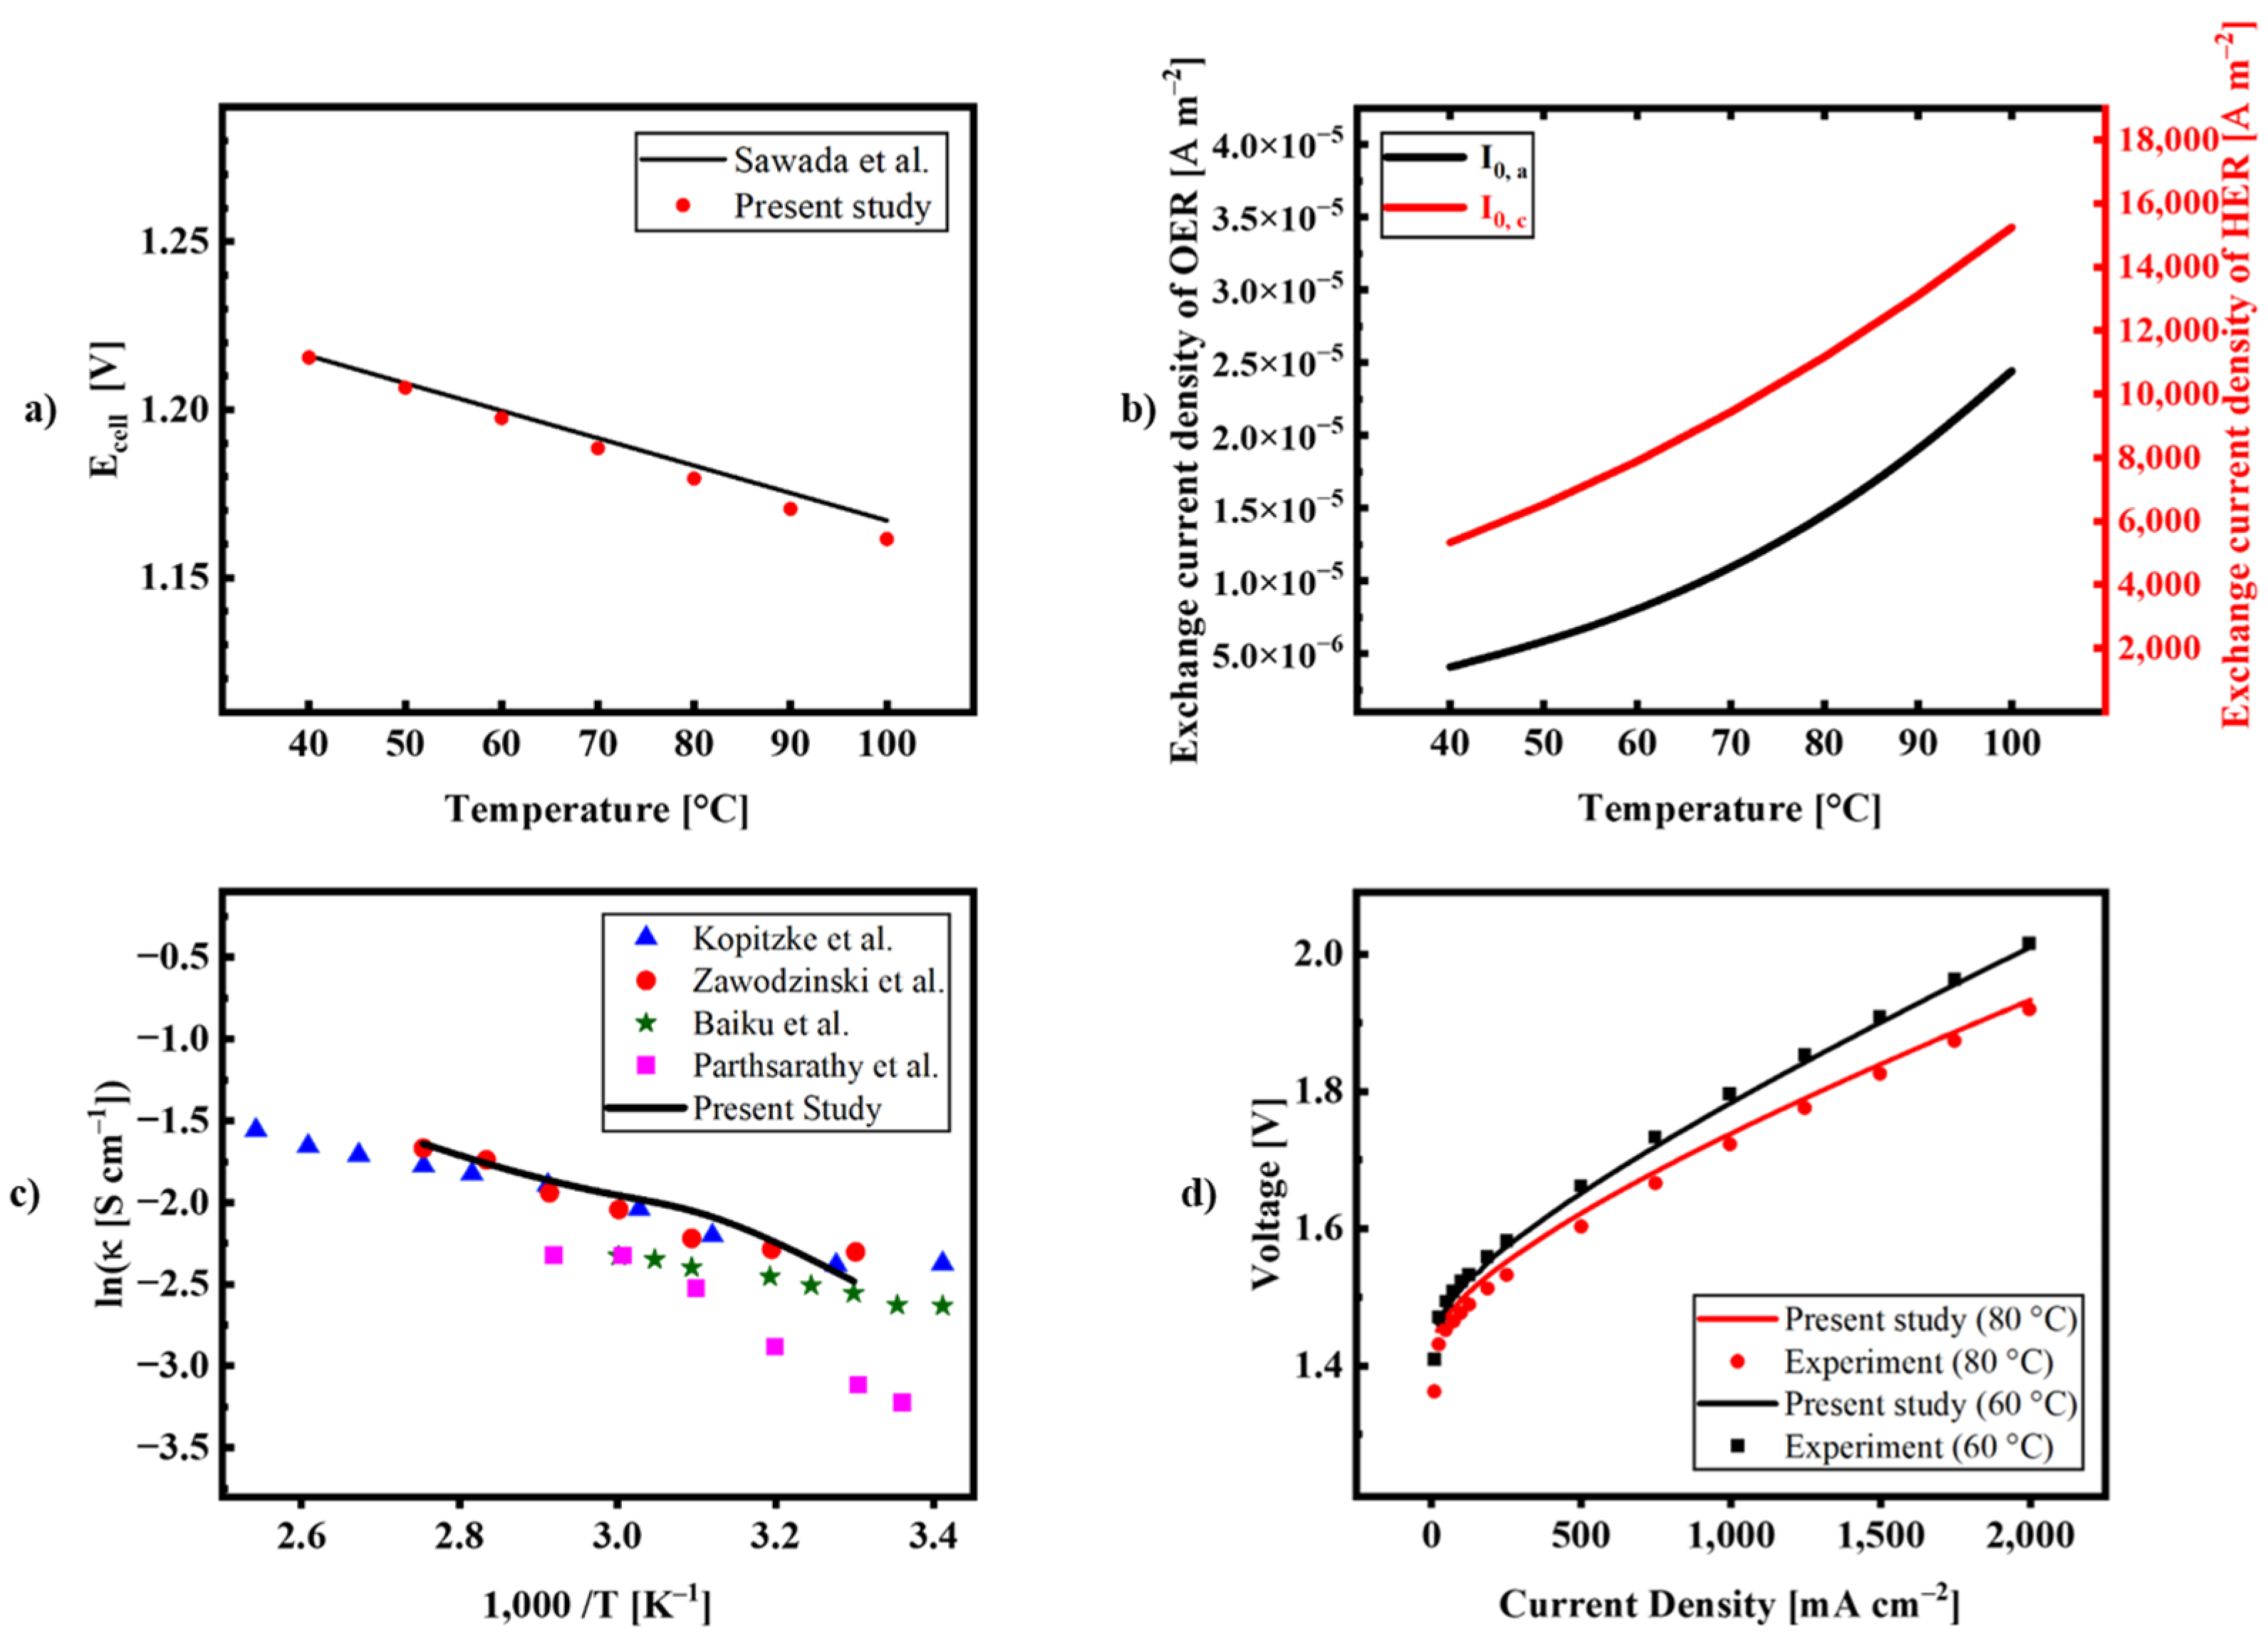
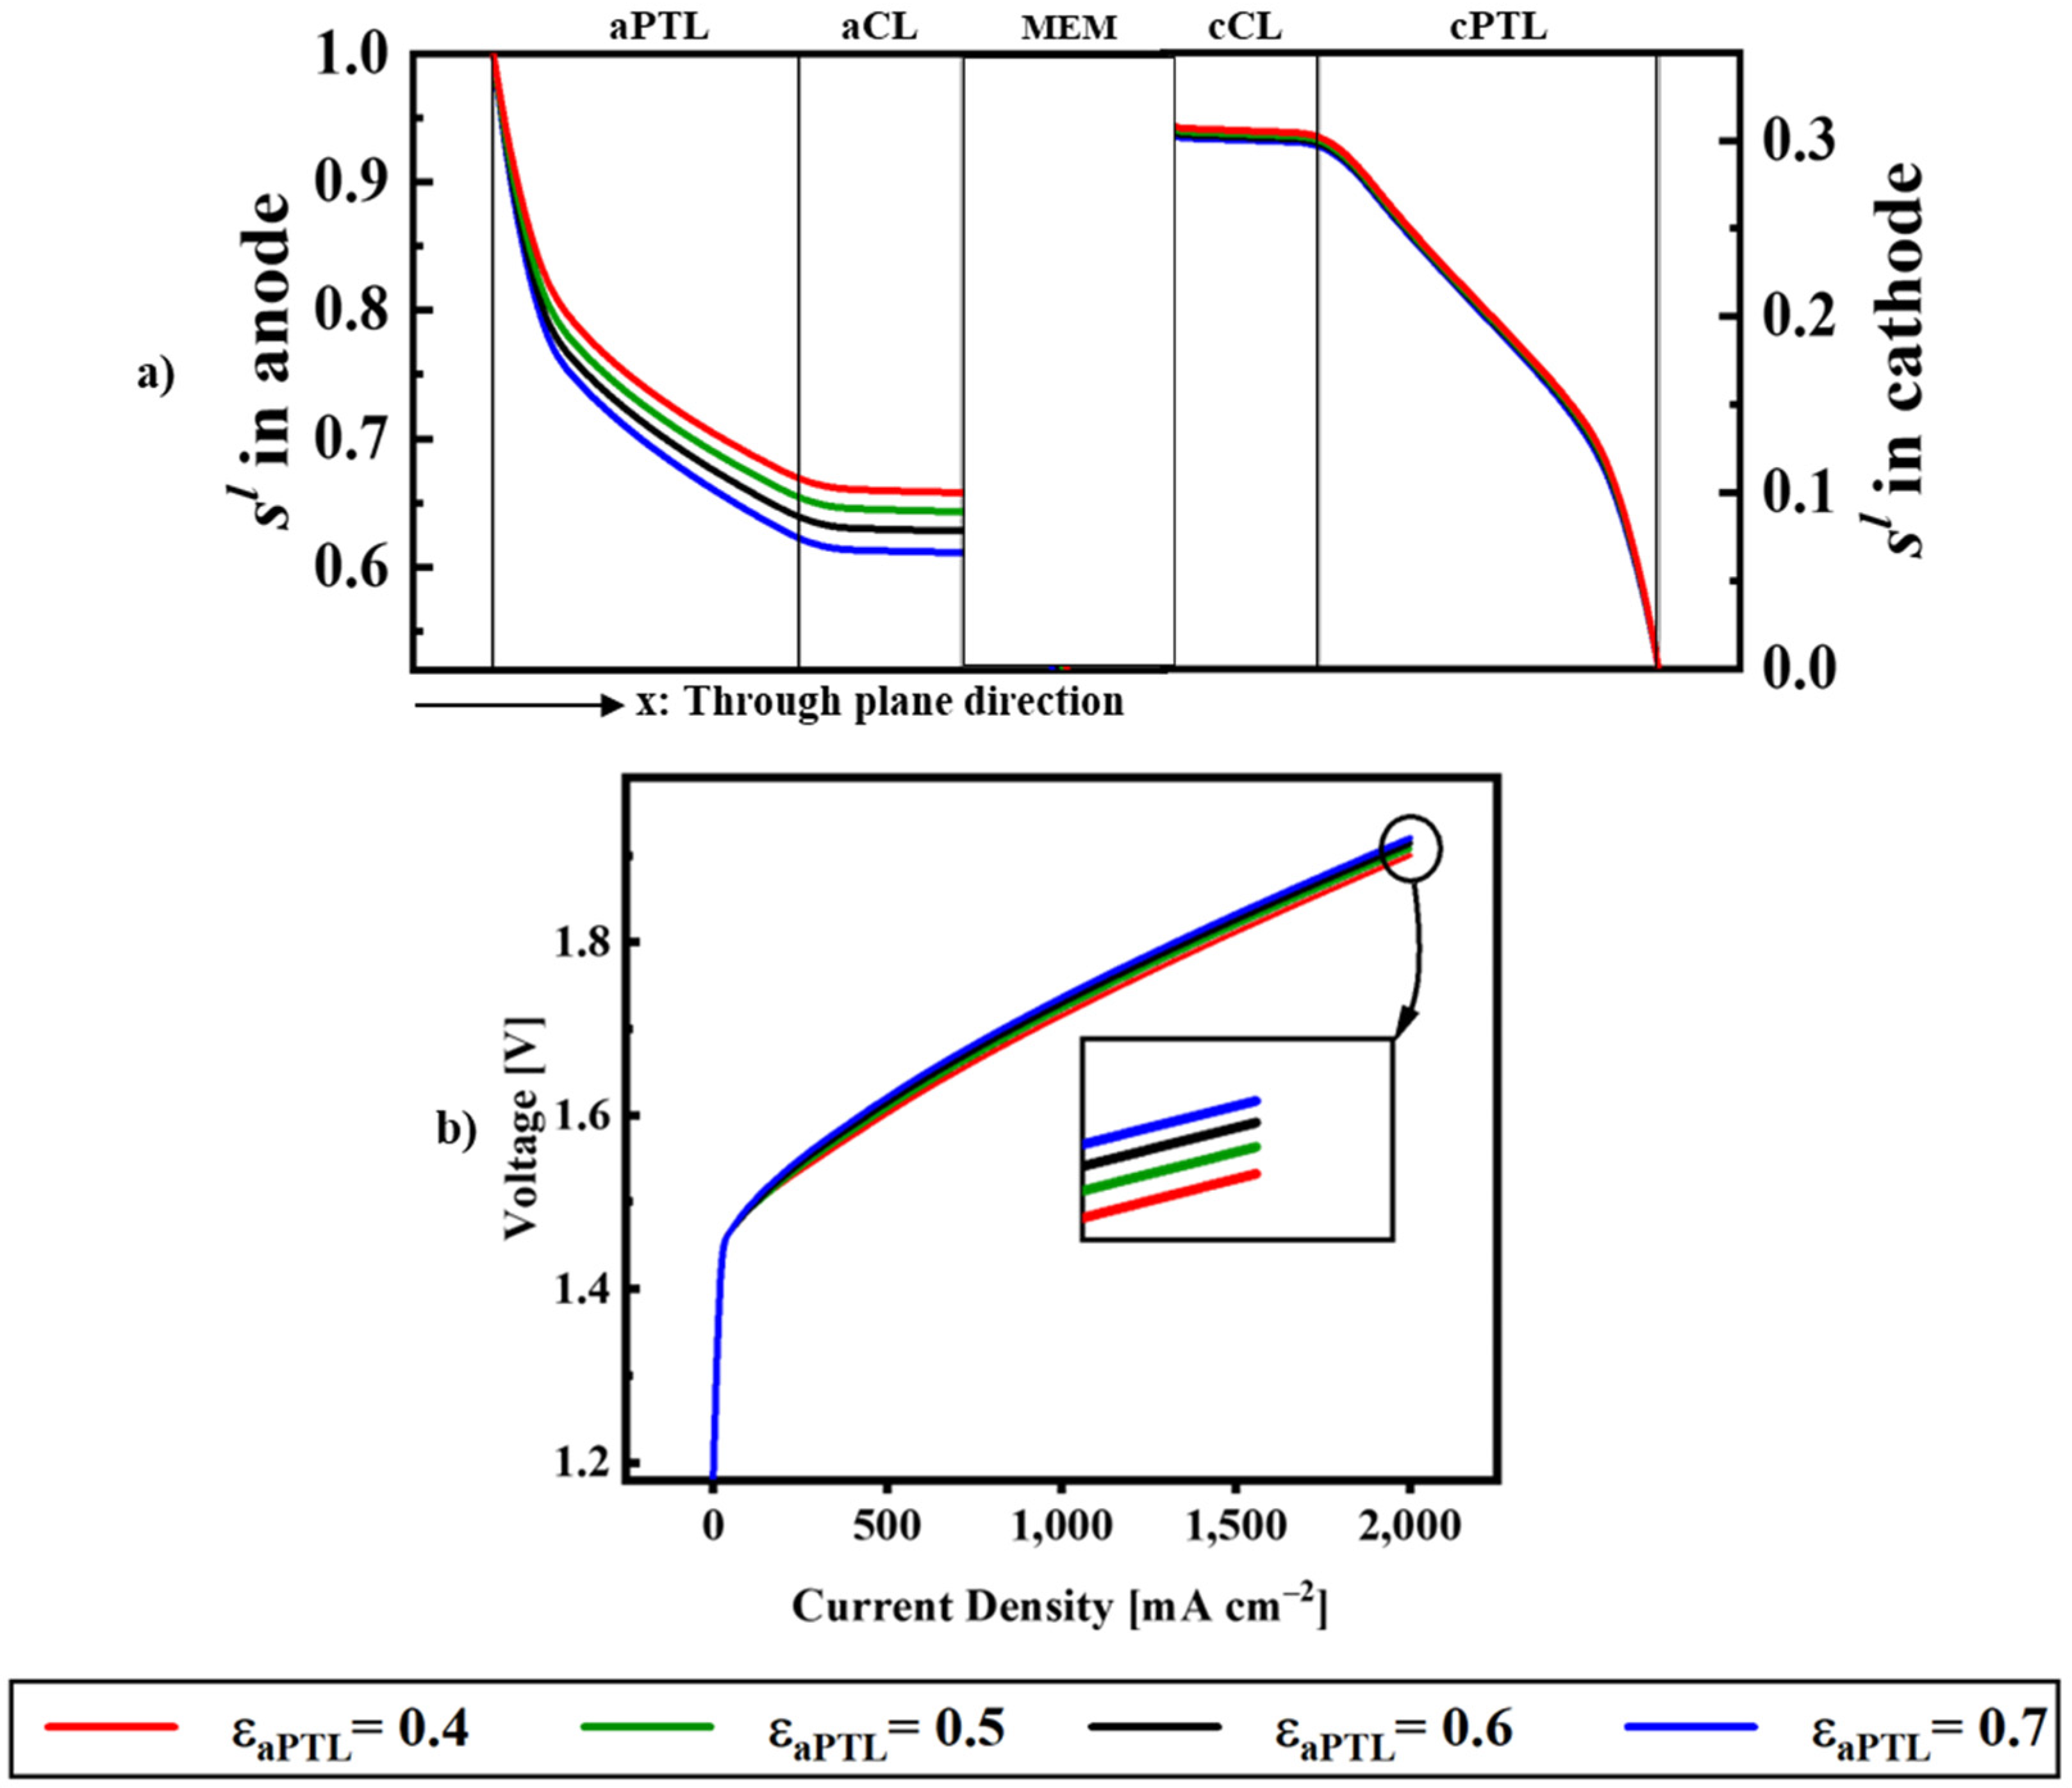
3. Results and Discussion

To obtain a systematic understanding of the contributions of morphological and geometrical features of key PEM electrolysis components to the overall cell performance, a 1D multi-phase PEM electrolysis model was applied to a typical PEM electrolysis cell geometry. The cell dimensions and operating conditions are listed in Table 2. Table 3 lists the kinetic and physiochemical parameters, as well as the transport properties.
Experimental polarization curves used for the validation of the present model at 80 °C and 60 °C have been taken from a recent study by Ma et al. [23]. The polarization curves at 80 °C and 60 °C were simulated using the 1D PEM electrolysis model and validated with the experimental ones. In order to catch the behavior of the PEM electrolysis cell at 80 °C and 60 °C, the kinetic effect, effect of proton conductivity at higher temperatures [17] and lower water contents, and temperature dependency of the Nernst equation were considered. As shown in Figure 2a,c the comparison results indicate a good agreement between the calculated and measured polarization curves, thus, proving the ability of the model to investigate critical cell parameters. Furthermore, to better understand the contributions of different overpotentials to the total cell potential, the breakdown of the overpotentials at 80 °C and 60 °C are presented in Figure 2b,d and compared with results from a 3D multiphysics model introduced by Ma et al. [23], as shown in Figure 2b,d.
For a constant temperature, the thermodynamic equilibrium potential is constant across all current density ranges. At current densities less than 2.0 A cm−2, the activation overpotential, and notably anode activation overpotential for the OER, is the largest contributor to the cell overpotential, followed by ohmic overpotential, which is in agreement with results from previous studies [23,24]. The activation overpotential is relatively small at the cathode side, which is attributed to the facile kinetics of the HER. The concentration loss has the lowest contribution to the overall overpotential in this range of current densities (<2.0 A cm−2) and, hence, it was ignored in most previous studies. However, the present model provided a good estimate, indicating its potential for predicting the concentration loss at higher current densities at which the concentration loss plays a critical role in the overall cell performance. Figure 2b,d clearly show that the model of Ma et al. [23] underpredicted the concentration overpotential.
Since activation and ohmic overpotentials are the main contributors to cell overpotentials, the temperature effects of key parameters that affect these overpotentials have been assessed in detail. Operating at higher temperatures reduces the Gibbs free energy, which affects the reversible cell potential. The effect of temperature on the reversible cell potential is shown in Figure 3a and compared with the data provided by Sawada et al. [25]. The total activation overpotential depends on the exchange current density. Figure 3b indicates that increasing the temperature increases the exchange current densities of both OER and HER, resulting in lower activation overpotentials at both electrodes. Figure 3c represents the temperature dependence of proton conductivity ( κ ), which is inversely proportional to the ohmic overpotential. In this graph, the variation of κ has also been compared with those of previous studies [26,27,28,29]. To wrap up all above discussions, Figure 3d shows the effect of temperature on the cell voltage at 80 °C and 60 °C along with a comparison with the experimental data [23]. As anticipated, operating at higher temperatures improves the reaction kinetics and ohmic conductivity, which, in turn, leads to an improved cell performance.
In a PEM electrolysis cell, since the pore diameter of PTLs is at the micron level, the capillary pressure, which is the pressure difference between the non-wetting phase and wetting phase, is the primary driving force for liquid water transport inside the PTL. The effects of capillary pressure on the cell performance can vary with the operating conditions and PTL properties [8]. A more elaborate understanding of the multi-phase transport through the PTL of a PEM electrolysis cell can be obtained by simulating and analyzing the capillary flow in PTL with different physical parameters and operating conditions. The effect of the operating current density on the capillary flow in PTL is shown in Figure 4.
Liquid water is fed into the anode side of a PEM electrolysis cell, in which the reactant water is split into oxygen, protons, and electrons, and then transported to the cathode side through the membrane. The present model considers the multi-phase transport behaviors occurring at both electrodes, namely the anode and the cathode. The liquid saturation, which is the ratio of liquid water volume to the total pore volume of PTL, can be used for quantifying the water distribution inside PTL. Higher liquid saturation indicates the presence of more liquid water in the reaction areas, which facilitates the OER and, hence, decreases the activation and concentration overpotentials. Under higher current densities, oxygen bubbles are formed faster, which provides resistance for liquid water to reach the reaction sites on the aCL and reduces the liquid saturation profile. as shown in Figure 4a. Lower liquid water in the aCL results in lower water content of the membrane, which can be observed in Figure 4b.
Porosity is an important structural parameter for PTL and has a significant influence on the multi-phase transport behaviors of a PEM electrolysis cell. Operating conditions and cell compression pressure influence the porosity variation of a PTL. Porosity directly contributes to capillary pressure and permeability, which subsequently alter the distribution of liquid water. Figure 5a shows the variations in the liquid saturation along the cell thickness with different aPTL porosities ranging from 0.4 to 0.7 at a current density of 1.0 A cm−2 and temperature of 80 °C. The liquid saturation at the anode side decreases with decreasing porosity. Higher liquid saturation in the anode means a lower oxygen fraction which, in turn, indicates better removal of oxygen bubbles toward the anode channel and improved electrochemical performance. Consequently, as shown in Figure 5b, superior cell performance is observed with a lower porosity of aPTL. This is in agreement with the results of previous studies [8,24].
Generally, utilizing thin PTLs for PEM electrolysis cells decreases the overall stack size as well as the amount of titanium required, which, in turn, decreases the capital investment of the electrolyzer [30]. Thin PTLs provide shorter pathways for water to reach the reaction sites and for oxygen to be drawn away, preventing the accumulation of oxygen bubbles, and providing higher liquid saturation at the anode side, as shown in Figure 6a. Thin PTLs promote the formation of smaller oxygen bubbles, which are easier to draw away, resulting in lower concentration loss and better performance. Figure 6b shows better cell performance with thin PTLs.
Increasing the contact angle of aPTL, which implies less hydrophilic behavior, as shown in Figure 7a, results in lower liquid saturation and more accumulated gas phase on the anode side, leading to higher diffusion loss. Decreasing the contact angle also results in larger capillary pressures, which drive water more easily and provide more water on the reaction sites; this leads to a lower concentration overpotential [8]. However, the hydrophilic treatment on the aPTL, as shown in Figure 7b, results in limited performance improvement [17].
The through-plane tortuosity of the aPTL, as is the case considered in this study, is a key morphological parameter because it affects oxygen removal from the CL through the PTL into the flow channel [31]. Lower tortuosity also produces less resistance to the water transport, so the gradient of liquid saturation is small. As tortuosity increases from 1.5 to 3.0, the gas phase has a larger impact on the multi-phase transport of product oxygen, resulting in lower liquid saturation and cell performance (Figure 8). This trend is in agreement with previous studies [24].
Proton conductivity ( κ ), which is inversely proportional to the ohmic resistance of PEM, depends on the humidification degree of PEM, defined as water content (λ), which can vary in a large range due to different operating conditions. Moreover, liquid saturation cannot be quantified for the membrane layer because its definition, which is the ratio of liquid water volume to total pore volume, contradicts the structure of the membrane. Therefore, the variation in the water content was analyzed. Figure 9 shows the effects of membrane thickness on the variation of water content and the resulting cell performance. Previous studies [19] suggest that λ should be in the range from 14 to 22, within which the results of the present model have been obtained. As expected, with increasing membrane thickness, the water content decreases, less water reaches the cathode side, and the cell voltage increases, indicating a larger performance loss in the cell.

4. Conclusions

In this study, a modeling framework was developed for PEM electrolysis using mathematical models of the associated physicochemical phenomena, which was implemented in MATLAB software. Mass transport studies are necessary for high-power PEM electrolysis operations. Two-phase modeling should be carried out for the anode side because water as the main reactant needs to reach the anode catalyst layer and, simultaneously, oxygen needs to be drawn out to the anode flow channel. Here, the distribution of the liquid saturation across the cell thickness is a well-proven way of assessing the effects of two-phase flow on cell performance. This study analyzed the morphological and geometrical features that affect the polarization and performance characteristics of a PEM electrolysis cell. Polarization curves were validated against experimental data and a good agreement between the predicted results of the model and experimental polarization curves was achieved. It was found that increasing the operating temperature and reducing the porosity, thickness, contact angle, and tortuosity of anode PTL improved the cell performance. In addition, using a thinner membrane is advantageous for the hydration of the membrane and, thus, leads to superior cell performance. The results of this study pave the way for designing and operating the PEM electrolysis cell at high-power operations and fast hydrogen production rates.

Author Contributions

Conceptualization, H.J.; methodology, H.S. and H.J.; software, H.S.; validation, H.S.; formal analysis, H.S. and H.J.; investigation, H.S.; resources, H.J.; data curation, H.S.; writing—original draft preparation, H.S.; writing—review and editing, H.J.; visualization, H.S.; supervision, H.J.; project administration, H.J.; funding acquisition, H.J. All authors have read and agreed to the published version of the manuscript.

Funding

This research received no external funding.

Data Availability Statement

Data available on request due to privacy restrictions.

Acknowledgments

This work was supported by INHA UNIVERSITY Research Grant. We would like to thank TAESUNG S&E, Inc., Seoul, Republic of Korea, for providing technical support in using the Ansys Fluent software.

Conflicts of Interest

The authors declare no conflict of interest.

Nomenclature

aWater activity;
CMolar concentration of species, m o l   m 3 ;
DSpecies diffusivity, m 2   s 1 ;
EThermodynamic equilibrium potential, V ;
eEuler’s number;
FFaraday’s constant, 96,487 C   m o l 1 ;
HHenry’s constant, m o l   m 3   P a ;
i 0 Exchange current density, A   m 2 ;
IOperating current density, A   m 2 ;
j l Diffusive mass flux of liquid phase;
j g Diffusive mass flux of gas phase;
jCurrent density, A   c m 3 ;
k r Relative permeability;
nNumber of electrons transferred in the electrode reaction;
n d Electro-osmotic drag coefficient for water;
MMolecular weight, k g   m o l 1 ;
mfMole fraction;
PPressure, P a ;
r bn Bubble nucleation radius, n m ;
R u Universal gas constant, 8.314 J   m o l 1   K 1 ;
s l Liquid saturation;
SSource term in transport equation;
TTemperature, K ;
VCell voltage, V ;
Greek
αTransfer coefficient;
δThickness, m ;
εPorosity;
ηOverpotential, V ;
ρ Density, k g   m 3 ;
κProton conductivity, S   m 1 ;
τTortuosity;
σSurface tension, N   m 1 ;
θContact angle, °;
λMembrane water content, m o l H 2 O   m o l S O 3 1 ;
λ α Relative mobility of phase α;
νKinematic viscosity, m 2   s 1 ;
Superscripts
effEffective;
gGas;
lLiquid;
memMembrane;
refReference value;
satSaturation;
Subscripts
a Anode;
aCLAnode catalyst layer;
actActivation;
aPTLAnode porous transport layer;
bnBubble nucleation;
cCathode;
capCapillary;
cCLCathode catalyst layer;
chanChannel;
CLCatalyst layer;
concConcentration;
cPTLCathode porous transport layer;
dDiffusion;
eElectrolyte;
gGas;
iSpecies;
inInlet;
H 2 Hydrogen;
lLiquid;
memMembrane;
O 2 Oxygen;
ohmOhmic;
opOperating;
PTLPorous transport layer;
rRelative;
satSaturation;
wWater;
0Standard conditions—298.15 K and 101.3 kPa (1 atm);

References

  1. Maier, M.; Smith, K.; Dodwell, J.; Hinds, G.; Shearing, P.R.; Brett, D.J.L. Mass transport in PEM water electrolysers: A review. Int. J. Hydrogen Energy 2022, 47, 30–56. [Google Scholar] [CrossRef]
  2. Falcão, D.S.; Pinto, A.M.F.R. A review on PEM electrolyzer modelling: Guidelines for beginners. J. Clean. Prod. 2020, 261, 121184. [Google Scholar] [CrossRef]
  3. Kim, H.; Park, M.; Lee, K.S. One-dimensional dynamic modeling of a high-pressure water electrolysis system for hydrogen production. Int. J. Hydrogen Energy 2013, 38, 2596–2609. [Google Scholar] [CrossRef]
  4. Abdol Rahim, A.H.; Tijani, A.S.; Kamarudin, S.K.; Hanapi, S. An overview of polymer electrolyte membrane electrolyzer for hydrogen production: Modeling and mass transport. J. Power Sources 2016, 309, 56–65. [Google Scholar] [CrossRef]
  5. Toghyani, S.; Afshari, E.; Baniasadi, E.; Atyabi, S.A.; Naterer, G.F. Thermal and electrochemical performance assessment of a high temperature PEM electrolyzer. Energy 2018, 152, 237–246. [Google Scholar] [CrossRef]
  6. Carmo, M.; Fritz, D.L.; Mergel, J.; Stolten, D. A comprehensive review on PEM water electrolysis. Int. J. Hydrogen Energy 2013, 38, 4901–4934. [Google Scholar] [CrossRef]
  7. Kang, Z.; Mo, J.; Yang, G.; Retterer, S.T.; Cullen, D.A.; Toops, T.J.; Green, J.B., Jr.; Mench, M.M.; Zhang, F.Y. Investigation of thin/well-tunable liquid/gas diffusion layers exhibiting superior multifunctional performance in low-temperature electrolytic water splitting. Energy Environ. Sci. 2017, 10, 166–175. [Google Scholar] [CrossRef]
  8. Han, B.; Mo, J.; Kang, Z.; Zhang, F.Y. Effects of membrane electrode assembly properties on two-phase transport and performance in proton exchange membrane electrolyzer cells. Electrochim. Acta 2016, 188, 317–326. [Google Scholar] [CrossRef] [Green Version]
  9. Lee, J.K.; Lee, C.H.; Bazylak, A. Pore network modelling to enhance liquid water transport through porous transport layers for polymer electrolyte membrane electrolyzers. J. Power Sources 2019, 437, 226910. [Google Scholar] [CrossRef]
  10. Zhan, Z.; Xiao, J.; Zhang, Y.; Pan, M.; Yuan, R. Gas diffusion through differently structured gas diffusion layers of PEM fuel cells. Int. J. Hydrogen Energy 2007, 32, 4443–4451. [Google Scholar] [CrossRef]
  11. Zhang, Y.; Verma, A.; Pitchumani, R. Optimum design of polymer electrolyte membrane fuel cell with graded porosity gas diffusion layer. Int. J. Hydrogen Energy 2016, 41, 8412–8426. [Google Scholar] [CrossRef] [Green Version]
  12. Kang, Z.; Yu, S.; Yang, G.; Li, Y.; Bender, G.; Pivovar, B.S.; Green Jr, J.B.; Zhang, F.Y. Performance improvement of proton exchange membrane electrolyzer cells by introducing in-plane transport enhancement layers. Electrochim. Acta 2019, 316, 43–51. [Google Scholar] [CrossRef]
  13. Forner-Cuenca, A.; Biesdorf, J.; Gubler, L.; Kristiansen, P.M.; Schmidt, T.J.; Boillat, P. Engineered Water Highways in Fuel Cells: Radiation Grafting of Gas Diffusion Layers. Adv. Mater. 2015, 27, 6317–6322. [Google Scholar] [CrossRef]
  14. Forner-Cuenca, A.; Biesdorf, J.; Manzi-Orezzoli, V.; Gubler, L.; Schmidt, T.J.; Boillat, P. Advanced Water Management in PEFCs: Diffusion Layers with Patterned Wettability III. Operando Characterization with Neutron Imaging. J. Electrochem. Soc. 2016, 163, F1389–F1398. [Google Scholar] [CrossRef] [Green Version]
  15. Han, B.; Mo, J.; Kang, Z.; Yang, G.; Barnhill, W.; Zhang, F.Y. Modeling of two-phase transport in proton exchange membrane electrolyzer cells for hydrogen energy. Int. J. Hydrogen Energy 2017, 42, 4478–4489. [Google Scholar] [CrossRef] [Green Version]
  16. Li, H.; Fujigaya, T.; Nakajima, H.; Inada, A.; Ito, K. Optimum structural properties for an anode current collector used in a polymer electrolyte membrane water electrolyzer operated at the boiling point of water. J. Power Sources 2016, 332, 16–23. [Google Scholar] [CrossRef] [Green Version]
  17. Kang, Z.; Alia, S.M.; Young, J.L.; Bender, G. Effects of various parameters of different porous transport layers in proton exchange membrane water electrolysis. Electrochim. Acta 2020, 354, 136641. [Google Scholar] [CrossRef]
  18. Suermann, M.; Gimpel, T.; Bühre, L.V.; Schade, W.; Bensmann, B.; Hanke-Rauschenbach, R. Femtosecond laser-induced surface structuring of the porous transport layers in proton exchange membrane water electrolysis. J. Mater. Chem. A 2020, 8, 9–4898. [Google Scholar] [CrossRef]
  19. Marangio, F.; Santarelli, M.; Calì, M. Theoretical model and experimental analysis of a high pressure PEM water electrolyser for hydrogen production. Int. J. Hydrogen Energy 2009, 34, 1143–1158. [Google Scholar] [CrossRef]
  20. Han, B.; Steen, S.M.; Mo, J.; Zhang, F.Y. Electrochemical performance modeling of a proton exchange membrane electrolyzer cell for hydrogen energy. Int. J. Hydrogen Energy 2015, 40, 7006–7016. [Google Scholar] [CrossRef]
  21. Wang, C.Y.; Cheng, P. A multiphase mixture model for multiphase, multicomponent transport in capillary porous media—I. Model development. Int. J. Heat Mass Transf. 1996, 39, 3607–3618. [Google Scholar] [CrossRef]
  22. Sander, R. Compilation of Henry’s law constants (version 4.0) for water as solvent. Atmos. Chem. Phys. 2015, 15, 4399–4981. [Google Scholar] [CrossRef] [Green Version]
  23. Ma, Z.; Witteman, L.; Wrubel, J.A.; Bender, G. A comprehensive modeling method for proton exchange membrane electrolyzer development. Int. J. Hydrogen Energy 2021, 46, 17627–17643. [Google Scholar] [CrossRef]
  24. Diaz, D.F.R.; Valenzuela, E.; Wang, Y. A component-level model of polymer electrolyte membrane electrolysis cells for hydrogen production. Appl. Energy 2022, 321, 119398. [Google Scholar] [CrossRef]
  25. Sawada, S.; Yamaki, T.; Maeno, T.; Asano, M.; Suzuki, A.; Terai, T.; Maekawa, Y. Solid polymer electrolyte water electrolysis systems for hydrogen production based on our newly developed membranes, Part I: Analysis of voltage–current characteristics. Prog. Nucl. Energy 2008, 50, 443–448. [Google Scholar] [CrossRef]
  26. Kopitzke, R.; Linkous, C.A.; Anderson, H.R.; Nelson, G.L. Conductivity and water uptake of aromatic-based proton exchange membrane electrolytes. J. Electrochem. Soc. 2000, 147, 1677–1681. [Google Scholar] [CrossRef]
  27. Zawodzinski, T.Z.; Derouin, C.; Radzinski, S.; Sherman, R.J.; Smith, V.T.; Springer, T. Water uptake by and transport through Nafion 117 membranes. J. Electrochem. Soc. 1993, 140, 1041–1047. [Google Scholar] [CrossRef]
  28. Biaku, C.Y.; Dale, N.V.; Mann, M.D.; Salehfar, H.; Peters, A.J.; Han, T. A semiempirical study of the temperature dependence of the anode charge transfer coefficient of a 6 kW PEM electrolyzer. Int. J. Hydrogen Energy 2008, 33, 4247–4254. [Google Scholar] [CrossRef]
  29. Parthasarathy, A.; Srinivasan, S.; Appleby, A.J.; Martin, C.R. Temperature Dependence of the Electrode Kinetics of Oxygen Reduction at the Platinum/Nafion® Interface—A Microelectrode Investigation. J. Electrochem. Soc. 1992, 139, 2530–2537. [Google Scholar] [CrossRef]
  30. Weber, C.C.; Schuler, T.; Bruycker, R.D.; Gubler, L.; Büchi, F.N.; Angelis, S.D. On the role of porous transport layer thickness in polymer electrolyte water electrolysis. J. Power Sources Adv. 2022, 15, 100095. [Google Scholar] [CrossRef]
  31. Kulkarni, D.; Huynh, A.; Satjaritanun, P.; O’Brien, M.; Shimpalee, S.; Parkinson, D.; Shevchenko, P.; DeCarlo, F.; Danilovic, N.; Ayers, K.E.; et al. Elucidating effects of catalyst loadings and porous transport layer morphologies on operation of proton exchange membrane water electrolyzers. Appl. Catal. B 2022, 308, 121213. [Google Scholar] [CrossRef]
Figure 1. Schematic representation of the present 1D PEM electrolysis model.
Energies 16 00766 g001
Figure 2. Polarization curves and breakdown of individual overpotentials. (a) Calibration of polarization curves against experimental data provided by Ma et al. [23] at 80 °C, (b) comparison of various overpotentials with simulated data provided by Ma et al. [23] at 80 °C, (c) calibration of polarization curves against experimental data provided by Ma et al. [23] at 60 °C, and (d) comparison of various overpotentials with simulated data provided by Ma et al. [23] at 60 °C.
Energies 16 00766 g002
Figure 3. Temperature effects on polarization curve. (a) Effect of temperature on reversible cell potential compared with the data provided by Sawada et al. [25], (b) effect of temperature on the exchange current densities of the OER and HER, (c) effect of temperature on proton conductivity and comparison with the data from previous studies [26,27,28,29], and (d) effect of temperature on the calculated IV curves compared with the experimental data provided by Ma et al. [23] at 60 °C and 80 °C.
Energies 16 00766 g003
Figure 4. Effect of applying current density (I) on (a) liquid saturation ( s l ), (b) water content ( λ m e m ), (c) relative permeability of gas phase ( k r g ), (d) relative mobility of gas phase ( λ r g ), (e) relative permeability of liquid phase ( k r l ), and (f) relative mobility of liquid phase ( λ r l ). The cell operates at T = 80 °C.
Energies 16 00766 g004
Figure 5. Effect of the aPTL porosity ( ε a P T L ) on (a) liquid saturation (I = 1.0 A cm−2 and T = 80 °C) and (b) polarization curves at 80 °C.
Energies 16 00766 g005
Figure 6. Effect of the aPTL thickness ( δ a P T L ) on (a) liquid saturation (I = 1.0 A cm−2 and T = 80 °C) and (b) polarization curves at 80 °C.
Energies 16 00766 g006
Figure 7. Effect of the aPTL contact angle ( θ a P T L ) on (a) liquid saturation (I = 1.0 A cm−2 and T = 80 °C) and (b) polarization curves at 80 °C.
Energies 16 00766 g007
Figure 8. Effect of the aPTL tortuosity ( τ a P T L ) on (a) liquid saturation (I = 1.0 A cm−2 and T = 80 °C) and (b) polarization curves at 80 °C.
Energies 16 00766 g008
Figure 9. Effect of membrane thickness ( δ m e m ) on (a) water content (I = 1.0 A cm−2 and T = 80 °C) and (b) polarization curves at 80 °C.
Energies 16 00766 g009
Table 1. Source/sink terms and boundary conditions of the 1D multi-phase PEM electrolysis model.
DescriptionEquationsEquation #
Source/sink termsAnode CL S O 2 = + s i j n F (6)
S w = x · n d F I s i j n F (7)
Cathode CL S H 2 = + s i j n F (8)
S w = x · n d F I (9)
Boundary conditionsInterfacial surface between channel and PTL D i e f f C i x = 0 (10)
Interface of membrane and CLs D i e f f C i x = 0 (11)
Table 2. Dimensions and operational conditions of the cell.
DescriptionValue
Thickness of the PTL, δ P T L 1.1 ×   10 3 m
Thickness of the CL, δ C L 12 ×   10 6 m
Thickness of the membrane, δ m e m 183 ×   10 6 m
Pressure (anode/cathode), P a / P c 1/1 bar
Operating temperature, T o p 80/60
Inlet temperature, T i n 80/60
Anode flow rate 50 mL/min
Table 3. Kinetic, physiochemical, and transport properties.
DescriptionValue
Area of MEA 25   c m 2
Reference   H 2 / O 2   molar   concentration ,   C i r e f 34.51   m o l   m 3
Reference   water   molar   concentration ,   C w r e f 53,986.67   m o l   m 3
Porosity   of   the   PTL / CL ,   ε P T L   /   ε C L 0.64/0.3
Contact angle of aPTL/aCL/cCL/cPTL,
θ a P T L ,   θ a C L ,   θ c C L ,   θ c P T L
60°/60°/100°/100°
Permeability of the PTL/CL/membrane,
K P T L   /   K C L   /   K m e m
1 . × 10 12 / 1 . × 10 13 /
5 . × 10 20   m 2
Surface   tension ,   σ 0.0625   N   m 1
Transfer   coefficient   of   OER ,   α a 2.0
Transfer   coefficient   of   HER ,   α c 0.5
Equivalent weight of electrolyte in the membrane, EW 1.1   k g   m o l 1
Dry   membrane   density ,   ρ d r y , m e m 2000   k g   m 2
Faraday constant, F 96 , 487   C   m o l 1
Universal   gas   constant ,   R u 8314   J   m o l 1   K 1
Diffusion   coefficient   for   O 2   in   water ,   D O 2 g 3.2348 × 10 5   m 2   s 1
Diffusion   coefficient   for   H 2   in   water ,   D H 2 g 1.63 × 10 4   m 2   s 1
Water   diffusion   in   gas   phase ,   D w g 1.7886 × 10 5   m 2   s 1
Water   diffusion   in   liquid   phase ,   D w l 6.5715 × 10 9   m 2   s 1
Henry   coefficient   of   hydrogen ,   H H 2 2.9163 × 10 5 m o l   m 3
Henry   coefficient   of   oxygen ,   H O 2 1.0288 × 10 5 m o l   m 3
Bubble   nucleation   radius ,   r b n 1.5   n m
Oxygen   bubble   radius ,   r b b l O 2 800   μ m
Disclaimer/Publisher’s Note: The statements, opinions and data contained in all publications are solely those of the individual author(s) and contributor(s) and not of MDPI and/or the editor(s). MDPI and/or the editor(s) disclaim responsibility for any injury to people or property resulting from any ideas, methods, instructions or products referred to in the content.

