Article

Energy Flow and Electric Drive Mode Efficiency Evaluation of Different Generations of Hybrid Vehicles under Diversified Urban Traffic Conditions

Faculty of Civil and Transport Engineering, Poznan University of Technology, ul. Piotrowo 3, 60-965 Poznan, Poland
*
Author to whom correspondence should be addressed.
Energies 2023, 16(2), 794; https://doi.org/10.3390/en16020794
Submission received: 13 November 2022 / Revised: 20 December 2022 / Accepted: 7 January 2023 / Published: 10 January 2023
(This article belongs to the Special Issue Modeling and Control of Hybrid Electric Vehicles)

Abstract

:
Hybrid propulsion dedicated to light duty vehicles is seen as an evolutionary change from internal combustion engine (ICE) to electric propulsion. Widespread direct replacement of convection ICEs in the current energy system is impossible because ICEs are vehicles’ main source of mechanical energy. The hybrid powertrain uses the advantages of electric propulsion with the ability to charge the traction battery or have the internal combustion engine assist the system. The article compares different types of hybrid drives (with a small share of plug-in hybrid propulsion) under typical urban driving conditions. Nine vehicles were tested, and the tests were conducted over several months in various cities in Poland. The terms of the research conducted were not under the requirements of the driving test. However, they are authoritative when using the vehicle in real traffic conditions. Such conditions take into account many aspects that are relevant to a road test. It was found that urban conditions are a very suitable environment for hybrid propulsion systems, as they cover more than 50% of the distance in electric mode, regardless of the initial battery charge, in most cases.

1. Introduction

An integral part of civilization’s progress is the parallel development of many sectors in the economy, including the rapid growth of transportation. Among the many on-board energy sources in vehicles, fossil fuels are still the most attractive, due to their high energy density, refueling time and storage conditions [1]. In order to bring powertrains into compliance with current and future standards that determine approval for use, a great deal of interest has focused on hybridization of powertrains [2]. In the European market, the share of HEVs (hybrid electric vehicles) increased by 4.2% between 2021 and 2022. Among electrified powertrains, HEVs have the largest share followed by BEVs (battery electric vehicles) and, finally, PHEVs (plug-in HEVs) in 2022 [3].
By 2030, fossil fuels are projected to contribute about 75% of the total energy supply, and by 2050 their share will drop to about 60% [4]. These trends symbolize changes in the energy landscape since the Paris Agreement.
Prices for spot purchases of natural gas have reached levels never seen before, regularly exceeding the equivalent of USD 250 for a barrel of oil [4]. High fuel prices are responsible for 90% of the increase in the average cost of electricity generation worldwide. Electricity is mostly produced from fossil fuels. The increase in the price of fuel is therefore related to the increase in electricity. For this reason, new solutions are being sought for fuels [5,6,7,8], propulsion systems [9,10], internal combustion engine designs [11] or their components [12,13]. All of these methods, unfortunately, provide limited opportunities to increase energy independence from conventional fuels.
The current costs of renewables play only a marginal role. This reinforces the fact that energy transformation should be the solution to the problem [4].
Currently, in electric hybrid propulsion systems, the main on-board energy source is a compression-ignition or spark-ignition internal combustion engine modified for specific operating conditions [14]. Instead of an internal combustion engine, fuel cells can be used to create a propulsion system that is zero-emission in TTW (tank-to-wheel) measurement [15,16]. Simulation studies of a propulsion system that incorporates an internal combustion engine and a fuel cell stack are also being conducted [17].
Besides the power source, an important component is the energy storage unit. In hybrid vehicles, the most common energy storage is the battery. Lead–acid batteries are widely used in the field of low-cost hybrids, followed by nickel–metal hydride batteries for HEVs and lithium batteries dedicated to plug-in hybrids [18]. There are also less popular systems, such as ultracapacitors, characterized by the highest power density and durability, pneumatic systems and fly wheels [19,20,21].
Due to the degree of hybridization, hybrid systems in vehicles are divided into the four basic groups of micro, mild, full and plug-in and, due to the configuration of components, into series, parallel, power-split and multi-mode. We can further classify the parallel-type system in terms of the location and size of the electrical machines as P0 to P5 (Figure 1) [22].
A study by Yang et al. indicates that using a P2 drive configuration reduces fuel consumption by 6.68% relative to a P1 system [26]. Another study [27], which compared the parallel P2 system with the power split, indicates more advantages of the power split drive. These include better economics, smoothness of propulsion operation and efficiency of electric mode operation.
The advantages of using an electric hybrid propulsion system are obtained especially in urban conditions, where the vehicle operates at low speeds and the share of pure electric modes is significant [28]. An analysis of fuel consumption and emissions under real traffic conditions for conventional and hybrid vehicles with very similar specifications driving in tandem was carried out by Huang et al. [29]. On three different routes covering a distance of 10.1 to 23.1 km, fuel consumption in L/100 km by HEVs was 23–49% lower, which corresponded to lower CO2 emissions. Frequent stopping and starting of the combustion engine in the hybrid powertrain resulted in higher carbon monoxide emissions. Prati et al. compared two vehicles with alternative HEV and NGV (natural gas vehicle) powertrains according to the RDE (real driving emissions) test; results indicated that the HEV demonstrated 1.4 MJ/km lower energy consumption in the urban section. Analyzing the overall RDE test, energy consumption was 0.2 MJ/km lower for the hybrid vehicle. In the rural and highway sections, energy consumption was lower for the NGV [30]. Comparative studies for vehicles with a hybrid and conventional system equipped with a gasoline engine show higher fuel consumption of conventional vehicles in the US06 test and indicate the influence of the braking pattern of the hybrid vehicle on energy consumption [31].
In HEVs, their mass has a smaller impact on fuel consumption than is the case in conventional vehicles. The lower impact of HEV weight on fuel consumption is due to the ability to recover energy during braking, which is wasted in conventional vehicles. The relationship between fuel consumption and vehicle weight is significantly influenced by the type of hybrid used [32]. In their work, Reynolds et al. [33] indicate that in an HEV, an increase in weight by every 100 kg results in an increase in fuel consumption of 0.4 dm3/100 km, while in conventional vehicles it is 0.7 dm3/100 km.
A significant number of the papers comparing the performance of powertrains in passenger vehicles are simulation works, or those based on manufacturers’ catalog data. Such work usually results in the evaluation of vehicle emission factors and the determination of energy consumption. In the present work, the energy flow in hybrid powertrains of HEVs and PHEVs was identified experimentally and related to the indicators characterizing the particular powertrain. Vehicles with powertrains of different generations developed by the Toyota concern were analyzed. The essence of the work is the experimental analysis of energy flow, which directly impacts the emission and energy indicators of powertrains. An additional value of the work is the extension of the analysis to a group of vehicles with different specifications.
The article consists of seven chapters. The introduction includes information on currently used alternative powertrain systems and discusses the design of conventional hybrid powertrains. Subsequently, the purpose and scope of the paper are presented along with the methodology of the experimental study. The fourth chapter analyzes the routes according to which the test runs were performed. The fifth chapter is focused on the evaluation of energy flow in the electrical part of the drivetrain. Next, in chapter six, the results of the contribution of the electric mode against distance and time is presented. The last chapter is dedicated to conclusions.

2. Aim and Scope of Research

The hybrid powertrain, developed by Toyota, has been fitted in various configurations to different types of vehicles continuously since 1997. The decision to develop hybrid drivetrains was determined by the following goals:
  • Identify the energy flow in the electric drive systems of hybrid vehicles under urban driving conditions;
  • Compare energy flow rates for hybrid systems of different generations;
  • Determine the effect of vehicle weight on the energy consumption of the electric drive train;
  • Evaluate the effect of hybrid vehicle type on electric mode share relative to time and distance.
Thus, the work focuses mainly on the high-voltage electric system. The study will determine the impact of the powertrain configuration used and the vehicle’s dimensions on the electric mode share, braking energy recovery efficiency or the operating range of the high-voltage battery. Nine cars manufactured by Toyota Motor Corporation were selected for the study. The list of vehicles, along with their years of production, is shown in Figure 2. Cars of varying sizes, from the lightest vehicle, the Toyota Yaris, to the Toyota RAV4 SUV were selected for analysis. The analyzed vehicles also include a plug-in hybrid vehicle. All vehicles were equipped with a power-split hybrid system.
The scope of the research work included performing test drives in two Polish cities. Each test drive was performed twice, according to the same route in urban conditions. During the drive, operating parameters were recorded indirectly.

3. Methodology of Research

According to the abovementioned information, nine vehicles were tested, whose technical data is shown in Table 1. ICE stands for an internal combustion engine, and EM stands for electric motor. In addition, the traction battery voltage specified is the nominal voltage. The lightest vehicle dedicated to urban applications was the Toyota Yaris, weighing 1095 kg, and the heaviest was the Toyota RAV4, an SUV, weighing 1750 kg. All vehicles used naturally aspirated gasoline engines with displacement from 1.5 to 2.5 dm3. All cars were front-wheel drive, with the exception of the RAV4 and NX300h models, where an additional third electric motor with 50 kW and 139 Nm of torque is fitted to drive the rear axle.
Based on the technical data of the tested vehicles (Table 1), powertrain performance indicators were calculated (Table 2). The specific power was calculated by dividing the power of the internal combustion engine, the electric motor and the total hybrid drive by the weight of the vehicle. Despite possessing the highest weight, the highest concentration of power from the internal combustion engine was shown by SUVs (NX300h and RAV4) with a 2.5 dm3 engine; the same trend was obtained when considering the entire hybrid drive. The greatest concentration of energy generated by the plug-in drive was demonstrated by the use of the highest-capacity battery. The value is about three times larger than the others, except for the oldest hybrid version of Toyota—the first-generation Prius. The use of a large battery does not translate into the highest power density value.
A diagnostic tester with TechStream software connected to an On-Board Diagnostics (OBD) system port was used to record data during the test. For electric measurements, this method of data collection is correct and common. Data was recorded at a frequency of 1 Hz. The following parameters were registered:
  • Vehicle speed [km/h];
  • Engine speed [rpm];
  • Voltage [V] and current [A] of MG2 electric motor (the study analyzed data on the MG2 (output) electric motor. This electric machine is responsible for supporting the internal combustion engine and recovering energy during braking);
  • Braking torque [Nm];
  • Battery state of charge [%];
  • Traction battery current and voltage.
The energy flow in the drive system during traction battery discharging, charging and regenerative braking was also calculated:
  • Energy flow:
Δ E = t   = 0 t   =   t max U · Idt
Instantaneous values of energy flow Δ E i were divided according to the following criteria:
  • Discharging:
Δ E dis = t = 0 t = t max U · Idt ( if   Δ E i < 0 )
  • Charging:
Δ E ch = t = 0 t = t max U · Idt   ( if   Δ E i > 0   and   M reg 0 )
  • Regenerative braking:
Δ E reg = t = 0 t = t max U · Idt ( if   Δ E > 0   and   M reg < 0 )
where: U—voltage [V], I—current [A], dt—time [h], Mreg—braking torque [Nm].
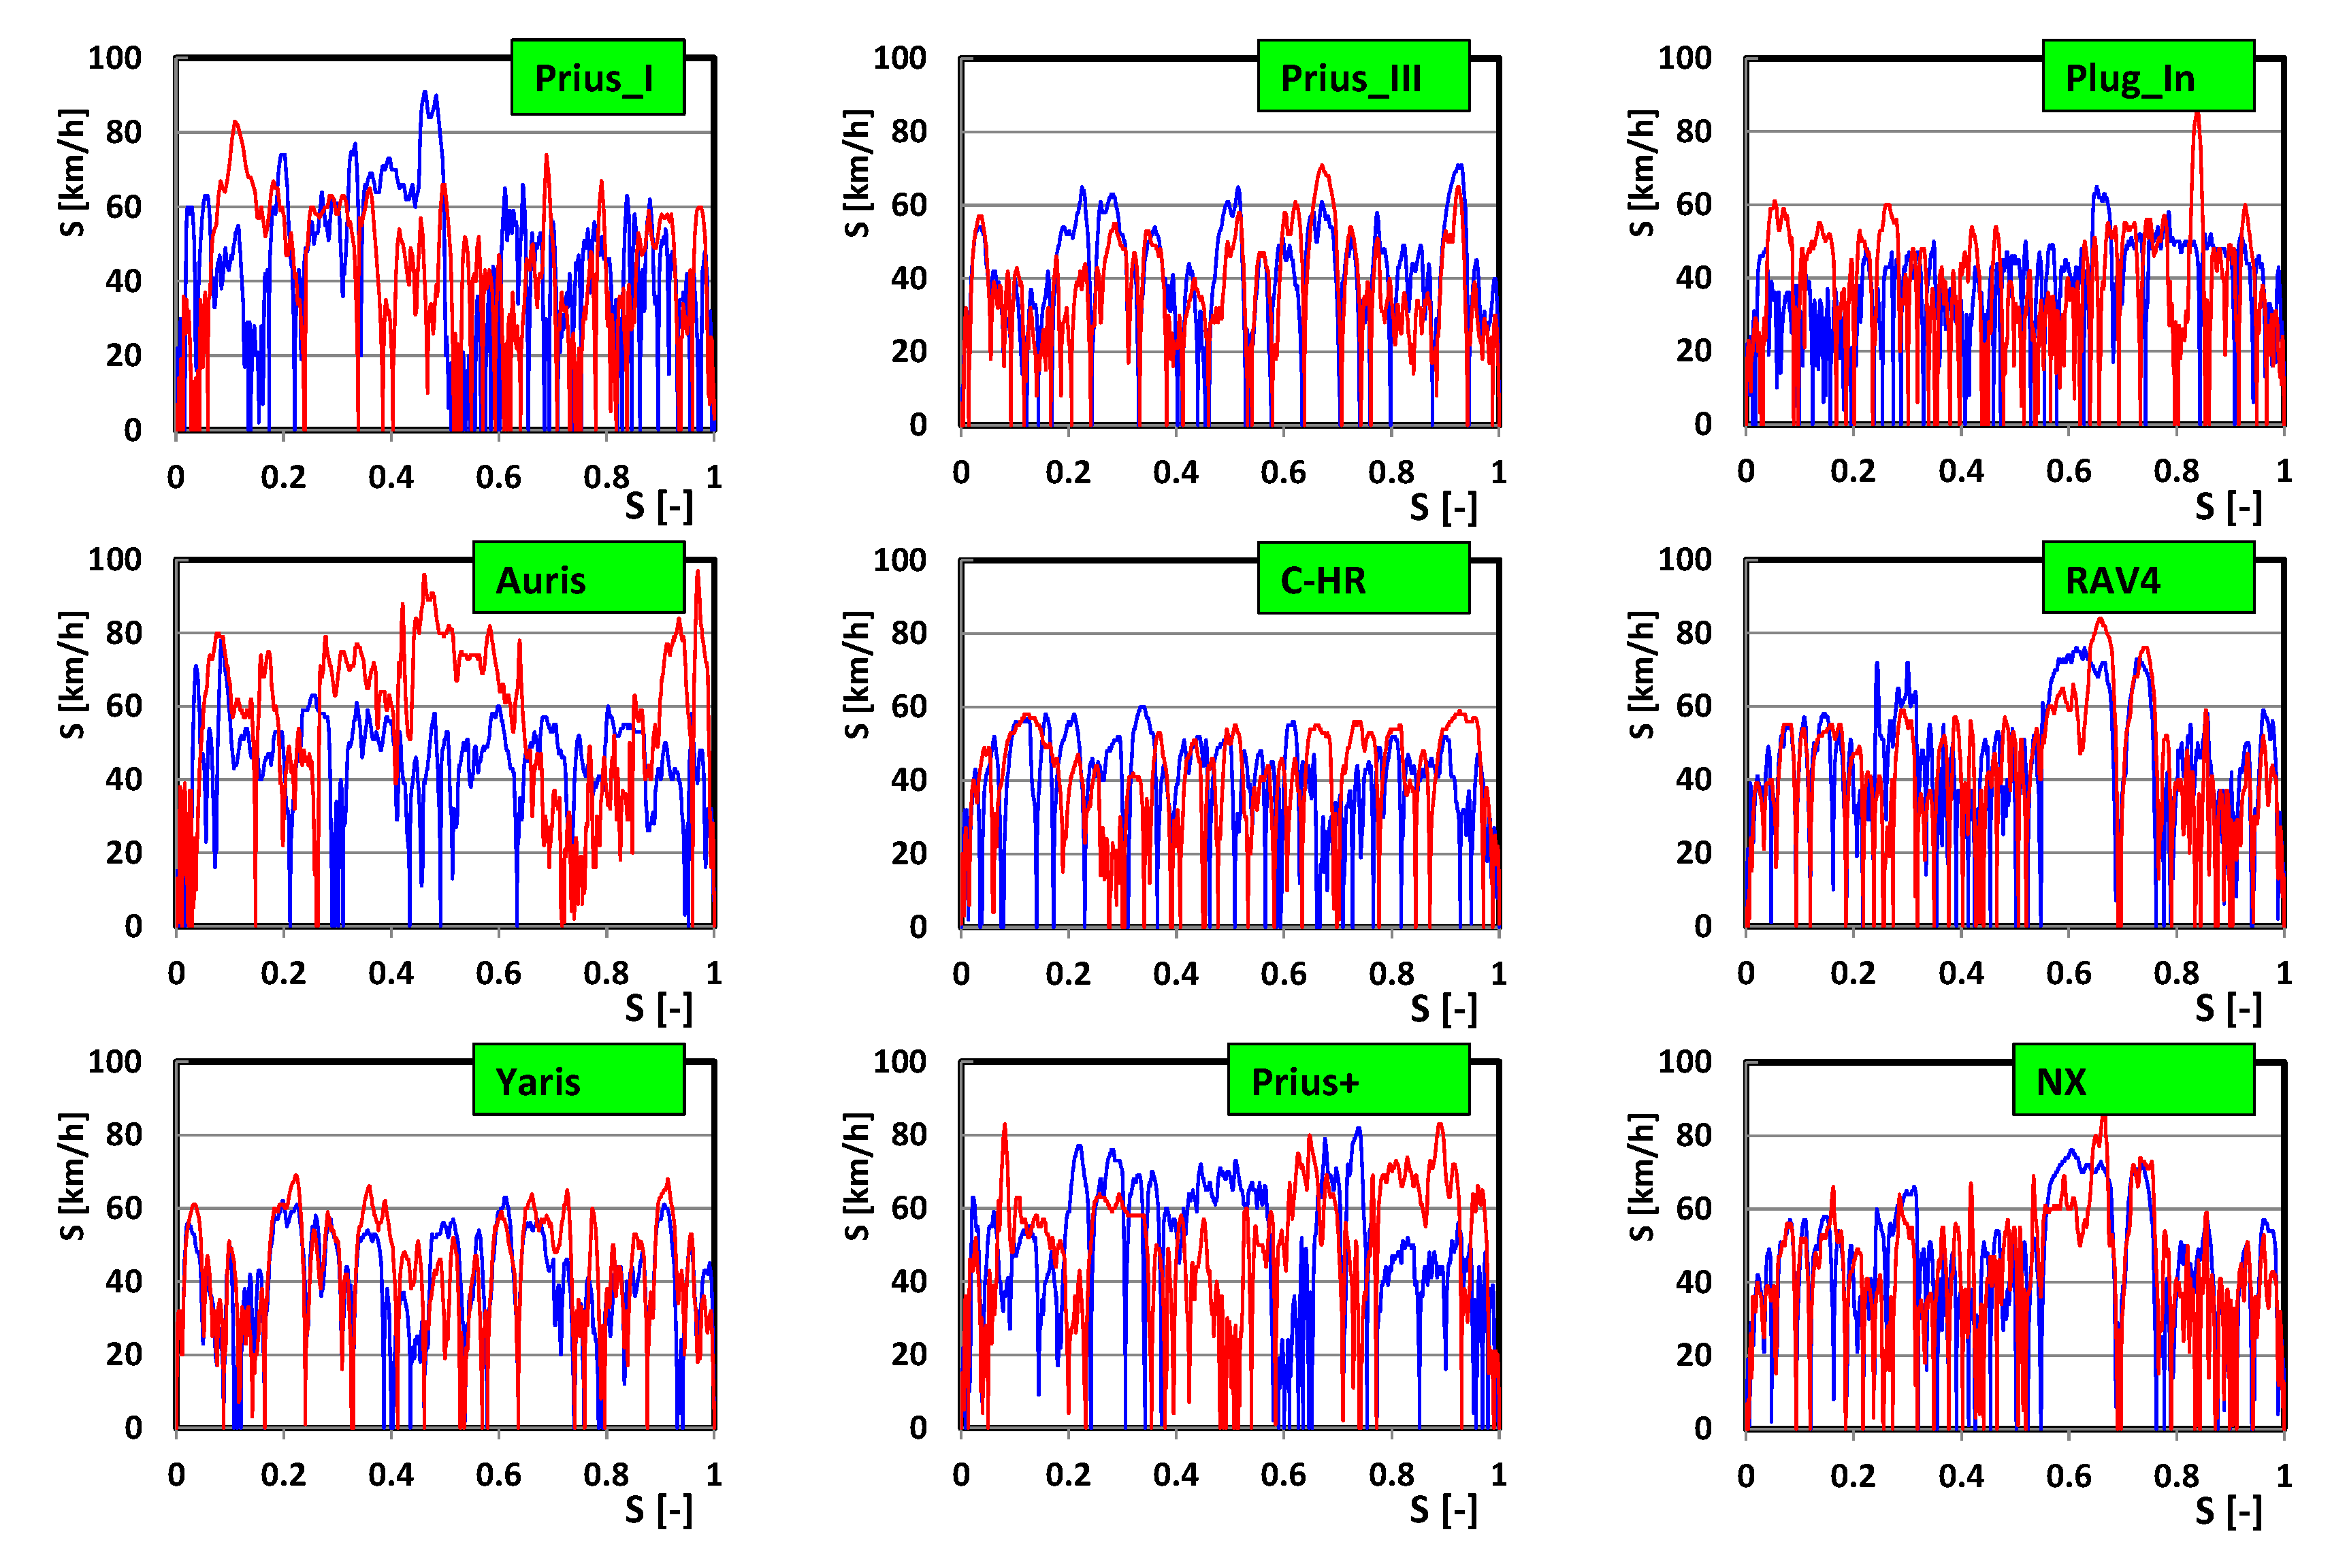
Vehicle tests were conducted under varying urban driving conditions. These conditions were only partially related to the requirements of RDE tests [39]. Analyses were performed in several cities in Poland, and in conditions that comply with traffic regulations. For this reason, despite the urban conditions, sometimes the driving speeds are higher than 50 km/h (Figure 3) (currently, in the RDE test requirements, the speed limit in urban driving conditions is 60 km/h). However, each driving test was performed twice, red marking the first run and blue the second (Figure 3 and Figure 4).
The higher driving speeds were due to traffic regulations in specific driving sections. In this way, typical driving conditions for many vehicles in spring–summer–autumn were repeated. Tests were not conducted in winter conditions (the ambient temperature on individual days was between 15 and 23 Celsius degrees) as changes in battery charging–discharging would significantly affect the results obtained, for example, the time of electric driving participation.
Most of the vehicles were equipped with Ni–MH batteries (Table 1), which resulted in specific values of SOC (state of charge) changes (Figure 4). Li–Ion batteries were present in only two vehicles. Even then, the state of charge did not exceed 70% (Prius+). Tests of the plug-in drive were carried out under conditions of its discharge (SOC of around 14%) from the range that could be recharged only from an external source. Its operating conditions corresponded to the CS (charge-sustaining) method [40], consisting in micro-charging of the battery to maintain a minimum SOC state. Such a method was chosen to determine changes in the SOC of this vehicle’s battery with respect to the other test vehicles.
Two trips were made with each vehicle discussed in the article and, depending on the availability of time and vehicles, the routes were initiated from the same location or back and forth. In addition, the runs of the RAV4 and NX300h vehicles were carried out while driving in tandem, making the routes of the two vehicles as similar to each other as possible.

4. Analysis of Test Routes

Analysis of changes in state of charge indicates that, regardless of route or vehicle, the SOC at the end of the ride is comparable. This was found in cases where the SOC was at either a higher or lower value than the final state during the initial phase of the ride. Initial state-of-charge values varied within a range of ±20%. However, the vehicle typically allows it to move in hybrid mode without using the increased battery capacity. This leaves the increased range of the vehicle to travel in specific conditions that force driving in electric-only mode.
The characteristics of the individual trips shown in Figure 5a indicate the repeatability of certain route characteristics that make it possible to compare the different types of hybrid and plug-in hybrid vehicle powertrains. The proportion of time and distance are presented as relative values from the trips with the largest values. The share of road distance (S) was related to the longest trip of 21.14 km recorded for the Auris vehicle. The contrary was true regarding the share of time: the longest was recorded for the Prius ride and amounted to 58.1 min. The time and road presented in the research refer only to driving in urban test conditions.
All hybrid vehicles are characterized by similar values for the state of charge of the battery in both the initial and final phases, with the exception of the plug-in vehicle, whose absolute value is at a lower level than the other vehicles. However, this is due to the design of the energy accumulation system [39], which maintains a small total battery charge in the absence of recharging from an external source.
The road parameters were determined by the driving parameters for each vehicle, so the shares of acceleration, constant speed, braking and stops were determined (Figure 5b) in addition to the average speed of the vehicle over the entire urban route (Figure 5c). Average speeds were achieved in the range of 15 to 35 km/h, but most trips were made in the 20–25 km/h range, which is highly repeatable given the varying conditions of the urban route. The time shares of the characteristic driving conditions for the city are as follows:
  • During acceleration—about 30%;
  • When driving at constant speed—about 15%;
  • During deceleration—25%;
  • During stops—30%.
However, due to the varying conditions of each route, the individual shares change as shown in Figure 5a.
Though the study was not conducted under RDE test conditions (the start of work on the energy flow issue did not yet include procedures related to the regulations on RDE test conditions), the main indicators of meeting the requirements of these regulations were determined.
The following were determined in accordance with The European Union Regulation (715/2007/EC [41] and 692/2008 [42]) on RDE tests: (a) 95%_centyl and the average value of positive acceleration (relative positive acceleration—RPA) (meeting the conditions a > 0.1 m/s2).
The results of these analyses are shown in Figure 6. Although the tests were not conducted in compliance with the RDE procedure, there were only a few cases in which the results did not these requirements. As Figure 6a shows, only a few runs would not comply with RDE requirements. In the case of average positive acceleration, all tests met the requirements of the RDE test.

5. Assessment of Energy Flow

According to the information in the introduction, hybrid vehicles are characterized by the ability to charge the high-voltage battery while the internal combustion engine is running and during the vehicle’s braking. Both cases of drivetrain operation result in the charging of the traction battery (as shown in Figure 7). In the case of energy recovery from only one source (internal combustion engine operation or braking), the battery discharge values in all trips would be higher, resulting in a negative energy flow rate. The amount of energy recovery from both internal combustion engine operation and braking is always greater than the battery discharge. Total energy is related to Test I and, therefore, indicates changes in the battery’s SOC. Positive values indicate that during each test the battery energy was higher after the test was completed (SOC-e > SOC-s).
The operating conditions of the drivetrain as well as variable route conditions cause the values to contain varying values, but one might point to greater positive energy flows for vehicles with greater weight and dimensions; these are characterized by increased amounts of energy recovered during braking (noticeable for Toyota models C-HR, RAV4 and Lexus NX). These vehicles also experienced greater energy recovery during internal combustion engine operation but increased energy consumption during acceleration; therefore, their total energy flows were at similar levels to the other vehicles tested.
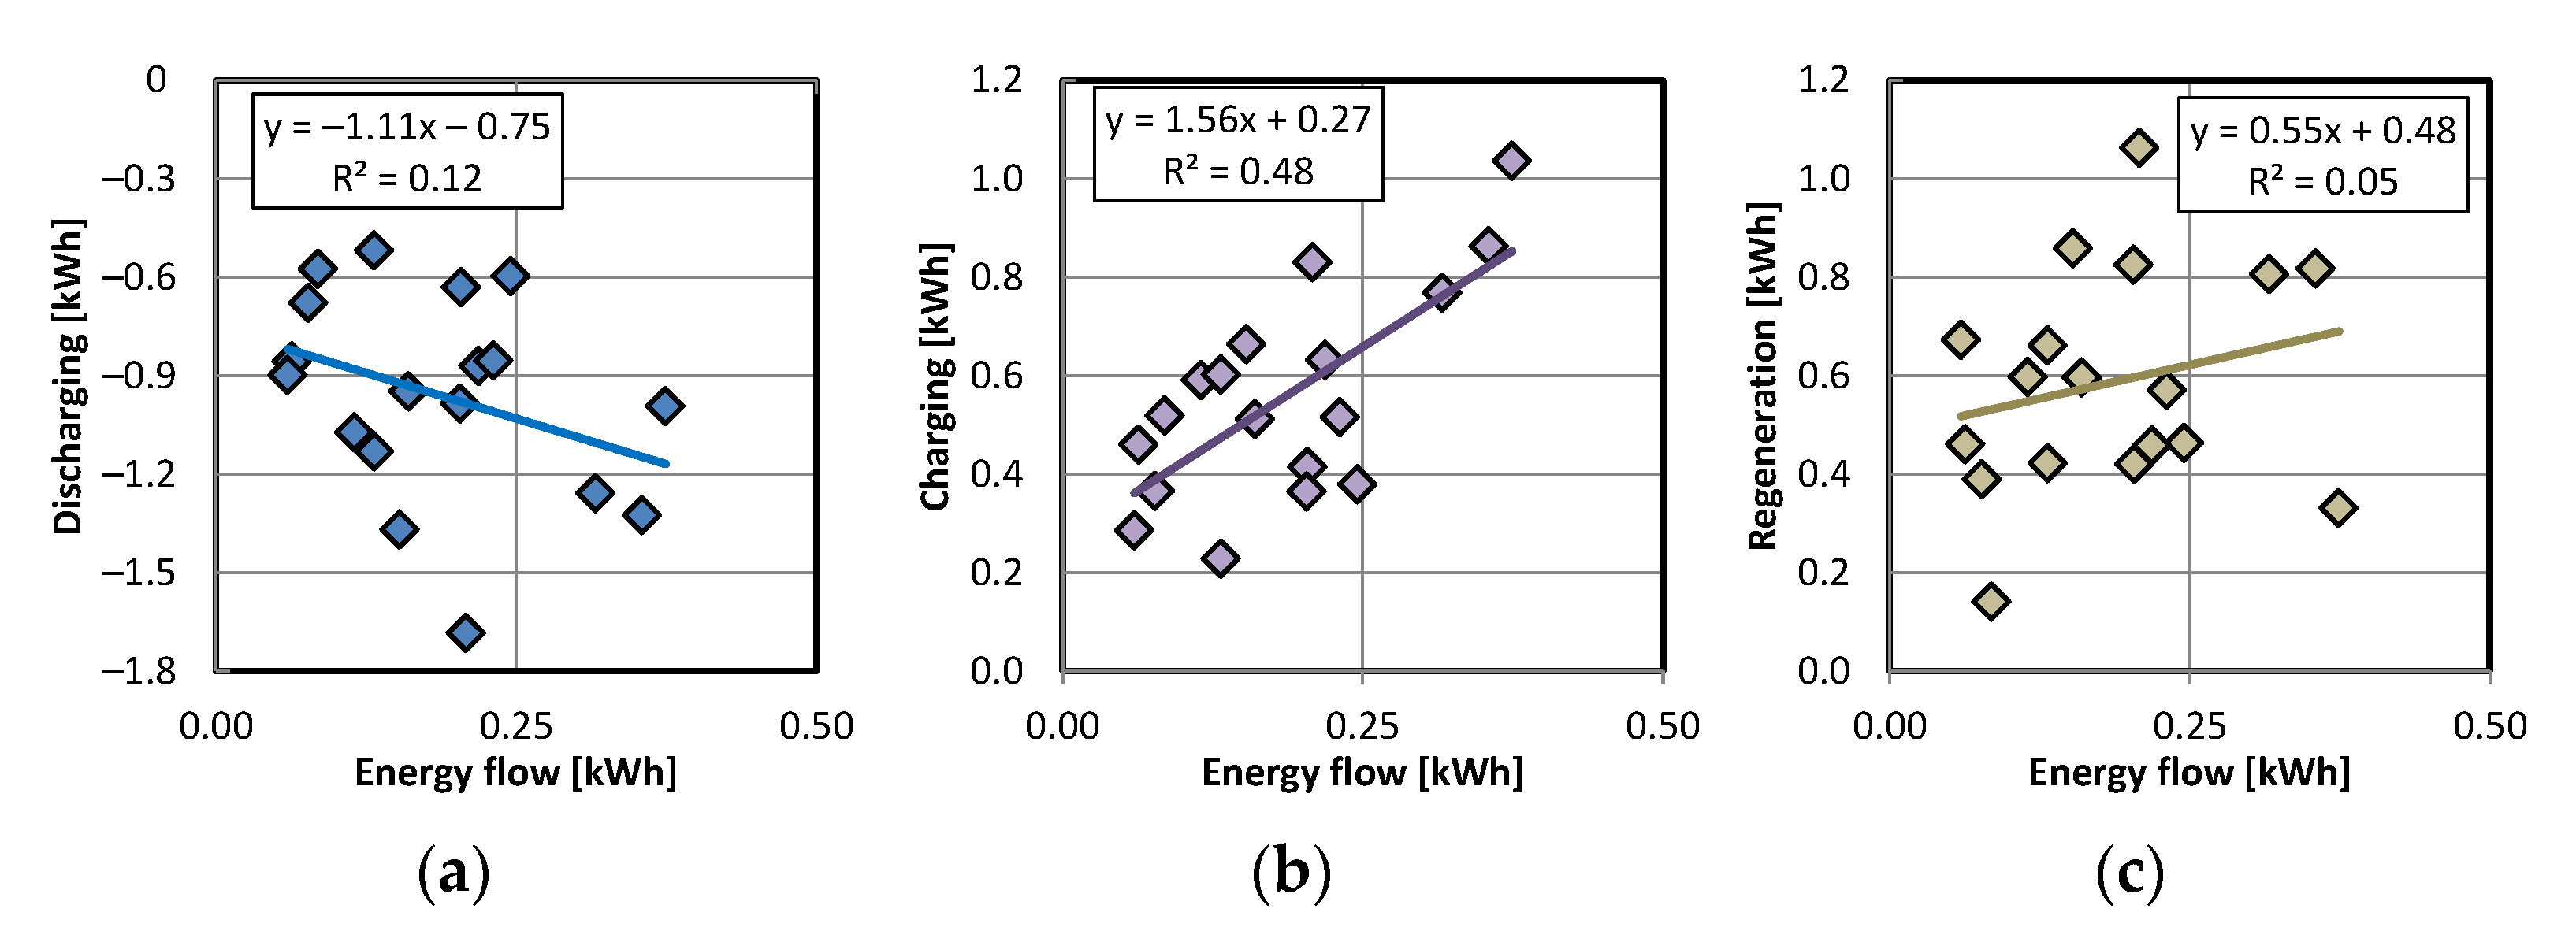
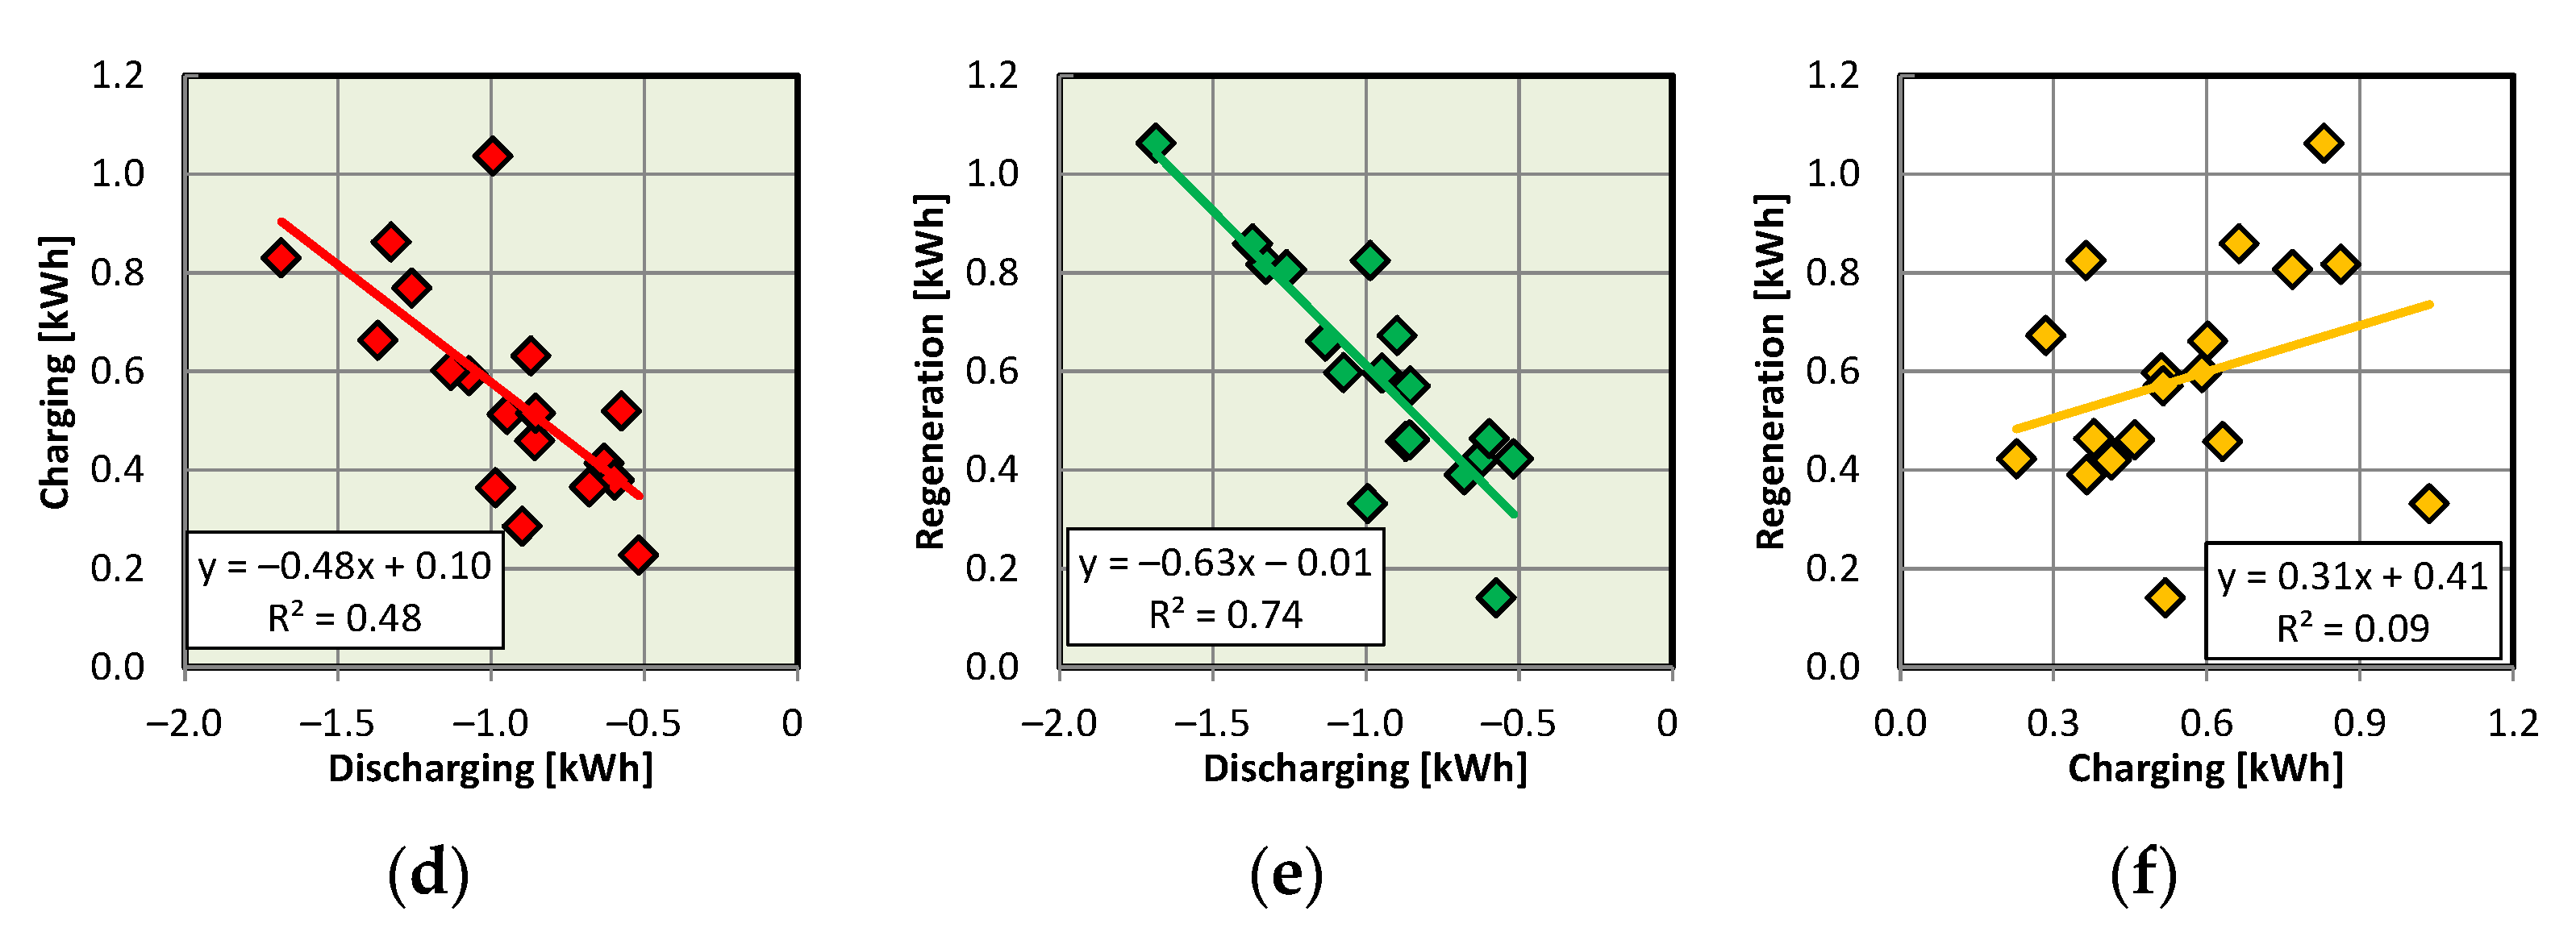
The measured volumes of the energy components were compared with each other to determine the relationship between them. Linear correlations were sought; the results of this work are shown in Figure 8.
The analyses shown in Figure 8 indicate low correlations between the total energy flow and their components (Figure 8a–c). The highest value of the correlation coefficient R2 is 0.48. This value does not indicate the existence of a correlation. A much higher correlation was obtained when analyzing the relation of discharge and charge from regenerative braking (Figure 8d–f). Here, the correlation is more than 0.70. This means that vehicles with a high degree of final battery discharge were also characterized by a high proportion of energy recovery. This is a highly recommended advantage, as it allows a large amount of energy recovery.

6. Identification of the Use of Electric Drive

The test routes were divided into sections in order to determine the driving time in a specific mode:
  • HV drive:
t HV = t i = 0 t max t i dt for   ( a t i = 0 n t i > 600 v t i > 0 )
  • EV drive:
t EV = t i = 0 t max t i dt for   ( a t i = 0 n t i < 600 v t i > 0 )
  • HV acceleration:
t HV   a + = t i = 0 t max t i dt for   ( a t i > 0 n t i > 600 v t i > 0 )
  • EV acceleration:
t EV   a + = t i = 0 t max t i dt for   ( a t i > 0 n t i < 600 v t i > 0 )
  • Standstill:
t stop = t i = 0 t max t i dt for   ( v t i = 0 )
  • HV braking (HV or only engine):
t HV   a = t i = 0 t max t i dt for   ( a t i < 0 n t i > 600 v t i > 0 )
  • EV braking:
t EV   a = t i = 0 t max t i dt for   ( a t i < 0 n t i < 600 v t i > 0 IB t i > 0 )
where: a t i —acceleration over a given time period (Δt = 1 s); v t i —velocity over a given time period (Δt = 1 s); n t i —engine speed over a given time period; IB t i —battery current under braking.
The shares of operating time by hybrid and electric drive conditions, according to Equations (5)–(11), without the involvement of vehicle stops, are shown in Figure 9. The largest shares of the electric drive were registered for vehicle deceleration and are about 70–80%; however, in some models, the internal combustion engine also remained on during deceleration, thereby increasing the share of the hybrid drive in the figure shown.
When driving at a constant speed in urban driving conditions, there was a half share of both powertrains for most vehicles; only the Toyota Prius plug-in vehicle and the Toyota C-HR are characterized by a much higher share of electric propulsion. This is explained by the generation of the powertrain, the most recent among tested vehicles.
During the summary analysis of acceleration by propulsion type, most vehicles are characterized by about 30–50% electric drive. This value will strongly depend on the route conditions determining the vehicle acceleration parameters.
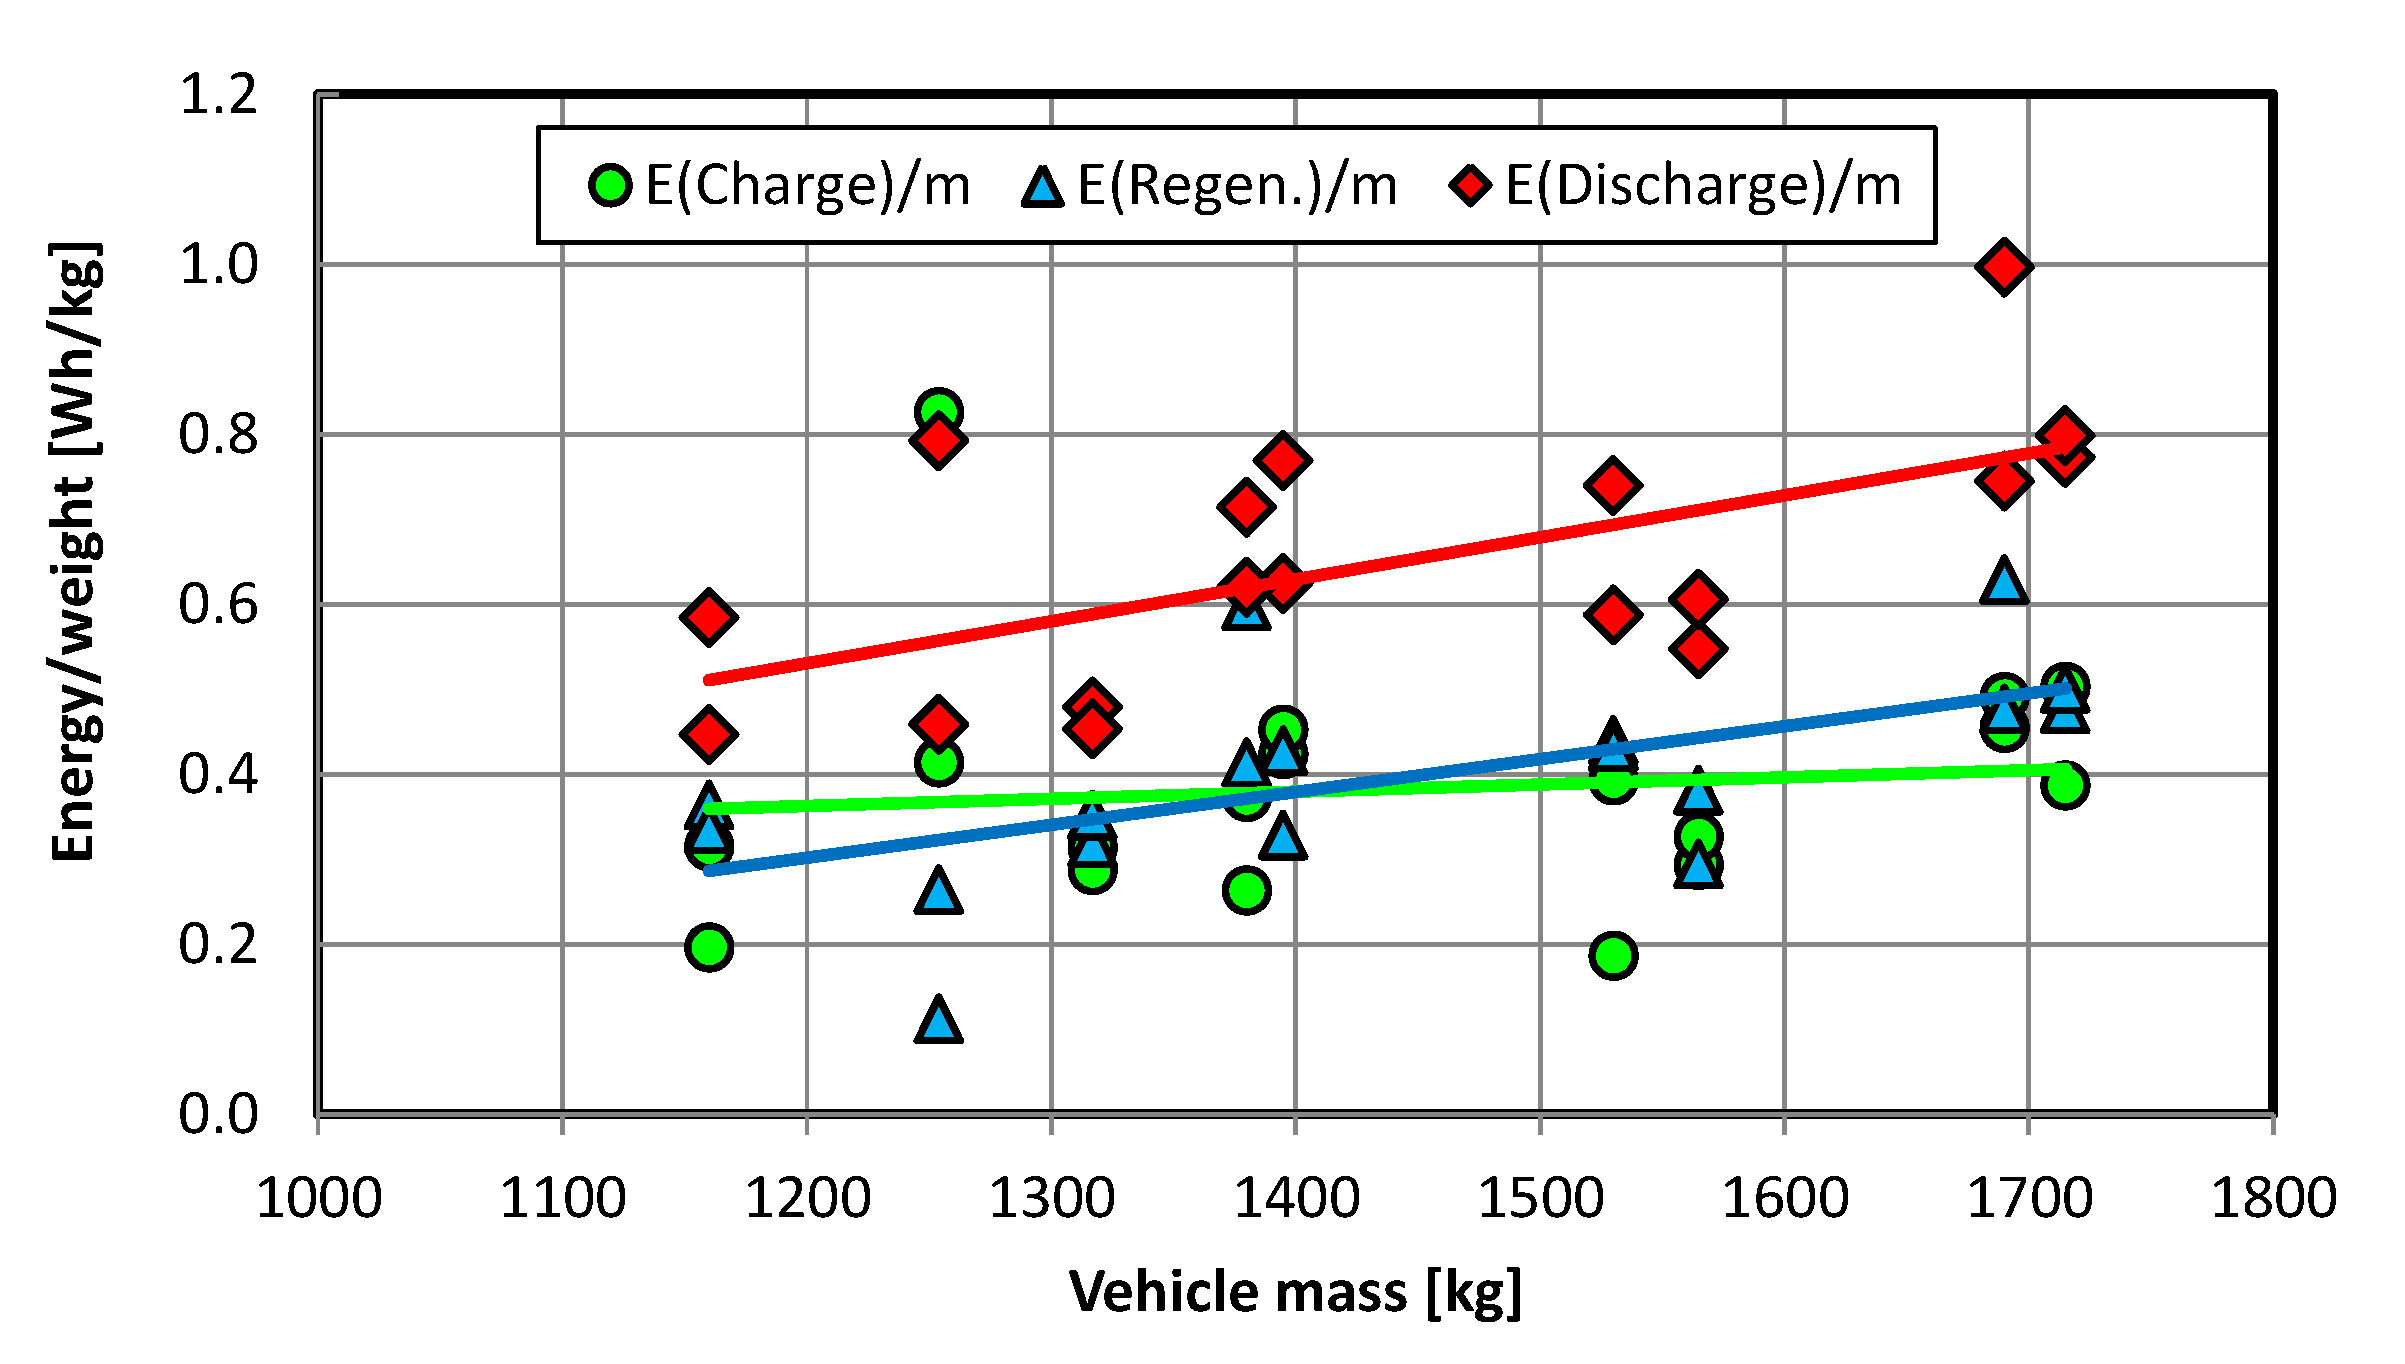
Consideration of the vehicle’s mass allowed us to determine the dependence of the vehicle’s specific energy (per unit mass) related to the discharge energy. The rectilinear dependencies dictated the choice of this magnitude of energy, with a high coefficient of determination (R2) for this energy demonstrated in Figure 8. The results of these measures are shown in Figure 10. Despite the wide discrepancies in the values obtained, the constant value of the specific charging energy should be noted on the vehicle mass. This means that the specific energy of charging is almost a constant quantity (the change varies by about 10%) and does not depend on the vehicle mass when the vehicle is driven in urban conditions. Concerning the value of the specific energy of discharge, the trend line is proportional to the value of the vehicle mass. A 50% change in this mass (its increase) increases specific energy by about 50% as well. A similar relation was noted for the specific energy of regenerative braking. A 50% change in the vehicle mass (its increment) causes a change (increment) in the specific energy of regenerative braking of more than 50%.
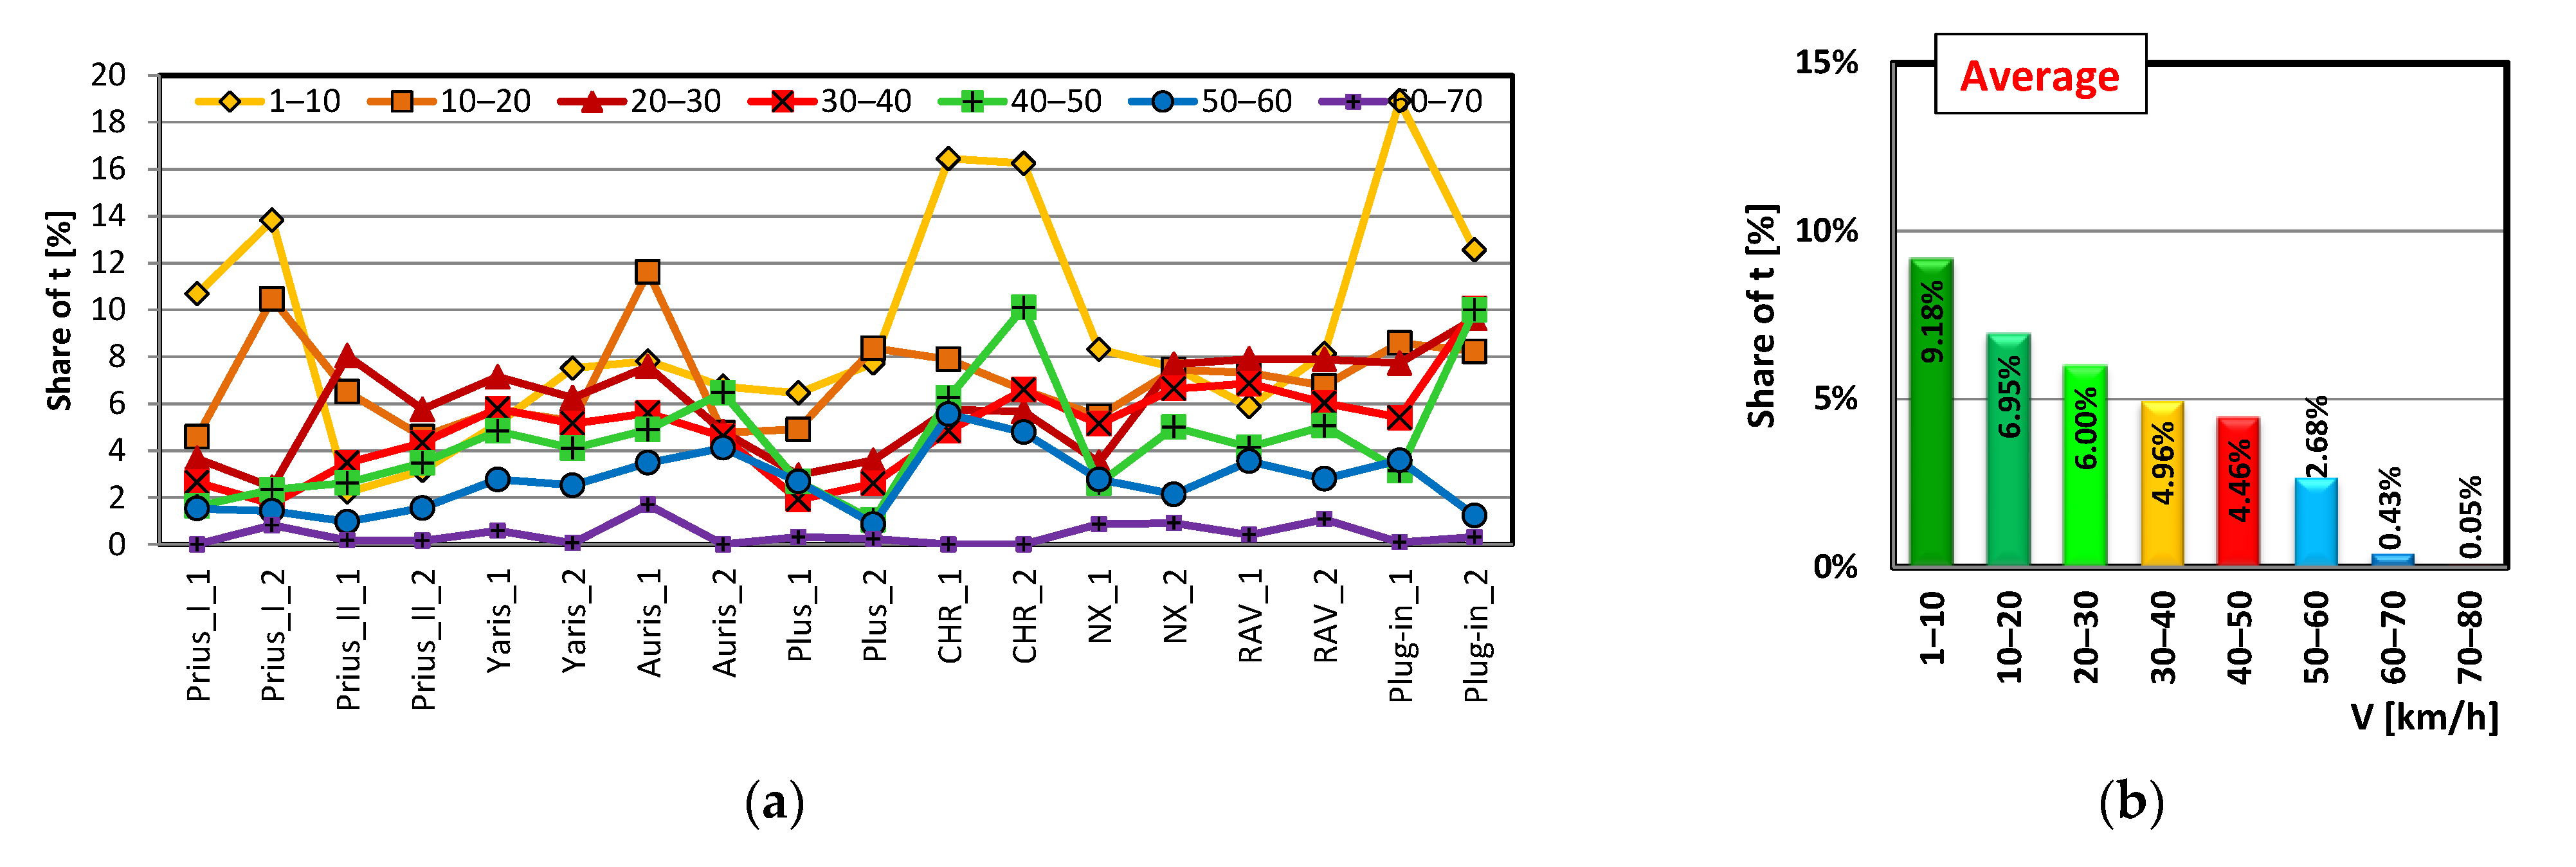
In order to produce more precise determinations of the capabilities and contributions of electric driving in urban driving conditions, speed interval analyses were performed using measurements of the electric drive’s contribution to the driving phase (acceleration, constant speed and braking). This makes it possible to conclude that most of the hybrid vehicles in the study fleet achieved high shares of acceleration in electric mode only in vehicle speed intervals in the range of 1–10 km/h (Figure 11). Individual models also achieved high shares during acceleration in the 10–20 km/h range. However, as the vehicle speed increases, the share of electric drive in the acceleration phase of the vehicle decreases significantly. The shares of energy recovery in the electric mode during braking are at a similar level and range from 2–5% in the speed ranges of 50–10 km/h; below 10 km/h the energy recovery (share of the electric mode) decreases due to the design of the drivetrain, which performs the final stopping of the vehicle with the participation of the conventional braking system.
It is possible to determine the proportion of time moving in electric mode for each vehicle tested (Figure 12). The research concluded that each electric vehicle moves almost 10% of the time in electric mode for speeds up to 10 km/h; the higher the speed, the more that the share of electric mode decreases, reaching less than 5% in the speed range of 40–50 km/h. These values are not large, but it is important to recall that they must be summed to determine the contribution of electric mode in urban driving, which was performed (Figure 13).
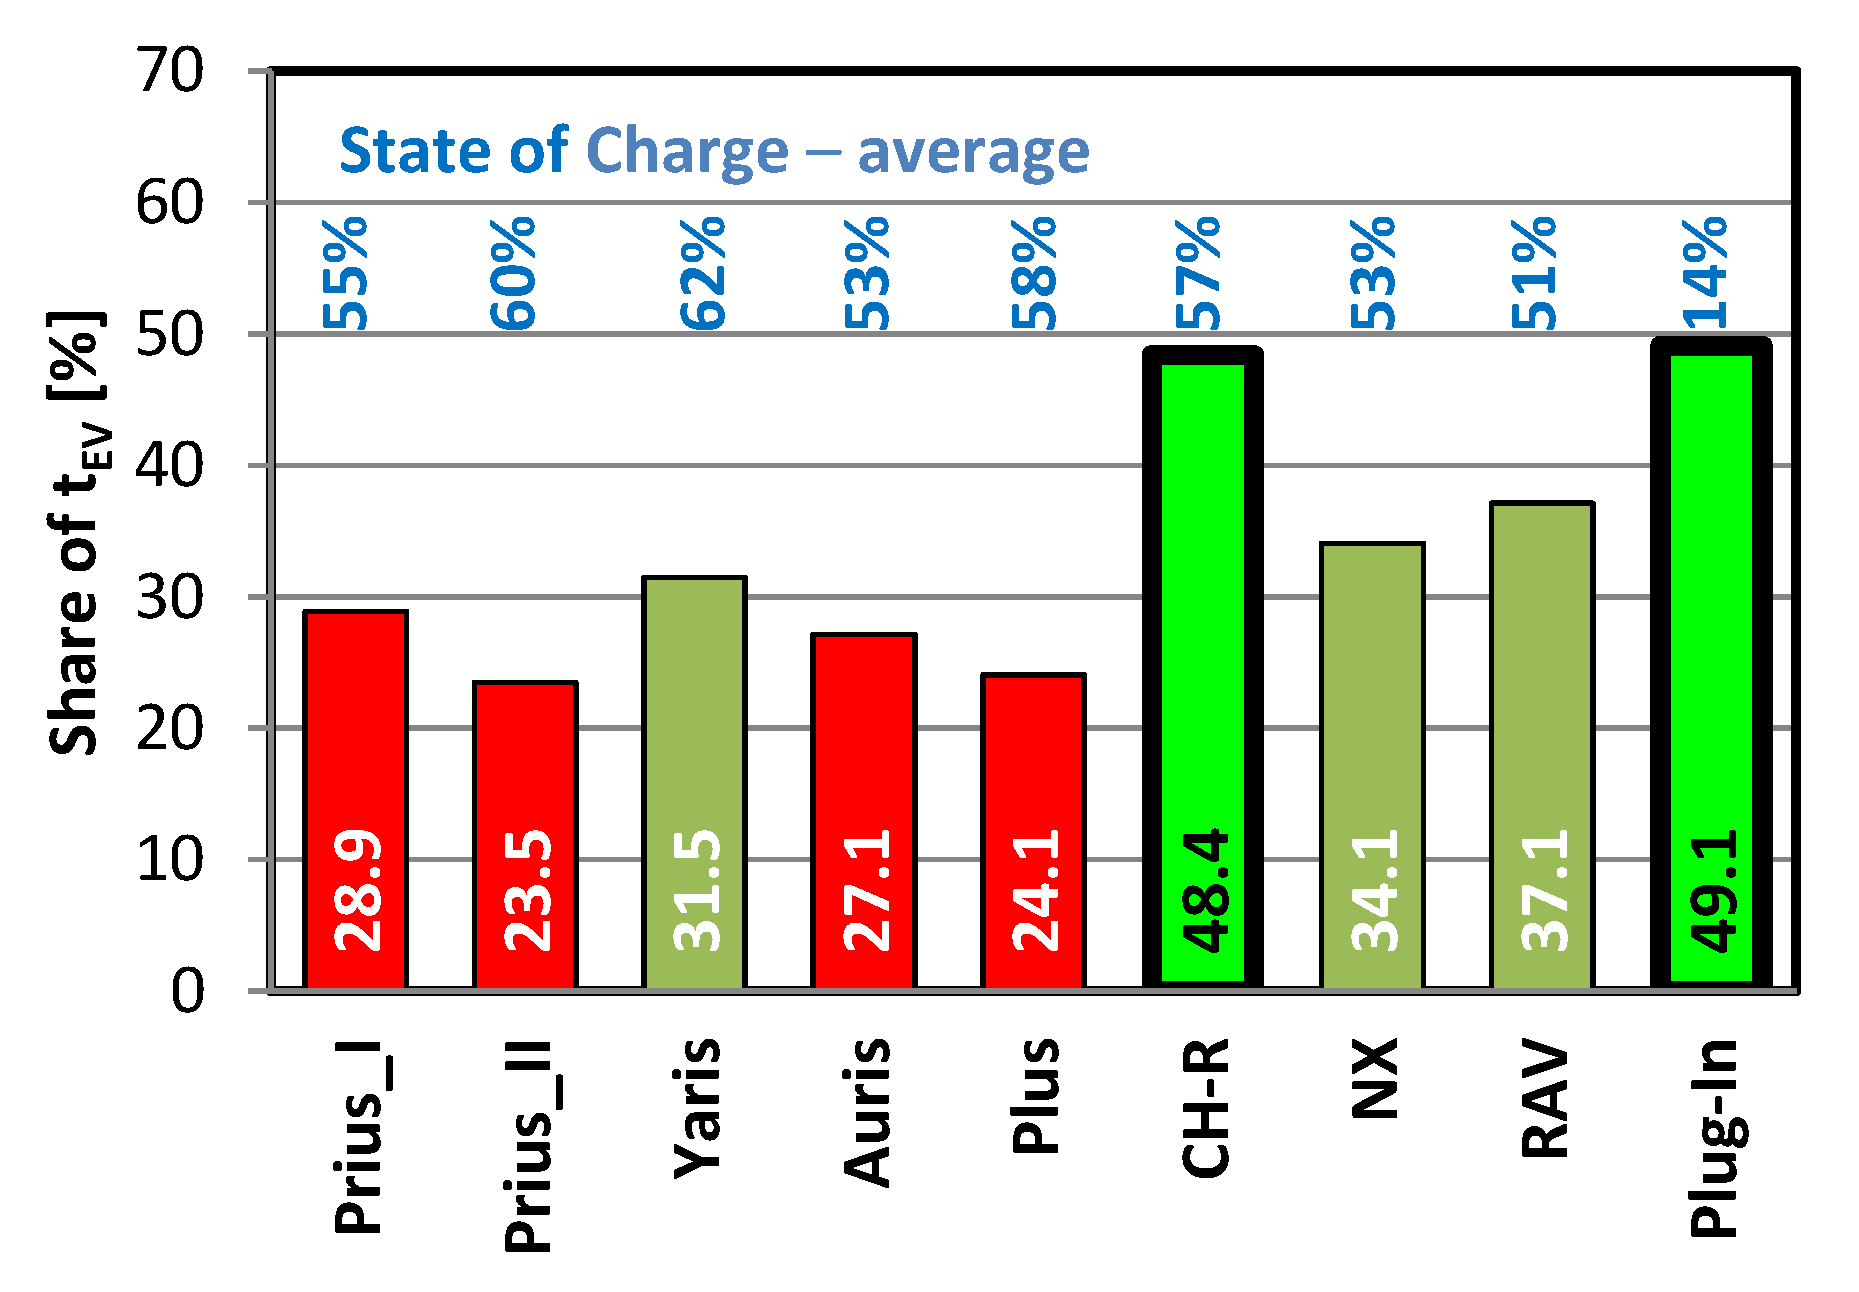
The vehicles tested are characterized by electric mode participation ranging from 23 to 52% of the time in urban driving conditions. Such a wide spread in these values is justified by the testing of many vehicles of different generations. However, individual vehicles achieve more stable values regardless of the type of route and initial battery charge. The two-run averages for each vehicle are shown in Figure 14. Among the vehicles tested, the influence of the type of battery cannot be stated unequivocally, as the lithium–ion battery installed in the plug-in Prius achieved the best electric mode share (despite the lack of charging from an external source); the battery of the same type also achieved the worst result in the Prius+ vehicle. However, these are completely different battery capacities and different vehicle weights.

7. Conclusions

Over the years, hybrid vehicles have proven their usefulness, especially in urban driving conditions. Regardless of the generation of the powertrain, a hybrid vehicle uses only electric propulsion in the city more than 30% of the time. This value can reach almost 50% for selected models tested. However, it should be particularly noted that these drives were not carried out according to the guidelines of the current tests in real driving conditions, which would increase this value up to 70–80% [43,44]. This means that typical test conditions (RDE test) still do not reflect real urban driving conditions.
Based on the research conducted, specific conclusions were also determined:
  • Analysis of the energy flow in urban conditions indicates a large share of battery charging and regeneration energy. This means that the HEV’s propulsion system in urban conditions uses up to 50% of the recovered energy.
  • Under urban conditions, the total amount of electricity is positive (in all studies analyzed). This means that SOC-e > SOC-s (the final energy stored in the battery is greater than the initial energy).
  • The average share of electric propulsion in city driving depends marginally on the average SOC. In addition, in city mode, the type of battery does not matter either: with both Ni–MH and Li–Ion, it is possible to achieve about 50% electric mode share in city driving (C-HR and Prius plug-in).
  • The value of energy recovered during braking in most driving is greater than the value of charging from the engine. The sum of these values is greater than the energy of battery discharge during urban driving. The state of charge of the battery varies independently of the tested vehicle, showing mostly positive values relative to the initial SOC, determined by the characteristics of the route. Positive values of energy flow (Figure 7) indicate typical control of energy flow in a hybrid drive (indicating positive energy flow regardless of urban driving conditions).
  • Steady state driving conditions (Figure 9) are generally characterized by a much higher proportion of electric drive than hybrid drive. Negative vehicle acceleration (braking) has similar effects. However, vehicle acceleration in urban traffic is characterized by a 70% share of the use of hybrid propulsion; electric propulsion is used only 30% of the time.
  • The share of electric propulsion in urban conditions is highest at the slowest driving speeds (Figure 11). This means that initiating the motion of the vehicle is realized in electric mode. As the speed increases, the share of the electric drive decreases. At speeds above 60 km/h, the vehicle operates only in hybrid drive. Such conclusions were also confirmed when the vehicles were analyzed cumulatively (Figure 12b).
  • Analyses of the use of electric propulsion in hybrid vehicles indicate that the share of electric propulsion in urban conditions is greater than 30% (Figure 13). Only in 2 cases out of 18 test samples (that is, slightly more than 11%) was this share lower (23.3% and 26.4%, respectively). The maximum share of electric propulsion obtained during the tests was 52.7%. The lower the average speed of the vehicle during the tests, the higher the share of electric drive in the total time (taking into account data from Figure 5, Figure 11 and Figure 14).

Author Contributions

Conceptualization, I.P., W.C. and F.S.; methodology, I.P. and W.C.; software, I.P. and W.C.; validation, I.P., W.C. and F.S.; formal analysis, I.P., W.C. and F.S.; investigation, I.P., W.C. and F.S.; resources, I.P., W.C. and F.S.; data curation, I.P., W.C. and F.S.; writing—original draft preparation, I.P., W.C. and F.S.; writing—review and editing, I.P., W.C. and F.S.; visualization, I.P. and F.S.; supervision, W.C. and F.S.; project administration, I.P., W.C. and F.S. All authors have read and agreed to the published version of the manuscript.

Funding

The research was funded by Poznan University of Technology with grant number 0415/SBAD/0337 and 0415/SBAD/0338.

Data Availability Statement

The data presented in this study are available on request from the corresponding author.

Acknowledgments

The authors would like to thank Toyota and Lexus Academy in the Toyota Motor Poland Company Sp. z o.o. in Warsaw, Poland, for their provision of vehicles for testing.

Conflicts of Interest

The authors declare no conflict of interest.

References

  1. Conway, G.; Joshi, A.; Leach, F.; García, A.; Senecal, P.K. A review of current and future powertrain technologies and trends in 2020. Transp. Eng. 2021, 5, 100080. [Google Scholar] [CrossRef]
  2. Zheng, Q.; Tian, S.; Cai, W. Powertrain hybridization and parameter optimization design of a conventional fuel vehicle based on the multi-objective particle swarm optimization algorithm. SAE Int. J. Pass. Veh. Syst. 2022, 15, 151–168. [Google Scholar] [CrossRef]
  3. FleetEurope. Available online: https://www.fleeteurope.com/en/new-energies/europe/features/hybrid-electric-vehicles-grab-quarter-eu-passenger-car-market?t%5B0%5D=Electrification&curl=1 (accessed on 31 September 2022).
  4. International Energy Agency. World Energy Outlook 2022. Available online: www.iea.org (accessed on 9 October 2022).
  5. Zhang, Z.; Li, A.; Ma, Z.; Huang, Z.; Zhu, L. Fundamental study on oxidation properties at elevated pressure of typical renewable synthetic liquid fuels through low-temperature CO2 electroreduction. Fuel 2023, 331, 125705. [Google Scholar] [CrossRef]
  6. da Silva Pinto, R.L.; Vieira, A.C.; Scarpetta, A.; Marques, F.S.; Jorge, R.M.M.; Bail, A.; Jorge, L.M.M.; Corazza, M.L.; Ramos, L.P. An overview on the production of synthetic fuels from biogas. Bioresour. Technol. Rep. 2022, 18, 101104. [Google Scholar] [CrossRef]
  7. Stępień, Z. A comprehensive overview of hydrogen-fueled internal combustion engines: Achievements and future challenges. Energies 2021, 14, 6504. [Google Scholar] [CrossRef]
  8. Czerwinski, J.; Comte, P.; Stepien, Z.; Oleksiak, S. Effects of ethanol blend fuels E10 and E85 on the non-legislated emissions of a flex fuel passenger car. In SAE Technical; SAE International: Warrendale, PA, USA, 2016. [Google Scholar] [CrossRef]
  9. Liu, Y.; Jing, J.; Jie, W.; Wang, Y.; Huang, W.; Yu, X. Research on vehicle mode control in P2.5 hybrid system. Energy Rep. 2021, 7, 72–85. [Google Scholar] [CrossRef]
  10. Eckert, J.J.; Silva, F.L.; da Silva, S.F.; Bueno, A.V.; de Oliveira, M.L.M.; Silva, L.C.A. Optimal design and power management control of hybrid biofuel–electric powertrain. Appl. Energy 2022, 325, 119903. [Google Scholar] [CrossRef]
  11. Frasci, E.; Cervone, D.; Nacci, G.; Sementa, P.; Arsie, I.; Jannelli, E.; Vaglieco, B.M. Comprehensive model for energetic analyses of a series hybrid-electric vehicle powered by a passive Turbulent Jet Ignition engine. Energy Convers. Manag. 2022, 269, 116092. [Google Scholar] [CrossRef]
  12. Bajerlein, M.; Karpiuk, W.; Smolec, R. Use of gas desorption effect in injection systems of diesel engines. Energies 2021, 14, 244. [Google Scholar] [CrossRef]
  13. Bor, M.; Borowczyk, T.; Idzior, M.; Karpiuk, W.; Smolec, R. Analysis of hypocycloid drive application in a high-pressure fuel pump. MATEC Web Conf. 2017, 118, 20. [Google Scholar] [CrossRef] [Green Version]
  14. Schöffmann, W.; Sorger, H.; Fürhapter, A.; Kapus, P.; Teuschl, G.; Sams, C. The ice in the electrified powertrain—Modular approach within a common platform be-tween cost and CO2 optimization. In Internationaler Motorenkongress 2019; Springer Vieweg: Wiesbaden, Germany, 2019; pp. 75–101. [Google Scholar] [CrossRef]
  15. Fathabadi, H. Fuel cell hybrid electric vehicle (FCHEV): Novel fuel cell/SC hybrid power generation system. Energy Convers. Manag. 2018, 156, 192–201. [Google Scholar] [CrossRef]
  16. Pielecha, I.; Szwajca, F. Cooperation of a PEM fuel cell and a NiMH battery at various states of its charge in a FCHEV drive. Eksploat. Niezawodn. 2021, 23, 468–475. [Google Scholar] [CrossRef]
  17. Balcı, Ö.; Karagöz, Y.; Kale, S.; Damar, S.; Attar, A.; Köten, H.; Dalkılıç, A.S.; Wongwises, S. Fuel consumption and emission comparison of conventional and hydrogen feed vehicles. Int. J. Hydrogen Energy 2021, 46, 16250–16266. [Google Scholar] [CrossRef]
  18. Verma, S.; Mishra, S.; Gaur, A.; Chowdhury, S.; Mohapatra, S.; Dwivedi, G.; Verma, P. A comprehensive review on energy storage in hybrid electric vehicle. J. Traffic Transport. Eng. 2021, 8, 621–637. [Google Scholar] [CrossRef]
  19. Burke, A. Ultracapacitor technologies and application in hybrid and electric vehicles. Int. J. Energy Res. 2009, 34, 133–151. [Google Scholar] [CrossRef] [Green Version]
  20. Sprengel, M.; Bleazard, T.; Haria, H.; Ivantysynova, M. Implementation of a novel hydraulic hybrid powertrain in a sports utility vehicle. IFAC-Papers Online 2015, 48, 187–194. [Google Scholar] [CrossRef]
  21. Cronk, P.; Van de Ven, J. A study of hydraulic hybrid vehicle topologies with fly-wheel energy storage. In SAE Technical; SAE International: Warrendale, PA, USA, 2017. [Google Scholar] [CrossRef]
  22. Zhuang, W.; Li, S.; Zhang, X.; Kum, D.; Song, Z.; Yin, G.; Ju, F. A survey of powertrain configuration studies on hybrid electric vehicles. Appl. Energy 2020, 262, 114553. [Google Scholar] [CrossRef]
  23. Kumaran, A.; Emran, A.; Rajan, R.S.; Sharma, V.; Sadekar, G.; Laermann, M.; Kötter, M.; Lahey, H.-P.; Körfer, T. Affordable hybrid topology for PV and LDV's in prospering India: Case study of 48 V (P)HEV system benefits. In Proceedings of the 2017 IEEE Transportation Electrification Conference (ITEC-India), Pune, India, 13–15 December 2017; pp. 1–6. [Google Scholar] [CrossRef]
  24. Jing, J.; Liu, Y.; Wu, J.; Huang, W.; Zuo, B.; Yang, G. Research on drivability control in P2.5 hybrid system. Energy Rep. 2021, 7, 1582–1593. [Google Scholar] [CrossRef]
  25. Englisch, A.; Pfund, T.; Reitz, D.; Simon, E.; Kolb, F. Synthesis of various hybrid drive systems. In Der Antrieb von Morgen 2017; Liebl, J., Ed.; Springer Vieweg: Wiesbaden, Germany, 2017. [Google Scholar] [CrossRef]
  26. Yang, Y.; Hu, X.; Pei, H.; Peng, Z. Comparison of power-split and parallel hybrid powertrain architectures with a single electric machine: Dynamic programming approach. Appl. Energy 2016, 168, 683–690. [Google Scholar] [CrossRef]
  27. Kapadia, J.; Kok, D.; Jennings, M.; Kuang, M.; Masterson, B.; Isaacs, R.; Dona, A.; Wagner, C.; Gee, T. Powersplit or parallel—Selecting the right hybrid architecture. SAE Int. J. Altern. Powertrains 2017, 6, 68–76. [Google Scholar] [CrossRef]
  28. Zahabi, S.A.; Miranda-Moreno, L.; Barla, P.; Vincent, B. Fuel economy of hybrid-electric versus conventional gasoline vehicles in real-world conditions: A case study of cold cities in Quebec, Canada. Transp. Res. Part D Transp. Environ. 2014, 32, 184–192. [Google Scholar] [CrossRef]
  29. Huang, Y.; Surawski, N.C.; Organ, B.; Zhou, J.L.; Tang, O.H.H.; Chan, E.F.C. Fuel consumption and emissions performance under real driving: Comparison between hybrid and conventional vehicles. Sci. Total Environ. 2019, 659, 275–282. [Google Scholar] [CrossRef] [PubMed]
  30. Prati, M.V.; Costagliola, M.A. Real driving emissions of Euro 6 electric/gasoline hybrid and natural gas vehicles. Transp. Res. Part D Transp. Environ. 2022, 113, 103509. [Google Scholar] [CrossRef]
  31. Thomas, J.; Huff, S.; West, B.; Chambon, P. Fuel consumption sensitivity of conventional and hybrid electric light-duty gasoline vehicles to driving style. SAE Int. J. Fuels Lubr. 2017, 10, 672–689. [Google Scholar] [CrossRef] [Green Version]
  32. An, F.; Santini, D.J. Mass impacts on fuel economies of conventional vs. hybrid electric vehicles. In SAE Technical; SAE International: Warrendale, PA, USA, 2004. [Google Scholar] [CrossRef]
  33. Reynolds, C.; Kandlikar, M. How hybrid-electric vehicles are different from conventional vehicles: The effect of weight and power on fuel consumption. Environ. Res. Lett. 2007, 2, 014003. [Google Scholar] [CrossRef]
  34. Automotive Catalog. Available online: Auto-Data.net (accessed on 20 October 2022).
  35. Toyota Motor Europe. Toyota Service and Repair Information. Available online: www.toyota-tech.eu (accessed on 24 October 2022).
  36. Taniguchi, M.; Yashiro, T.; Takizawa, K.; Baba, S.; Tschuide, M.; Mizutani, T.; Endo, H.; Kimura, H. Development of new hybrid transaxle for compact-class vehicles. In SAE Technical; SAE International: Warrendale, PA, USA, 2016. [Google Scholar] [CrossRef]
  37. Suzuki, Y.; Nishimine, A.; Baba, S.; Miyasaka, K.; Tsuchida, M.; Endo, H.; Yamamura, N.; Miyazaki, T. Development of new plug-in hybrid transaxle for compact-class vehicles. In SAE Technical; SAE International: Warrendale, PA, USA, 2017. [Google Scholar] [CrossRef]
  38. Ikeyama, T.; Ishikawa, K.; Nozawa, N. Development of power control unit for compact-class vehicle. In SAE Technical; SAE International: Warrendale, PA, USA, 2020. [Google Scholar] [CrossRef]
  39. Merkisz, J.; Pielecha, J.; Radzimirski, S. New Trends in Emission Control in the European Union; Springer Tracts on Transportation and Traffic: Cham, Switzerland, 2014; Volume 4, p. 170. [Google Scholar] [CrossRef]
  40. Zhang, B.; Mi, C.C.; Zhang, M. Charge-Depleting Control Strategies and Fuel Optimization of Blended-Mode Plug-In Hybrid Electric Vehicles. IEEE Trans. Veh. Technol. 2011, 60, 1516–1525. [Google Scholar] [CrossRef]
  41. The European Parliament and The Council of The European Union. Commission Regulation (EC) 715/2007 of the European Parliament and of the Council of 20 June 2007 on Type Approval of Motor Vehicles with Respect to Emissions from Light Passenger and Commercial Vehicles (Euro 5 and Euro 6) and on Access to Vehicle Repair and Maintenance Information. Off. J. Eur. Union 2007, L171, 1–16. [Google Scholar]
  42. The Commission of the European Communities. Commission Regulation (EC) 692/2008 of 18 July 2008 Implementing and Amending Regulation (EC) 715/2007 of the European Parliament and of the Council on Type-Approval of Motor Vehicles with Respect to Emissions from Light Passenger and Commercial Vehicles (Euro 5 and Euro 6) and on Access to Vehicle Repair and Maintenance Information, European Commission (EC). Off. J. Eur. Union 2008, L199, 1–136. [Google Scholar]
  43. Cieslik, W.; Zawartowski, J.; Fuc, P. The impact of the drive mode of a hybrid drive system on the share of electric mode in the RDC test. In SAE Technical; SAE International: Warrendale, PA, USA, 2020. [Google Scholar] [CrossRef]
  44. Pielecha, I.; Cieslik, W.; Szalek, A. Impact of combustion engine operating conditions on energy flow in hybrid drives in RDC tests. In SAE Technical; SAE International: Warrendale, PA, USA, 2020. [Google Scholar] [CrossRef]
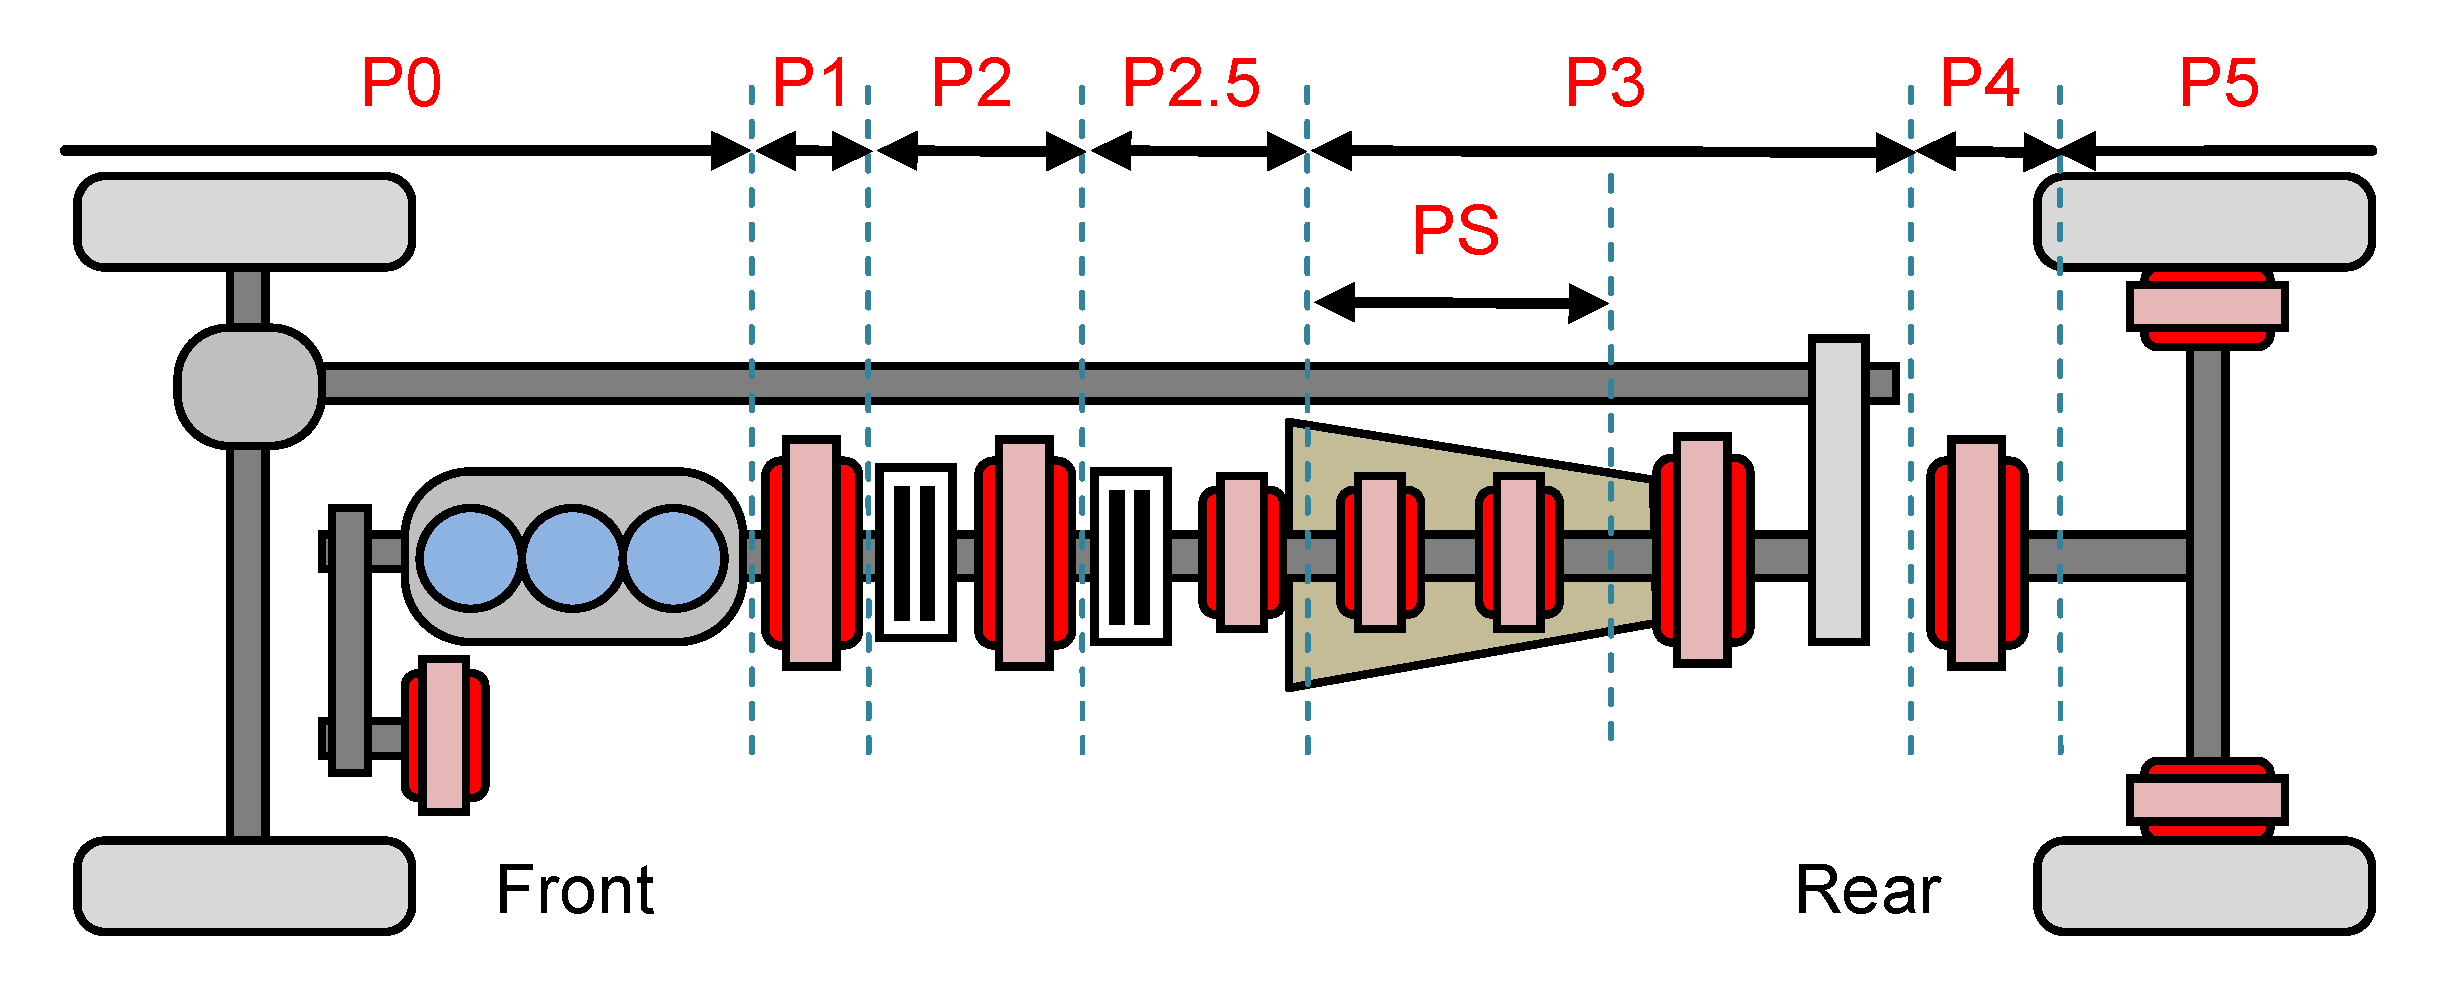
Figure 1. Topology of hybrid drive systems (based on [23]); P0—electric motor is used only to start the combustion engine or to use it as a starter–alternator; the power is transmitted by a V-belt; P1—electric motor in inserted between the combustion engine (ICE) and the clutch; configuration P2—contains the electric motor placed behind the clutch; intermediate configuration P2.5—designates the positioning of the electric motor in a dual clutch transmission (DCT) [24]; P3 configuration—indicates the electric motor is mounted at the output of the transmission; combining two electric motors with a planetary gear results in a power split (PS) [25]; mounting the electric motor on the rear axle is the P4 solution; P5 architecture—electric motors are placed in the wheels of the vehicle; a combination of solutions is possible (also in terms of 4 × 4 drive systems).
Energies 16 00794 g001
Figure 2. Range of production years for hybrid vehicle models used in the study [34,35].
Energies 16 00794 g002
Figure 3. Vehicle speed profiles during the tests (distance as a relative value is shown on the horizontal axis).
Energies 16 00794 g003
Figure 4. Variation analysis of battery state of charge resulting from the condition of vehicle movement in relation to the distance traveled.
Energies 16 00794 g004
Figure 5. Analysis of vehicle traffic conditions: (a) percentage of time and distance traveled, as well as initial and final battery state of charge; (b) share of acceleration, constant speed, braking, stopping; (c) average speed (S—normalized distance; t—normalized time; SOC-s—SOC at the start test; SOC-e—SOC at the end test; a—acceleration; stop—normalized stop time of the car; V—vehicle speed).
Energies 16 00794 g005
Figure 6. Conditions for carrying out tests against the background of the new requirements of the RDE regulations: (a) 95%_centyl; (b) average value of positive vehicle acceleration.
Energies 16 00794 g006
Figure 7. Analysis of energy flow in hybrid drives under urban driving conditions: (a) total energy flow (sum of discharging, charging and charging during regenerative braking); (b) discharge; (c) charging; (d) charging during regenerative braking.
Energies 16 00794 g007
Figure 8. Comparative analysis of the relation: (ac) between total energy flow, discharge energy, charging energy and energy recovered during vehicle braking; (df) between energy recovered during vehicle braking, charging and discharging.
Energies 16 00794 g008aEnergies 16 00794 g008b
Figure 9. The share of hybrid and electric mode use in the three driving phases: (a) constant speed; (b) acceleration; (c) braking.
Energies 16 00794 g009
Figure 10. Correlations of specific energy: charging, discharging and regeneration to vehicle mass.
Energies 16 00794 g010
Figure 11. Interval analysis of speed under hybrid and electric driving conditions of the tested vehicles.
Energies 16 00794 g011
Figure 12. Analysis of the electric mode share of vehicle motion according to interval values of speed: (a) for each vehicle; (b) average values for all tested vehicles.
Energies 16 00794 g012
Figure 13. Shares of electric driving in urban conditions for individual vehicles.
Energies 16 00794 g013
Figure 14. Average (for the model) values of electric drive share in urban conditions, including average battery SOC value.
Energies 16 00794 g014
Table 1. Technical data of tested hybrid vehicles [35,36,37,38].
Vehicle
Type
Production Year
[-]
ICE
Power
[kW]
EM
Power
[kW]
HV Battery
Voltage
[V]
Battery
Type
[-]
Battery
Capacity
[Ah]
Energy
of Battery [kWh]
Vehicle Mass
[kg]
Hybrid
Power
[kW]
Prius_I19995333273.6Ni-MH6.51.78125071.0
Prius_III20175350201.6Ni-MH6.51.31137071.0
Prius Plug-in20177360201.6Li-Ion21.54.331425100.0
Auris20177360201.6Ni-MH6.51.311400100.0
C-HR20197253201.6Ni-MH6.51.31145090.0
RAV4201611450244.8Ni-MH6.51.591750147.0
Yaris20125445144.0Ni-MH6.50.94109573.6
Prius+20167360201.6Li-Ion5.01.011520100.0
NX300h201511450244.8Ni-MH6.51.591690147.0
Table 2. Calculated indicators of the tested hybrid propulsion systems.
Vehicle
Type
Engine
Specific Power [W/kg]
Motor
Specific Power [W/kg]
Hybrid
Specific Power [W/kg]
Specific Energy [Wh/kg]
Prius_I42.426.456.81.4
Prius_III38.736.551.81.0
Prius Plug-in51.242.170.23.0
Auris52.142.971.41.0
C-HR49.736.662.10.9
RAV465.128.684.00.9
Yaris49.341.167.20.9
Prius+48.039.565.80.7
NX300h67.529.687.00.9
Disclaimer/Publisher’s Note: The statements, opinions and data contained in all publications are solely those of the individual author(s) and contributor(s) and not of MDPI and/or the editor(s). MDPI and/or the editor(s) disclaim responsibility for any injury to people or property resulting from any ideas, methods, instructions or products referred to in the content.