Abstract
An inexpensive bio-mass-derived hard carbon from tamarind pods was used as an anode, and nitrogen and nitrogen (N)/sulfur (S) co-doped graphene were used as a cathode for novel hybrid Na-ion supercapacitors. The structural and surface morphological analyses are investigated using a range of techniques. The 3D network of the heteroatom-doped graphene skeleton edges for N and NS-doping conformations were assigned as N-RGOs (N1s-5.09 at.%) and NS-RGOs (N1s-7.66 at.% and S1s-2.22 at.%) based on energy dispersive X-ray spectroscopy elemental mapping. The negative electrode (T-HC) hard carbon was pre-treated by pre-sodiation with a half-cell process by galvanostatic charge–discharge in a sodium-ion battery at 0.01–2.5 V vs. Na/Na+. The T-HC//NS-RGO, T-HC//N-RGO, and T-HC//RGO were used to construct the Na-ion supercapacitor device. In the CV experiments, the electrochemical galvanostatic charge–discharge was studied at 1.0–4.2 V. The specific capacitance was 352.18 F/g for the T.HC/NS-RGO device and 180.93 F/g for the T.HC/N-RGO device; both were symmetric devices. T.HC/NS-RGO device performance revealed excellent cycling stability, with T-HC//NS-RGO showing 89.26% capacitance retention over 5000 cycles. A carbon–carbon symmetric device, such as a Na-ion hybrid capacitor, can exhibit the characteristics of both batteries and supercapacitors for future electric vehicles.
1. Introduction
In modern science and technology, environmental concerns stimulate the development of non-harmful advanced energy storage devices and promote the development of renewable energy sources. In the era of advances in various fields, energy storage is essential in revolutionary fields of hybrid electric vehicles, portable electronics, and grid energy storage applications [1,2,3]. In emerging research, hybrid supercapacitors are often designed with a battery-type anode and a capacitor-type cathode, which bridge the huge gap between secondary batteries and supercapacitors without altering the energy and power densities with long lifetimes [4]. The new types of anodes and cathodes for battery-type hybrid capacitors used graphite as an anode and activated carbon (AC) as a cathode [5]. While energy storage in such situations relies on large amounts of charge carriers, the geographically limited supply of lithium and its low availability has greatly limited its use in practical applications [6]. Therefore, the development of lithium-ion (Li-ion), sodium (Na-ion), and potassium (K-ion) based hybrid capacitors is growing rapidly, with good redox potential and similar intercalation chemistry substitutes for lithium-ion storage [7,8,9,10].
The ineffectiveness of graphite in sodium storage has led to extensive research on non-graphitic carbon as a high-performance active material for anodes in sodium-ion batteries [11,12,13]. Finding a practical high-efficiency negative electrode capable of retaining large amounts of sodium is one of the major obstacles to the commercialization of sodium ion capacitors [14,15,16]. Biomass-derived hard carbons are capable materials for efficient Na+ ion uptake and intercalation as the anode in the sodium-ion capacitor (NIC) [17,18,19,20]. The main difference between soft and hard carbon is their graphitization nature. Hard carbons are derived from biomass waste materials into graphitizable carbons at heat-treatment temperatures of 500–1200 °C. Soft carbons can be graphitized by annealing graphene and carbon-based aerogels for Na-ion storage [21,22,23]. The elevated electrical conductivity, high-rate capability, fast reaction kinetics, and tunability of their interfacial distance make heteroatom-doped carbon (graphene, CNTs. etc) promising for high-power applications. Newly N-doped, S-doped, and N-S co-doped well-ordered mesoporous graphene have attracted considerable research attention as ideal cathode materials in NICs because of their easily controlled nanostructures. Their exceptional electrochemical properties make them suitable for solid-state asymmetric supercapacitors and hybrid capacitors [24,25,26,27,28,29].
On the other hand, hard carbons are considered negative electrodes because of their disordered hard carbon regions. The carbon-based hybrid capacitor performance revealed a high-power density (PD), high capacity rate preference, and long cycling life, making them suitable for negative electrodes [30,31,32,33]. In addition, the symmetric Na-ion hybrid capacitors device was more efficient, inexpensive, and environmentally friendly. Biomass-derived hard carbons from renewable sources have attracted considerable attention from researchers as active anode materials, such as activated carbon and reduced graphene [34,35,36,37]. Researchers have been studying different types of electrolytes to enhance the operating potential window for storage devices for many years. In terms of the most stable and widely used nonaqueous electrolytes, ethylene carbonate (EC), diethyl carbonate (DEC), ethyl methyl carbonate (EMC), sodium hexafluorophosphate (NaPF6), lithium hexafluorophosphate (LiPF6) salt, Na+–F6-based mixed organic EC/DMC solvents, have attracted considerable attention in lithium ion and sodium ion battery and capacitor applications [38,39,40,41]. These battery-type electrolytes also enhance the wide active potential ranges (0.0–4.5 V versus carbonates-based organic electrolytes Li+/Na+) compared to nonaqueous electrolytes [41,42].
This paper reports the biomass-derived Tamarind pod hard carbon and N–S co-doped graphene used as a potential anode and cathode for novel symmetric NIC applications using the battery-type electrolyte. The as-fabricated NICs device delivered a maximum specific capacitance of 352.18 F/g at 0.1 A/g with a capacitance retention (CR %) of 89.27%@5000 charge–discharge cycles. Hence, NICs using the novel cathode and anode electrodes with a battery-type carbon–carbon symmetric device from carbonaceous materials have the potential for next-generation sodium-storage hybrid energy applications.
2. Experimental Section
2.1. Materials and Chemicals
Graphite fine powder 99.99% (Extra pure) (7–20 µm), sulfuric acid 98% (H2SO4), potassium permanganate 99.5% (KMnO4), sodium nitrate 99% (NaNO3), 30% purified hydrogen peroxide (H2O2) were purchased from Sigma–Aldrich. The doping precursors, urea (CH4N2O) and thiourea (CH4N2S), were purchased from Sigma–Aldrich and used as received. All the chemicals were of analytical reagent grade, and purified de-ionized (DI) water was used in all the experiments.
2.2. Preparations of Graphene Oxide (GO)
Chemically oxidized exfoliated graphene oxide (GO) was prepared using the modified Hummers method. Briefly, 3 g of graphite fine powder (14–20 µm) and 2 g of sodium nitrate (NaNO3) were added to 70 mL of concentrated sulfuric acid (H2SO4) with constant stirring for 30 min. The suspension was kept in an ice bath, and 3 g of KMnO4 was added gradually. The exothermic temperature of the suspension solution should not exceed 20 °C to prevent explosions and overheating. After adding the KMnO4 suspension very slowly, the mixture became a dark brownish solution. The reaction rate was controlled carefully by adding ice cubes slowly and constantly stirring at 50 °C for one hour. The solution mixture was stirred vigorously for two hours and diluted with 100 mL DI water. Subsequently, 10 mL of 30% H2O2 was added slowly to the dark black-greenish GO solutions to remove the residual permanganate (KMnO4). The resulting mixture solution appeared as a yellow-brown solution. It was diluted further with 400 mL of DI water to pH = 1. Lastly, 10% diluted HCl and DI water were added and centrifuged several times to achieve pH ~6–7. The graphene oxide (GO) was filtered and dried under a vacuum overnight at 60 °C to afford a dark brown colored fine powder.
2.3. N and NS-Codoped Reductions of Graphene Oxide (RGO, N-RGO, NS-RGO)
N-RGO and NS-RGO were obtained by thermal annealing in a quartz crucible in a tubular furnace: (i) pure graphene oxide (GO) to reduced graphene oxide nanosheets (pure-RGO), (ii) graphene oxide/urea (CH₄N₂O), (iii) graphene oxide/thiourea (CH4N2S). The composition-weight ratios of the raw materials were 2:1. A facile method was used for thermally reduced/atomic doping. The temperature was increased to 550 °C at 5 °C/min for 1 h with purging under Ar gas (flow rate = 120 mL/min). After completing the thermal reduction/exfoliation, the tubular furnace was allowed to cool naturally to room temperature. Finally, the collected powder was gently ground in a mortar to obtain the fine black-colored sample. The following final products were obtained: (i) reduced graphene oxide nanosheets, (ii) Nitrogen-doped graphene, and (iii) N–S-doped graphene, which are labeled as RGO, N-RGO, and N-RGO, respectively.
2.4. Preparations of Biomass-Derived Tamarind Hard Carbon (T-HC)
The typical preparations in two steps were chemical activation using KOH and subsequent thermal activation shown Figure 1. In the first step, agricultural bio-waste tamarind fruit pods were collected from an international South Asia mart (Daegu) in South Korea. The tamarind pod parts were washed with DI water and dried in the sunlight. The dried bio-waste resource tamarind pod bulk flakes were ground to a fine powder using a homemade kitchen blender. The fine tamarind powder was then treated with aqueous 6M KOH with constant stirring at 2 h. Subsequently, the mixture solutions were vacuum filtered and dried in an oven at 80 °C for 4 h. The dried fine power was placed in a ceramic boat into the center zone inside a horizontal tubular furnace. The thermal activation of biomass waste tamarind powder was achieved under Ar gas at 800 °C for one hour with rapid heating rates (5 °C min−1). The furnace was cooled to room temperature to obtain the final product. The sample was ground to a fine powder of activated hard carbon (T-HC).
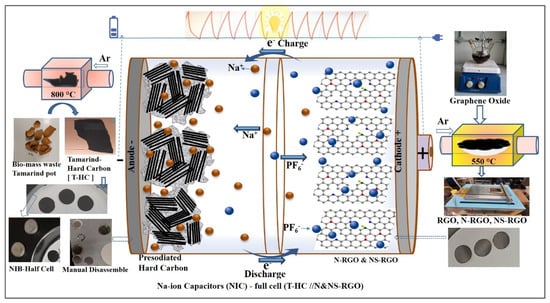
Figure 1.
Graphical abstract illustration for preparation process with photographs of pre-sodiated tamarind pod hard carbon anodic and N and NS-doped RGO cathode for fabrication of NIC devices.
2.5. Materials Characterization
The surface morphology was examined by field-emission scanning electron microscopy (FE-SEM S-4800 coupled with energy-dispersive X-ray spectroscopy (EDS), Tokyo, Japan) under an accelerating voltage of 15 kV. The nanoscale high-resolution images were observed by field-emission transmission electron microscopy (HR-TEM, model: FEI-TECNAI, TF-20) with an operating accelerating voltage of 200 kV and EDS mapping. The crystal structure was analyzed by X-ray diffraction (XRD, X’PertPRO PAN-Analytical) operating at 40 kV and 30 mA with Cu-Kα radiation (λ = 1.5406 Å). The pure and dopes samples were examined by micro-laser Raman spectroscopy (XPLORA Plus, HORIBA Scientific, Horiba Jobin Yvon, France) at room temperature excited with a YAG (Nd) laser at 532 nm and an operating power at 10 mW. The functional groups were identified through Fourier-transform infrared spectroscopy (FTIR, Perkin Elmer, Model no. Spectrum-100, Thermo Scientific; Waltham, MA, USA) from 400 to 4000 cm−1. The atomic doping concentrations of the pure and hetero-atom-doped materials were examined by X-ray photoelectron spectroscopy (XPS, ESCALAB 250 XPS System, Thermo Fisher Scientific—Milton Park, Oxford, Innovation Centre 99 Park Drive Milton Park, UK) using monochromatic Al Kα radiation.
2.6. Electrode Preparations and NICs Device Assembling and Formulations
The electrode active materials (RGO, N-RGO, and NS-RGO) were mixed with conductive carbon black and a polyvinylidene fluoride (PVDF) binder in N-methyl pyrrolidone (NMP) with a mass loading ratio of 80:10:10, respectively. The above mixture was ground into an agate mortar to form a uniform gel-like slurry. The above slurry was coated on an aluminum foil as a current collector with cathodic active materials, and then Al-foils were dried at 100 °C for 6 hrs. The same procedure was followed to prepare the anode material (T-HC). The as-prepared (T-HC) slurry was coated on the copper foil as the anode (shown in Figure 1). The coated electrodes were punched into circular type small discs with 12 mm diameter and used as the active working electrodes. The pre-sodiation process was assembled for NIB half-cell (CR-2032) coin cells to study a few cycles of sodiation and de-sodiation processes for T-HC on a hard carbon electrode material. Here, Na metal acts as the counter/reference electrode, and 1M NaPF6 dissolved in ethylene carbonate (EC), and diethyl carbonate (DMC) denoted the 1M NaPF6 (EC/DMC), (1:1 v/v) was the electrolyte. The galvanostatic charge–discharge test of the prepared cells was evaluated over the potential of 0.1–2.5 V for 10 cycles.
After the NIB pre-sodiation process, inside an Ar-filled glow box, a fresh coin-cell was assembled from the pre-sodiated electrode as the anode (T-HC) and RGO, N-RGO, or NS-RGO as the cathode. A sodium-ion capacitors (NICs) device was also achieved using the CR-2032 coin-cells model, using an electrochemical window of 1–4.2 V with a 1M NaPF6 (EC/DMC) (1:1 v/v) electrolyte. The active mass loading of the anode and cathode corresponded to a 1:2 ratio. Cyclic voltammetry (CV), electrochemical impedance spectroscopy (EIS), and galvanostatic charge–discharge (GCD) were conducted for electrochemical analysis of full-cell NIC devices. The specific capacitance (Csp, F/g) of the NICs based on the galvanostatic discharge (GCD) curves were calculated using the following Equation (1):
where I (A) is the discharge current; ∆t (s) is the discharge time; ∆V (Vmax and Vmin) is the total discharge potentials window; “m” (g) is the total mass of both active material in the anode and cathode, respectively. The specific equations are expressed as Equations (2) and (3), corresponding to the specific energy density (ED) and power density (PD), respectively. The ED and PD were calculated using GCD measurement parameters for NIC devices:
where (Csp, F/g) is the obtained specific capacitance; ΔV is the total window potential difference (V); Δt is the discharge time (s) from the GCD curves.
3. Results and Discussion
3.1. FE-SEM, Surface Morphological Analysis
Figure 2a–p shows the morphology of the twisted, crumbly, and uniform distribution of the ultrathin layered structure of the as-prepared RGO, N-RGO, and NS-RGO samples. Figure 2a–l presents FE-SEM images of the surface morphologies and microstructures at different magnifications. The as-prepared un-doped RGO exhibited a sheet-like surface morphology (Figure 2a,b). The rGO sheets formed uniform 3D-type folded/scrolled graphene platelet particles with a few staked layers (Figure 2c,d). After annealing, the nitrogen-doped RGO (N-RGO) exhibited a highly wrinkled nanosheet-3D interconnected-like surface morphology, as shown in Figure 2e–h. The presence of the highly folded and wrinkled sheet-like surface images of N-RGO was attributed to thermal annealing and “N” doping into RGO. On the other hand, the N/S co-doped RGO has a form of rough pallet sheets with agglomerated particles, as shown in Figure 2i,j. The higher magnified FE-SEM images showed that the thin sheets consist of a few layers Figure 2k,l. Finally, the surface morphologies of bio-mass-derived hard carbon (T-HC) material were investigated. The uneven particles showed more agglomerations (Figure 2m–p), and the surface morphology was comprised of aggregations after the higher temperature reductions of the Tamarind pod waste. All the FE-SEM samples exhibited similar curved sheet-like structures. The effective combination of N and S hetero-atom-codoped RGO improved the electron/ion transport pathway and increased the electrochemical performance of the NS-RGO electrode.
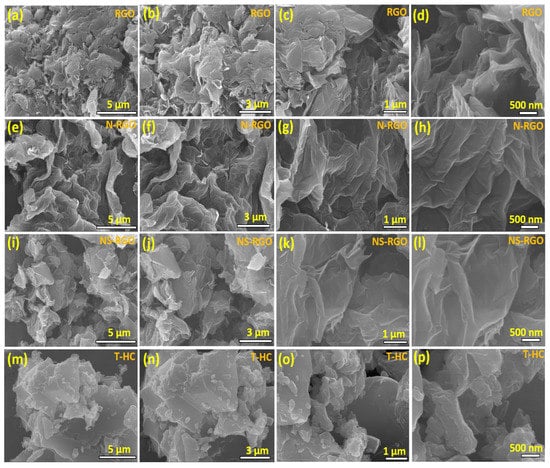
Figure 2.
FE-SEM surface images of the as-prepared different magnification microstructural surface morphologies of (a–d) RGO, (e–h) N-RGO, (i–l) NS-RGO, and (m–p) T-HC.
3.2. FE-SEM, EDS-Mapping Analysis
N-RGO and NS-RGO (Figure 3a–d) showed well-ordered reduced surface morphologies with the successful reduction of GO (RGO) accompanied by reduced graphene nanosheets (Figure 3a–d). EDS elemental mapping of heteroatoms doped in N-RGO and NS-RGO key materials was performed. The surface morphology of N-RGO was highly crumbled, interconnecting each graphene layer, as shown in Figure 3a. C, N, and O atoms were dispersed heterogeneously (Figure 3b–d). The EDS-elemental mapping of N-RGO showed that the major content was carbon atoms “C” (green mapping dots) with less oxygen “O” (red mapping dots) and the presence of nitrogen atom “N” (yellow mapping dots). The N-RGO showed atomic doping percentage levels at C—88.18 at.%, N—2.32 at.%, and O—12.50 at.%.
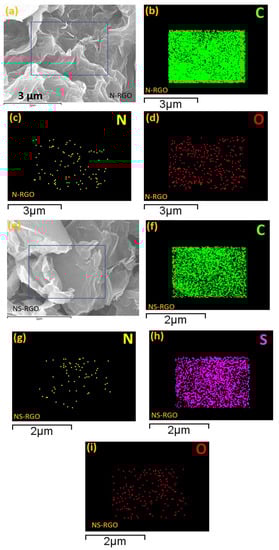
Figure 3.
(a,e) FE-SEM surface morphologies with EDS elemental maps (b–d) C, N, O maps (N-RGO), and (f–i) C, N, S, and O maps of (NS-RGO).
FE-SEM surface images clearly show the NS co-doping RGO elemental mapping, corresponding to the major sample NS co-doping RGO, as the elements indicated with the square, namely C, N, S, and O, appear as a mixture of four different colors of EDS mapping dots in Figure 3f–i. The incorporation of heteroatoms of nitrogen and sulfur duel doping in host GO is evident from the EDS results (Figure 3g,h). Figure 3f–i. EDX elemental mapping of the NS-RGO sample indicated carbon (green), nitrogen (yellow), sulfur (violet), and oxygen (red) as distinct components. N atoms were distributed irregularly with “S” atoms dispersed homogeneously. In the NS-RGO, there were specific distribution areas of elemental atomic percentages (at.%): C—89.01 at.%, N—1.42 at.%, S—4.46 at.%, O—5.11 at.%. In addition to the atomic fraction ratio in Table S1 (supplementary information (SI)) for comparative samples RGO, N-RGO, and NS-RGO. In conclusion, thermal annealing results in the thermal reductions/doping of GO doping of RGO. Heteroatom N and NS doping of N-RGO and NS-RGO nanosheets was confirmed.
3.3. FE-TEM Surface Nanostructures Analysis
The NS-RGO and T-HC samples were examined by HR-TEM for further characterization of the surface morphology and structure. N-RGO showed a crumpled structure, interconnected, with less agglomeration of crosslinked graphene nanosheets (Figure 4a–c). Further magnified views (Figure 4d,e) revealed aero-marks divided by the atomic lattice fringes to construct a two-dimensional framework.
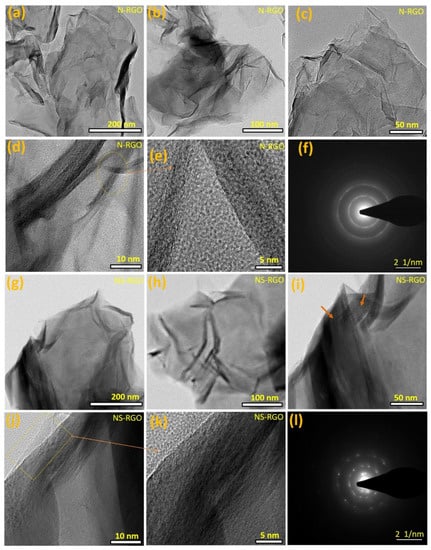
Figure 4.
(a–l) FE-TEM surface morphological images of the as-prepared (a–f) N-RGO nanosheets, (g–l) NS-RGO nanosheets.
The N/S co-doped RGO samples exhibited a very tiny lamellar structure with separate folded edges and curved shape layers profiles (Figure 4g–i). In Figure 4j,k, the square box with aero marks represents the bilayer distribution in clear fringes. Overall, the N-RGO and NS-RGO materials have highly wrinkled surfaces because of the annealing effects. The as-prepared N-RGO and NS-RGO showed highly intense ordered ring patterns confirming the crystalline nature of the nanosheets (Figure 4f,l). The selected area electron diffraction (SAED) pattern of N-RGO (Figure 4e), and NS-RGO (Figure 4l) revealed distinct lattice fringes. FE-TEM images also confirmed that very thin N-RGO and NS-RGO nanosheets with surface morphologies similar to their single-step annealing technique for reduction with heteroatoms doped in graphene nanosheets had similar surface morphologies.
Figure 5a–d shows the high and low magnifications of FE-TEM surface images of hard carbon from biomass-derived Tamarind pod. Figure 5a–c shows the low-magnified view HR-TEM images of T-HC hard interconnected and agglomerated carbon particles. On the other hand, T-HC material revealed an assembly of sheet-like aggregation carbon particles tangled randomly together. The lower magnification image (Figure 5d) revealed aero marks indicating a pallet sheets-like nature at the edges of the thin graphitic layers.
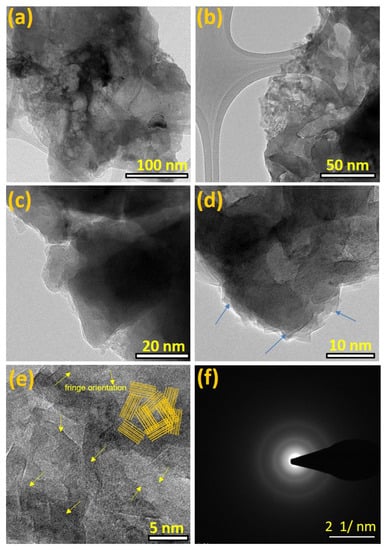
Figure 5.
HRTEM images of (a) Tamarind hard carbon, (T-HC) (a–e), and (f) SAED pattern for T-HC with ring profile.
The high-resolution FE-TEM surface images revealed different orientations in crystalline lattice fringes (Figure 5e). For confirmation, the inset yellow lines in the right corner indicate the corresponding hard carbon fringes with a multi-direction orientation of graphitic fringes [43,44]. The SAED pattern (Figure 5f) indicates that biomass Tamarind hard carbon exhibits a semi-crystalline structure. As a result, good thermal activations of T-HC carbon samples revealed inhomogeneous FE-TEM particle size images and their SAED patterns, confirming their crystalline structures.
3.4. XRD
XRD was used to examine the crystal structure and phase purity of the as-prepared RGO, N-RGO, NS-RGO, and T-HC materials. Figure 6a presents XRD patterns of RGO, N-RGO, and NS-RGO. The XRD pattern of the RGO revealed several peaks at 2θ—24.37°, 42.78°, and 77.96°; N-RGO displayed peaks at 2θ—24.01°, 43.13°, and 78.05°; NS-RGO revealed peaks at 2θ—25.59°, 42.70°, and 77.78°. These peaks were indexed to the (002), (100), and (110) planes of the hexagonal phase of graphitic carbon (JCPDS 00-008-0415). These XRD peaks confirm the reduction of GO (RGO), and that RGO, N-RGO, and NS-RGO had good crystallinity [45]. Figure 6b shows the XRD peak of the prepared-HC material. The red star marks (*) were assigned to carbon characteristic peak ranges at 2θ—23° to 26°. All the XRD peaks were very well positioned at 2θ—23.31°, 26°, 29.4°, 36.02°, 39.48°, 43.16°, 47.61°, 48.60°, 57.43°, 60.61°, and 64.70° for (201), (002), (104), (110), (113), (202), (024), (116), (122), (214), and (300) the hkl plane of the hexagonal phase of T-HC, respectively, (JCPDS PDF #00-005-0586). All carbon materials (RGO, N-RGO, NS-RGO, and T-HC) displayed good crystallinity and were thermally reduced RGO with doping N-RGO and NS-RGO.
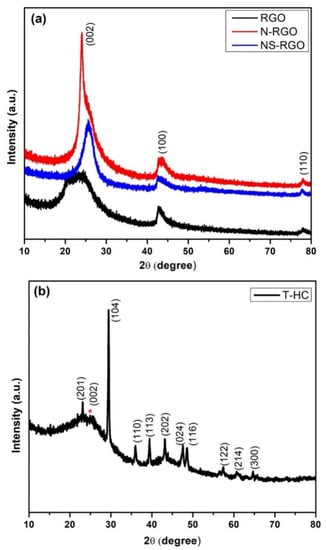
Figure 6.
(a) XRD patterns of as-prepared RGO, N-RGO, NS-RGO, and (b) XRD patterns of T-HC.
3.5. Micro-Laser Raman Analysis
Micro-laser Raman analysis is a sensitive tool for identifying the lattice phonon vibrations and the structural disorder (defects). Generally, the occurrence of edge-induced structural disorder in synthesized carbon samples is associated with two other features: the D band is located at approximately 1350 cm−1, and the G band is located at 1620 cm−1. This Figure 7a shows the well-oriented disorder bands of Raman spectra, as well as their corresponding disorder values and disorder ratios for RGO belonging to the G band (1608.61 cm−1), D band (1361.13 cm−1), with a disorder ratio (ID/IG) of 0.79, and N-RGO belonging to G band (1602.42 cm−1), D band (1361.13 cm−1), with a disorder ratio (ID/IG) of 1.40. The NS-RGO matches the G-Band (1585.93 cm−1), D-Band (1360.13 cm−1), and ID/IG disorder ratio was 1.45. Figure 7b, shown in T-HC matched the G-Band (1602.65 cm−1), D-Band (1335.93 cm−1), and the ID/IG disorder ratio was 0.89. There is low intensity of the disorder ratio replicates, with a small number of defects present in the sample NS-RGO [46].
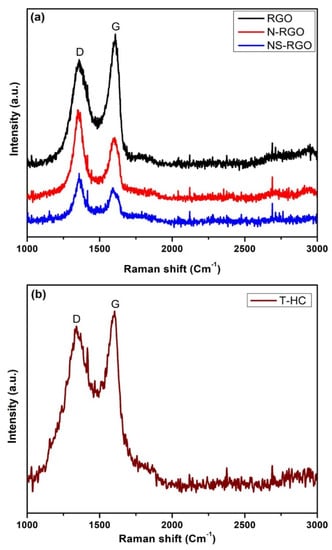
Figure 7.
(a) Raman spectrum of RGO, pyrolysis N-RGO and NS-RGO, and (b) T-HC pyrolysis activated carbon.
3.6. FT-IR Analysis
FTIR spectroscopy is a valuable technique for identifying the functional groups of synthesized materials in the recorded region between 4000 and 400 cm−1. Figure 8 presents the FTIR spectra of the RGO, N-RGO, NS-RGO, and T-HC. The FT-IR transmittance curves at 3449 cm−1 were attributed to the –OH symmetric and asymmetric stretching vibrations. The absorption band at 1648 cm−1, 1510 cm−1, and 1375 cm−1 is assigned due to (C=C), (C=N), and (C–S), respectively. The vibrational band at 1433 cm−1 for the C–H bending vibrations was attributed to the residual of nitrate ions [47].
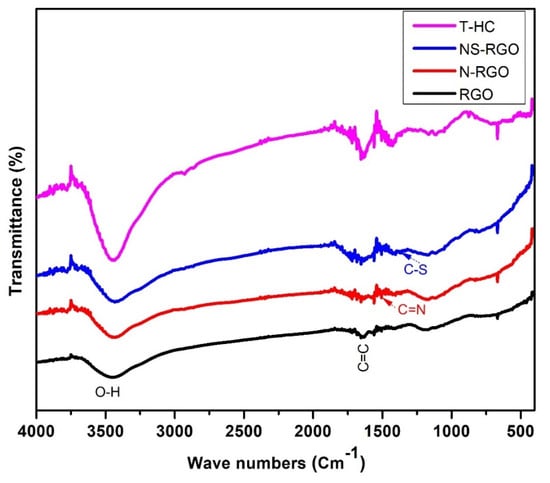
Figure 8.
FT-IR transmittance spectra of RGO, N-RGO, NS-RGO, and T-HC.
The key functional group of the C=C bond shows that RGO maintained the sp2 hybridized structure of layered C=C covalent bonds. In the spectrum of NS-RGO, the transmittance bands centered at 1510 cm−1 and 1375 cm−1 were assigned to the stretching vibration of the C–N and C–S groups, respectively. Overall, the transmittance peaks of the major functional groups revealed nitrogen/sulfur groups in RGO.
3.7. XPS Analysis
XPS was performed to determine the chemical composition and bonding form of the pure RGO and heteroatom-doped graphene nanosheets, such as N-RGO and NS-RGO; the overall survey spectrum is shown in Figure 9a. The C1s and N1s, and O1s peaks were de-convoluted. The pure RGO materials magnified view (Figure 9b) of the C1s revealed peaks at 284.75 eV (C=C), 285.74 eV (C-O), and 289.32 eV (HO-C=O). The peak positions of (N-RGO) C1s showed binding energies at 284.79 eV (C=C), 285.93 eV (C-N), and 288.96 eV (C=O) (Figure 9c). As a result, the C–N binding energies of the N-RGO sample share a key role in understanding carbon. Correspondingly, N-RGO material showed an N peak at N1s, 398–403 eV (Figure 9d) at different nitrogen (N) sites, with three different functions for nitrogen (N) sites: 398.93 eV for pyridinic nitrogen, 400.50 eV for pyridic nitrogen, and 401.95–403.87 eV for quaternary/graphitic nitrogen. The N-atoms in the N-RGO sample achieved the thermally doped N1s functionalities in the N-RGO sample. In addition to NS co-doping into RGO, Figure 9e shows C1 energy levels of 288.70 eV (O C=O) and 284.79 eV (C=C) Figure 9e. The NS-RGO (N1s) spectra showed the major binding energy levels at 398.70 eV (pyridinic-N), 400.17 eV (pyloric-N), and 403.50 eV (graphitic-N) and additional sulfur (S2p) peak binding energies at 164.20 eV (C-S), 165.43 eV (2p1/2), and 168.79 (sulfonic-S, oxidized sulfur) (Figure 9f,g). According to XPS binding energies, nitrogen-sulfur atoms are strongly incorporated into the graphene sheets through codoped graphene (C–N and C–S) bonds [48]. The N1s/S2p peaks confirmed that the dual heteroatoms doped reduced, suggesting that the N/S bonding form of the host carbon atom is the most important. Deconvolution of the binding energy of carbon peaks C1s (Figure 9h) of T-HC (C1s) revealed very tiny peaks for potassium (K2p) due to experimental preparations using KOH for chemical activation [49]: 284.76 eV (C=C), 286.15 eV, (C–O), 289.69 eV (K2p3/2), and 295.84 eV (K2p1/2) [50]. Figure 9i shows the overall comparative oxygen (O1s) containing binding energies ranges at 530.60–535.64 eV. These peaks were caused mainly by the physisorption/chemisorption of oxygen on doped graphene by the carboxyl COOH groups during the annealing of N-RGO, NS-RGO, and T-HC materials. In response to the strong evidence of hetero atoms (N, S, and O) atomic doping present in the as-synthesized samples, peak positions associated with C1s and O1s were assigned to be N-RGO (N1s-5.09 at.%) and NS-RGO (N1s-7.66 at.%, S1s-2.22 at.%). Table 1, Table 2 and Table 3 show the XPS atomic percentage of RGO, N-RGO, and NS-RGO, respectively. This facile annealing method practically prepares bulk production of pure and doping materials.
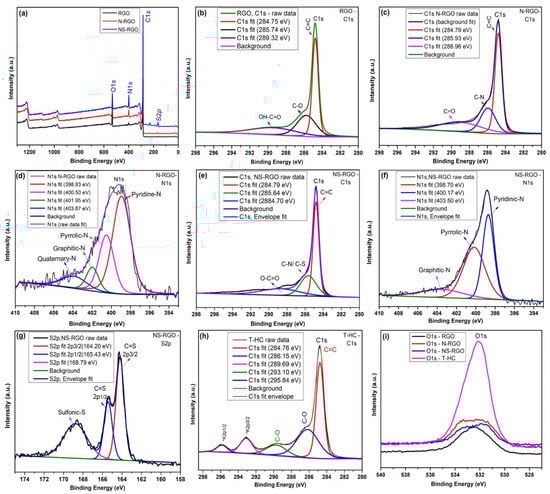
Figure 9.
(a) XPS survey scan spectrum of RGO, N-RGO, and NS-RGO; Deconvoluted XPS spectra of (b) RGO-C 1s, (c) N-RGO-C 1s, (d) N-RGO-N 1s, (e) NS-RGO-C 1s, (f) NS-RGO-N 1s, (g) NS-RGO-S2p, and (h)T-HC-C1s; (i) Overall comparative spectra of O 1s.

Table 1.
RGO atomic doping element composition levels.
Table 2.
N-RGO atomic doping element composition levels.
Table 3.
NS-RGO atomic doping element composition levels.
4. Electrochemical Analysis of Symmetric NIC Devices
4.1. Na-Ion Battery Pre-Sodiation Techniques
Figure 10a shows the GCD profiles for the pre-sodiation performance of a NIB half-cell with seven galvanostatic charge–discharge (GCD) cycles over the potential range of 0.01–2.5 V(Na/Na+) at a current density of 0.1 mA. After the half-cell battery pre-sodiations, the Na+ ions are intercalated into hard carbon T-HC, and the initial charge–discharge specific capacities of T-HC were estimated to be ~315–275 mAh/g. The capacitive properties of the biomass-derived Tamarind hard carbon showed good reversible curves resulting from the intercalation of Na/Na+ [51]. Figure 10b shows the CV curves of the T-HC anode with a scanning voltage range of (0.01–2.5 V), and NS-RGO cathode with a voltage range of (2.0–4.2 V) at a scan rate of 0.2 mV/s. The hard carbon anode T-HC shows three oxidation and reductions CV cycles (T-HC vs. Na+), where the first cycle conducted CV@0.2 mV/s with a wide range of redox Na/Na+, whereas the second and third cycles showed gradual reductions of potential ranges up to 0.01–2.0 V, where the Na+ ion redox part of the low potential is 0.01 and 0.276 V. The cathode (Na+ versus NS-RGO) electrodes are cycled in the voltage range of 2.0–4.3 V with a scan rate of 0.2 mV/s. The irreversible reduction peak of the first cycle is responsible for solid electrolyte interface (SEI) film formation at approximately 1.2 V. The disappearance of the irreversible peak in the second and third cycles shows that SEI film formation occurred only in the first cycle. EIS was used to explore the kinetic behaviors of half-cells using T-HC as the anode material (Figure 10c). The Nyquist plot showed that the small diameter of the semicircle of T-HC has small interfacial charge transfer resistance (Rct) of 616.5 Ω in the high-frequency region, which improves the conductivity and increases the specific capacity of the pre-sodiated T-HC anode material. Therefore, T-HC was selected as a suitable anode material for the successive construction of the NIC device. Figure 10c also presents the corresponding Randal’s equivalent circuit.
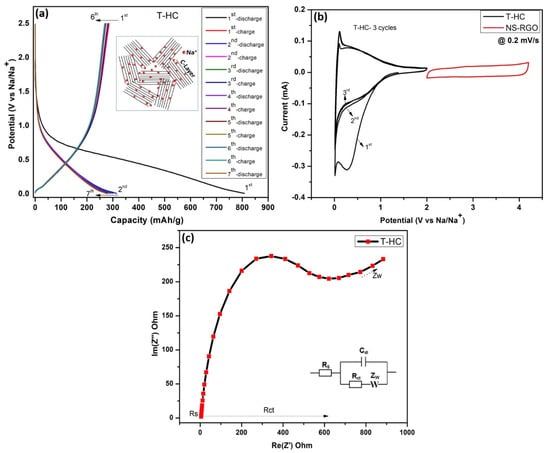
Figure 10.
(a) NIB half-cell pre-sodiation performance, seven galvanostatic charge–discharge (GCD) cycles at 0.1 mA with potential range (0.01–2.5 V), (b) CV response of anode as T-HC (0.01–2 V) and cathode as NS-RGO (2–4.2 V) at a matching scan rate of 0.2 mV/s; (c) EIS curves of T.HC active materials.
4.2. Electrochemical Performance of Symmetric Na-Ion Capacitor
Considering the outstanding energy storage capacity of both cathode (RGO, N-RGO, and NS-RGO) and anode (T.HC) material, a full cell (T.HC//RGO, T.HC//N-RGO, T.HC//NS-RGO) symmetric sodium ion capacitor device was constructed to study their electrochemical performance. Figure 11a–c displays the symmetric Na-ion capacitor (NIC) device with the wide potential range of 1.0–4.2 V versus Na/Na+ for T.HC//RGO, T.HC//N-RGO, and T.HC//NS-RGO, respectively. All CV curves maintained a rectangular shape with increasing scan rates, signifying rapid diffusion of ions across all the electrodes.
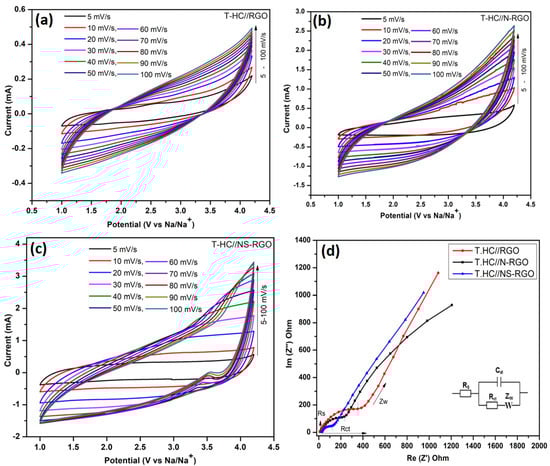
Figure 11.
(a–c) Electrochemical tests of the full-cell for T.HC//RGO, T.HC//N-RGO, and T.HC//NS-RGO symmetric NIC device. CV curves were carried out at different scan rates at 5–100 mV/s with 1M NaPF6-EC-DMC with wide active potential ranges 1.0–4.2 V, (d) EIS for all NIC devices at 10 mHz–100 KHz.
The Figure 11a–c CV curves showed a better symmetrical shape at each scan rate, which reveals the highly reversible process of the NIC device. The carbon-based NIC symmetric device achieved the active potential range of 1.0–4.2 V when the electrolytic Na+ and PF6− ions were driven in opposite directions [52]. The CV cycles were carried out at various scan rates ranging from 5 to 100 mV/s for the symmetric T.HC//RGO, T.HC//N-RGO, and T.HC//NS-RGO NIC devices. Compared to the CV curves of T.HC//RGO and T.HC//N-RGO, the T.HC//NS-RGO showed all CV curves of EDLC contributions with a tiny hump for reductions peak due to sulfur-doped graphene and nitrogen doping into carbon planes. For comparatively all the NIC devices with capacitive and diffusion-controlled contributions [53], the “b” value was calculated from CV scans of NIC devices data with discussions from (supplementary information (SI), Figures S1 and S2).
EIS was also used to associate the charge transfer resistance and capacitive behavior of all T-HC//RGO, T-HC//N-RGO, and T-HC//NS-RGO NIC devices shown in Figure 11d. The Nyquist EIS plot was carried out on a potential amplitude 10 mV/s bias with impedance frequency ranges at 10 MHz–100 KHz. Figure 11d clearly shows EIS Nyquist plots of the equivalent circuit shown in the inset of a simple Randal’s circuit model. The areas were assigned to individual elements for expanding the high and low-frequency region, including the solution resistance (Rs), charge-transfer resistance (Rct), double-layer capacitance (Cdl), and high-frequency region, comprising the diffusion Warburg impedance (Zw). From Figure 11d, the calculated charge transfer resistances were T.HC//RGO—339.16 Ω, T.HC//N-RGO—202.36 Ω, and T.HC//NS-RGO—89.76 Ω. The EIS data analyzed based on charge transfer resistance (Rct) projected a low Rct value T.HC//NS-RGO (89.76 Ω) because the x-axis serious resistance part (Z′) represents the low semicircle. The lower charge transfer resistance (Rct) values suggest good transport behavior at the electrode/electrolyte interface after N/S atomic doping RGO (T-HC//N-RGO, NS-RGO devices). Furthermore, EIS revealed the pure T-HC//RGO device in the high-frequency region with Nyquist plot in the higher semicircle that the internal resistance of RGO may be due to its lower electrical conductivity and higher contact resistance with electrolyte interface resistance [54].
4.3. Symmetric GCD NIC Devices
Figure 12a–c presents the GCD profiles of (a) T.HC//RGO, (b) T.HC//N-RGO, and (c) T.HC//NS-RGO within a potential range of 0 to 4.2 V at various current densities ranging from 0.1 to 0.5 A/g. The symmetric nature of the GCD curves significantly improved the capacity with the increase in current density (Figure 12), which obviously displays the high-rate capacity of the electrode materials. The specific capacity was calculated using the Equation (1) with calculated values for the applied current densities of 0.1 A/g, 0.2 A/g, 0.3 A/g, 0.4 A/g, and 0.5 A/g were, respectively, T.HC//RGO—59.37 F/g, 35.93 F/g, 25.62 F/g, 14.68 F/g, and 4.37 F/g; T.HC//N-RGO—180.93 F/g, 102.18 F/g, 48.43 F/g, 19.68 F/g, and 6.25 F/g; T.HC//NS-RGO—352.18 F/g, 248.12 F/g, 145.31 F/g, 90.62 F/g, and 57.18 F/g. The highest specific capacitance was obtained at 352.18 F/g for the T.HC//NS-RGO symmetric device at the current densities of 0.1 A/g.
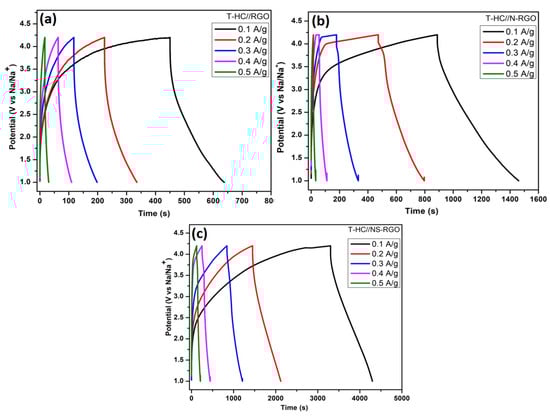
Figure 12.
(a) GCD curves of T.HC//RGO, (b) T.HC//N-RGO, (c) T.HC//NS-RGO with wide active potential window ranges (1.0–4.2 V vs. Na/Na+) of symmetric Na-ion capacitor at different current densities 0.1–0.5 A/g.
The enhanced performance of T.HC//NS-RGO (NIC) devices was attributed to the reasonable specific capacitance, increased Na+ ion storage, and superior characteristics of hetero-atom-doped single/dual RGO Figure 12a–c. Moreover, the charge storage via “adsorption-intercalation” in the hard carbon-based symmetric Na-ion capacitor device performance enabled a wide range of charge–discharge times and good capacitive properties. Na-ion-based battery-type electrolyte containing (NaPF6) salt was the best-performing electrolyte with suitable ionic conductivity for Na+ electrochemical intercalation through Tamarind hard carbon (T-HC) anode [55]. This is highly beneficial for battery-type NIC symmetric device system cost and improving the gravimetric capacity.
4.4. Cycling Performance
The number of charging and discharging cycles (cycling stability) is an important factor for determining the capacitance retention and coulombic efficiency of the electrode materials. Figure 13 shows the capacitance retention (CR-%) and coulombic efficiency (CE-%) of T.HC//RGO, T.HC//N-RGO, and T.HC//NS-RGO at a current density of 0.2 A/g for continuous 5000 charge–discharge cycles. The capacity retention of NS-RGO was 89.26% after 5000 cycles. N-RGO delivered 82.39% at 5000 cycles, and RGO delivered 53.92% at 5000 cycles. Hence, the NS-RGO is a potential cathode electrode material that retains good stability and provides higher specific capacity than N-RGO and RGO. Furthermore, the columbic efficiency CE- ~99% of all corresponding devices was confirmed.
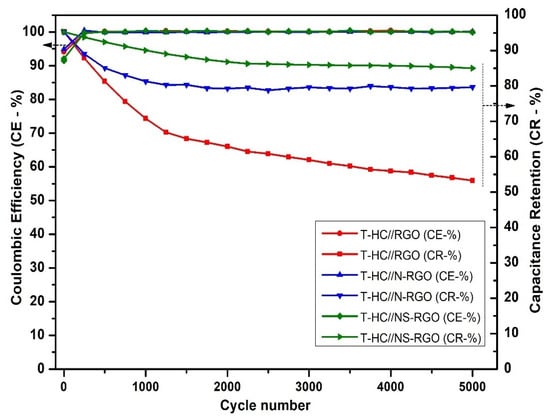
Figure 13.
Comparison of the cycling performance of T.HC//RGO, T.HC//N-RGO, and T.HC//NS-RGO. GCD at 0.2 A/g for 5000 cycles.
5. Conclusions
A high-performance symmetrical sodium-ions supercapacitor device was produced using a pre-sodiated anode made from hard carbon produced from bio-mass derived Tamarind pods and hetero atom-doped RGO, N-RGO, and NS-RGO used as a cathode by thermal treatment. The as-prepared materials were confirmed by XRD, Raman spectroscopy, FTIR spectroscopy, and XPS. The materials were examined further to investigate the various functional groups present in the nanocomposites. The surface morphology of atomically doped graphene nanosheets was investigated by FE-SEM and elemental mapping. FE-TEM confirmed a few layers of highly crumbled graphene nanosheets. The Tamarind hard carbon for the NIB pre-sodiated had a capacity of 315–275 mAh/g. The symmetric devices T-HC//NS-RGO, T-HC//N-RGO, and T-HC//RGO devices for NICs were assessed at 1.0–4.2 V vs. Na/Na+. The T.HC//NS-RGO symmetric device showed the highest specific capacitance of 352.18 F/g compared to T.HC//N-RGO (180.93 F/g) and T.HC//RGO (59.37 F/g) devices at the current densities of 0.1 A/g. Furthermore, the charge–discharge cycling stability of the T.HC//NS-RGO active device was examined over 5000 at a current density of 0.2 A/g. The respective devices delivered a discharge capacitance retention (CR %) of 89.26% for T/HC//NS-RGO, compared to 82.39% for T-HC//N-RGO at 5000 cycles. Overall, thermal annealing activations of bio-derived carbon and carbon heteroatoms doped graphene-based symmetric sodium-ion capacitor (NIC) is a promising candidate for future energy storage applications.
Supplementary Materials
The following supporting information can be downloaded at: https://www.mdpi.com/article/10.3390/en16020802/s1, Figure S1: The b-values calculated for the three materials, RGO, N-RGO, and NS-RGO; Figure S2: Deconvoluted capacitive contributions at 5 mVs-1 in the active materials, RGO, N-RGO, and NS-RGO; Table S1: Atomic fractions ratio for RGO, N-RGO, NS-RGO samples.
Author Contributions
V.T.: Roles/Writing—original draft; Writing—review and editing; T.V.M.S.: Data curation; Formal analysis, K.Y.: Resources, Supervision; Validation; J.K.: Supervision, Funding acquisition, Project administration. All authors have read and agreed to the published version of the manuscript.
Funding
This research was supported by the “National Research Foundation of Korea (NRF) grant funded by the Korean Government (MSIT) (No:2022R1A2C1005357)”.
Data Availability Statement
Data is unavailable due to privacy or ethical restrictions.
Conflicts of Interest
The authors declare no conflict of interest.
References
- Conway, B.E. Transition from “Supercapacitor” to “Battery” Behavior in Electrochemical Energy Storage. J. Electrochem. Soc. 1991, 138, 1539–1548. [Google Scholar] [CrossRef]
- Volfkovich, Y.M.; Serdyuk, T.M. Electrochemical Capacitors. Russ. J. Electrochem. 2002, 38, 935–959. [Google Scholar] [CrossRef]
- Conway, B.E. Electrochemical Supercapacitors: Scientific Fundamentals and Technological Applications; Plenum: New York, NY, USA, 1999. [Google Scholar]
- Naoi, K.; Ishimoto, S.; Miyamoto, J.; Naoi, W. Second generation ‘nanohybrid supercapacitor’: Evolution of capacitive energy storage devices. Energy Environ. Sci. 2012, 5, 9363–9373. [Google Scholar] [CrossRef]
- Miao, L.; Song, Z.; Zhu, D.; Li, L.; Gan, L.; Liu, M. Recent advances in carbon-based supercapacitors. Mater. Adv. 2020, 1, 945–966. [Google Scholar] [CrossRef]
- Nitta, N.; Wu, F.; Lee, J.T.; Yushin, G. Li-ion battery materials: Present and future. Mater. Today 2015, 18, 252–264. [Google Scholar] [CrossRef]
- Shreenivasa, L.; Yogeeshwari, R.; Viswanatha, R.; Sriram, G.; Kalegowda, Y.; Kurkuri, M.D.; Ashoka, S. Scalable chemical approach to prepare crystalline Mn2V2O7 nanoparticles: Introducing a new long-term cycling cathode material for lithium-ion battery. J. Mater. Sci. Mater. Electron. 2020, 31, 19638–19646. [Google Scholar] [CrossRef]
- Chojnacka, A.; Beguin, F. Recent progress in the realization of metal-ion capacitors with alloying anodic hosts: A mini review. Electrochem. Commun. 2022, 139, 107305. [Google Scholar] [CrossRef]
- Shreenivasa, L.; Yogeeshwari, R.; Viswanatha, R.; Sriram, G.; Kalegowda, Y.; Kurkuri, M.D.; Ashoka, S. An introduction of new nanostructured Zn0.29V2O5 cathode material for lithium ion battery: A detailed studies on synthesis, characterization and lithium uptake. Mater. Res. Express 2019, 6, 115035. [Google Scholar] [CrossRef]
- Sajjad, M.; Javed, M.S.; Imranc, M.; Mao, Z. CuCo2O4 nanoparticles wrapped in a rGO aerogel composite as an anode for a fast and stable Li-ion capacitor with ultra-high specific energy. New J. Chem. 2021, 45, 20751–20764. [Google Scholar] [CrossRef]
- Balogun, M.-S.; Luo, Y.; Qiu, W.; Liu, P.; Tong, Y. A review of carbon materials and their composites with alloy metals for sodium ion battery anodes. Carbon 2016, 98, 162–178. [Google Scholar] [CrossRef]
- Zhang, Q.; Liu, X.; Yan, L.; Ren, Q.; Yang, Z.; Liu, S.; Shi, Z. Designing and preparing a 3D “overpass” hierarchical porous carbon membranes free-standing anode for sodium ion battery. Chem. Eng. J. 2022, 448, 137628. [Google Scholar] [CrossRef]
- Wen, Y.; He, K.; Zhu, Y.; Han, F.; Xu, Y.; Matsuda, I.; Ishii, Y.; Cumings, J.; Wang, C. Expanded graphite as superior anode for sodium-ion batteries. Nat. Commun. 2014, 5, 4033. [Google Scholar] [CrossRef]
- Li, X.; Liu, Z.; Li, J.; Lei, H.; Zhuo, W.; Qin, W.; Cai, X.; Hui, K.N.; Pan, L.; Mai, W. Insights on the mechanism of Na-ion storage in expanded graphite anode. J. Energy Chem. 2021, 53, 56–62. [Google Scholar] [CrossRef]
- Ramachandran, K.; Subburam, G.; Liu, X.; Huang, M.G.; Xu, C.; Ng, D.H.L.; Cui, Y.X.; Li, G.C.; Qiu, J.X.; Wang, C.; et al. Nitrogen-doped porous carbon nanofoams with enhanced electrochemical kinetics for superior sodium-ion capacitor. Rare Met. 2022, 41, 2481–2490. [Google Scholar] [CrossRef]
- Yan, R.; Leus, K.; Hofmann, J.; Antonietti, M.; Oschatz, M. Porous nitrogen doped carbon/carbon nanocomposite electrodes enable sodium ion capacitors with high capacity and rate capability. Nano Energy 2020, 67, 104240. [Google Scholar] [CrossRef]
- Liu, M.; Wu, F.; Bai, Y.; Li, Y.; Ren, H.; Zhao, R.; Feng, X.; Song, T.; Wu, C. Boosting sodium storage performance of hard carbon anodes by pore architecture engineering. ACS Appl. Mater. Interfaces 2021, 13, 47671. [Google Scholar] [CrossRef] [PubMed]
- Balasankar, A.; Arthiya, S.E.; Ramasundaram, S.; Sumathi, P.; Arokiyaraj, S.; Oh, T.; Aruchamy, K.; Sriram, G.; Kurkuri, M.D. Recent Advances in the Preparation and Performance of Porous Titanium-Based Anode Materials for Sodium-Ion Batteries. Energies 2022, 15, 9495. [Google Scholar] [CrossRef]
- Yu, K.; Wang, X.; Yang, H.; Bai, Y.; Wu, C. Insight to defects regulation on sugarcane waste-derived hard carbon anode for sodium-ion batteries. J. Energy Chem. 2021, 55, 499. [Google Scholar] [CrossRef]
- Bhat, V.S.; Kanagavalli, P.; Sriram, G.; Prabhu, R.; John, N.S.; Veerapandian, M.; Kurkuri, M.; Hegde, G. Low cost, catalyst free, high performance supercapacitors based on porous nano carbon derived from agriculture waste. J. Energy Storage 2020, 32, 101829. [Google Scholar] [CrossRef]
- Yu, P.; Tang, W.; Wu, F.; Zhang, C.; Luo, H.; Liu, H.; Wang, Z. Recent progress in plant-derived hard carbon anode materials for sodium-ion batteries: A review. Rare Met. 2020, 39, 1019–1033. [Google Scholar] [CrossRef]
- Cui, C.; Wang, H.; Wang, M.; Ou, X.; Wei, Z.; Ma, J.; Tang, Y. Hollow carbon nanobelts codoped with nitrogen and sulfur via a self-templated method for a high-performance sodium-ion capacitor. Small 2019, 15, 1902659. [Google Scholar] [CrossRef]
- Niu, J.; Guan, J.; Dou, M.; Zhang, Z.; Kong, J.; Wang, F. Sustainable synthesis of biomass-derived carbon electrodes with hybrid energy-storage behaviors for use in high-performance Na-ion capacitors. ACS Appl. Energy Mater. 2020, 3, 2478–2489. [Google Scholar] [CrossRef]
- Ding, J.; Li, Z.; Cui, K.; Boyer, S.; Karpuzovd, D.; Mitlin, D. Heteroatom enhanced sodium ion capacity and rate capability in a hydrogel derived carbon give record performance in a hybrid ion capacitor. Nano Energy 2016, 23, 129–137. [Google Scholar] [CrossRef]
- Thirumal, V.; Pandurangan, A.; Jayavel, R.; Ilangovan, R. Synthesis and characterization of boron doped graphene nanosheets for supercapacitor applications. Synth. Met. 2016, 220, 524–532. [Google Scholar] [CrossRef]
- Sajjad, M.; Shah, M.; Sufyan Javed, M.; Shah, M.S.; Shahe, A.; Lu, W.; Mao, Z. A novel high-performance all-solid-state asymmetric supercapacitor based on CuSe nanoflakes wrapped on vertically aligned TiO2 nanoplates nanocomposite synthesized via a wet-chemical method. J. Energy Storage Part A 2022, 55, 105304. [Google Scholar] [CrossRef]
- Yu, Q.; Dong, T.; Qiu, R.; Wang, H. Sulfur and nitrogen dual-doped carbon nanofiber with enlarged interlayer distance as a superior anode material for sodium-ion capacitors. Mater. Res. Bull. 2021, 138, 111211. [Google Scholar] [CrossRef]
- Ni, D.; Sun, W.; Wang, Z.; Bai, Y.; Lei, H.; Lai, X.; Sun, K. Heteroatom-doped mesoporous hollow carbon spheres for fast sodium storage with an ultralong cycle life. Adv. Energy Mater. 2019, 9, 1900036. [Google Scholar] [CrossRef]
- Zhao, C.; Wang, Q.; Lu, Y.; Li, B.; Chen, L.; Hu, Y. High-temperature treatment induced carbon anode with ultrahigh Na storage capacity at low-voltage plateau. Sci. Bull. 2018, 63, 1125. [Google Scholar] [CrossRef]
- Ghosh, S.; Santhosh, R.; Jeniffer, S.; Raghavan, V.; Jacob, G.; Nanaji, K.; Kollu, P.; Jeong, S.; Grace, A.N. Natural biomass derived hard carbon and activated carbons as electrochemical supercapacitor electrodes. Sci. Rep. 2019, 9, 16315. [Google Scholar] [CrossRef]
- Chen, X.Y.; Chen, C.; Zhang, Z.J.; Xie, D.H. High performance porous carbon through hard-soft dual templates for supercapacitor electrodes. J. Mat. Chem. A 2013, 1, 7379–7383. [Google Scholar] [CrossRef]
- Yang, B.; Chen, J.; Lei, S.; Guo, R.; Li, H.; Shi, S.; Yan, X. Spontaneous Growth of 3D Framework Carbon from Sodium Citrate for High Energy and Power-Density and Long-Life Sodium-Ion Hybrid Capacitors. Adv. Energy Mater. 2018, 8, 1702409. [Google Scholar] [CrossRef]
- Sajjad, M.; Shah, M.Z.U.; Mahmood, F.; Javed, M.S.; Maryam, R.; Ahmad, F.; Shah, A.; Hussain, R.; Toufiq, A.M.; Mao, Z.; et al. CdO nanocubes decorated on rGO sheets as novel high conductivity positive electrode material for hybrid supercapacitor. J. Alloy Compd. 2023, 93, 168462. [Google Scholar] [CrossRef]
- Liu, G.; Yang, Y.; Lu, X.; Qi, F.; Liang, Y.; Trukhanov, A.; Wu, Y.; Sun, Z.; Lu, X. Fully Active Bimetallic Phosphide Zn0.5Ge0.5P: A Novel High Performance Anode for Na-Ion Batteries Coupled with Diglyme Based Electrolyte. ACS Appl. Mater. Interfaces 2022, 14, 31803–31813. [Google Scholar] [CrossRef] [PubMed]
- Xu, D.; Chao, D.; Wang, H.; Gong, Y.; Wang, R.; He, B.; Hu, X.; Fan, H. Flexible Quasi-Solid-State Sodium-Ion Capacitors Developed Using 2D Metal–Organic-Framework Array as Reactor. Adv. Energy Mater. 2018, 8, 1702769. [Google Scholar] [CrossRef]
- Zou, K.; Cai, P.; Liu, C.; Li, J.; Gao, X.; Xu, L.; Zou, G.; Hou, H.; Liu, Z.; Ji, X. A kinetically well-matched full-carbon sodium-ion capacitor. J. Mater. Chem. A 2019, 7, 13540–13549. [Google Scholar] [CrossRef]
- Jiang, C.; Fang, Y.; Zhang, W.; Song, X.; Lang, J.; Shi, L.; Tang, Y. A multi-ion strategy towards rechargeable sodium-ion full batteries with high working voltage and rate capability. Angew. Chem. Int. Ed. 2018, 57, 16370–16374. [Google Scholar] [CrossRef]
- Gao, H.; Goodenough, J.B. An Aqueous Symmetric Sodium-Ion Battery with NASICON-Structured Na3MnTi(PO4)3. Angew. Chem. Int. Ed. 2016, 55, 12768–12772. [Google Scholar] [CrossRef]
- Kim, M.H.; Yang, J.H.; Kang, Y.M.; Park, S.M.; Han, J.T.; Kim, K.B.; Roh, K.C. Fluorinated activated carbon with superb kinetics for the supercapacitor application in nonaqueous electrolyte. Colloids Surf. A Physicochem. Eng. Asp. 2014, 443, 535–539. [Google Scholar] [CrossRef]
- Liu, G.; Wang, N.; Qi, F.; Lu, X.; Liang, Y.; Sun, Z. Novel Ni–Ge–P anodes for lithium-ion batteries with enhanced reversibility and reduced redox potential. Inorg. Chem. Front. 2023. advance article. [Google Scholar] [CrossRef]
- Okoshi, M.; Yamada, Y.; Komaba, S.; Yamada, A.; Nakai, H. Theoretical analysis of interactions between potassium ions and organic electrolyte solvents: A comparison with lithium, sodium, and magnesium ions. J. Electrochem. Soc. 2017, 164, A54–A60. [Google Scholar] [CrossRef]
- Liang, Y.; Chen, Y.; Ke, X.; Zhang, Z.; Wu, W.; Lin, G.; Zhou, Z.; Shi, Z. Coupling of triporosity and strong Au–Li interaction to enable dendrite-free lithium plating/stripping for long-life lithium metal anodes. J. Mater. Chem. A 2020, 8, 18094–18105. [Google Scholar] [CrossRef]
- Franklin, R. Crystallite growth in graphitizing and non-graphitizing carbons. Proc. R. Soc. A Math. Phys. Eng. Sci. 1951, 209, 196–218. [Google Scholar] [CrossRef]
- Dou, X.; Hasa, I.; Saurel, D.; Vaalma, C.; Wu, L.; Buchholz, D.; Bresser, D.; Komaba, S.; Passerini, S. Hard carbons for sodium-ion batteries: Structure, analysis, sustainability, and electrochemistry. Mater. Today 2019, 23, 87–104. [Google Scholar] [CrossRef]
- Chen, D.; Zou, L.; Li, S.; Fang, Z. Nanospherical like reduced graphene oxide decorated TiO2 nanoparticles: An advanced catalyst for the hydrogen evolution reaction. Sci. Rep. 2016, 6, 20335. [Google Scholar] [CrossRef] [PubMed]
- Bokobza, L.; Bruneel, J.L.; Couzi, M. Raman spectroscopy as a tool for the analysis of carbon-based materials (highly oriented pyrolitic graphite, multilayer graphene and multiwall carbon nanotubes) and of some of their elastomeric composites. Vib. Spectrosc. 2014, 74, 57–63. [Google Scholar] [CrossRef]
- Terrones, H.; Lv, R.; Terrones, M.; Dresselhaus, M.S. The role of defects and doping in 2D graphene sheets and 1D nanoribbons. Rep. Prog. Phys. 2012, 75, 062501. [Google Scholar] [CrossRef] [PubMed]
- Gautam, R.K.; Bhattacharjee, H.; Mohanb, S.V.; Verma, A. Nitrogen doped graphene supported α-MnO2 nanorods for efficient ORR in a microbial fuel cell. RSC Adv. 2016, 6, 110091–110101. [Google Scholar] [CrossRef]
- Kumar, R.; Macedo, W.C., Jr.; Singh, R.K.; Tiwari, V.S.; Constantino, C.J.L.; Matsuda, A.; Moshkalev, S.A. Nitrogen–Sulfur Co-Doped Reduced Graphene Oxide-Nickel Oxide Nanoparticle Composites for Electromagnetic Interference Shielding. ACS Appl. Nano Mater. 2019, 2, 4626–4636. [Google Scholar] [CrossRef]
- Donadelli, J.A.; Canneva, A.; Erra, G.; Calvoa, A. XPS direct analysis on shale rocks: Correlation with kerogen type and maturity. Fuel 2019, 257, 116004. [Google Scholar] [CrossRef]
- Reddy, M.A.; Helen, M.; Grob, A.; Fichtner, M.; Fichtner, M.; Euchner, H. Insight into Sodium Insertion and the Storage Mechanism in Hard Carbon. ACS Energy Lett. 2018, 3, 2851–2857. [Google Scholar] [CrossRef]
- Ahmad, K.; Kim, H. Fabrication of Nitrogen-Doped Reduced Graphene Oxide Modified Screen Printed Carbon Electrode (N-rGO/SPCE) as Hydrogen Peroxide Sensor. Nanomaterials 2022, 12, 2443. [Google Scholar] [CrossRef] [PubMed]
- Mahato, N.; Cho, M.; Ahn, K. Semi-Polycrystalline–Polyaniline Empowered Electrochemical Capacitor. Energies 2022, 15, 2001. [Google Scholar] [CrossRef]
- Liu, X.; Elia, G.A.; Qin, B.; Zhang, H.; Ruschhaupt, P.; Fang, S.; Fang, S.; Fang, S.; Varzi, A. Passerini, High-Power Na-Ion and K-Ion Hybrid Capacitors Exploiting Cointercalation in Graphite Negative Electrodes. ACS Energy Lett. 2019, 4, 2675–2682. [Google Scholar] [CrossRef]
- Vlad, A.; Singh, N.; Rolland, J.; Melinte, S.; Ajayan, P.M.; Gohy, J.F. Hybrid supercapacitor-battery materials for fast electrochemical charge storage. Sci. Rep. 2014, 4, 4315. [Google Scholar] [CrossRef] [PubMed]


Disclaimer/Publisher’s Note: The statements, opinions and data contained in all publications are solely those of the individual author(s) and contributor(s) and not of MDPI and/or the editor(s). MDPI and/or the editor(s) disclaim responsibility for any injury to people or property resulting from any ideas, methods, instructions or products referred to in the content. |
© 2023 by the authors. Licensee MDPI, Basel, Switzerland. This article is an open access article distributed under the terms and conditions of the Creative Commons Attribution (CC BY) license (https://creativecommons.org/licenses/by/4.0/).