Article

Simulating Fish Motion through a Diagonal Reversible Turbine

by
Phoevos (Foivos) Koukouvinis
and
John Anagnostopoulos
*
Laboratory of Hydraulic Turbomachines, Department of Mechanical Engineering, National Technical University of Athens, Heroon Polytechniou 9, Zografou, 157 80 Athens, Greece
*
Author to whom correspondence should be addressed.
Energies 2023, 16(2), 810; https://doi.org/10.3390/en16020810
Submission received: 25 November 2022 / Revised: 5 January 2023 / Accepted: 6 January 2023 / Published: 10 January 2023
(This article belongs to the Topic Hydroelectric Power)

Abstract

:
Utilization of unharnessed hydro-power necessitates designing fish-friendly hydraulic machinery. Towards this effort, the present work investigates various methods for tracking fish motion, ranging from particle tracking methods to accurate, but computationally expensive, body tracking methods, such as immersed boundaries and overset meshes. Moreover, a novel uncoupled 6-Degree of Freedom tracking technique is proposed, based on an approximated pressure field around the tracked body of interest, using steady-state flow field data, and including collision detection to walls. The proposed method shows promising results in terms of accuracy, being comparable to the more computationally expensive fully coupled methods at a tiny fraction of the execution time. The new method reveals location of fish–blade impact, as well as statistics of forces, pressure and flow shear that a passing fish is subjected to, both in the normal and reverse operation of the turbine. The low computational cost of the proposed method renders it attractive for optimization studies.

1. Introduction

Hydropower is the largest contributor to the renewable energy market, making up almost 16% of the total produced electrical energy worldwide [1]. Compared to other renewables, it has an estimated contribution in the energy production of almost 60%, based on 2021 data [2]. The role of hydropower is expected to increase dramatically in the future for two main reasons:
1. It can greatly contribute as an energy storage solution, along with batteries, allowing the increased penetration of other renewable sources [3], such as wind and solar, the latter being inherently less predictable due to weather patterns. Estimates indicate that the installed capacity of reversible hydro/pumped storage will increase by 56% till 2026 [4].
2. There is a substantial amount of unharnessed hydropower potential, with estimates indicating that, roughly, 25% of the technically achievable and 50% of the economically feasible (for the current technologies) potential is currently being utilized [5]. Indicatively, significant potential can also be found in existing infrastructure that currently lacks generating units (e.g., existing barrages, weirs, dams, canal fall structures, water supply schemes) by adding new hydropower facilities. To this purpose, the installed hydropower capacity is expected to increase steadily [6], with projections showing a steady 3% increase annually of hydropower contribution to the global energy market until the year 2030, assuming a Net Zero Emissions scenario [7].
As outlined above, the increasing penetration of hydropower, both as a means of electric grid stabilization/energy storage solution and flexible energy production, through the use of new and existing infrastructures, is expected to have an impact on aquatic life [8,9]. In recent years, there has been a steadily increasing interest in fish-friendly turbine design concepts, that, aside from efficiency objectives, also examine aquatic life survivability indicators.
Despite the increasing interest in hydropower, the concept of fish-friendly hydropower and fish-friendly turbines is not new. Since early 2000s there have been efforts to design novel turbine concepts with minimum effects on passing fish. In particular, several critical damage mechanisms have been identified [10,11], namely:
1. The possibility of impact of the fish on the rotating runner and/or stator vanes, due to the surrounding flow. The aspect of mechanical trauma could also involve grinding of fish in small passages/gaps.
2. The local pressure variation over time and in particular sudden pressure decrease, as pressure increase was found to have little effect on passing fish [11]. More extreme pressure drops could even lead to barotrauma [12] and/or cavitation inside the fish tissue, even though these are in general limited, as there are guidelines on minimum pressure for turbine operation.
3. The intensity of shear stresses, vorticity and turbulence which mechanically lead to strain of the fish tissues and/or disorient them. Abrasion can also occur as the fish is forced to the circumference of turbine pipelines due to imparted whirl [11], e.g., inside the draft tube.
Many studies have been conducted with experimental means to understand the mechanisms of fish damage and to extrapolate these findings to fish-friendly turbine concepts. Indicatively, investigations with X-rays and high-resolution photography on simulated decompression of fish tissues have illustrated that the main mechanism of barotrauma is large pressure drops [12], potentially rupturing fish bladders. Similar experimental investigations with water jets revealed shear stress thresholds that fish can experience without sustaining tissue damage (descaling) [13]. More recent experimental investigations involve autonomous sensor devices that replicate fish trajectories through a turbine, at the same time collecting data on local accelerations [14] and even pressure [15].
In an effort to actually predict the mortality and injury of fish passing through hydraulic machinery, correlations for blade strike probability and the resulting mortality or injury have been derived using live fish [16]. More recent works actually involve entirely computational methods, modeling the passing fish with various assumptions. Early approaches involved the simplification of treating a fish trajectory as a flow streamline [13] and deriving pressure or shear stress variation along this path. Newer works involve Lagrangian approaches where the fish is approximated as a particle [17] or a linear arrangement of particles with the Discrete Element Method (DEM) [18]. However, these methods have their shortcomings, mainly related to the simplifications for estimating the fluid-induced forces on the tracked fish. Whereas more accurate methods exist (e.g., overset meshes, immersed boundaries), only recently (see [19]) have they been employed in fish tracking studies and still were associated with severe limitations (lack of collision detection, enormous computational cost), prohibitive for practical application and extraction of statistical data.
The present work aims to contribute towards the goal of predicting fish motion through a hydraulic machine with simulation methods, while also collecting statistical information that could correlate with fish injury. Novel elements of the present work involve:
1. A new method for tracking the motion of rigid, immersed bodies in flow is proposed. The method aims to be placed in between fast, Lagrangian, particle methods which use empirical laws for fluid interaction and computationally expensive, fully coupled, 6-DoF methods. An additional and critical element of the present method is inclusion of wall collisions; it is highlighted that the latter is not a standard option in most CFD tools available.
2. A comparison of the performance of several methods used in the literature for tracking immersed bodies, along with the more accurate fully coupled 6-DoF tracking and the newly proposed method, assessing the importance of the aforementioned assumptions of each method.
3. The study of a reversible, diagonal-type (Deriaz) turbine in both turbine and pumping modes. The model under consideration is a five-bladed turbine previously optimized in its energy recovery characteristics [20]. Diagonal turbines could be considered an advantageous solution compared to relatively low-head Francis turbines in sites with significant flow rate variation or when variable operation and flexibility are desired, thanks to their double regulation feature, as well as when the survivability of the passing fish is an important environmental issue, thanks to the mixed flow design and the smaller blade numbers of the runner.
In the frame of the present work, hydrodynamic forces acting on the body due to pressure are calculated and recorded, as are any collisions of the body on the rotating blades or on the hub/shroud surfaces. These data are then used to quantify the probability and the severity of injuries to passing fish. The new tool is also used to assess the behavior of the same diagonal turbine in reverse operation as a pump, due to the increasing interest in pumped storage plants at lower static head sites, within the range of this turbine type.

2. Numerical Methods

In this section, a brief overview of popular existing methodologies on body tracking in computational fluid dynamics will be provided, with emphasis on the newly proposed algorithm for uncoupled body tracking, which demonstrates promising results.

2.1. Particle-Based Methods

Particle-based methods, in the form of Discrete Particle Method, Dense Discrete Particle Method or Discrete Element Method, are very popular in computational mechanics and have also been investigated for fish tracking in hydraulic turbines; see particularly [17,18]. The common aspect of all these methods is that the interaction of the tracked body with the surrounding fluid is performed using Newton’s Law of motion, by taking into account various forces. A set of equations commonly resolved in a Lagrangian approach for particle tracking are as follows:
EquationFormulation
Momentum equation m d u d t = F d + F p + F v m + F L (1)
Drag force F d = 1 2 C d ρ A u r u r (2)
Pressure gradient force F p = V p p (3)
Virtual mass force F c m = C v m V p ρ D u D t d u p d t (4)
where: Cd stands for the drag coefficient, ρ density of the fluid, A the surface area of the particle, ur for the relative velocity vector, i.e., flow velocity minus the particle velocity, u-up, Vp the particle volume, p pressure, and Cvm the virtual mass coefficient. Additional forces can be included, as lift forces (both Saffman and Magnus), rotationally induced drag, as well as collision forces and non-spherical modifications of drag coefficient. A detailed description of such models is provided in [21].
A basic limitation of this family of methods is that the fluid–body interaction is done assuming particle-derived force laws, which, although they may feature corrections for non-spherical particles, in their core do not take into account body orientation. Even in the case of particle-to-particle or particle-to-boundary interactions it is assumed that the particle shape is point-like, with the only exception being the Discrete Element Method, which can take into account simple approximations of general shapes (e.g., ellipse, cylinder, etc).

2.2. Overset Meshes

Overset meshes are a technique of mesh generation and manipulation that allows relatively easy handling of complex motions/deformations [22]. In its core, it features a background mesh and one or more component meshes, which are attached to, e.g., moving bodies. Interpolations are performed from the component meshes to the background mesh to define connectivity between the otherwise disconnected regions and to form the computational domain. In general, it is a well-established, accurate and versatile method to handle 6-DoF body tracking, following a very similar methodology as the one outlined in Section 2.4. Its main drawbacks are: (a) very computationally expensive, (b) cannot take into account collisions (at least not by default), (c) the method has special requirements on mesh sizing at the overlap region and may require a per-case adjustment of schemes for cell-cutting and grid priorities, to minimize the presence of cells without suitable neighbors to interpolate to and from (also called orphan cells).

2.3. Immersed Boundaries

Immersed boundaries are a technique for mapping the geometry of solid bodies on a background mesh [23]; this is commonly achieved either by introducing appropriate source terms in the momentum equation, or by cell-cutting to conform to the body geometry. Similar to overset meshes, it is an accurate technique, hence it is quite computationally expensive (although less expensive than overset meshes). However, a main requirement is that the mesh resolution cannot be coarser than the smallest dimension of the body to be tracked, or else the solid mapping to the fluid domain will not be accurate (non-smooth surface, artificial gaps/holes).

2.4. Uncoupled 6-DoF Tracking

2.4.1. Fluid Coupling and 6-DoF

The body to be described is represented using a triangular tessellation, forming a surface grid. This grid can be further simplified to a set of points, each located at the barycenter of the respective triangular element, and a surface area dS, together with the local normal vector, n; see also Figure 1a. At each point of the body’s surface, the nearest neighbors (cell centers) of the solved flow field are found using a knn-search algorithm [24]. Then, once the closest neighbors are found, the flow variables are interpolated. Various interpolation methods have been tested in the scope of this work; in particular Inverse Distance (ID), Radial Basis Functions (RBF), Nearest Neighbor (NN), Least Squares/Linear Regression (LS) and, as a baseline, the scatteredInterpolant function in Matlab, using localized Delaunay tessellation; all aforementioned methods give similar results, as will be presented in Section 4. A brief formulation of the interpolation methods is presented below in Table 1, apart from the scatteredInterpolant function for which the interested reader is addressed to Matlab documentation and the relevant reference [25].
Local pressure at each face element is calculated applying the Bernoulli equation, as the sum of interpolated flow pressure, pflow, plus dynamic pressure due to slip velocity, pdyn; (see also Figure 1b), i.e.,:
p l o c a l = p f l o w + p d y n
p d y n = 1 2 ρ u n , f l o w u n , s u r f 2 s i g n   u n , s u r f u n , f l o w
where n index implies the projection on the local surface normal vector, and ρ is the flow density (taken the same as water here). Moreover, uflow implies the velocity of the interpolated flow field, whereas usurf implies the velocity of the surface element, calculated by the body kinematics. Once local pressure is calculated, then the total force, F, and torque, T, on the body can be calculated by integrating along the body surface of the contributions on each infinitesimal surface element dS, associated with a normal vector n:
d F = p n d S
d T = r × d F
Center of gravity motion can be integrated through Newton’s law of motion, i.e.,:
F = m x ¨
However, body rotation is more complicated, as it needs to be expressed in a body–local coordinate system, where the moment of inertia tensor, I, is naturally expressed. For this, it is necessary to introduce the Euler angles, [φ, θ, ψ], which express a sequence of rotations to convert the global coordinate system to the body-local coordinate system, by first rotating around the global Z-axis (ψ), then the transformed Y-axis (θ) and finally around the transformed X-axis (φ) [26]. With these angles, torques expressed in the global coordinate system are transformed to a local coordinate system, using the R-transformation matrix, shown below:
R = cos θ cos ψ cos θ sin ψ sin θ sin φ sin θ cos ψ cos φ sin ψ sin φ sin θ sin ψ + cos φ cos ψ sin φ cos θ cos φ sin θ cos ψ + sin φ sin ψ cos φ sin θ sin ψ sin φ cos ψ cos φ cos θ
For more details on derivation the reader is addressed to [26]. The transformation matrix is applied to convert global (indicated with the index G) torque vector to the body–local (indicated with index B), as TB = R.TG. Then, the body–local torque vector is used to calculate the angular acceleration at the body frame, keeping in mind that the body–coordinate system is rotating. Hence, the following formula applies:
ω ˙ B = I 1 T B ω B × I ω B
Then, body frame angular acceleration can be integrated to update the body-frame angular velocities and then transformed back to the global frame, using the inverse R transformation. At the same time, angular velocities of the Euler angles, ωE, can be calculated from the body–coordinate angular velocities, ωB, through a similar transform, denoted with G:
ω E = G ω B
G = 1 sin φ tan θ cos φ tan θ 0 cos φ sin φ 0 sin φ sec θ cos φ sec θ
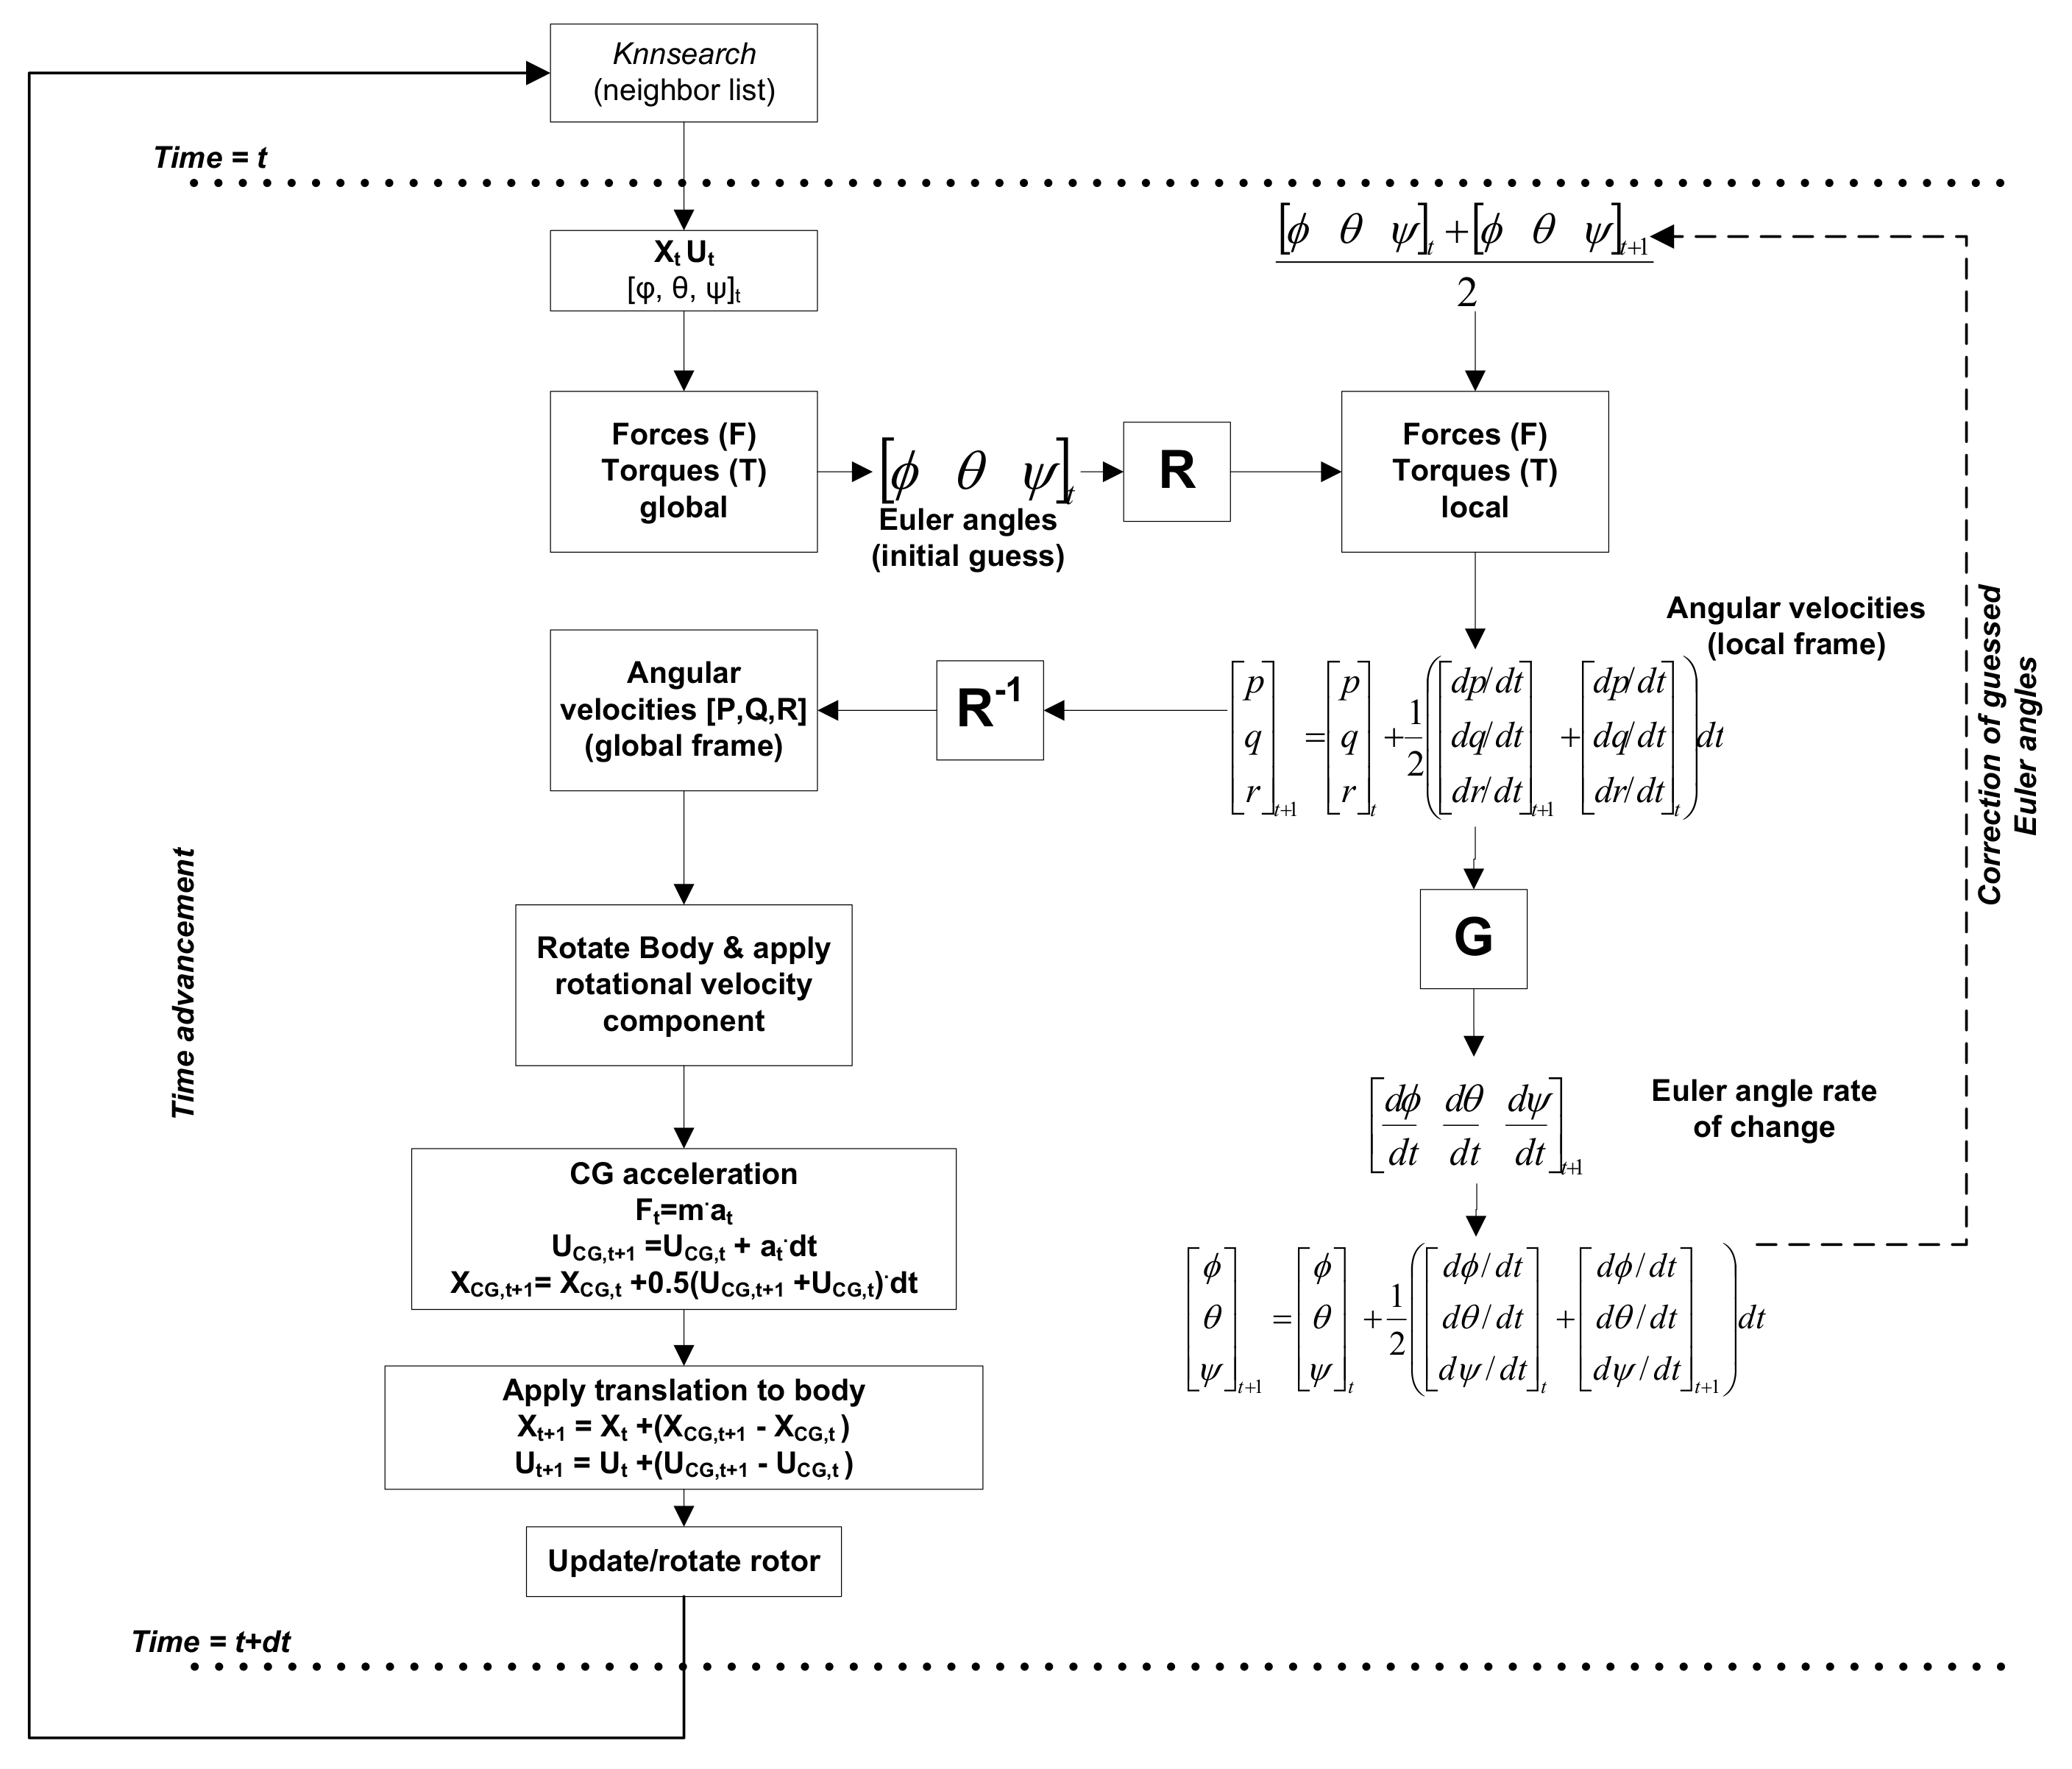
Integration of linear/rotational motion and Euler angles is implemented using an explicit Euler, corrected Euler (Heun) or implicit Euler method [27], depending on the number of corrections applied. Sub-cycling can also be applied, that is, advancing angles and angular velocities at smaller intervals than linear displacements and velocities; this option greatly helps to conserve the angular momentum, as will be shown later on in Section 4. An indicative calculation process of the algorithm is shown in Figure 2. In any case, tracking is performed until the body exits the outlet boundary of the turbine/pump configuration.
The fish model is a simplification of a more complex fish shape, obtained from a CAD repository [28]. The fish is approximated as an ellipsoid with dimensions of 0.173 × 0.04 × 0.017 (L × H × D), mass of 63.6 g, assuming neutral buoyancy, and moments of inertia of: I1 = 1.012 × 10⁻⁴ kg·m2, I2 = 9.71 × 10⁻⁵ kg·m2, I3 = 6.099 × 10⁻⁶ kg·m2 (off-diagonal moment of inertia terms are zero). While the more accurate methods discussed here can handle the complexity of actual fish geometry, it was preferred to resort to a simpler geometric shape, in the form of an ellipsoid, for replicability and easier reference.

2.4.2. Collision Detection

An important aspect of the uncoupled 6-DoF approach proposed here is the inclusion of a collision detection algorithm that prevents the tracked body from penetrating solid boundaries. The algorithm is based on the application of an external spring type force from each boundary (wall) element, generally represented as:
F = k s p r i n g a b s ( min ( 0 , d p r o j ) ) n
where kspring is the spring constant (tested values in the range of 100–1000 N/m), n is the local wall normal vector and dproj is the projected distance of each tracked body surface element to the closest wall element. The process for identifying collisions is as follows (see also Figure 3); for each surface element (highlighted with dark blue in Figure 3) of the tracked body,
use knn-search to find the closest (i.e., min distance, dmin) wall boundary element (indicated with red highlight in Figure 3)
project the minimum distance vector at the local wall normal, n, to calculate dproj
if the projection is positive, do nothing (no penetration)
if the projection is negative, apply Equation (18).
The aforementioned methodology assumes that the surface is represented at an adequate resolution and that curvature is resolved well enough so that large changes in wall normal direction are captured. In the opposite case, no-penetration for all impact angles cannot be ensured. As an indicative demonstration, the collisions of the tracked object are presented in Figure 4, as it passes from the stator blades of the simulated turbine; for a detailed description, see the next section. The point of this demonstration is that the method presented here is capable of tracking efficiently collisions with complex, curved bodies.

3. Case Description

An optimized reversible diagonal turbine has been the focus of the present investigation. The design has been a result of optimization, as discussed in previous publications by the authors [20]. The design features a five-bladed rotor and two series of stator blades, an outer one with 17 blades and an inner one with 20 blades. The main dimensions of the hydraulic machine are: casing inlet surface area 2.26 m2, draft tube outlet surface area 4.99 m2, max. radius of casing 3 m, runner diameter 2 m. An indicative view of the geometry is shown in Figure 5.
The conditions of operation of the reversible turbine are for (1) turbine mode: flow rate 12.9 m3/s, total head 45 m, rotation speed 300 rpm, efficiency 89%, (2) pump mode: flow rate 10.3 m3/s, total head 28 m, rotation speed 300 rpm, efficiency 86%. An indicative view of the turbine operation, as well as the computational mesh, is shown in Figure 6.
Design performance, in both normal and reversed operation, has been examined using a sliding mesh approach; in this approach, non-conformal interfaces are defined at surfaces separating rotating from stationary regions. These interfaces act as interpolation zones over which information passes from one mesh region to the other. The structuring of the computational domain is shown in Figure 6a–c, indicating the different parts involved (casing volume, rotor and duct), along with non-conformal interfaces (indicated in yellow). Views of the mesh are included in Figure 6d–e, showing details of mesh structure; the computational mesh is hybrid, poly-hex core, with refinement towards wall boundaries and especially rotor/stator blades, ensuring a maximum y+ of ~300. Three layers of prism-type cells are included at all wall boundaries to capture near-wall gradients. The total computational mesh consists of 2.3 million cells, as demonstrated by a mesh-independence study conducted through prior work of the authors [20].
Each investigated configuration is adapted to the particularities of the modeling method:
Particle tracking or the uncoupled 6-DoF tracking are performed with sliding meshes. In this case, the rotor consists of a moving (rotating) mesh in the case of particle tracking, or rotating reference frame in the case of the uncoupled 6-DoF tracking. Particle tracking was done in a transient analysis in ANSYS Fluent v2021, whereas the uncoupled 6-DoF was performed using a steady state flow field, also from ANSYS Fluent v2021. In the frame of the present investigation, particles emulating the fish are approximated as equivalent spheres of radius 24.7 mm, considering drag, lift, added mass force and rotation. Non-spherical effects are taken into account using a non-spherical factor of 0.66 corresponding to the surface area ratio of the fish model and a sphere of the same equivalent volume.
Overset mesh body tracking was performed using similar meshing methods and resolution as the sliding mesh approach, but with a different structure to accommodate for overset domains; an indicative view of the mesh structure, showing overlapping regions, is in Figure 7. The set-up can be summarized as follows: a rotating mesh was used for the rotor, which was considered as component mesh with the lowest grid priority. The fish was introduced in another component mesh, enclosed within a sphere of diameter 0.74 m, or 4.35 fish lengths; it had intermediate grid priority. The fish domain 6-DoF properties (mass, moments of inertia) are the same as the uncoupled 6-DoF approach (see Section 2.4.1). Finally, the background mesh consisting of the complete flow path (including casing, stator blades and duct) had the highest grid priority. Overset simulation was performed using ANSYS Fluent v2021. The body was tracked with an implicit scheme, to maintain stability while using large time steps, in the order of 1 ms.
Immersed boundary was set up using CFX v2021, by introducing the flow passage through the turbine and modeling the rotor blades and the fish as immersed bodies. However, due to the large aspect ratio of the fish and blades (effectively very thin bodies) it was impossible to obtain a good representation for reasonable mesh resolutions and a tractable computational cost.
Figure 7. Indicative views of the overset mesh: (a) near the region of the tracked body (ellipsoid) (b) at the rotor blades. The overlap of the mesh zones is visible.
Energies 16 00810 g007

4. Validation

To test the validity of the uncoupled 6-DoF method proposed here, several tests have been performed.

4.1. Influence of the Interpolation Method

Here a comparison of the interpolation methods that can be used to reconstruct the flow field on the surface of the tracked body is presented. The results are shown in Figure 8a, showing a similar trend up to the rotor.
When comparing the methods it is notable that the localized Delaunay tessellation is the most computationally intensive, which is reasonable given the cost of constructing tetrahedral elements from the localized point cloud to perform interpolations. The Radial Basis Function interpolation has the drawback of a user-defined term, cRBF (see Table 1), which is case-dependent and can lead to ill-conditioned matrices, potentially causing instabilities due to inaccurate interpolation after inversion. A similar issue, although to a lesser extent, has been observed with the Least Squares/Linear Regression method; even if lacking tuned coefficients, instabilities may arise due to inversion, depending on the number and positions of neighboring sampling points identified. The most robust method tended to be the Inverse Distance interpolation, which is rather stable and comparable to all other methods. The fastest method is the Nearest Neighbor search, which however tends to be sensitive in areas of sparse sampling points (i.e., coarse background mesh).

4.2. Resolution of the Body

Different resolutions were tested for the ellipsoid fish model, ranging from 0.5–2 k surface elements (triangles). All gave a very similar trajectory and body rotations up to the point of the interaction with the runner, as shown in Figure 8b; hence, a resolution of 1 k elements was deemed enough for the remaining investigations. Beyond that point, differences are observed, which are due to the strongly non-linear driving force from the flow field, which effectively represents a swirling flow. Hence, small variations of the position of the body can lead to detrimental changes in the trajectory.
The discrepancies after the rotor interaction, both due to interpolation method and resolution, are intrinsic to the tracking of bodies immersed in fluids. In fact, the motion of a body through a fluid has been proven to be very sensitive to small variations of the exact flow conditions, leading to different results in both the orientation and the exact trajectory of a fixed point on the body; see [29,30,31]. Furthermore, such chaotic motions have been identified in the case of tumbling ellipsoid objects, such as the one examined in the scope of the present work [32]. Hence, flow velocity variations, generated due to error accumulation from interpolation or resolution, are expected to lead to different trajectories after a point. Nevertheless, the relative convergence of flow paths up to the point of the turbine rotor demonstrates that the fast-tracking method proposed is capable of providing a reasonable estimation of the trajectory of a fish-like object until the interaction with the rotor.

4.3. Prediction of Free Rotation of the Fish Model

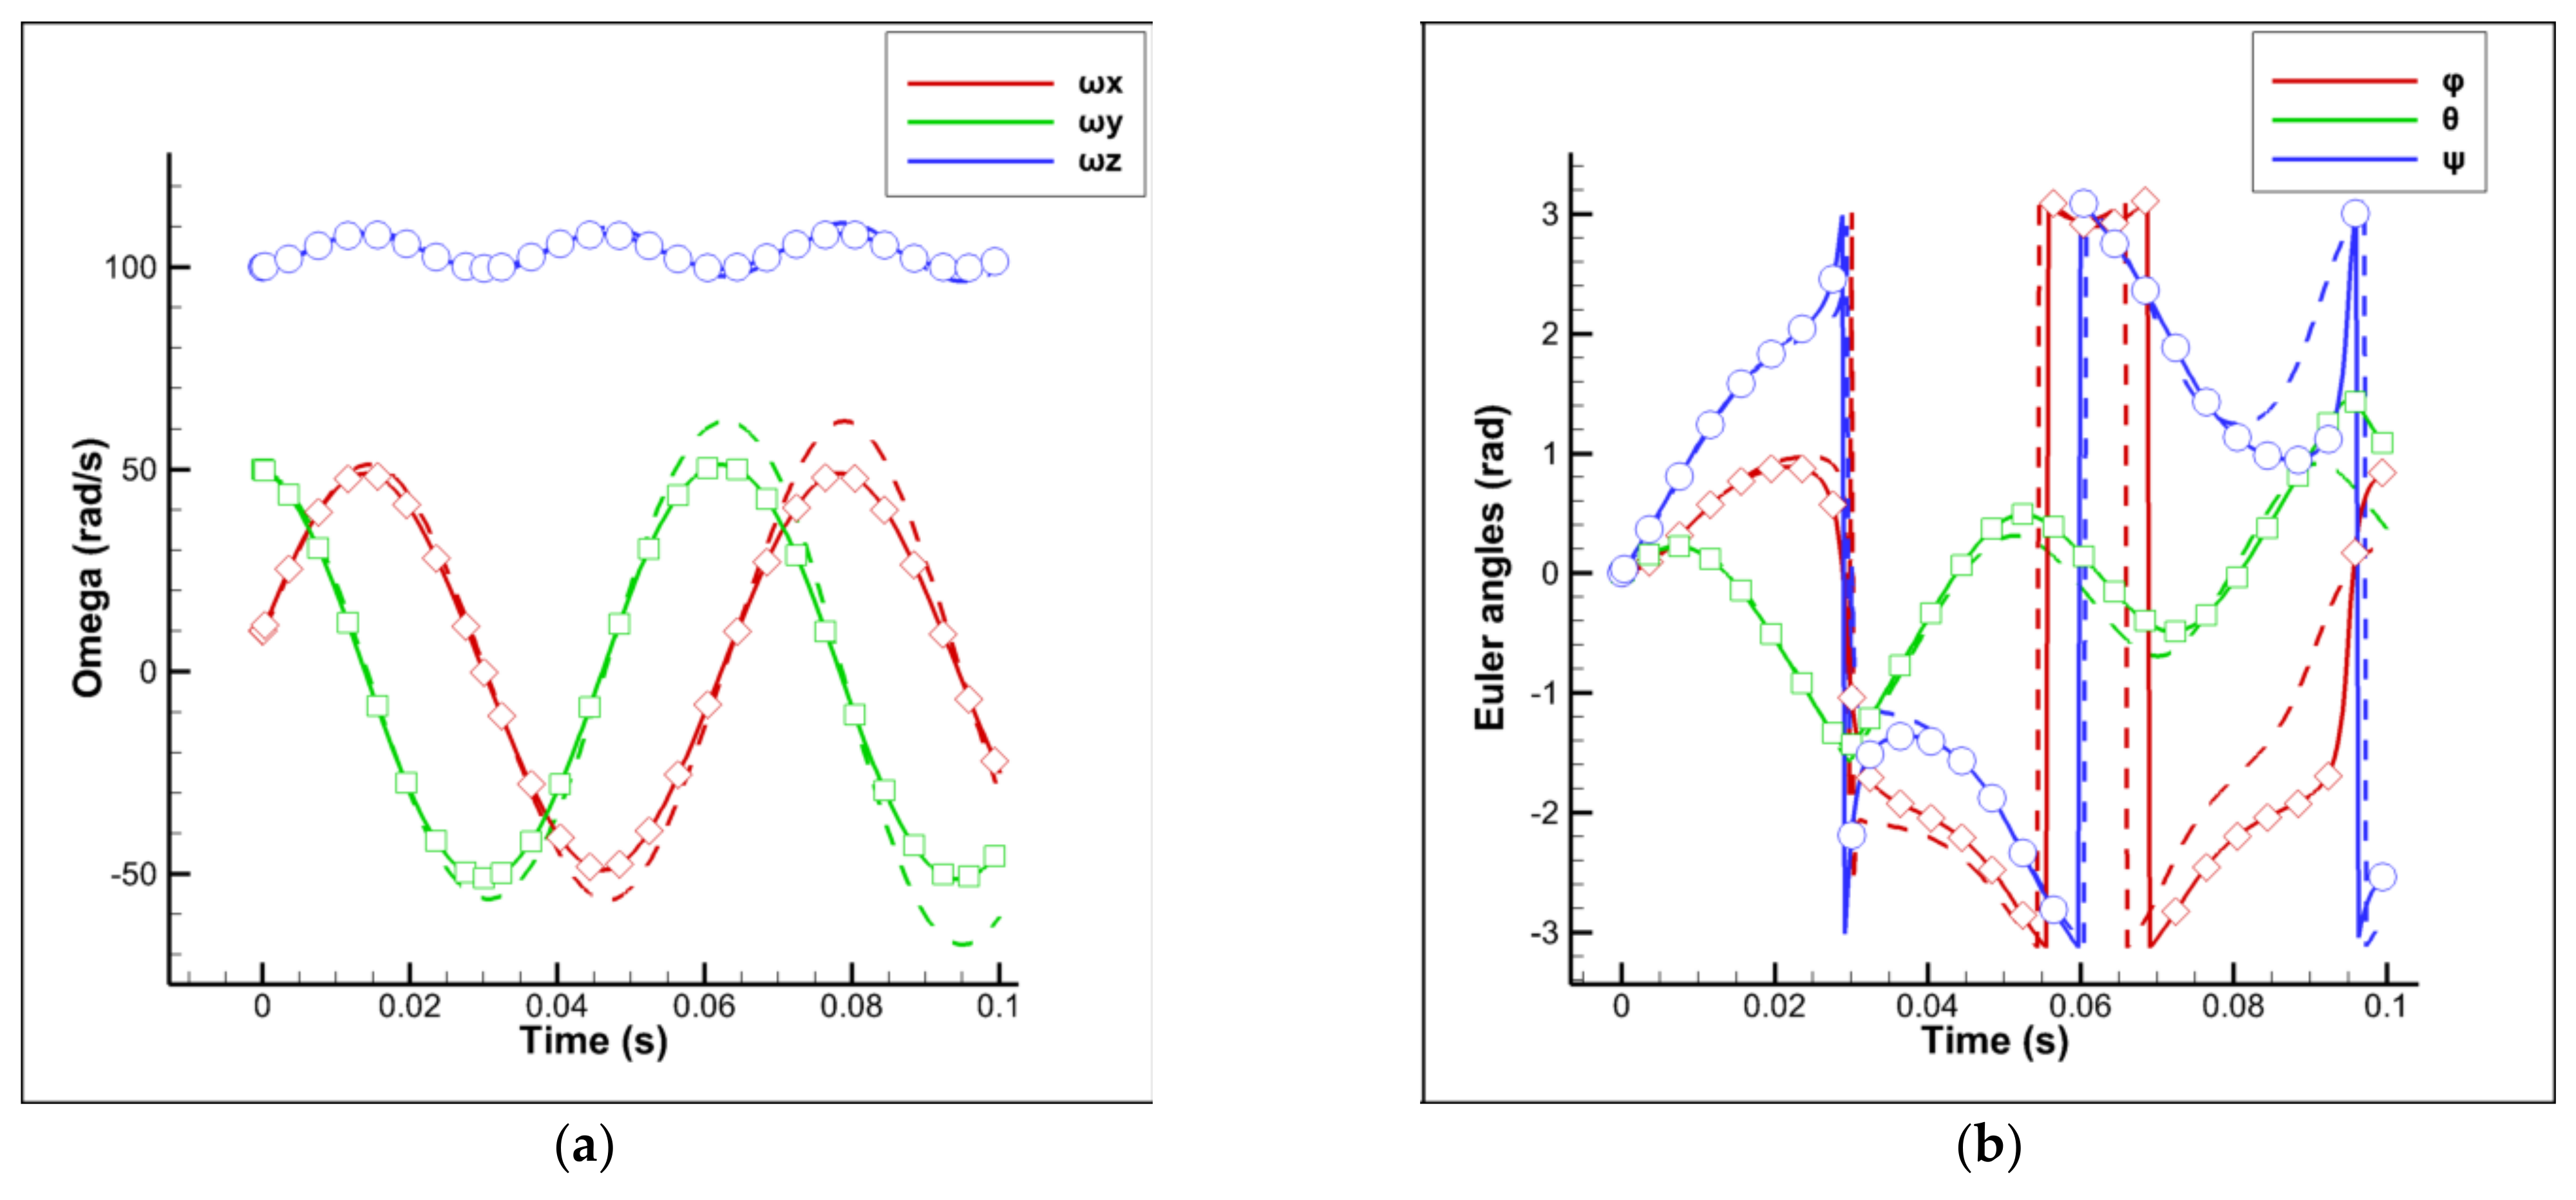
Here we test the evolution of angular velocities of the body, without any torques/forces, to assess conservation of angular momentum, comparing against a reference solution from SIMULINK 6-DoF solver, with initial conditions ωx = 10 rad/s, ωy = 50 rad/s, and ωz = 100 rad/s. As shown in Figure 9, reproduction of the reference results is perfect when sub-cycling is used. Note that this case poses an extreme configuration, as any rotation in the simulations to be further examined will effectively be dampened by the surrounding fluid. However, this idealized case serves as validation for testing the numerical integration scheme proposed in Section 2.4.1.

4.4. Prediction of a Fish Track in the Diagonal Turbine Model/Comparison of Different Techniques

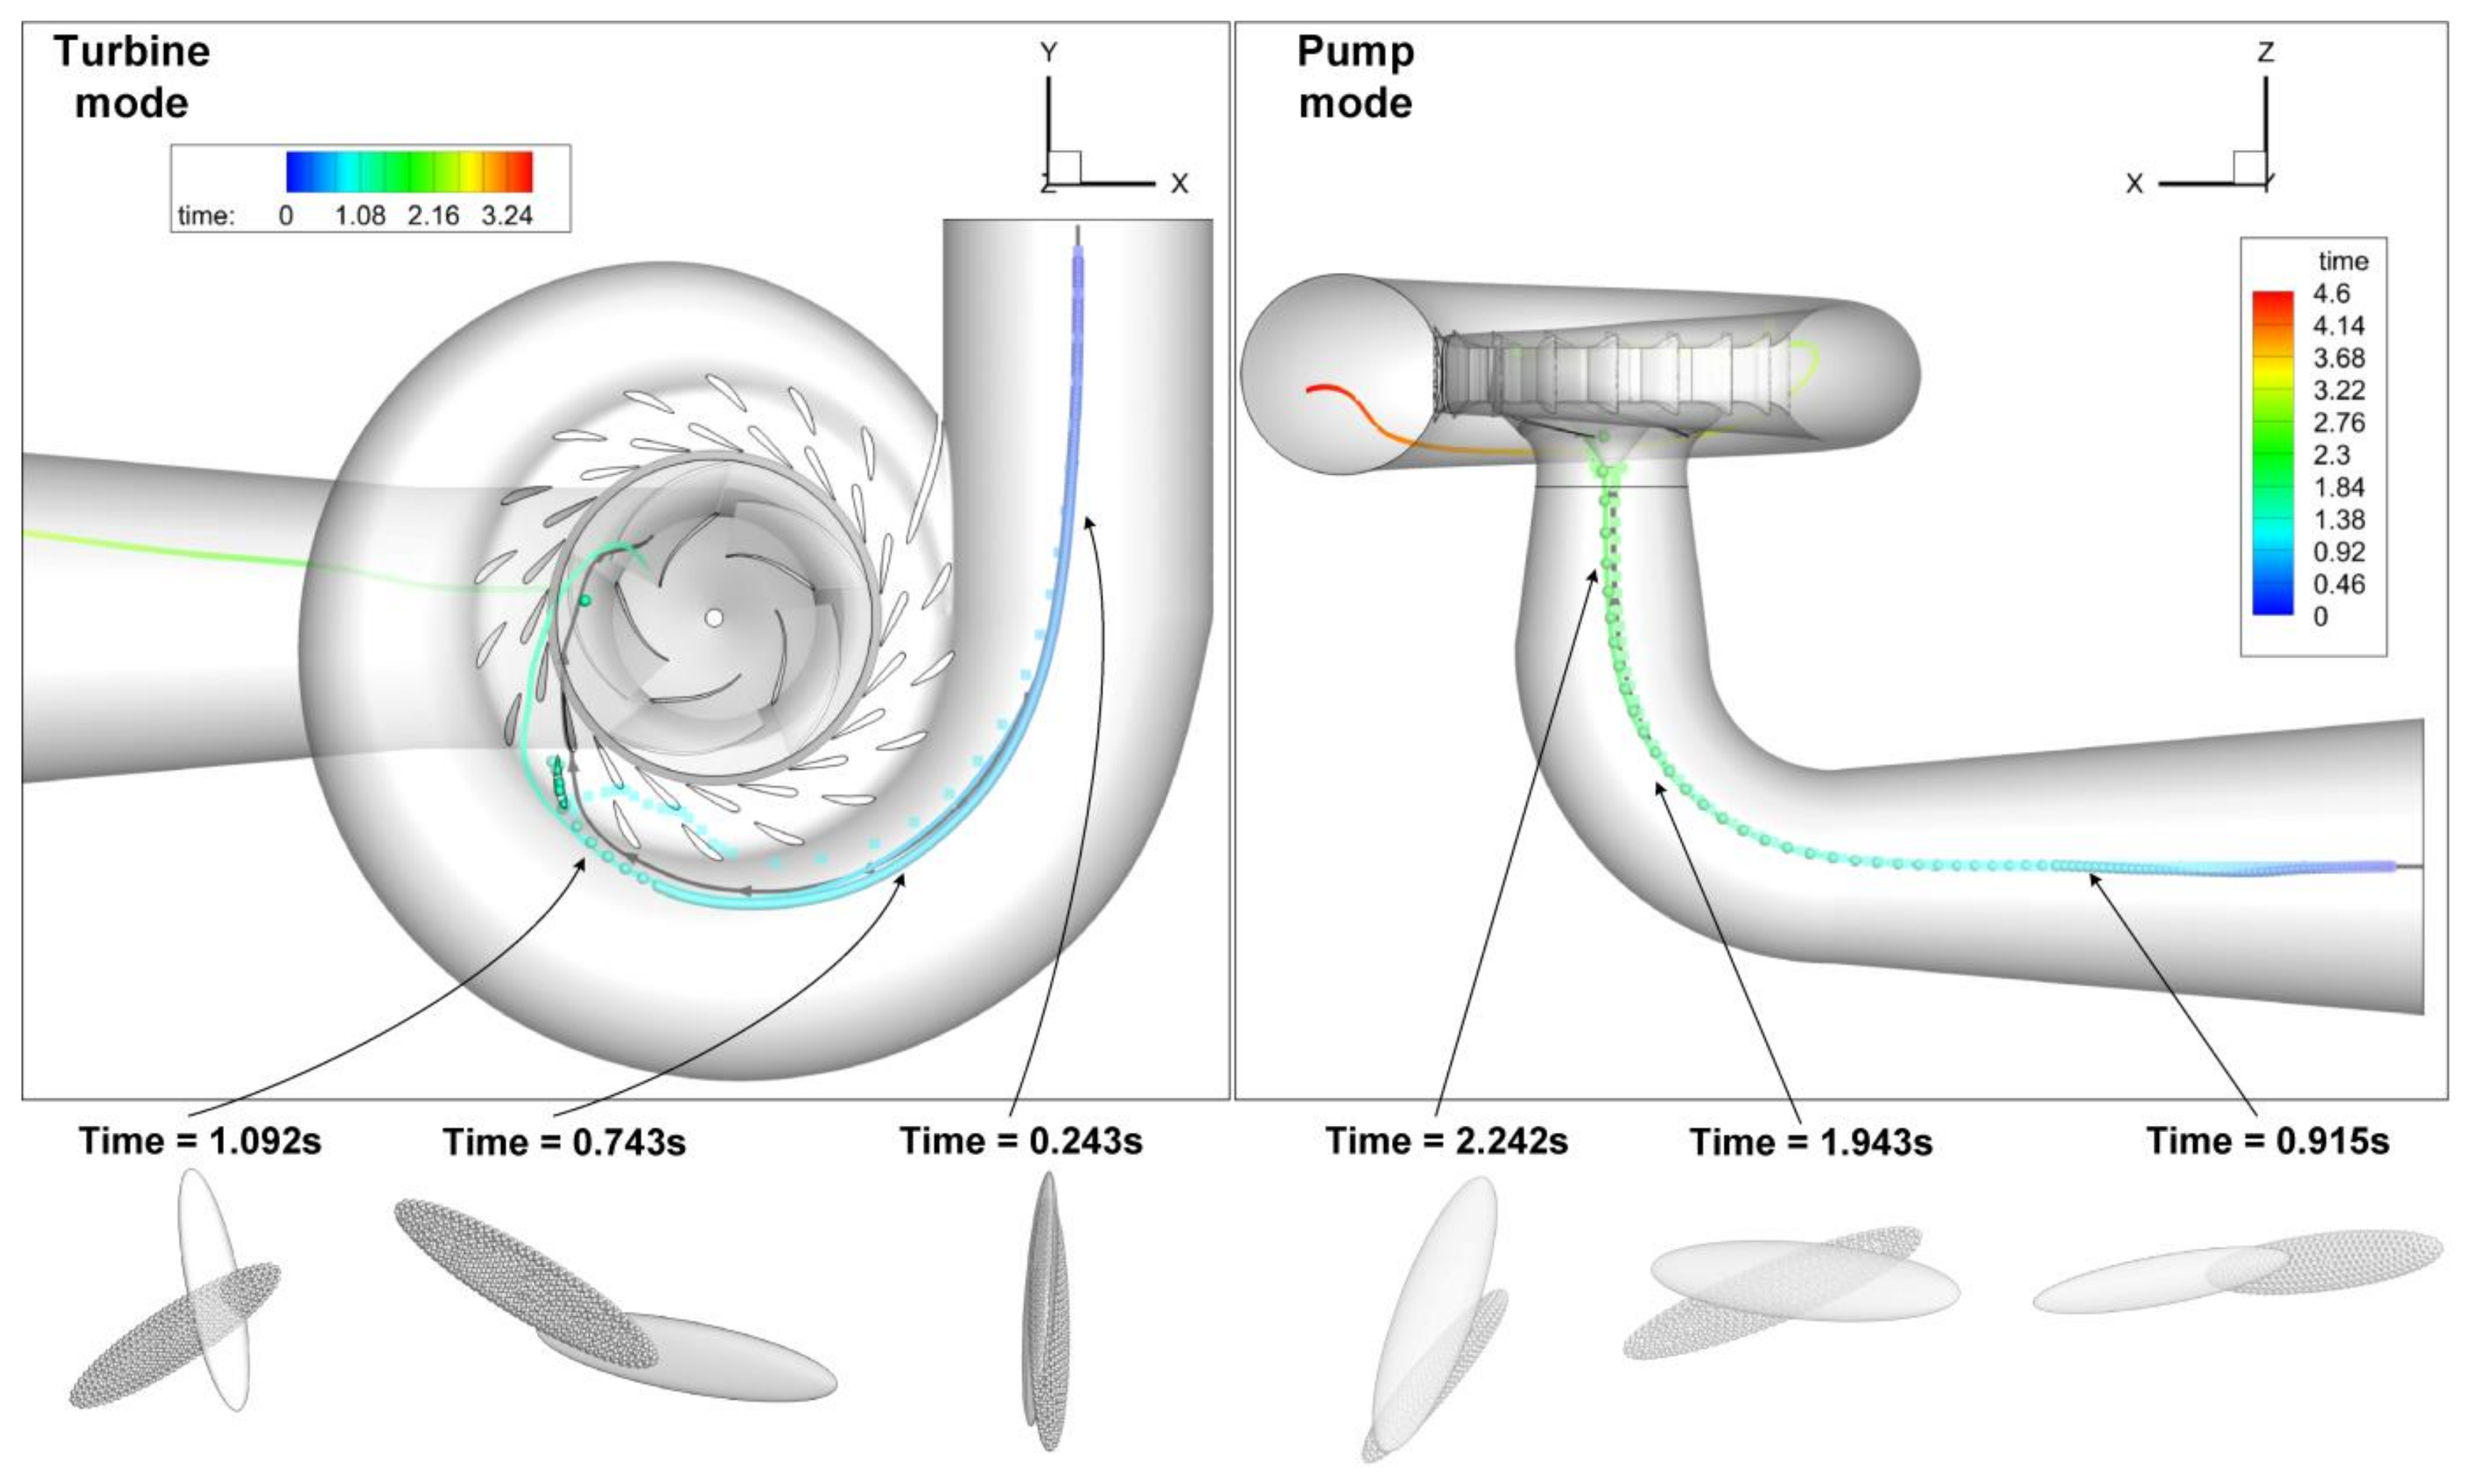
Here we test the different methods discussed in Section 2. As shown in Figure 10, the developed method is effectively equivalent to the much more computationally demanding overset 6-DoF technique, whereas also takes into account boundary collisions. Unsteady particle tracking tends to follow the same path as the two other methods, but can deviate substantially; see for example Figure 10, the Turbine mode. This is justified given that both the particle tracking and streamlines effectively perform a point-like interpolation of flow variables at the center of the equivalent sphere.
To give an indication of the computational cost:
the uncoupled 6-DoF requires ~1–2 h for a single track using a single processor (indicatively Intel i7-3632), while limiting the body motion to 2.5–10% of the max. body dimension per time step for stability, depending on the location in the turbine (lower near the blades, or in vortices, e.g., draft tube in turbine mode).
the unsteady particle tracking requires 1–2 days on a 6-core machine (indicatively Intel i7-8850), depending on the time step used; higher time steps are faster but more prone to no-clipping.
the overset method has an immense computational cost, requiring 3–4 days to reach the runner on a 16-core machine (indicatively Intel Xeon Gold 6140). The simulation was not pursued further, due to lack of the boundary collision algorithm implemented in Fluent v2021, which caused the body to effectively pass through the stator blades and rotor wall, resulting in an unrealistic configuration.
the streamline is trivial to complete, requiring mere seconds; however, it does not consider body motion or rotor rotation.

5. Statistics of Trajectories

The relatively low computational cost of the uncoupled 6-DoF approach allows the observation of multiple tracks, including any boundary collisions. In Figure 11 indicative trajectories of fish at different starting positions are shown, both for turbine and pump operation; the most aggressive collisions are shown, above a threshold force of 100 N (for a reference, hydrodynamic forces are at least 10 times smaller, depending on the location). By analyzing the locations of impact, it was found that:
in turbine mode, 18.75% of tracked fish undergo a rotor blade impact and 43% undergo a stator blade impact, although this is much milder than the rotor impact. Indicatively, stator blade impact is in the order of 100 N, whereas rotor blade impact may be in excess of 400 N.
in pumping mode, 10% of tracked fish undergo a rotor blade impact and 40% a stator blade impact. Here however, the magnitude of impacts is rather comparable, in the order of 100 N, most likely due to the fact that at the inlet section of the runner at pump mode the circumferential velocity is smaller than the turbine mode. As a measure of comparison, the hydrodynamic forces are much smaller, in the order of 1–10 N, depending on the location (higher near/at the runner).
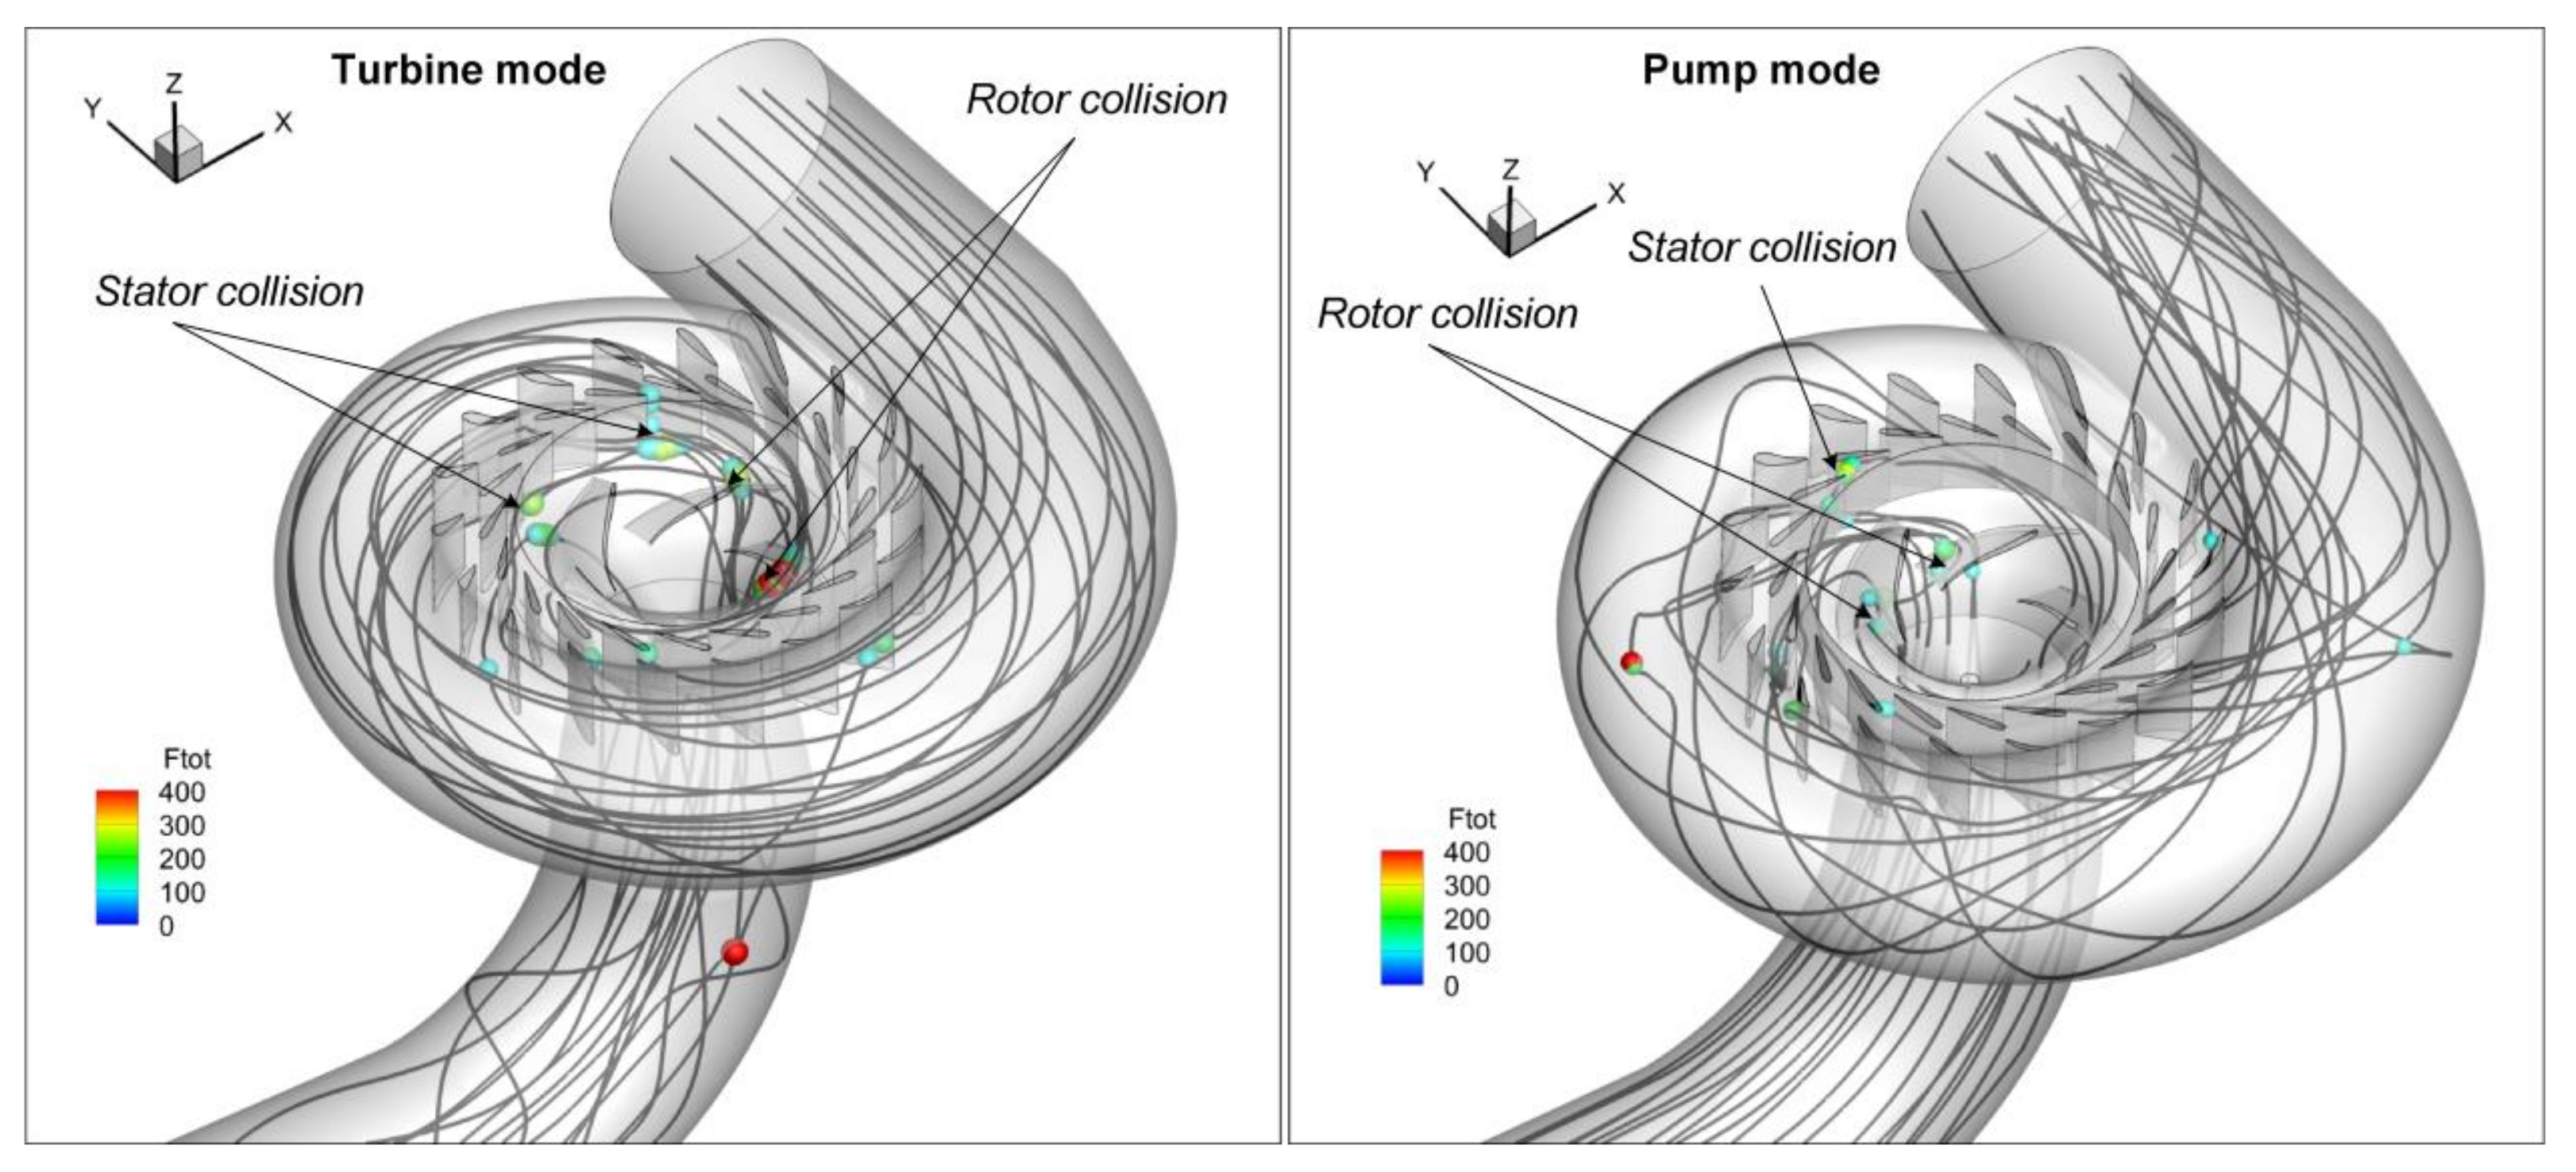
Figure 11. Trajectories and observed collisions of fish for different starting positions, at turbine mode (left) and pumping mode (right).
Energies 16 00810 g011
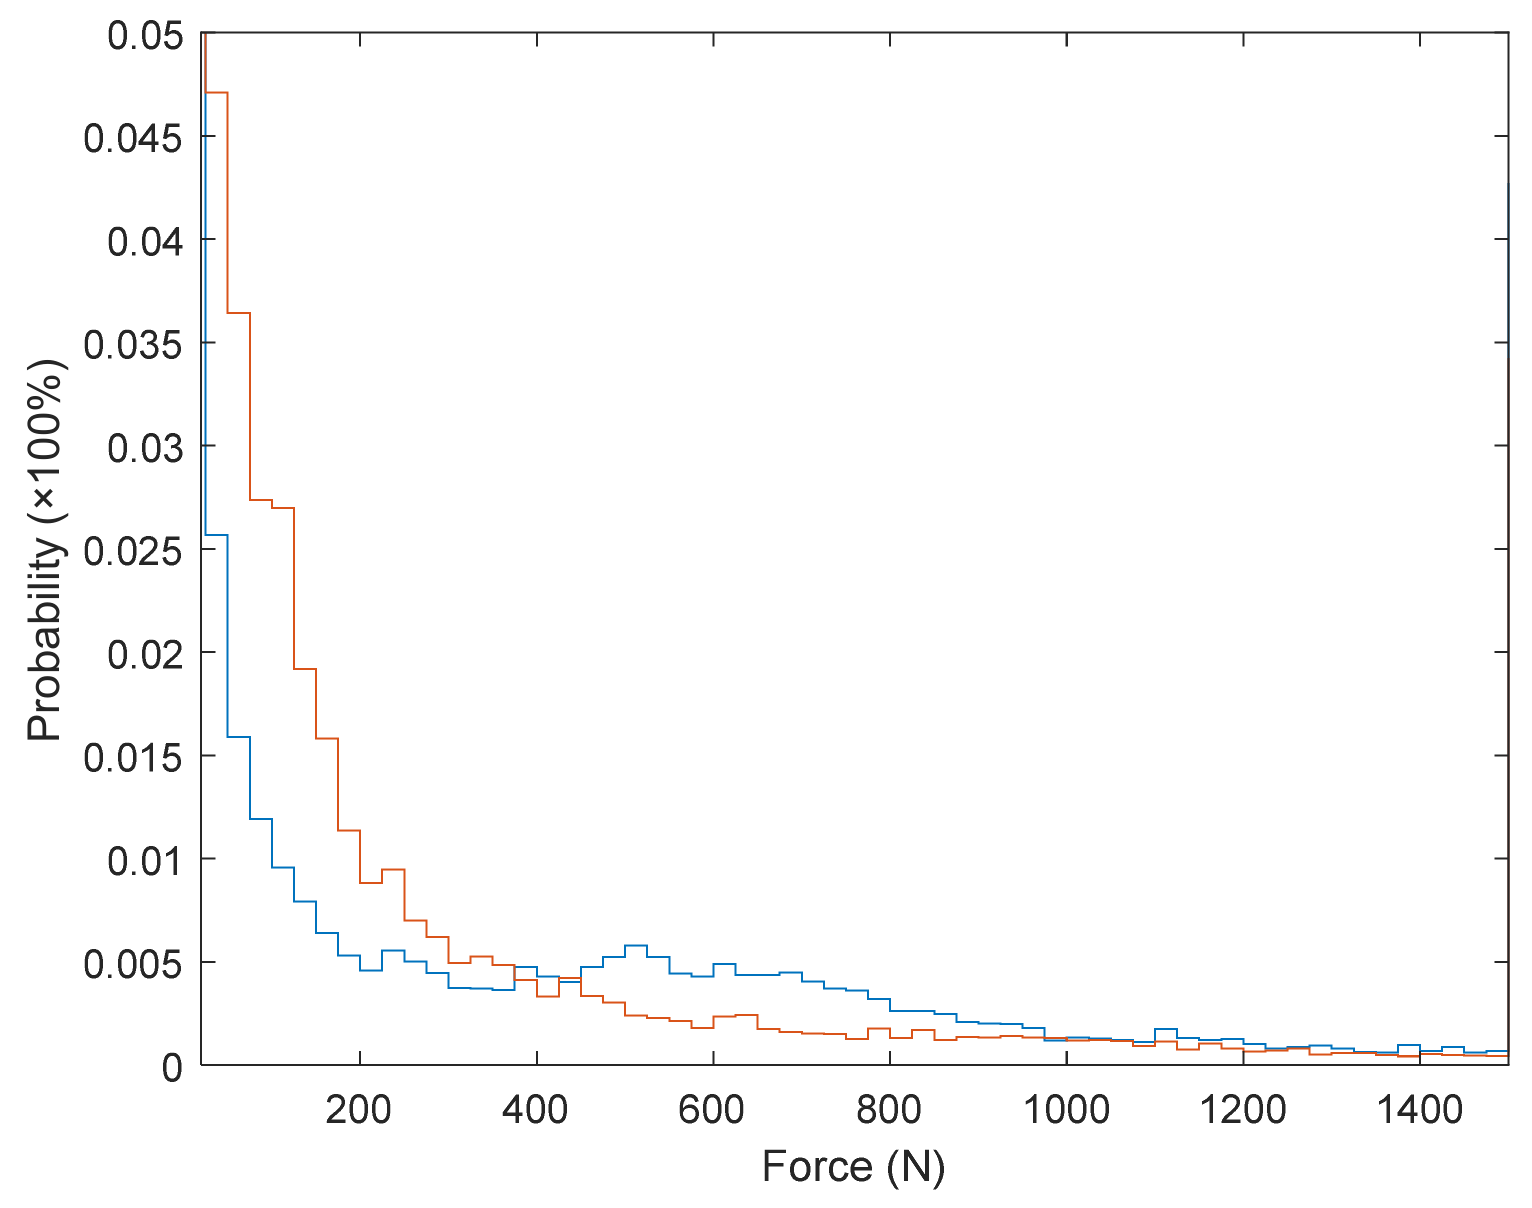
An alternative way to illustrate the above is through a histogram comparing the forces that a passing fish is subjected to, as shown in Figure 12. In this histogram, a comparison of turbine mode and pumping mode operation is shown. Forces between [20, 400] N are much more probable in pumping mode, whereas forces between [400, 1000] N are somewhat more pronounced in turbine mode. However, in the latter case they represent a tiny fraction of samples, nearly 0.5%.
It is also notable that after the interaction with the runner, in the draft tube (in turbine mode) or the casing (in pump mode) the fish is subjected to swirl, often being sheared along the walls. This is on par with previous observations (see, e.g., [11]) stating the necessity to use smooth surfaces to avoid fish descaling and injury.
Potential design modifications could explore the reduction of stator number blades or smoothing thin edges so that the probability of collision, or at least the impact force, with a passing fish is reduced.
Apart from the collision statistics, other information that can be extracted is of the pressure rate of change, which can be an indication of barotrauma. Effectively, in all cases, the pressure change takes place mainly at the rotor part, within 0.2–0.3 s, even if the exact time interval is shifted forward/backward due to variations of the path taken. From the tracks observed (see Figure 13), no path was found to experience low pressures that could potentially justify internal cavitation.
Furthermore, aside from pressure and impact force, it is possible to evaluate localized shear stresses, at least from the flow. Shear stresses can be calculated as [33]:
τ ij = μ e f f u i x j + u j x i
where μeff stands for the effective viscosity, i.e., both the laminar and turbulent contributions, whereas velocity gradients can be calculated over the tracked body surface from the interpolated flow field using the Gauss theorem:
φ = 1 V n φ   n   d S
where φ is a placeholder that can be any velocity component. It is highlighted here that this gradient is based solely on the flow field and not the interaction with the body, as the estimation using fast tracking cannot reproduce boundary layer effects. Nevertheless, it is an indication of the local flow conditions that affect fish passage when considering the maximum of the absolute value of all shear stress components.
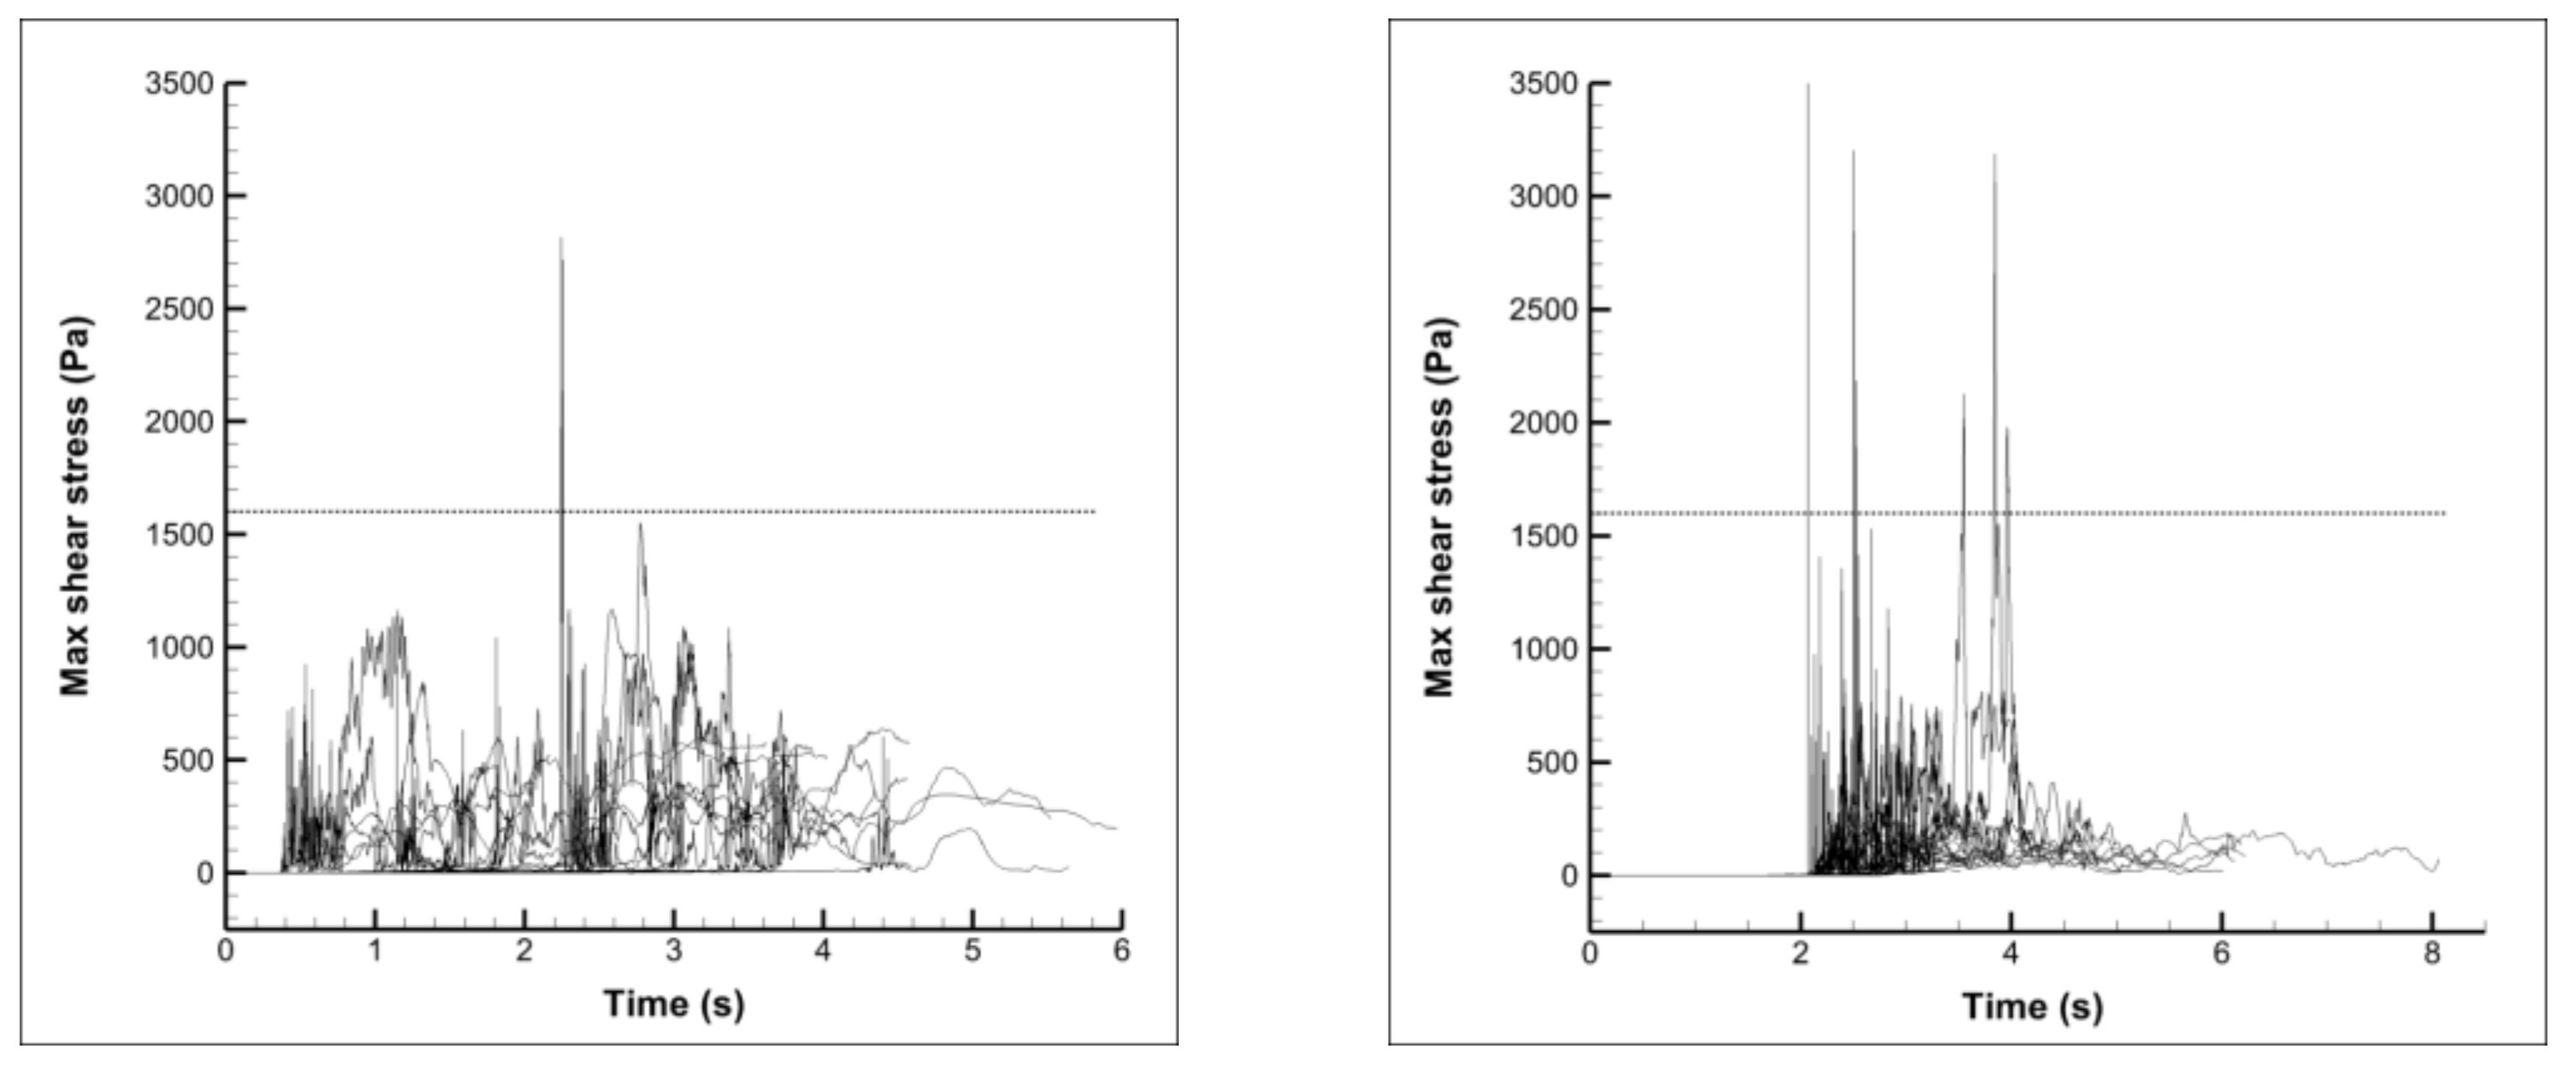
An indicative comparison of the maximum shear stresses experienced by the body as it passes through the turbine/pump is shown in Figure 14. Shear stresses are notably smaller than pressure, with their maximum value being in the order of 5000 Pa at pump mode and 2500 Pa in turbine mode. However, shear damage thresholds are substantially lower; experiments determined a damage threshold at around 1600 Pa for minor injuries (descaling) [13]. Hence, 16% of the fish tracks exceed the minor damage threshold in pump mode, whereas 5% of the fish tracks exceed the minor damage threshold in turbine mode.

6. Conclusions

Given the trend towards increased utilization of unharnessed/unexploited hydraulic potential of water streams, it is expected that hydraulic turbine design should accommodate harmless interaction with aquatic life. Hence, the accurate estimation of the probability of fish passage in hydraulic machines of future hydropower will become another objective along with the efficiency requirements. Consequently, tools that can provide fast and accurate estimations for the design optimization of new fish-friendly pumps and turbines will be of great importance. The present work contributes towards this goal by proposing a method that is fast, flexible and considers the physical dimensions of the tracked body, instead of the simpler point-like perspective commonly used. At the same time it also incorporates collision detection that most commercial CFD software lacks, or such software relies on external coupling with other dedicated software. The proposed uncoupled 6-DoF method has a computational cost reduced by almost two orders of magnitude, while it also offers accuracy comparable to that of more detailed, fully-coupled methods, such as overset or Immersed Boundary 6-DoF. The fast execution of the proposed methodology enabled calculation of statistics, revealing problematic locations where fish collisions take place, while also making predictions of forces and potential damage or lethality. Hence, the present tool can be used alongside optimization methods for designing fish-friendly turbines.

Author Contributions

Conceptualization, P.K. and J.A.; methodology, P.K.; software, P.K.; validation, P.K.; formal analysis, P.K.; investigation, P.K. and J.A.; resources, J.A.; data curation, P.K. and J.A.; writing—original draft preparation, P.K. and J.A.; writing—review and editing, P.K. and J.A.; visualization, P.K.; supervision, J.A.; project administration, J.A.; funding acquisition, P.K. All authors have read and agreed to the published version of the manuscript.

Funding

This research has been co-financed by the European Union and Greek national funds through the Operational Program Competitiveness, Entrepreneurship & Innovation, under the call RESEARCH–CRE-ATE–INNOVATE (T1EDK-01334, 2018–21). Energies 16 00810 i001

Data Availability Statement

Not applicable.

Conflicts of Interest

The authors declare no conflict of interest.

Nomenclature

mMass [kg]
FForce [N]
CdDrag coefficient [-]
ρDensity [kg/m3]
ASurface area [m2]
uVelocity [m/s]
VVolume [m3]
pPressure [Pa]
CVmVirtual mass coefficient [-]
φGeneric interpolated quantity (pressure or velocity here, [m/s] or [Pa])
d, dDistance [m]
wRadial basis function/Linear regression weight (unit dependent on interpolated quantity)
x, rCoordinate vector [m]
nNormal vector [-]
TTorque [N.m]
dSInfinitesimal surface area [m2]
x ¨ Acceleration [m/s2]
RTransformation tensor [-]
φ, θ, ψEuler angles [rad]
ωAngular velocity [rad/s]
ω ˙ Angular acceleration [rad/s2]
IMoment of inertia tensor [kg.m2]
GEuler angular velocity transformation tensor [-]
kspringSpring constant [N/m]
τijShear stress [Pa]
μeffEffective dynamic viscosity [Pa.s]

References

  1. BP, p.l.c.bp Statistical Review of World Energy. 2022. Available online: https://www.bp.com/content/dam/bp/business-sites/en/global/corporate/pdfs/energy-economics/statistical-review/bp-stats-review-2022-full-report.pdf (accessed on 24 November 2022).
  2. IRENA. Renewable Energy Statistics 2022; International Renewable Energy Agency: Abu Dhabi, United Arab Emirates, 2022. [Google Scholar]
  3. Jager, H.I.; De Silva, T.; Uria-Martinez, R.; Pracheil, B.M.; Macknick, J. Shifts in hydropower operation to balance wind and solar will modify effects on aquatic biota. Water Biol. Secur. 2022, 1, 100060. [Google Scholar] [CrossRef]
  4. International Energy Agency. How Rapidly Will the Global Electricity Storage Market Grow by 2026? International Energy Agency: Paris, France, 2021. [Google Scholar]
  5. Killingtveit, Å. 15—Hydroelectric Power; Elsevier Ltd.: Amsterdam, The Netherlands, 2020; ISBN 9780081028865. [Google Scholar]
  6. International Energy Agency. Hydropower; International Energy Agency: Paris, France, 2021. [Google Scholar]
  7. Murdock, H.; Duncan, G.; Thomas, A. Renewables Global Status Report; International Atomic Energy Agency: Vienna, Austria, 2021. [Google Scholar]
  8. Schmutz, S.; Sendzimir, J. Riverine Ecosystem Management; Schmutz, S., Sendzimir, J., Eds.; Springer International Publishing: Cham, Switzerland, 2018; ISBN 978-3-319-73249-7. [Google Scholar]
  9. Gøtske, E.K.; Victoria, M. Future operation of hydropower in Europe under high renewable penetration and climate change. Iscience 2021, 24, 102999. [Google Scholar] [CrossRef] [PubMed]
  10. Sale, M.J.; Cada, G.F.; Carlson, T.J.; Dauble, D.D.; Hunt, R.T.; Sommers, G.L.; Rinehart, B.N.; Flynn, J.V.; Brookshier, P.A. DOE Hydropower Program Annual Report for FY 2001; Idaho National Lab.: Idaho Falls, ID, USA, 2002. [Google Scholar]
  11. Cada, G.F.; Coutant, C.C.; Whitney, R.R. Development of Biological Criteria for the Design of Advanced Hydropower Turbines; EERE Publication and Product Library: Washington, DC, USA, 1997. [Google Scholar]
  12. Brown, R.S.; Pflugrath, B.D.; Colotelo, A.H.; Brauner, C.J.; Carlson, T.J.; Deng, Z.D.; Seaburg, A.G. Pathways of barotrauma in juvenile salmonids exposed to simulated hydroturbine passage: Boyle’s law vs. Henry’s law. Fish. Res. 2012, 121–122, 43–50. [Google Scholar] [CrossRef]
  13. Garrison, L.A.; Fisher, J.R.K.; Sale, M.J.; Cada, G. Application of Biological Design Criteria and Computational Fluid Dynamics to Investigate Fish Survival in Kaplan Turbines. In Proceedings of the HydroVision 2002 Technical Papers, Portland, OR, USA, 29 July–2 August 2002; HCI Publications: Kansas City, MO, USA, 2002. [Google Scholar] [CrossRef]
  14. Fu, T.; Deng, Z.D.; Duncan, J.P.; Zhou, D.; Carlson, T.J.; Johnson, G.E.; Hou, H. Assessing hydraulic conditions through Francis turbines using an autonomous sensor device. Renew. Energy 2016, 99, 1244–1252. [Google Scholar] [CrossRef] [Green Version]
  15. Martinez, J.; Deng, Z.; Titzler, P.; Duncan, J.; Lu, J.; Mueller, R.; Tian, C.; Trumbo, B.; Ahmann, M.; Renholds, J. Hydraulic and biological characterization of a large Kaplan turbine. Renew. Energy 2018, 131, 240–249. [Google Scholar] [CrossRef]
  16. Van Esch, B.; Spierts, I. Validation of a model to predict fish passage mortality in pumping stations. Can. J. Fish. Aquat. Sci. 2014, 71, 1910–1923. [Google Scholar] [CrossRef]
  17. Romero-Gomez, P.; Lang, M.; Michelcic, J.; Weissenberger, S. Particle-based evaluations of fish-friendliness in Kaplan turbine operations. IOP Conf. Series Earth Environ. Sci. 2019, 240, 042016. [Google Scholar] [CrossRef]
  18. Richmond, M.; Romero-Gómez, P. Fish passage through hydropower turbines: Simulating blade strike using the discrete element method. IOP Conf. Series Earth Environ. Sci. 2014, 22, 062010. [Google Scholar] [CrossRef]
  19. Huang, Z.; Cheng, Y.; Wu, J.; Diao, W.; Huai, W. FSI simulation of dynamics of fish passing through a tubular turbine based on the immersed boundary-lattice Boltzmann coupling scheme. J. Hydrodyn. 2022, 34, 135–147. [Google Scholar] [CrossRef]
  20. Kassanos, I.; Alexopoulos, V.; Anagnostopoulos, J. Numerical design methodology for reversible Deriaz turbine with high energy performance and reduced fish impacts. In Proceedings of the IAHR 2022, 31st Symposium on Hydraulic Machinery and Systems, Trondheim, Norway, 26 June–1 July 2022. [Google Scholar] [CrossRef]
  21. ANSYS®. ANSYS Fluent v2021 User Manual, 12.2.1 Equations of Motion for Particles. ANSYS Inc. Available online: https://dl.cfdexperts.net/cfd_resources/Ansys_Documentation/Fluent/Ansys_Fluent_Theory_Guide.pdf (accessed on 24 November 2022).
  22. Sharma, A.; Ananthan, S.; Sitaraman, J.; Thomas, S.; Sprague, M.A. Overset meshes for incompressible flows: On preserving accuracy of underlying discretizations. J. Comput. Phys. 2020, 428, 109987. [Google Scholar] [CrossRef]
  23. Kim, W.; Choi, H. Immersed boundary methods for fluid-structure interaction: A review. Int. J. Heat Fluid Flow 2019, 75, 301–309. [Google Scholar] [CrossRef]
  24. Friedman, J.H.; Bentley, J.L.; Finkel, R.A. An Algorithm for Finding Best Matches in Logarithmic Expected Time. ACM Trans. Math. Softw. 1977, 3, 209–226. [Google Scholar] [CrossRef] [Green Version]
  25. Amidror, I. Scattered data interpolation methods for electronic imaging systems: A survey. J. Electron. Imaging 2002, 11, 157. [Google Scholar] [CrossRef] [Green Version]
  26. Etkin, B. Dynamics of Atmospheric Flight; Dover Publications: Mineola, NY, USA, 2005; ISBN 978-0486445229. [Google Scholar]
  27. Süli, E.; Mayers, D.F. An Introduction to Numerical Analysis; Cambridge University Press: Cambridge, UK, 2003; ISBN 9780521007948. [Google Scholar]
  28. Ozdemir, R. Fish Surface Loft. Available online: https://grabcad.com/library/fish-surface-loft (accessed on 18 March 2022).
  29. Aref, H.; Jones, S.W. Chaotic motion of a solid through ideal fluid. Phys. Fluids A Fluid Dyn. 1993, 5, 3026–3028. [Google Scholar] [CrossRef]
  30. Borisov, A.V.; Mamaev, I.S. On the motion of a heavy rigid body in an ideal fluid with circulation. Chaos Interdiscip. J. Nonlinear Sci. 2006, 16, 13118. [Google Scholar] [CrossRef] [PubMed] [Green Version]
  31. Aref, H. Chaotic advection of fluid particles. Philos. Trans. R. Soc. London. Ser. A Phys. Eng. Sci. 1990, 333, 273–288. [Google Scholar] [CrossRef]
  32. Essmann, E.; Shui, P.; Popinet, S.; Zaleski, S.; Valluri, P.; Govindarajan, R. Chaotic orbits of tumbling ellipsoids. J. Fluid Mech. 2020, 903, A10. [Google Scholar] [CrossRef]
  33. Versteeg, H.K.; Malalasekera, W. An Introduction to Computational Fluid Dynamics: The Finite Volume Method; Pearson Education Limited: London, UK, 2007; ISBN 978-0-13-127498-3. [Google Scholar]
Figure 1. (a) Tessellated surface representation, (b) definition of the slip velocity, projected to the wall normal (c) Torque calculation, in respect to the center of gravity (CG).
Energies 16 00810 g001
Figure 2. The algorithm used for 6-DoF body tracking.
Energies 16 00810 g002
Figure 3. A schematic showing the identification of collisions and the annotations used in Equation (3).
Energies 16 00810 g003
Figure 4. A schematic showing the path of the tracked object through the turbine, colored according to trajectory timing. The magnified inset shows instances before and after the collision at stator blades.
Energies 16 00810 g004
Figure 5. Views of the reversible diagonal turbine, showing details of the design such as the two rows of stator blades, the five-bladed runner and the draft tube.
Energies 16 00810 g005
Figure 6. Top row: the regions of the computational domain, (a,d) the spiral casing, (b,e) the rotor, (c,f) the draft tube. Bottom row: details of the computational mesh. All images correspond to configurations for the sliding mesh approach.
Energies 16 00810 g006
Figure 8. Body trajectories in turbine mode (a) Effect of interpolation method: Inverse distance (continuous line), scatteredInterpolant (filled circles), linear regression (dashed line), nearest neighbor (dotted line), radial basis functions (dashed-dotted line). (b) Effect of resolution: dashed line 500 elements, solid line 1000 elements, dotted line 2000 elements.
Energies 16 00810 g008
Figure 9. Validation of the 6-DoF solver: (a) angular velocities, (b) Euler angles. Points are SIMULINK, dashed lines is the present solver without sub-cycling and continuous lines with sub-cycling.
Energies 16 00810 g009
Figure 10. Comparison of fish tracks predicted with different models. Continuous colored line corresponds to the uncoupled 6-DoF. Spheres are positions predicted with overset 6-DoF (spheres are markers, not the body shape). Squares are positions predicted with unsteady particle tracking. Black line with vectors is a streamline for reference. The bottom row shows the position and orientation predicted by the fast-tracking 6-DoF approach (grey spheres), compared with the surface from overset 6-DoF.
Energies 16 00810 g010
Figure 12. Histogram of force probability for the turbine (blue color) and pump (red color) modes; note forces below 20 N have been clipped, as they represent around 70% probability.
Energies 16 00810 g012
Figure 13. Gauge pressure history for different tracks at turbine mode (left) and pump mode (right). Cavitation threshold is at −98,985 Pa, shown with a dashed line.
Energies 16 00810 g013
Figure 14. Maximum shear stress history for different tracks at turbine mode (left) and pump mode (right). The dotted horizontal line represents the minor injury threshold of 1600 Pa.
Energies 16 00810 g014
Table 1. Formulations of the different interpolation methods used in the scope of the present work. The symbol φ is a placeholder that stands for any interpolated quantity, e.g., velocities (u, v, w), or pressure, p. The symbol, d, denotes the Euclidean norm, or distance, of the location where interpolation is to be carried out from the nearby, i.e., neighboring, sampling points.
Interpolation MethodFormulation
Nearest Neighbor (NN) φ = φ i   if   d i = min ( d , n e i g h b o r s ) (5)
Inverse Distance (ID) φ = N e i g h b o r s φ d N e i g h b o r s 1 d (6)
Radial Basis Functions (RBF) φ = N e i g h b o r s f d i w i
where   f d i = e c R B F d i and weights are: f ( d 11 ) f ( d 12 ) f ( d 1 n ) f ( d 21 ) f ( d 22 ) f ( d 2 n ) f ( d n 1 ) f ( d n 2 ) f ( d n n ) w 1 w 2 w n = φ 1 φ 2 φ n
(7)
Linear Regression (Least Squares) φ = N e i g h b o r s w i x i
where the weight vector is calculated as:
W = X T X 1 X T Y
X = x 1 x 2 x n Y = φ 1 φ 2 φ n
(8)
Disclaimer/Publisher’s Note: The statements, opinions and data contained in all publications are solely those of the individual author(s) and contributor(s) and not of MDPI and/or the editor(s). MDPI and/or the editor(s) disclaim responsibility for any injury to people or property resulting from any ideas, methods, instructions or products referred to in the content.