Article

A Parametric Design Method for the Lighting Environment of a Library Building Based on Building Performance Evaluation

1
School of Architecture, Chang’an University, Xi’an 710061, China
2
Engineering Research Center of Highway Infrastructure Digitalization, Ministry of Education, Xi’an 710061, China
3
School of Architecture, Xi’an University of Architecture and Technology, Xi’an 710055, China
*
Author to whom correspondence should be addressed.
Energies 2023, 16(2), 832; https://doi.org/10.3390/en16020832
Submission received: 30 November 2022 / Revised: 5 January 2023 / Accepted: 8 January 2023 / Published: 11 January 2023
(This article belongs to the Special Issue Building Design, Solar Energy and Thermal Comfort)

Abstract

:
The lighting conditions of a library directly affect the users’ spatial experience, with glass curtain walls being widely used in the design of library skins. Although glass curtain walls have been extensively adopted, they increase indoor sun exposure and glare. Considering sunlight duration and radiation as the design basis, this study employs the Rhino and Grasshopper parametric platforms to parametrically design a library with a dynamic shading skin. Specifically, our design utilizes modular shading components that can change depending on the simulated sunlight data at different times. Additionally, a new optimal design strategy has been developed to enhance the environmental lighting performance of the library. The simulation results highlight that the indoor environmental lighting performance, under dynamic epidermal shading and based on sunlight duration data, is better for east–west, north–south, and east–west orientations on the summer solstice and the winter solstice. Meanwhile, the indoor environmental lighting performance, under dynamic epidermal shading based on daylight radiation data, is better for north–south orientation on the winter solstice. Overall, this study uses parameterization to integrate building simulation and architectural design to improve a building’s lighting performance.

1. Introduction

Green performance has always been the building industry’s focus [1,2,3,4,5], with the building’s environmental lighting performance constituting a necessary part. Several studies have demonstrated that combining sunlight’s benefits to human health with the traditional requirements of visual acuity and comfort can create a healthier and more productive environment [6,7]. The library is a building with high requirements for creating an indoor light environment. An artificial light source cannot compensate for the natural illumination and color rendering properties of sunlight, but the uncertainty of sunlight’s orientation prohibits its ability to provide a stable and comfortable light environment for indoor buildings. Thus, a scientific approach, exploiting effective design methods, is required to fully use complex and changeable natural light and thermal conditions and improve the performance of a building’s light conditions.
The skin of the library building is the main interface between the building and the external environment, incorporating robust functionality and aesthetics. The skin can control the amount of sunlight radiation in the room and improve the indoor environment of light and thermal comfort. Using the appropriate building skin can dynamically balance the indoor daily radiation and natural light, providing powerful conditions for indoor thermal comfort. To date, large glass curtain walls have been widely adopted for library building skins, providing users with a good view but posing certain challenges for the comfort and energy consumption of the indoor natural light environment.
With the development of computer-aided technology, green building performance simulation technology and parametric design tools and methods have been widespread in recent years. Digital technology provides more possibilities for accurately optimizing a building’s performance. In the face of multivariable, multiobjective problems, building skin designs have been optimized based on parametric optimization platforms assisted by powerful computers, currently presenting the best option for improving efficiency and decision-making accuracy. Moreover, parametric optimization platforms provide a new method of performance-based architectural design with broad development prospects.
This study explores the method of using sunshine duration and sunshine radiation data as the basis for the design of building variable skin systems, and verifies the optimization effect of this method on the environmental lighting performance of buildings. This paper aims to propose a parameterized design method to improve a library’s environmental lighting performance, in order to synthesize the evaluation of building performance and design, resolve the contradiction between environmental lighting performance and skin form design in architectural design, and harmonize design logic and library form. The combination of digital design and performance optimization is more conducive to promoting the positive design of a green building and improving building performance.

2. Literature Review

With the continuous innovation of digital technology and architectural design methods, parametric design has become a mainstream building design and optimization solution. Several scholars have summarized and utilized parametric design methods for architectural light environment optimization to obtain a suitable architectural interior light environment. For instance, based on Eltaweel’s review of parametric design and lighting [8,9], we conclude that current works focus on louver design [10,11,12,13], skylight design [14,15,16,17], mass and shadow study [18,19,20], window design [21,22,23,24], façade design [25,26,27,28,29,30,31], and photovoltaic design [32,33,34,35].
It can be found that many scholars concentrate on a building façade skin’s ability to optimize the indoor light environment of buildings. In the context of parametric design, compared with traditional building skin, dynamic skin is more conducive to comprehensive performance optimization, not only with regard to the light environment. At present, most scholars employ the Grasshopper platform and its associated plug-ins for the parametric design of dynamic skins. The selected representative research papers about building façades are summarized in Table 1.
According to Table 1 and related references in the literature review, Grasshopper has been widely used in the optimization of the design of building skin for environmental lighting. This method has become a recognized and reliable design and verification method. By comparing the types of buildings studied in the table, it can be seen that, at present, most relevant researches focus on office buildings and there are few researches on campus library buildings. In the literature, there is a particular lack of studies on combining light environment and design of campus library buildings based on China’s climate characteristics.
In recent years, the combination of parametric skin and artificial intelligence algorithm is also one of the rising research hotspots [41,42,43]. Among these hotspots, performance-based design (PBD) draws the attention of scholars because it meets the comprehensive requirements of buildings for light, heat, energy consumption, vision, comfort, and other aspects. Sariyildiz [44] proposed performative computational architecture (PCA) to support the PBD process, including shape-finding parameters, performance objectives and optimization. In the architectural design optimization stage, metaheuristics is one of the most widely used optimization methods [45,46,47], of which the two most powerful optimization methods are swarm intelligence (SI) and evolutionary computing (EC). SI uses an intelligent multiagent system inspired by social group behavior [48]. On the contrary, the program used by EC is inspired by the biological evolution of Darwin’s theory [49]. Berk Ekici et al. [42] reviewed 100 articles and pointed out that EC was the main optimization method used in review papers, and the most common PCA research topic was the building’s skin.
At present, use of a multiobjective optimization engine combined with the Grasshopper platform and a genetic algorithm is relatively common in the design and research of this field [36]. Jalali et al. [50] used the multiobjective optimization of the strength Pareto evolutionary algorithm 2 (SPEA2) algorithm to provide the amount of solar radiation received by the building envelope, as well as the effective interior space and design shape factor based on the cooling load, heat load, and natural light provided to the building, to optimize the building façade. Ellika et al. [51] proposed a multiobjective optimization method to improve the performance of photovoltaic shading devices. This method combines parametric design with genetic optimization to maximize the use of solar energy while reducing indoor energy demand. In other studies, GhCPython and other tools were used to realize the data exchange between the Grasshopper platform, based on the Python language and MATLAB (based, in turn, on other programming languages), and other algorithms, such as BCMO (balance composite motion optimization), were used for optimization design and to determine the optimal opening and closing state of the skin [52].
For large-scale façade optimization research, Ekici B et al. [53,54] have shown how multizone optimization (MUZO) can cope with an enormous number of parameters to optimize the entire design of high-rise buildings using three algorithms with an adaptive penalty function. In their study, satisfactory results were reported for the optimization part of MUZO methodology regarding spatial daylight autonomy and annual sunlight exposure, meeting LEED standards in 19 of 20 optimization problems. Weng ZZ et al. [55] have presented a practical methodology for optimizing complex building façades and internal layouts. The optimization performed in this paper was implicitly multiobjective (i.e., minimizing heating, cooling, and artificial lighting energy), yet the authors have treated it as single-objective.
In actual building projects, there are still some improvements based on algorithm optimization. First of all, a building design using an optimization algorithm can achieve the goal of automatic optimization, but it depends greatly on the accuracy of numerical simulation and the reasonable setting of parameters. Secondly, current building design using an optimization algorithm needs to consume a large amount of computing resources. In practical projects, using this method for practical problems should consider the architect’s own knowledge/skill reserves and computing costs. Third, at present, building design based on an optimization algorithm cannot be combined effectively with the design methods and habits of architects, especially in the aspects of humanistic aesthetics. To sum up, we suggest that architects can choose appropriate design methods according to their own capabilities and the characteristics of the project at hand.
Reviewing several existing studies reveals that the building skin, as the interface separating indoor and outdoor space, is a critical part of the design’s ability to optimize the performance of the building’s light environment. Dynamic building skins combine active and passive energy-saving techniques in a complementary way. Nevertheless, with the rapid development of computer simulation technology and parametric design, these methods can better improve the comfort of the interior lighting environment, optimize building performance, decrease the use of mechanical and electrical systems, and achieve energy saving and emission reduction. The building’s skin form, the design of interactive systems, and the simulation of building performance are currently hot research topics.
Dynamic skins have already been used to optimize the light environment of buildings. The Al Bahar Tower in Abu Dhabi has a triangular layer of sunshades on its exterior that changes shape according to different light conditions, thereby reducing the building’s heat absorption [28]. Additionally, the Barcelona Media-ICT building uses the ETFE air pillow as the curtain wall. The plating points on the ETFE air pillow can adjust and control the sunlight entering the building to optimize the indoor light environment [36].
Regarding optimizing the performance of a building’s light environment, the literature offers numerous works accommodated by engineering practice for dynamic, parametric skin design methods. However, in the existing theoretical research, many works on dynamic skins explore the optimal solution set utilizing genetic algorithms, which do not directly make full use of natural light and heat conditions. Moreover, dynamic skin cells are usually analyzed and modeled as uniform variations. To avoid overly complex operations, building models are typically reduced to a system of individual square rooms [27,28,29,30,31,32,33,34,35]. However, public buildings are much more varied in shape, and many library buildings also adopt curved or even irregular façade designs. Given these complex building forms, the current dynamic skin design methods, based on genetic algorithms, pose certain limitations and require more time to determine the optimal solution. Therefore, it is worth investigating dynamic skin design methods that meet the current design trends, are faster, and maximize the natural light and heat conditions.

3. Research Method

Based on [37], this study proposes a parametric design method for the light environment of library buildings and selects for validation two special dates, the winter solstice and the summer solstice. This research considers a circular university library building as an example to explore the feasibility of the proposed design method. The library building is located in Xi’an, Shaanxi Province, China, and is a landmark located at the center of the campus. The building is circular, with a radius of 90 m, covering an area of about 25,000 m2, and the total construction area of the library is about 15,600 m2, with a building height of 20.4 m. Although the developed design method applies to more complex building forms, the building used as an example still meets the requirements of this research (Figure 1).
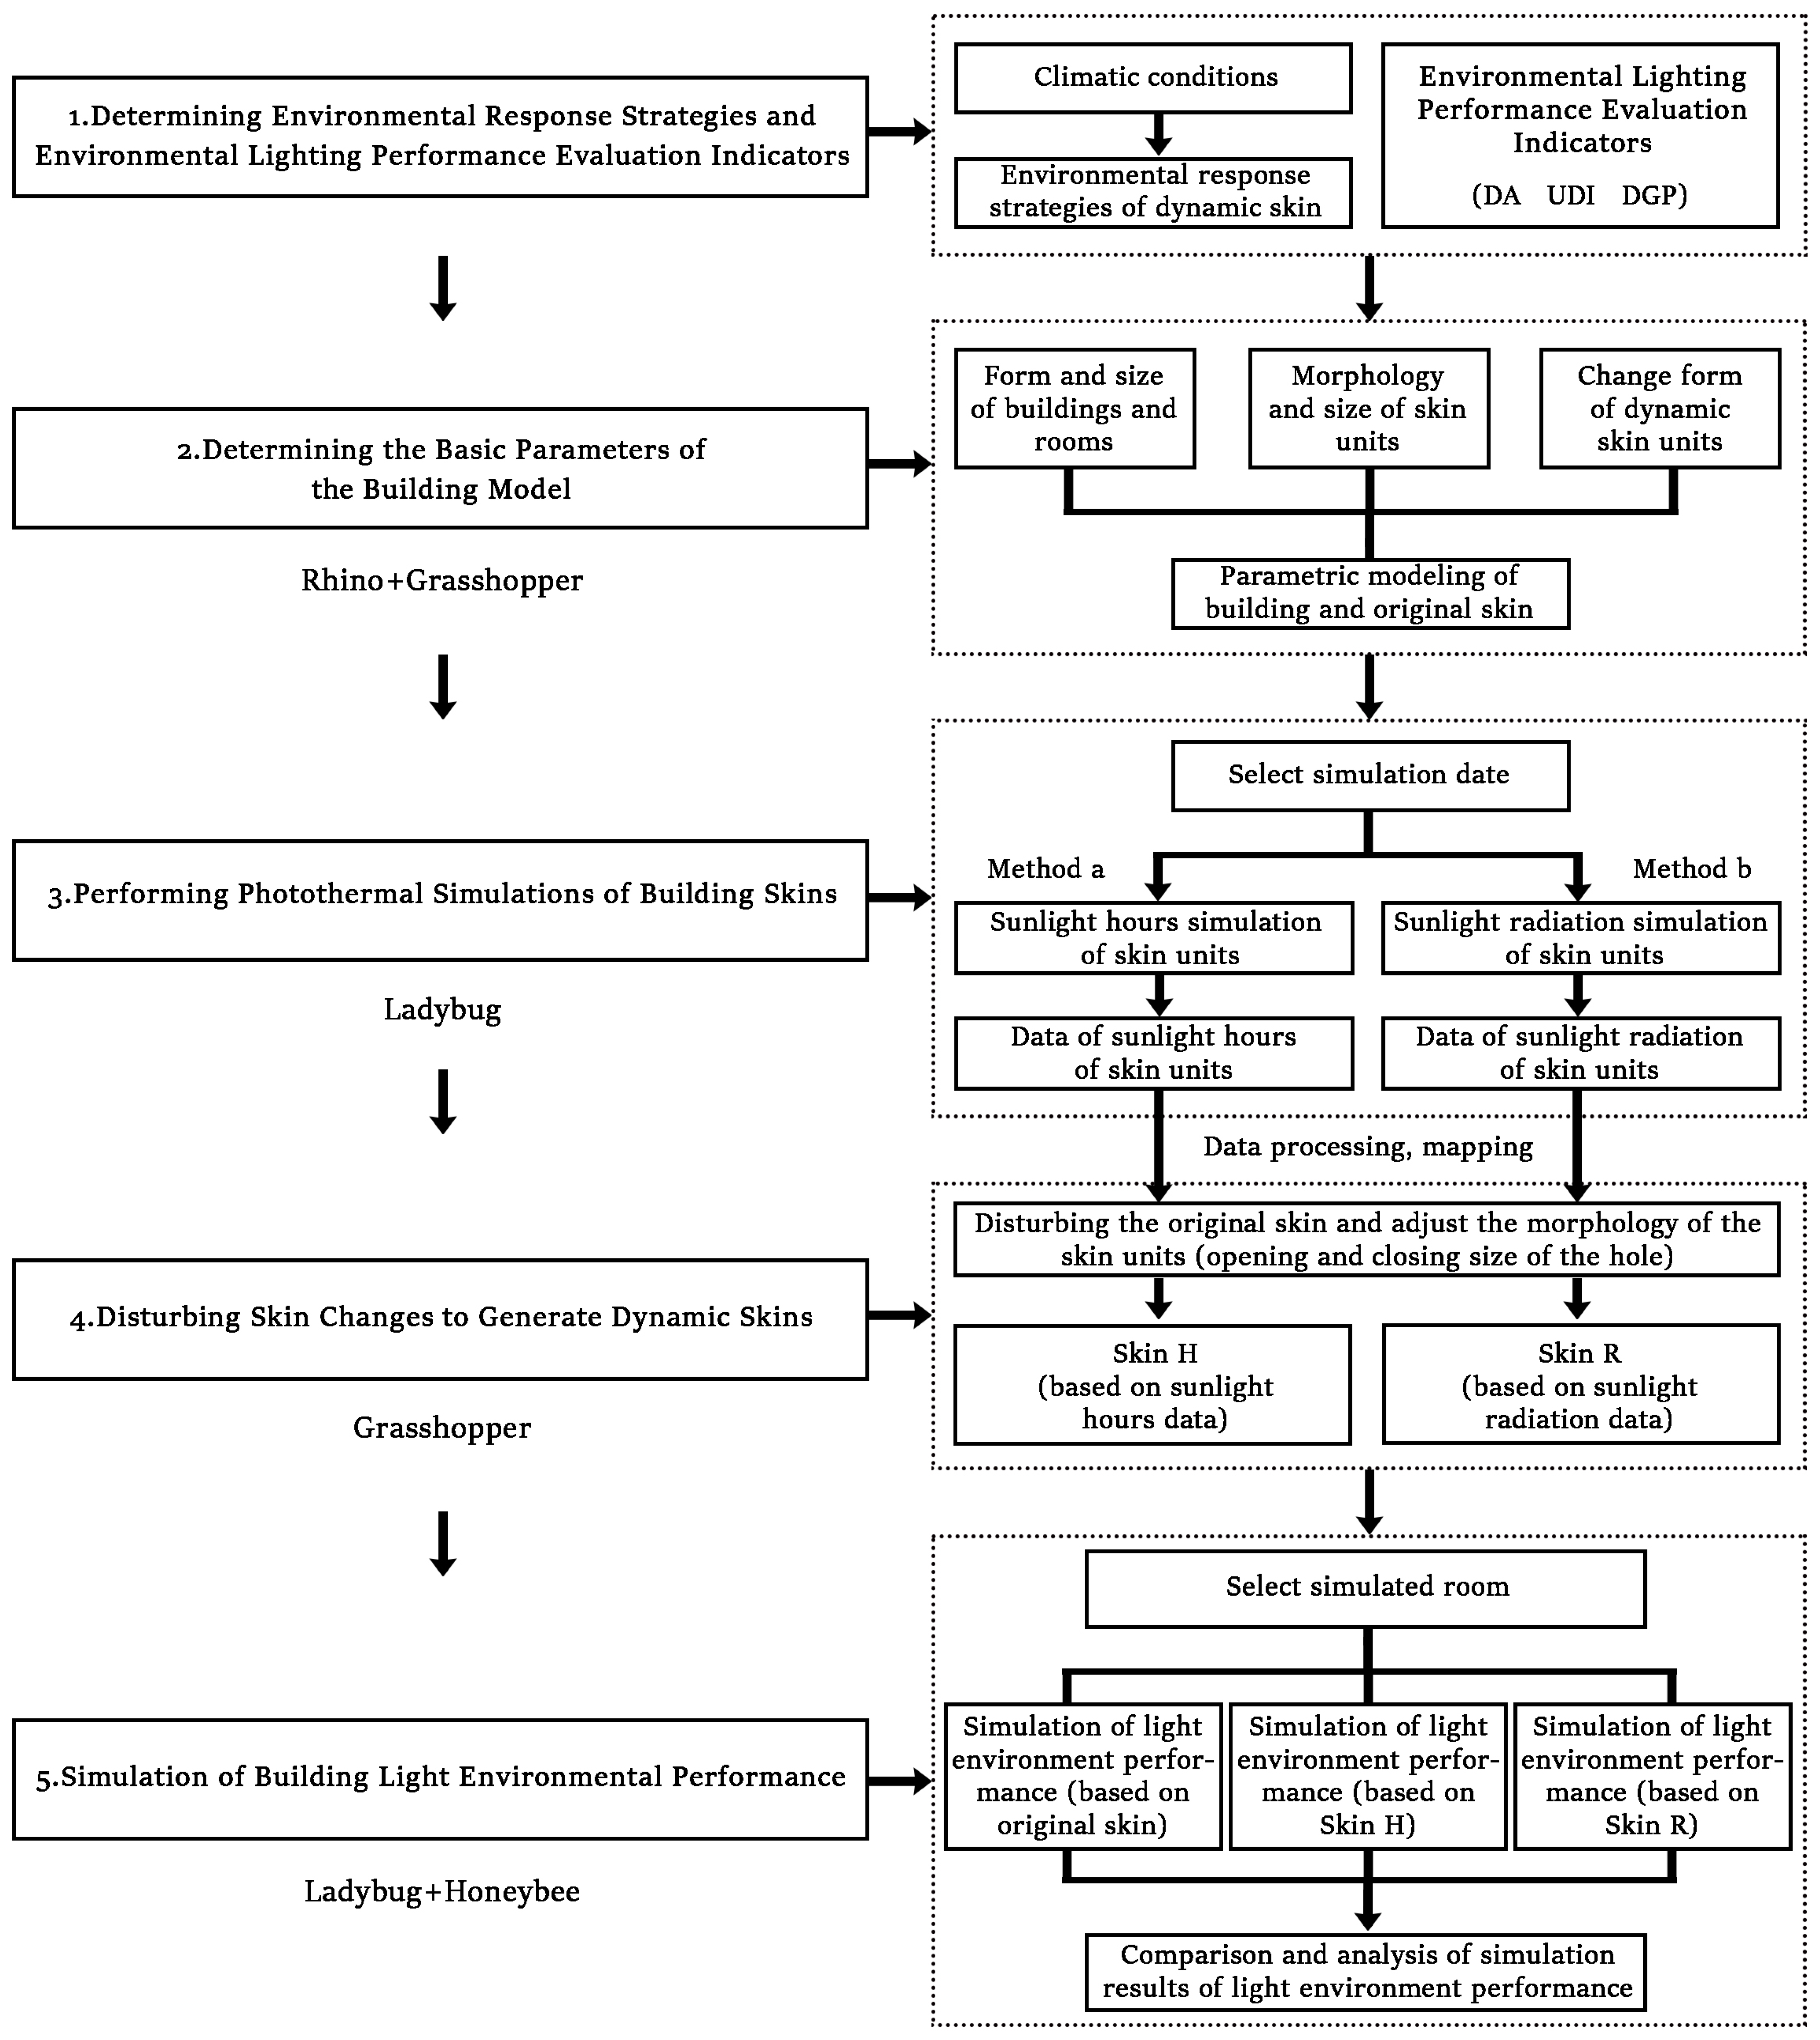
The building’s generated dynamic skin performance, based on natural photothermal conditions, was analyzed using the Ladybug Tools software. The software was used to simulate and analyze the light performance of the building and, finally, to evaluate the design method. Natural photothermal conditions refer to two parameters: sunlight hours and sunlight radiation. These parameters control the change of building skin units and the effect and difference of the dynamic building skin on the interior light environment (Figure 2).
Based on the sunshine duration and sunshine radiation as influencing factors controlling the change of building skin units, respectively, this study discusses the improvement effect and difference of dynamic building skin on indoor light environment under the influence of these two parameters. Compared to traditional architectural design methods, this study uses parametric workflow to directly support the design of library building skin generation. The indoor light environment quality, dynamic skin state, and seasonal outdoor sunshine conditions are correlated to determine a dynamic building skin design that can effectively respond to changes in the light environment. This parameterized, dynamic skin is more changeable [56], more adaptable to seasonal climates, and possesses the characteristics and convenience of modular assembly.

3.1. Determining Environmental Response Strategies and Environmental Lighting Performance Evaluation Indicators

The library used in this study is located in Xi’an, which has a warm temperate semi-humid continental monsoon climate with four distinct seasons. The average annual temperature is 13.1–14.3 °C, with the coldest month, January, averaging −1.2–0.5 °C, and the hottest, July, averaging 26.5–27.0 °C. The annual sunshine hours range from 1595.6 to 2035.8 h [43]. By importing the EPW meteorological data file into the Ladybug Tools platform, we visualized the regional meteorological data of the subject building in the form of graphs such as the dry bulb temperature graph (Figure 3) and the relative humidity graph. The annual sunshine hours in Xi’an (1661 h) are derived from the EPW file, which matches the actual situation to a high degree.
Based on the regional climatic conditions, we developed the following environmental response strategy for the dynamic building skin in order to optimize the light environment for each season and to prevent, specifically during summer, excessive heat and light. In winter, the strategy focuses on shading and protection from the sun, preventing glare, and balancing shading and heat storage; during spring and autumn, the strategy focuses on shading, protection from the sun, and preventing glare (Table 2).
This study refers to the relevant standards of LEED V4 (Leadership in Energy and Environmental Design) [57] and China’s Standard for Building Daylighting Design (GB50033-2013) [58]. Currently, daylight autonomy (DA), useful daylight illuminance (UDI), and daylight glare probability (DGP) are three commonly recognized indicators to evaluate indoor light environment performance, with their comfort value ranges reported in Table 3.

3.2. Determining the Basic Parameters of the Building Model

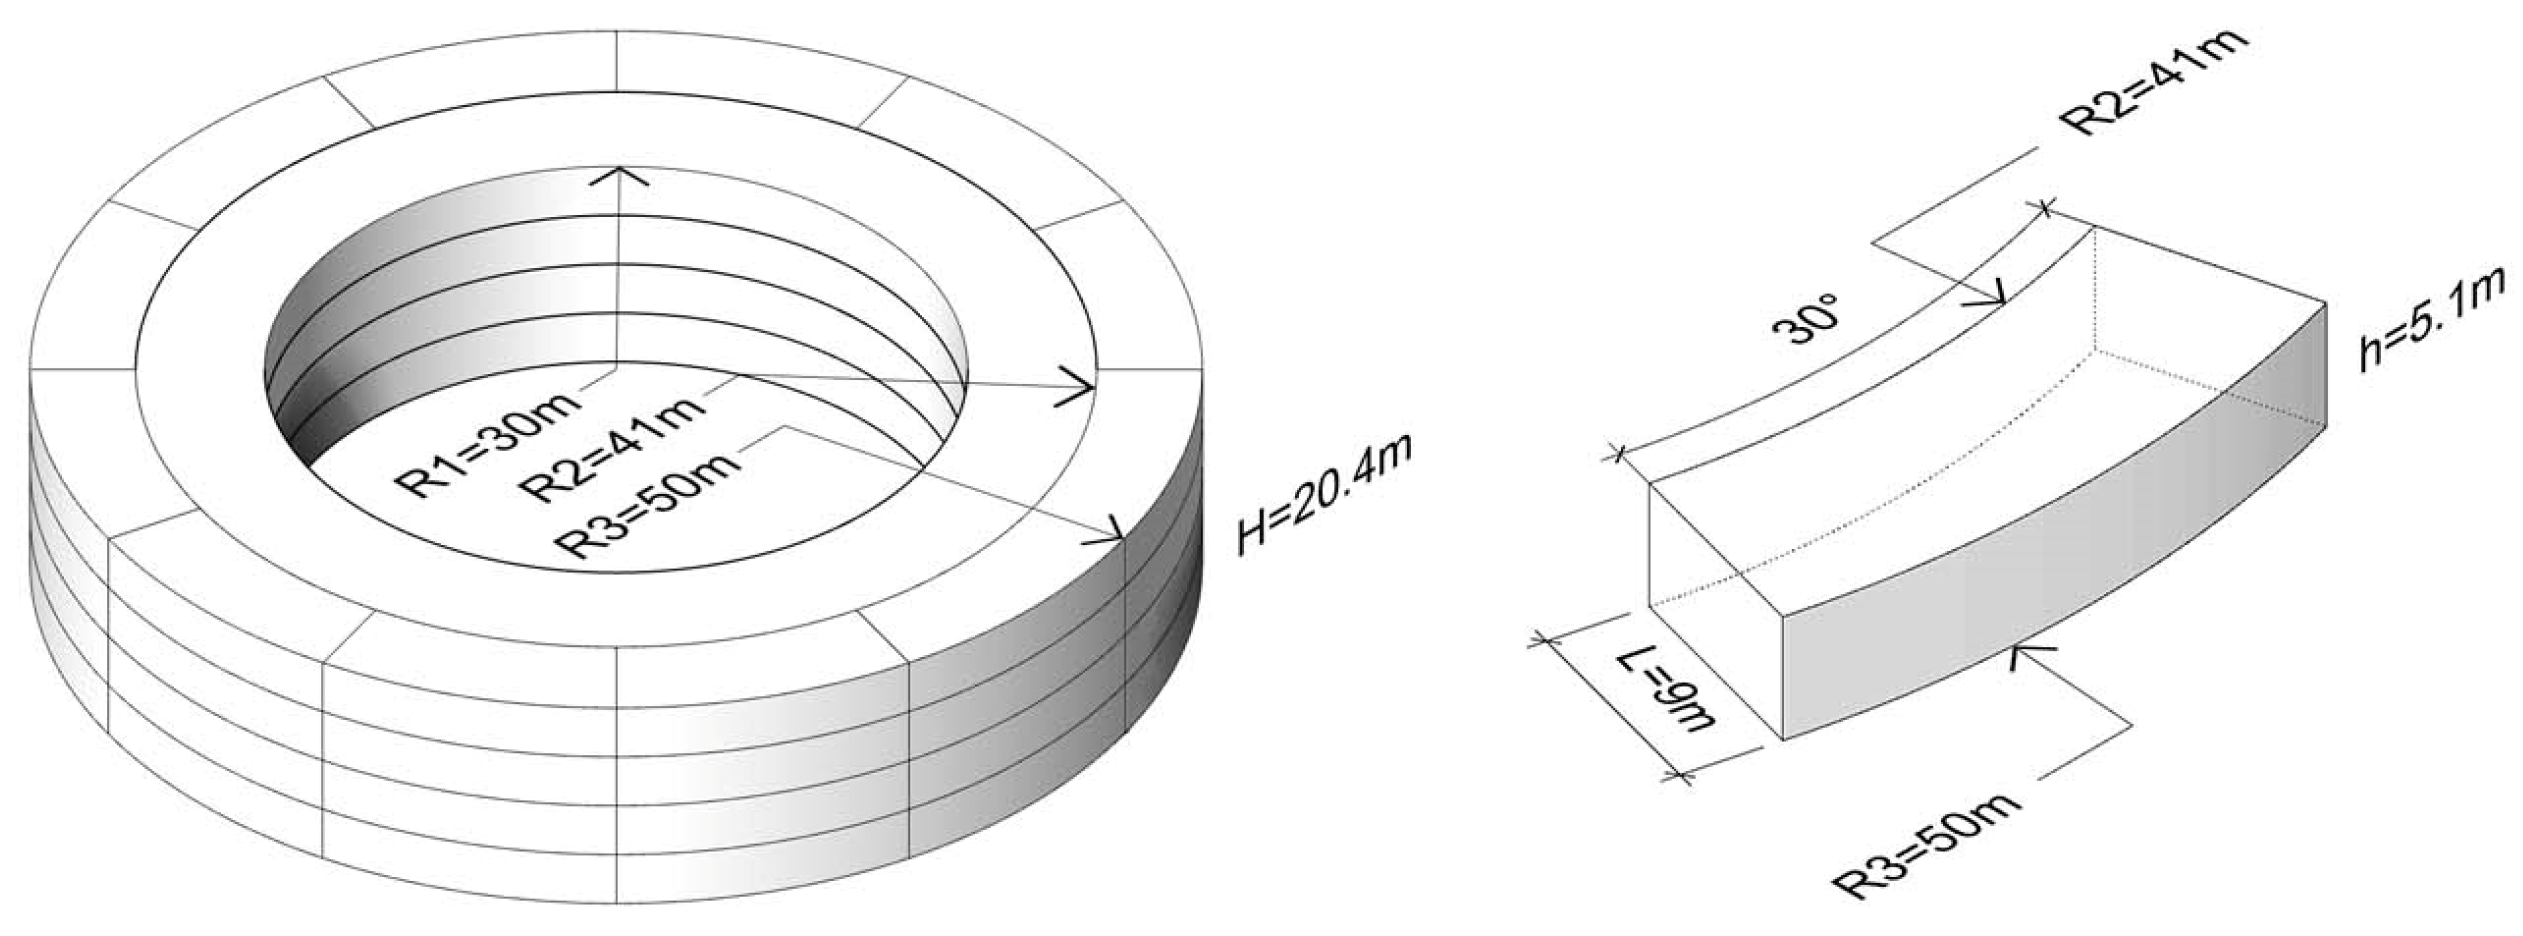
For the building mode, first, through simplification and unification, the building volume is set as a circular volume with an inner diameter of R1 = 30 m and an outer diameter of R3 = 50 m. The building is 4 stories high, with a floor height of 5.1 m and a total height of H = 20.4 m. The interior rooms are simplified into a ring-shaped traffic space with reading room units of the same size, with an inner diameter of R1 = 30 m and an outer diameter of R2 = 41 m. There are 12 reading room units on each floor, with a fan ring shape, possessing a circular angle of 30°, an inner radius of R2 = 41 m, and an outer radius of R3 = 50 m. The depth of the reading room units are L = 9 m, and their floor height is h = 5.1 m. (Figure 4).
Based on the building form and design concept, the Grasshopper software parametrically models the irregular building skin. The triangular skin unit module divides the building skin because it better shapes the building form. The triangles form a complete skin system through repeated arrays in both the vertical and horizontal directions. Figure 5 illustrates the parametric skin creation process, and Figure 6 depicts the results of the parametric skin form generation. The material used for the building skin units is a tensionable PTFE translucent membrane and each skin unit can be controlled individually.
The idea of dynamic building skins that regulate the light environment involves regulating environmental factors such as daylight radiation, direct light, and diffuse light by the movement of the skins’ units. This regulates the indoor light environment and reduces the energy consumption of the building operation. The skin unit typically comprises a combination of fixed and variable points and edges, which are changed based on sliding, retracting, and rotating motions.
This study’s triangular skin cell structure is illustrated in Figure 7, where points A, B, and C are fixed, and D, E, and F are variable. Moreover, a, b, and c are fixed edges, and d, e, f, g, h, and i are variable edges enclosing three quadrilateral shapes with embedded tensioning membranes. The triangle formed by points D, E, and F is the aperture. By controlling the expansion and contraction of the variable edge within the skin unit and the tensioning of the membrane, the size of the opening and closing of the aperture in the skin unit is controlled, thus controlling the amount of light entering the room.
Dynamic building skins typically have a certain control cycle, responding primarily to seasonal changes, date changes, diurnal changes, and real-time control. To simplify this study and consider the effectiveness and difficulty of controlling the skin, this study considers a 24-h control period for the skin unit, i.e., an optimization control according to the date of the change.

3.3. Performing Photothermal Simulations of Building Skins

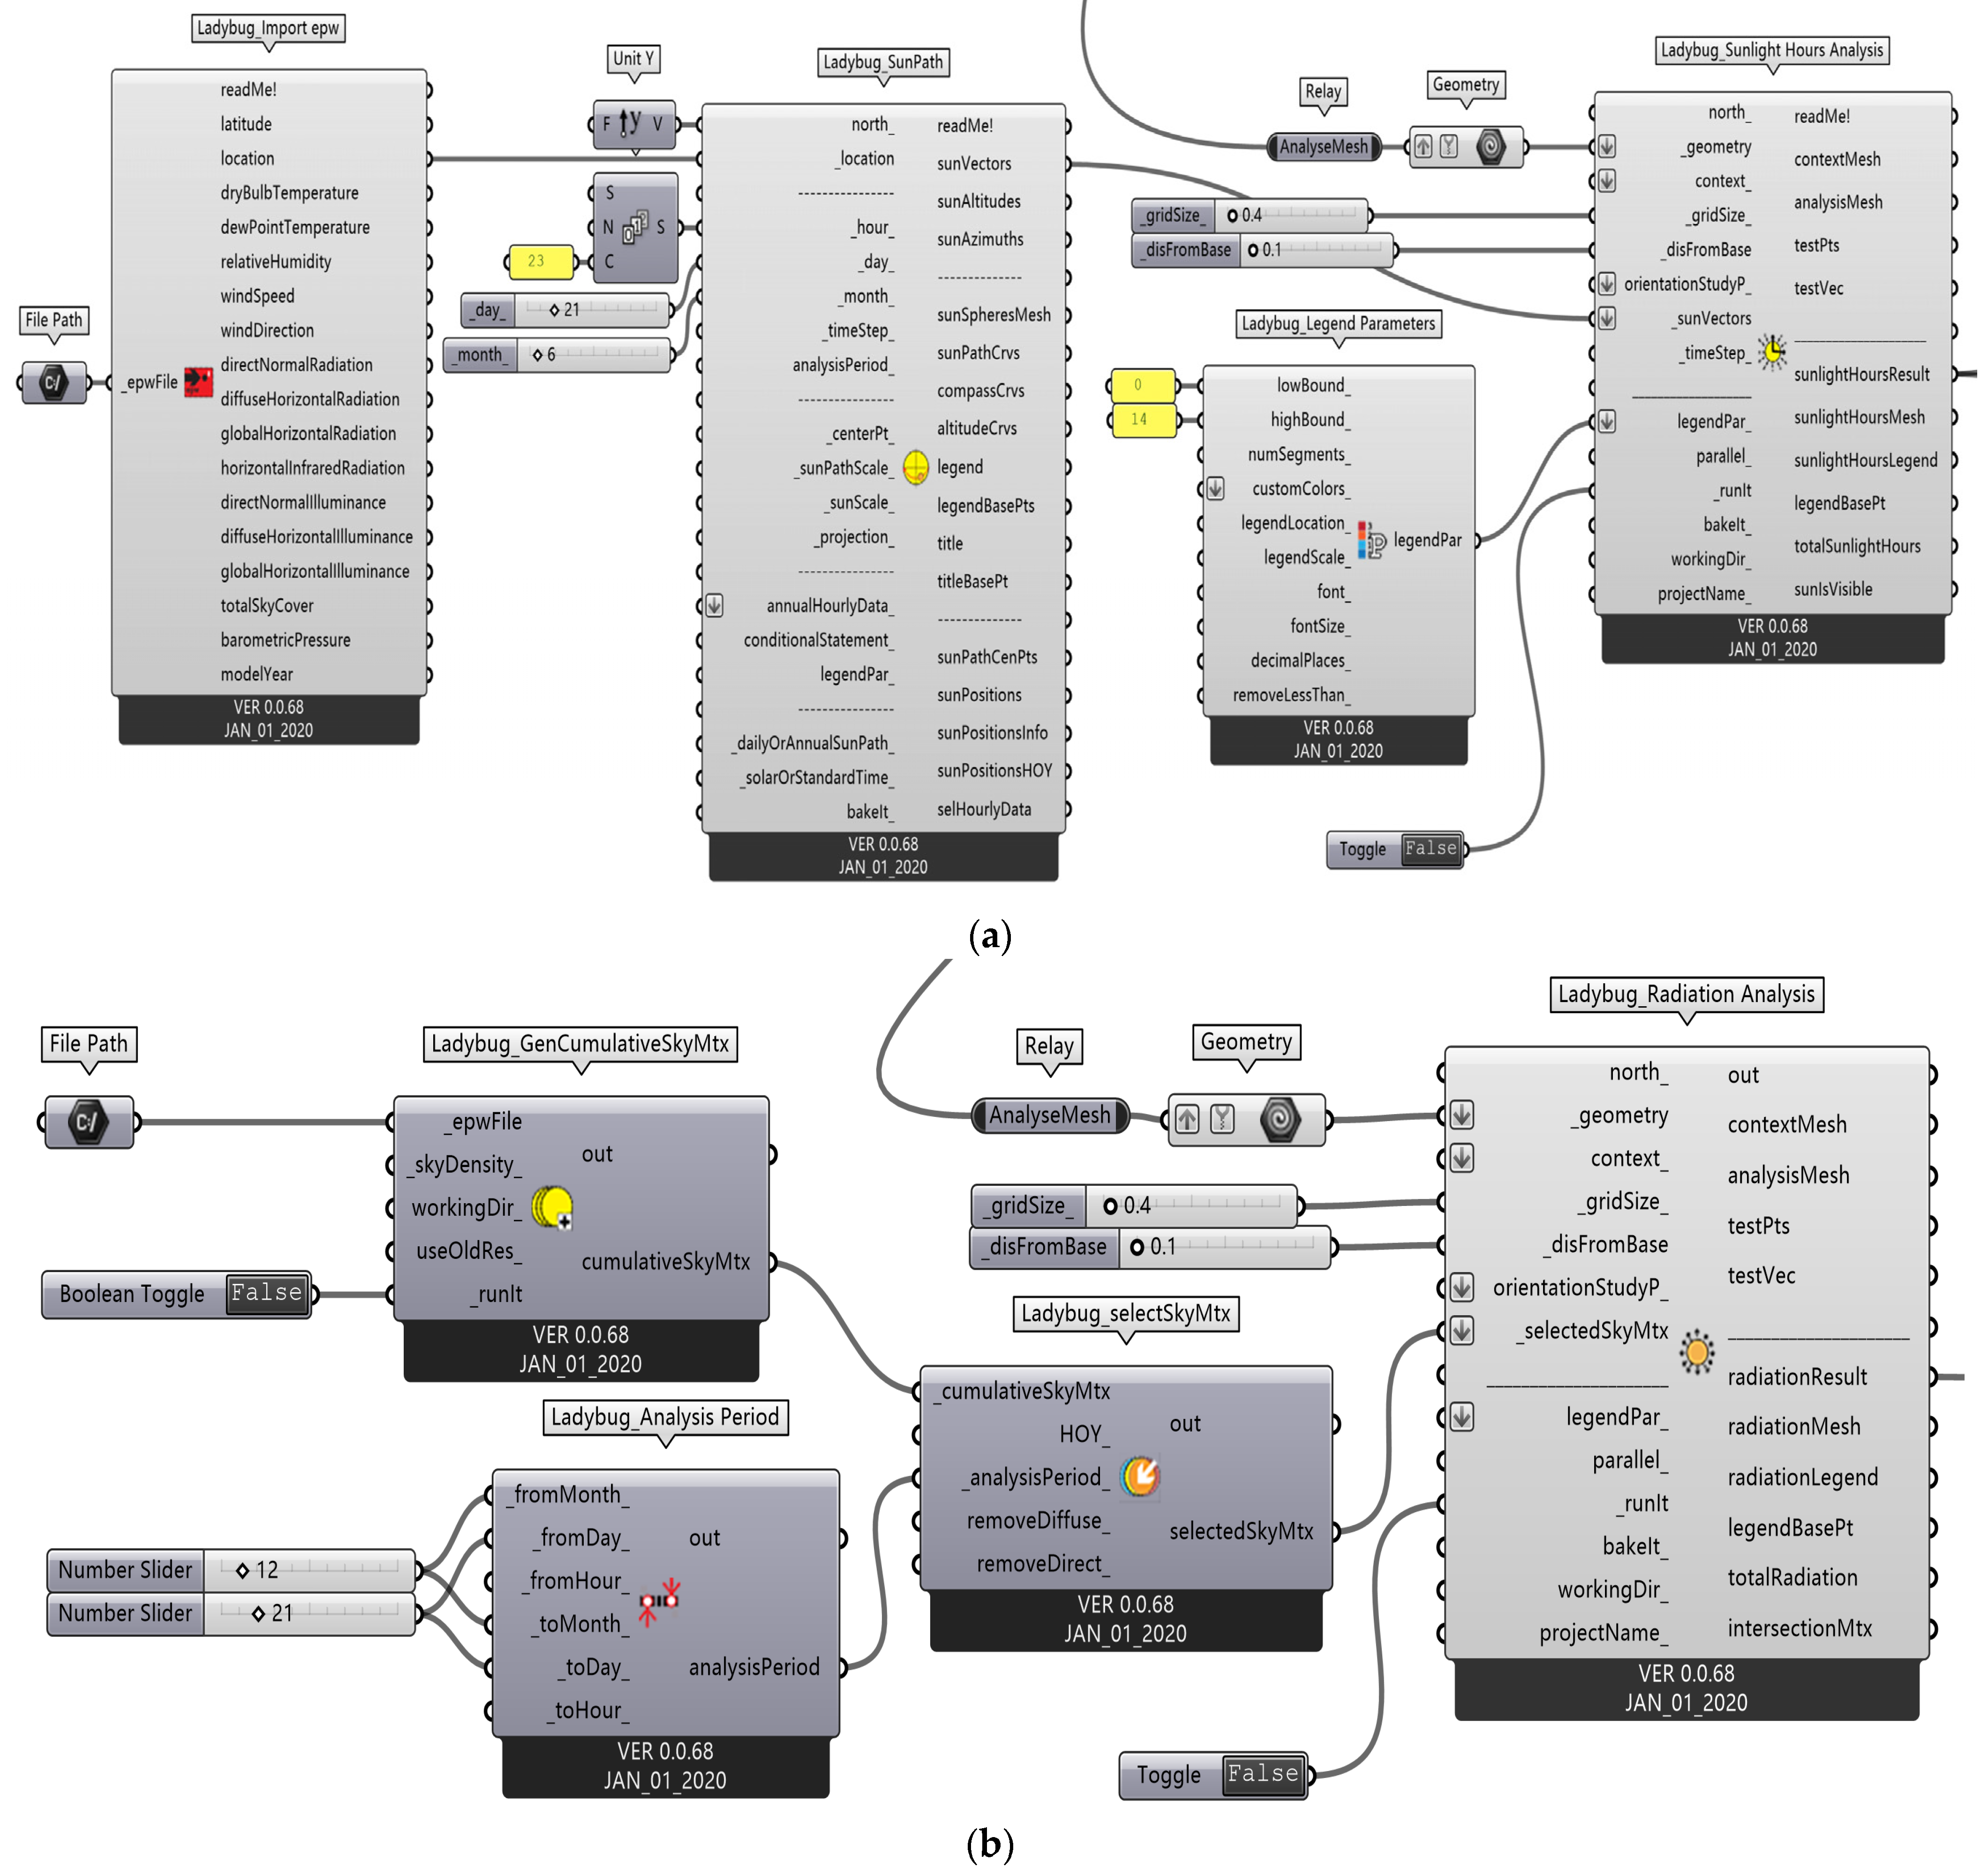
By importing the building skin model into the Ladybug Tools platform, we obtained the simulated data on sunlight hours and sunlight radiation for a specific date, as presented in Figure 8.
The above simulation method was used to simulate the building’s photothermal data for two official Ladybug Tools sample files [46]; the simulation results of sunlight hours (Figure 9a) and sunlight radiation (Figure 9b) were obtained as sample files, verifying the simulation method’s accuracy and reliability.
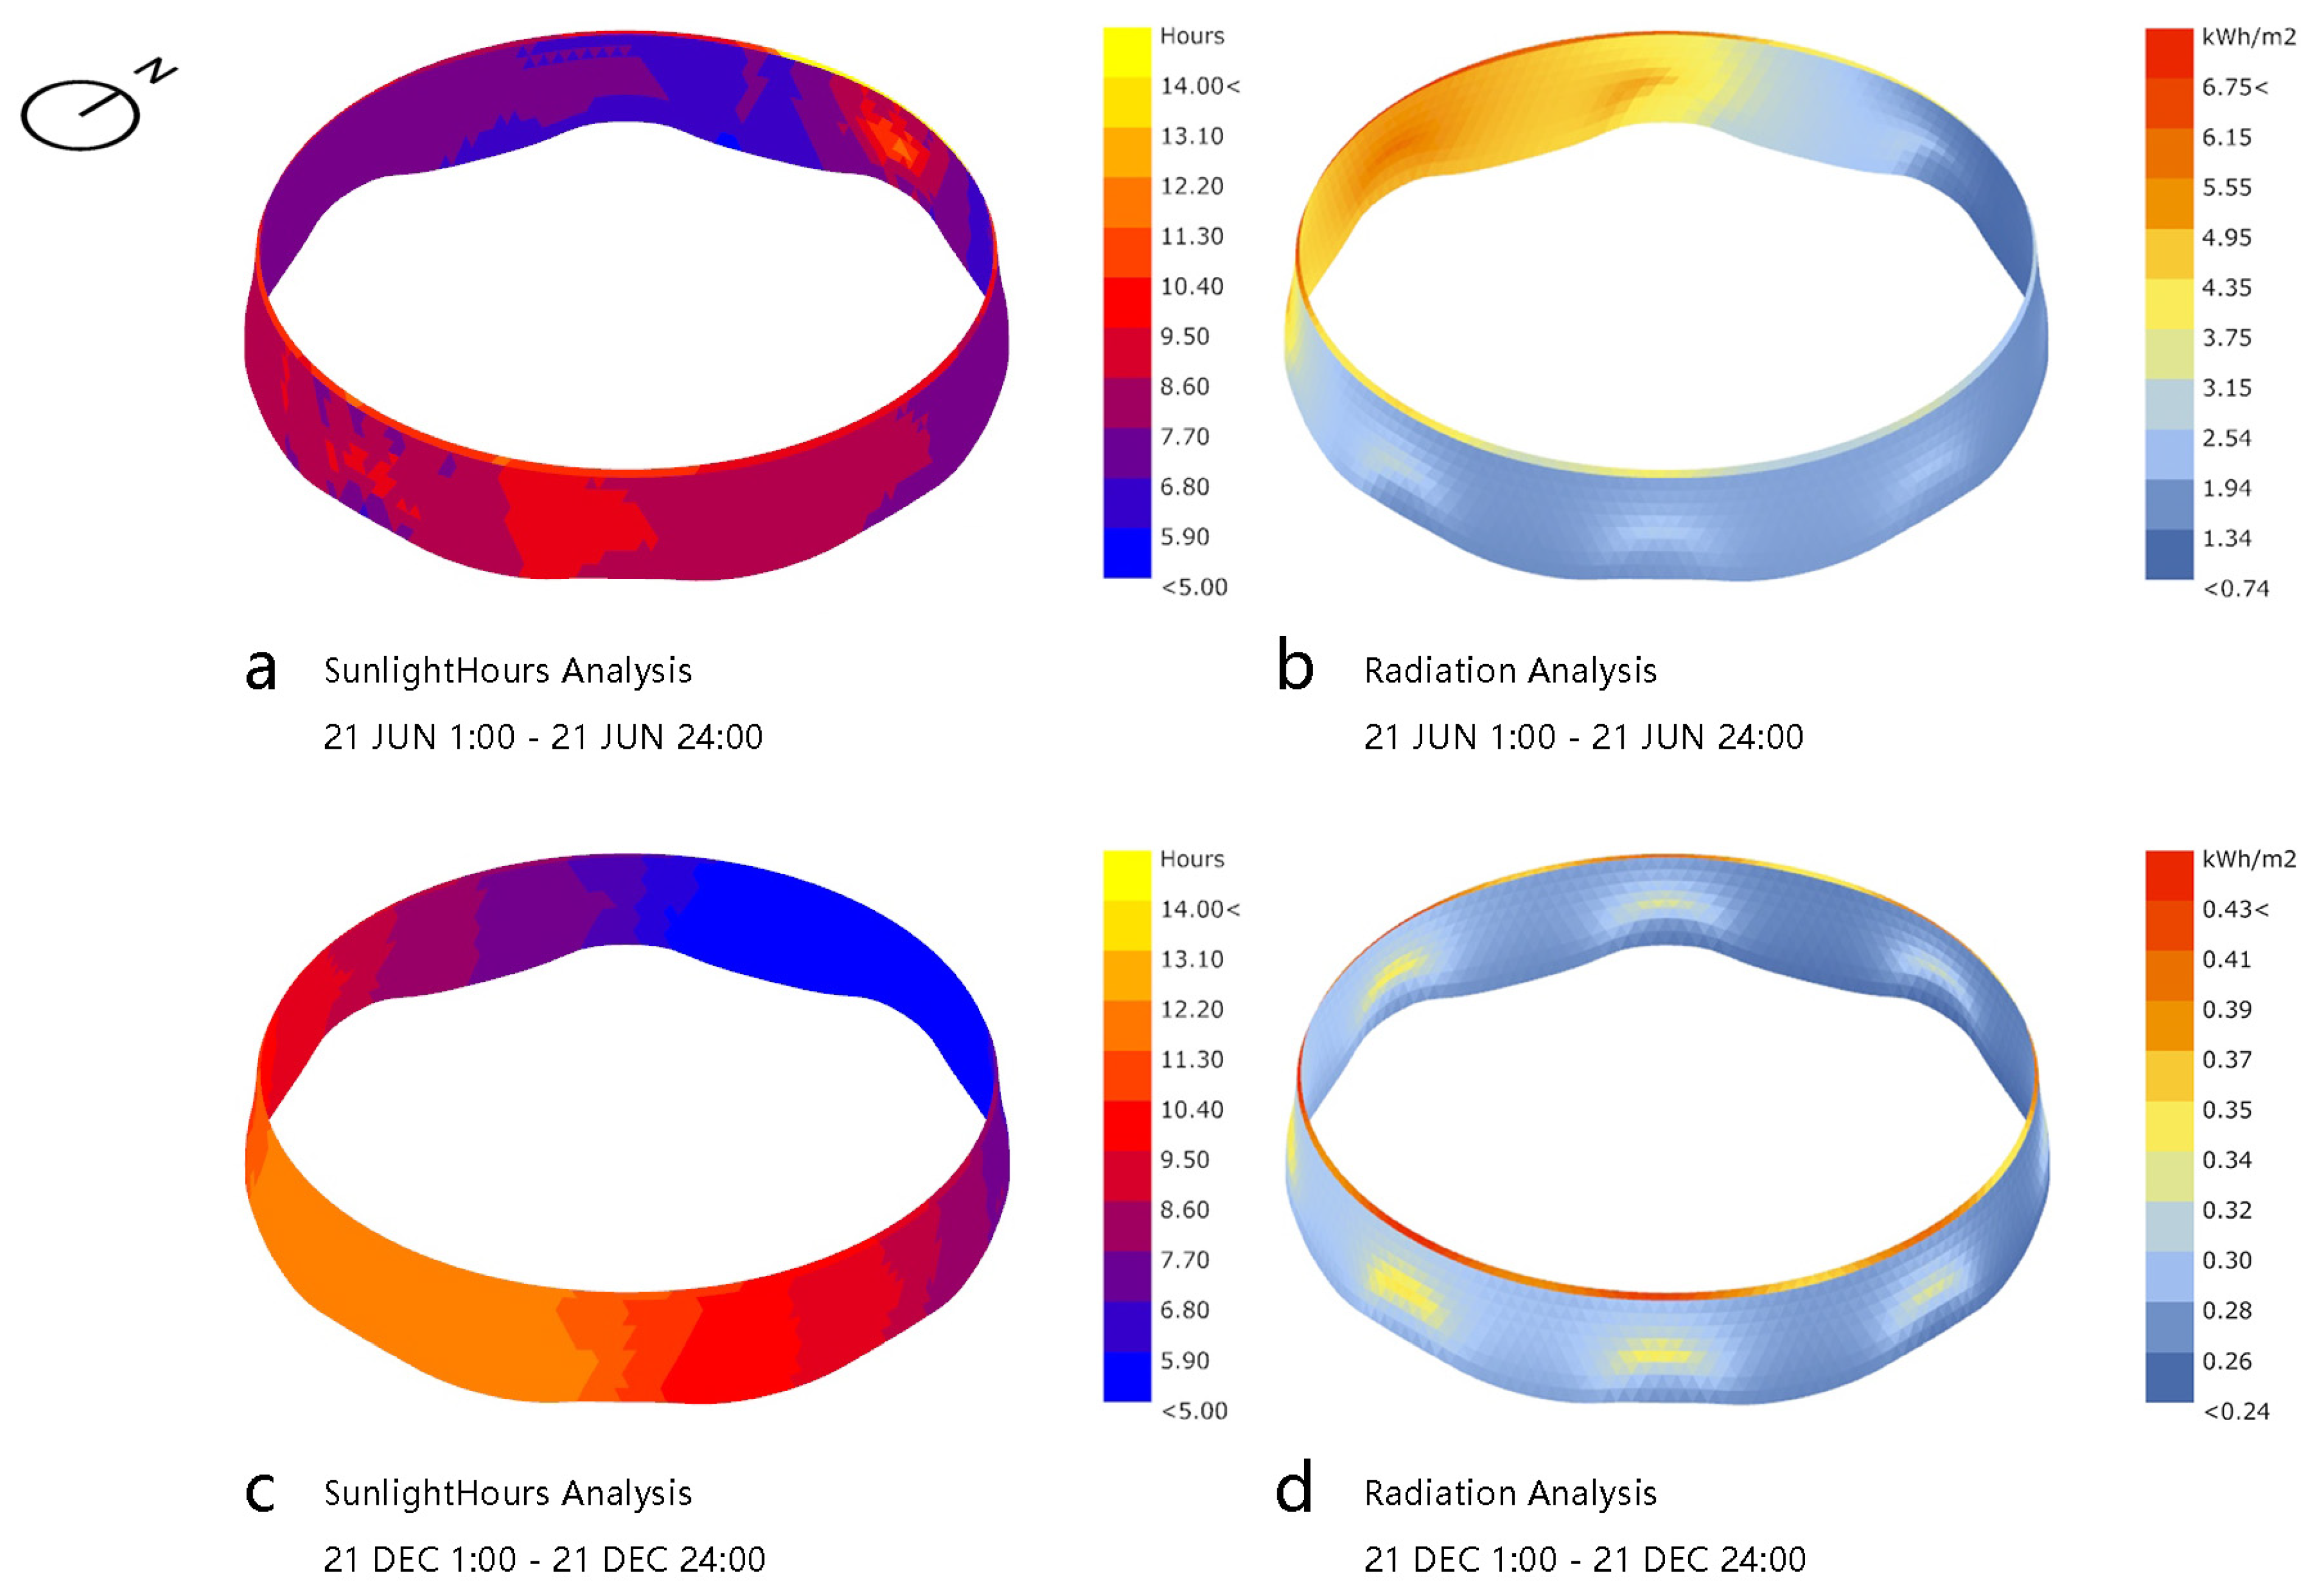
The summer and winter solstice dates are input into the cell set to obtain the photothermal simulation results of this study’s building skin, as illustrated in Figure 10, presenting (a) the summer solstice sunlight hours, (b) summer solstice sunlight radiation, (c) winter solstice sunlight hours, and (d) winter solstice sunlight radiation data. Each skin cell corresponds to a specific value.
The simulated data in Figure 10 highlight that the sunlight hours of the building skin tend to decrease from south to north on both dates. Comparing Figure 10a,c reveals that sunlight hours are more uniform in all directions on the summer solstice. On the other hand, changes in the sun’s trajectory and the solar altitude angle reduce sunlight hours on the winter solstice along the building’s north side, compared to the summer solstice. Moreover, the sunlight hours on the south side are slightly more than on the summer solstice. In addition, comparing Figure 10b,d reveals that the difference in the sunlight radiation values between the winter and summer solstices is large, with the summer solstice being significantly higher than the winter solstice. The building skin has a higher value of west-facing insolation radiation on the summer solstice, and a higher value of south-west-facing insolation radiation on the winter solstice. According to the simulation results, the two types of simulated data, sunlight hours and sunlight radiation, have significantly different distributions on the building skin. Next, we compare the light environmental performance of rooms with different orientations under dynamic skin shading disturbed by the two simulated data.

3.4. Disturbing Skin Changes to Generate Dynamic Skins

Based on the photothermal simulation data presented in Figure 11, the Grasshopper software automatically generates, by changing the variables, a series of skin units with different hole sizes in response to the design requirements. The skin disturbance through the photothermal data is specified as follows (Figure 11): the data for each skin cell are referred to as raw data, using sunlight hours’ data as an example. These data have a threshold of 0–14, and the raw data are mapped to a set of data with a threshold of 0.7–0.2 using the Remap Numbers cell in Grasshopper. The mapped data are the ratio of the variable edge to the length of its parallel fixed edge, whereby the new data are used to control the length of the variable edge and the size of the hole opening and closing, and, thus, the skin cell morphology. The sunlight radiation data are treated similarly. For presentation purposes, the skin results generated from the summer solstice sunlight hours, summer solstice sunlight radiation, winter solstice sunlight hours, and winter solstice sunlight radiation data are named Skin A, Skin B, Skin C, and Skin C, respectively (Figure 12).
In this study, the most representative typical dates of winter and summer were selected for skin comparison. On the summer solstice, the sun directly hits the Tropic of Cancer, and the total daily radiation and sunshine duration are the largest in the sample area. During the winter solstice, the sun directly hits the Tropic of Capricorn, and the total amount of daily radiation and duration of sunshine in the sample area are the minimum. The environmental lighting performance of different building skin has been evaluated by comparison work.

3.5. Simulation of Building Light Environmental Performance

The quality of the light environment is evaluated for a single day. Specifically, using Grasshopper’s plug-in Ladybug and Honeybee’s extensive simulation and calculations, we obtain the light intensity and DGP of the room at a given time. The statistics are then used to obtain the percentage of the room area in which the luminance hours exceed 300l× and the percentage of the area in which separate hours of useful daylight luminance for the specified date exceed a threshold. The more hours with a luminance exceeding 300l× and the higher the area percentage, the better the natural lighting effect. The more hours with a luminance between 450 and 3000l× and the higher the area share, the better the useful daylight lighting.
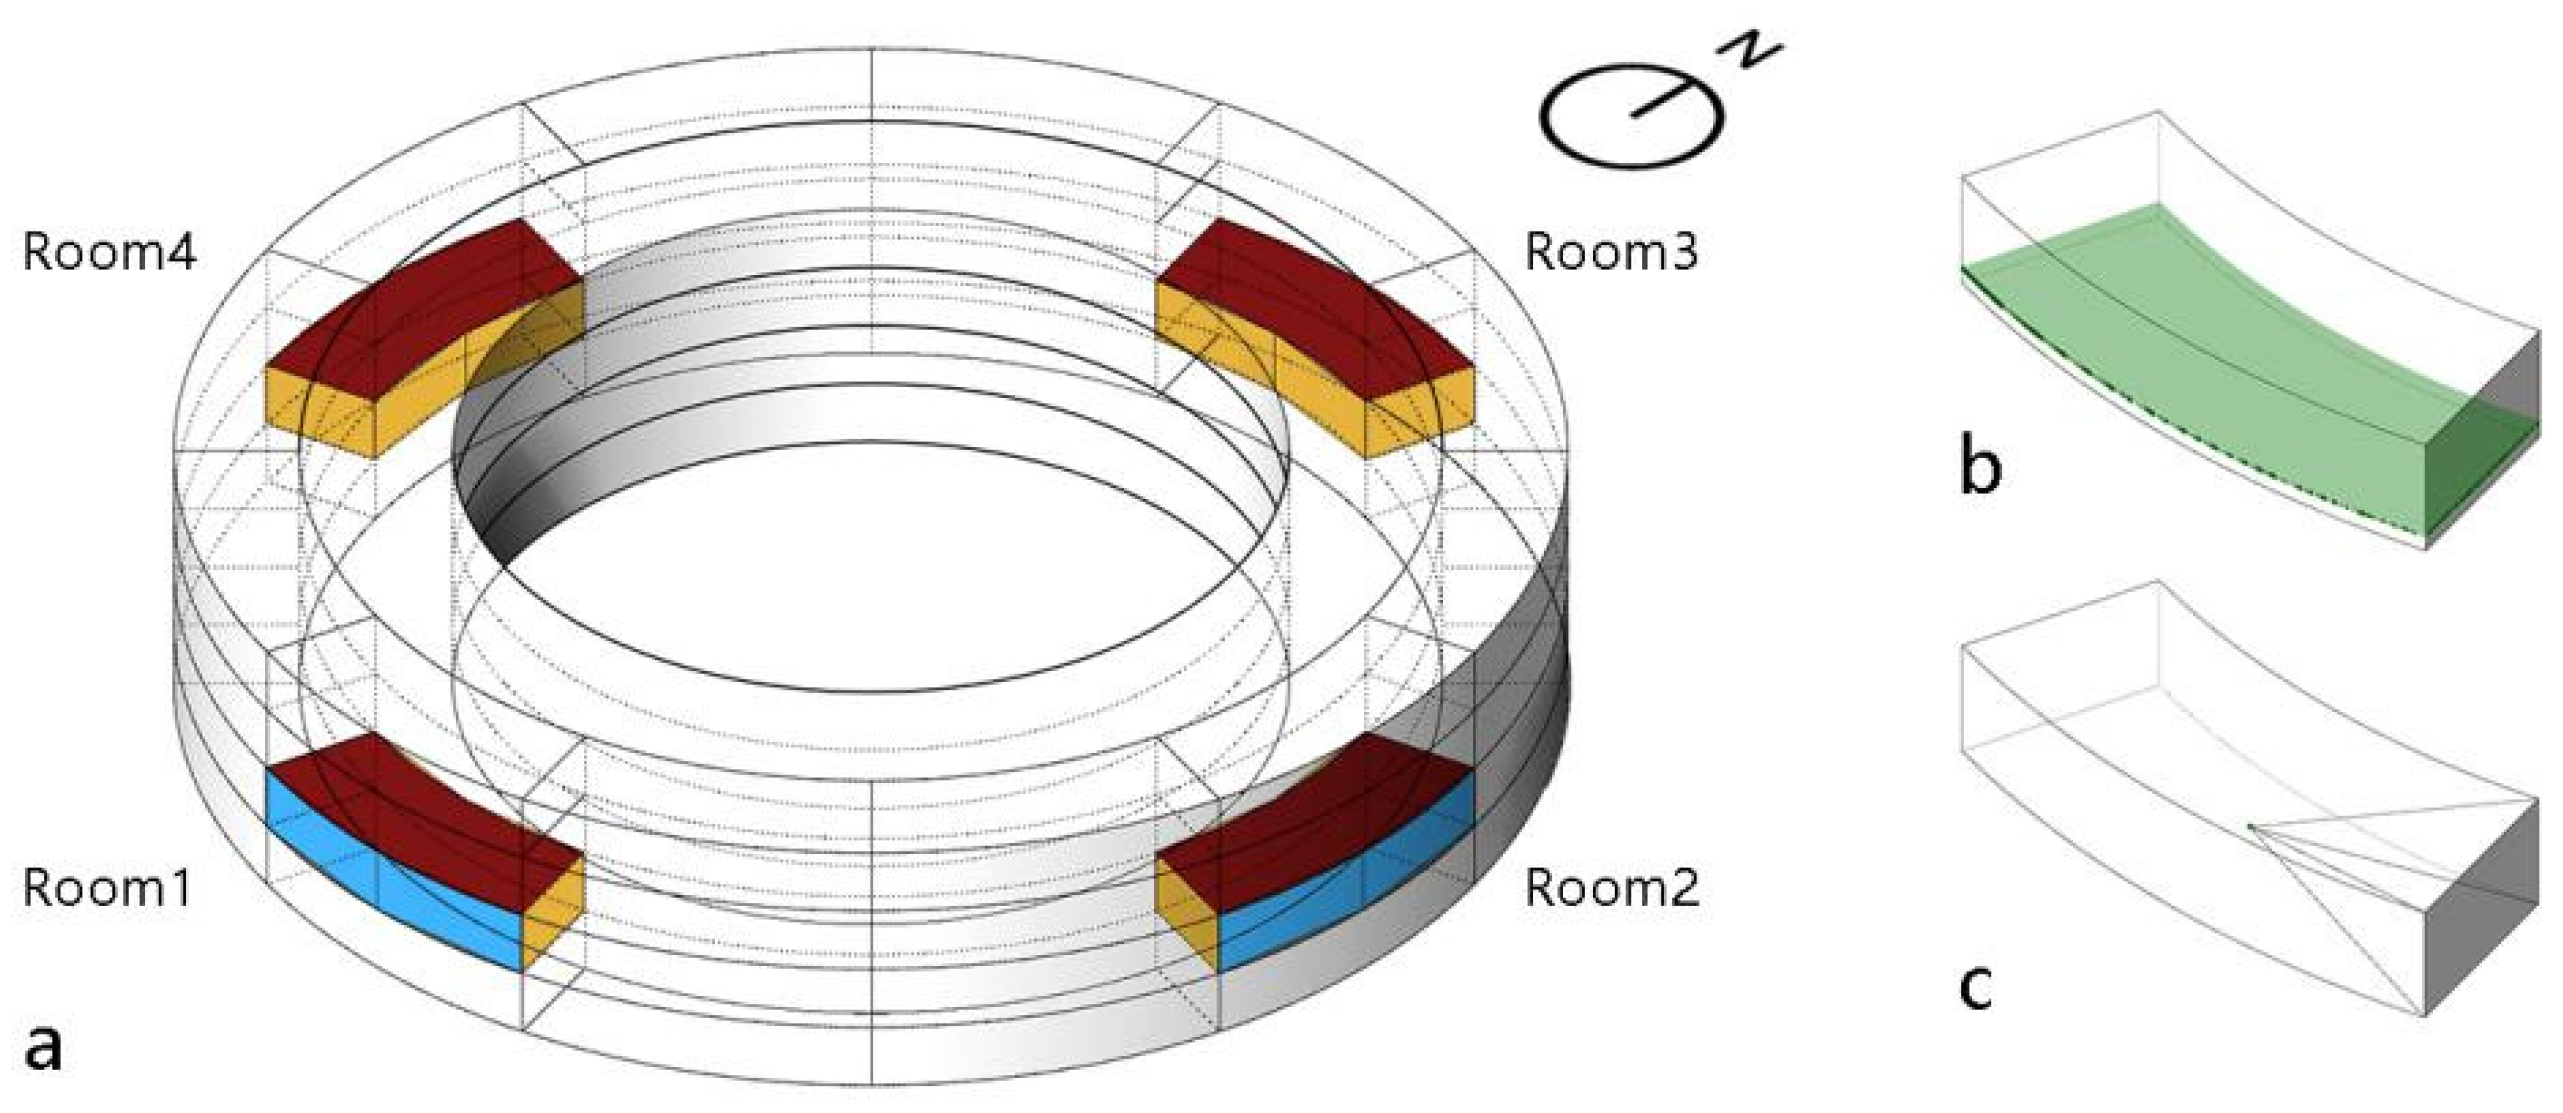
Moreover, the simulation process involves four steps (Figure 13): (1) Set up the meteorological data. (2) Set up the simulated rooms, shading skins, and their parameters to generate the Honeybee Model. (3) Set up the light intensity simulation grid, glare simulation perspective, and other parameters (Figure 14). (4) Conduct simulation calculations and data visualization.
Since the case building is circular (except for the traffic hall and warehouse on the ground floor), the planes of the other floors are the same, and there is no shelter around, this study employs four two-story rooms for simulation—one per orientation (south, east, north, and west), named Room 1 (south-facing), Room 2 (east-facing), Room 3 (north-facing), and Room 4 (west-facing) (Figure 14a). The parameter values for the rooms and shade skin materials are listed in Table 4. The grid size for the light intensity simulation is 0.25 m, and the height above the ground is 0.75 m, involving 3760 test points. For the glare simulation, we selected the center of the room, at 1.2 m, as the viewpoint (Figure 14b,c). Moreover, we studied the summer and winter solstice times; the absence of shading was used as a reference for the simulation.

4. Results and Discussion

The light intensity simulation was conducted hourly for each of the 3760 test points in each room. The data was recorded and collated to obtain the area with different hours of luminance exceeding 300l× and the area with different hours of useful daylight luminance. Additionally, the glare simulation was conducted hourly throughout the day for each room to obtain the corresponding DGP. The results are presented below.

4.1. Percentage of the Area with Different Hours of Illumination Greater than 300l×

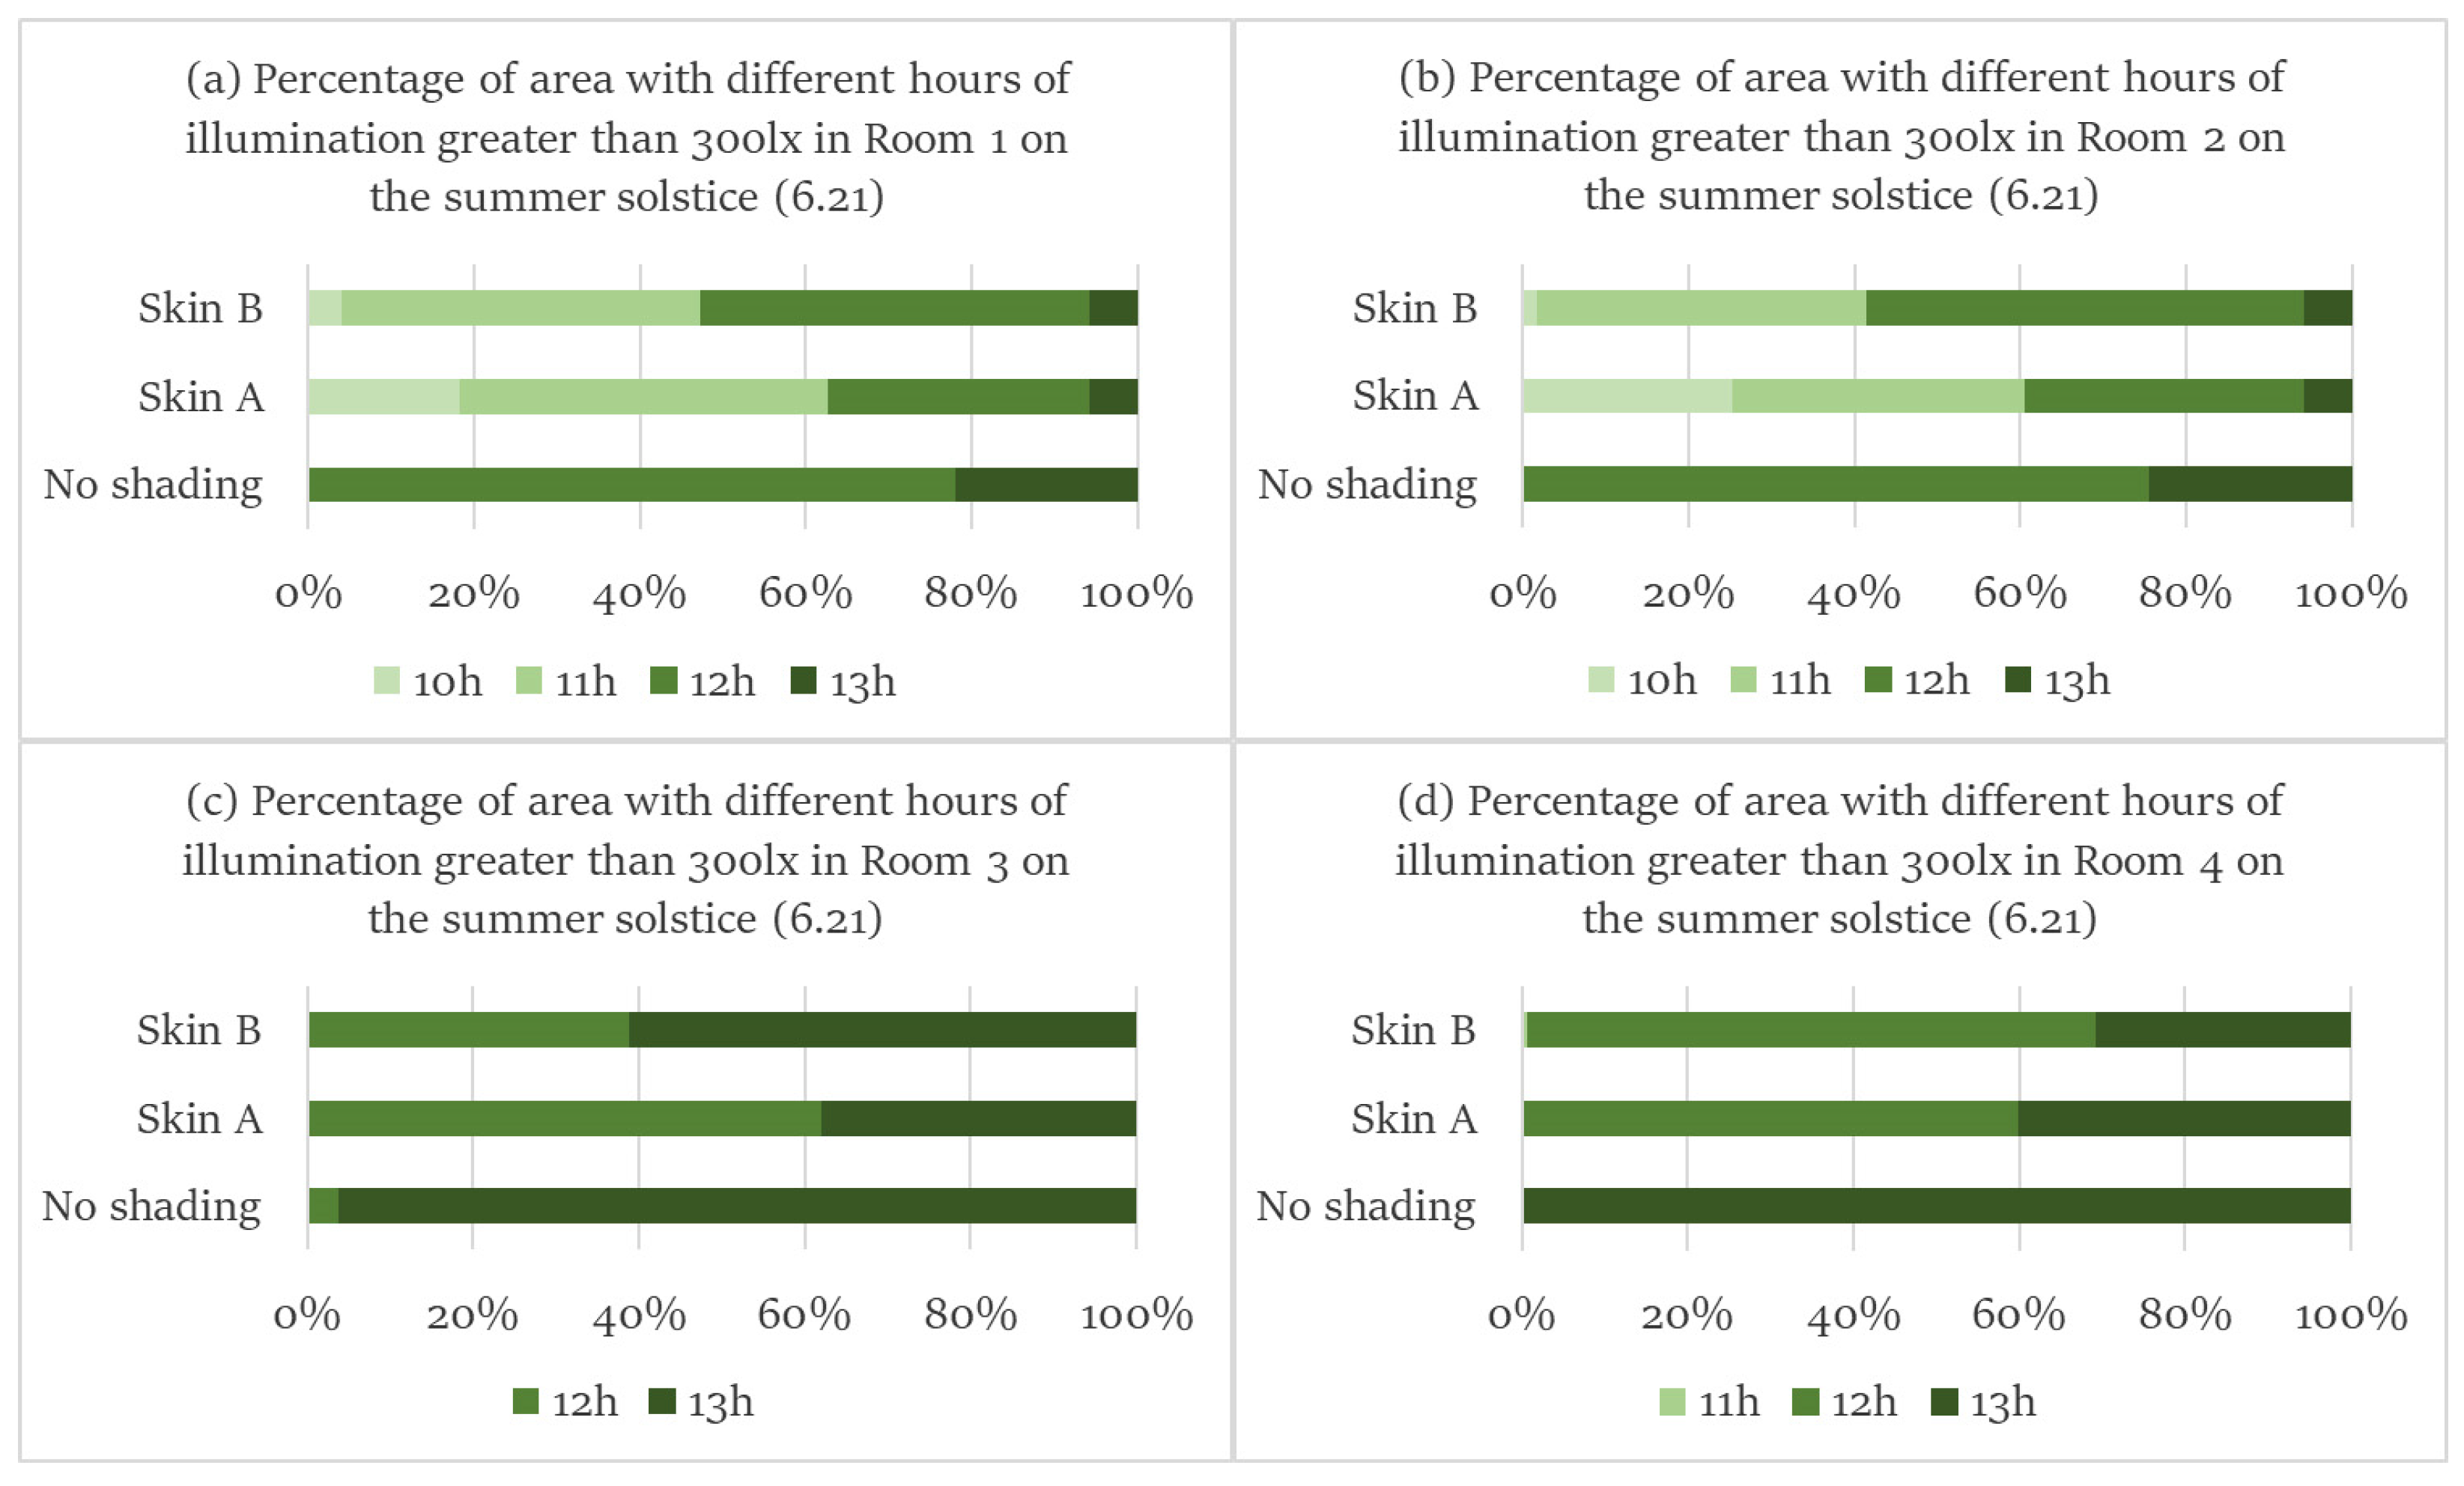
The time range of luminance data accessible on the summer solstice (6.21) is 7:00–19:00 (13 h). Figure 15 illustrates the percentage of area with different hours of luminance exceeding 300l× for all rooms on the summer solstice, revealing that, in the absence of shading, the number of hours with luminance more than 300l× at the test points in the north- and west-facing rooms was longer than in the south- and east-facing rooms. The luminance in all four directions in the room was reduced under the shading of Skin A and B. Additionally, the number of hours with luminance of more than 300l× can exceed 10 h at each test point, a reduction of around 1–2 h. The rooms are better lit naturally in the south, east, and north directions with Skin B shading. In the west-facing direction, the room is better lit by natural light under Skin A.
The time range of luminance data accessible on the winter solstice (12.21) is 8:00–17:00 (10 h). Figure 16 presents the percentage of area with different hours of luminance exceeding 300l× in all rooms on the winter solstice, demonstrating that, in the absence of shading, the number of hours with luminance of more than 300l× at the test points in the east-facing room was longer than in the south-, north-, and west-facing rooms. When using the shading of Skin C and D, the luminance in all four directions of the room was reduced, by around 1–2 h, as most of the test points have more than 4 h of luminance exceeding 300l×. For the south and north orientation, the rooms are better lit naturally under the Skin C shading, while in the east- and west-facing directions, the rooms are better lit by natural light under Skin C.

4.2. Percentage of the Area with Different Hours of Useful Daylight Luminance

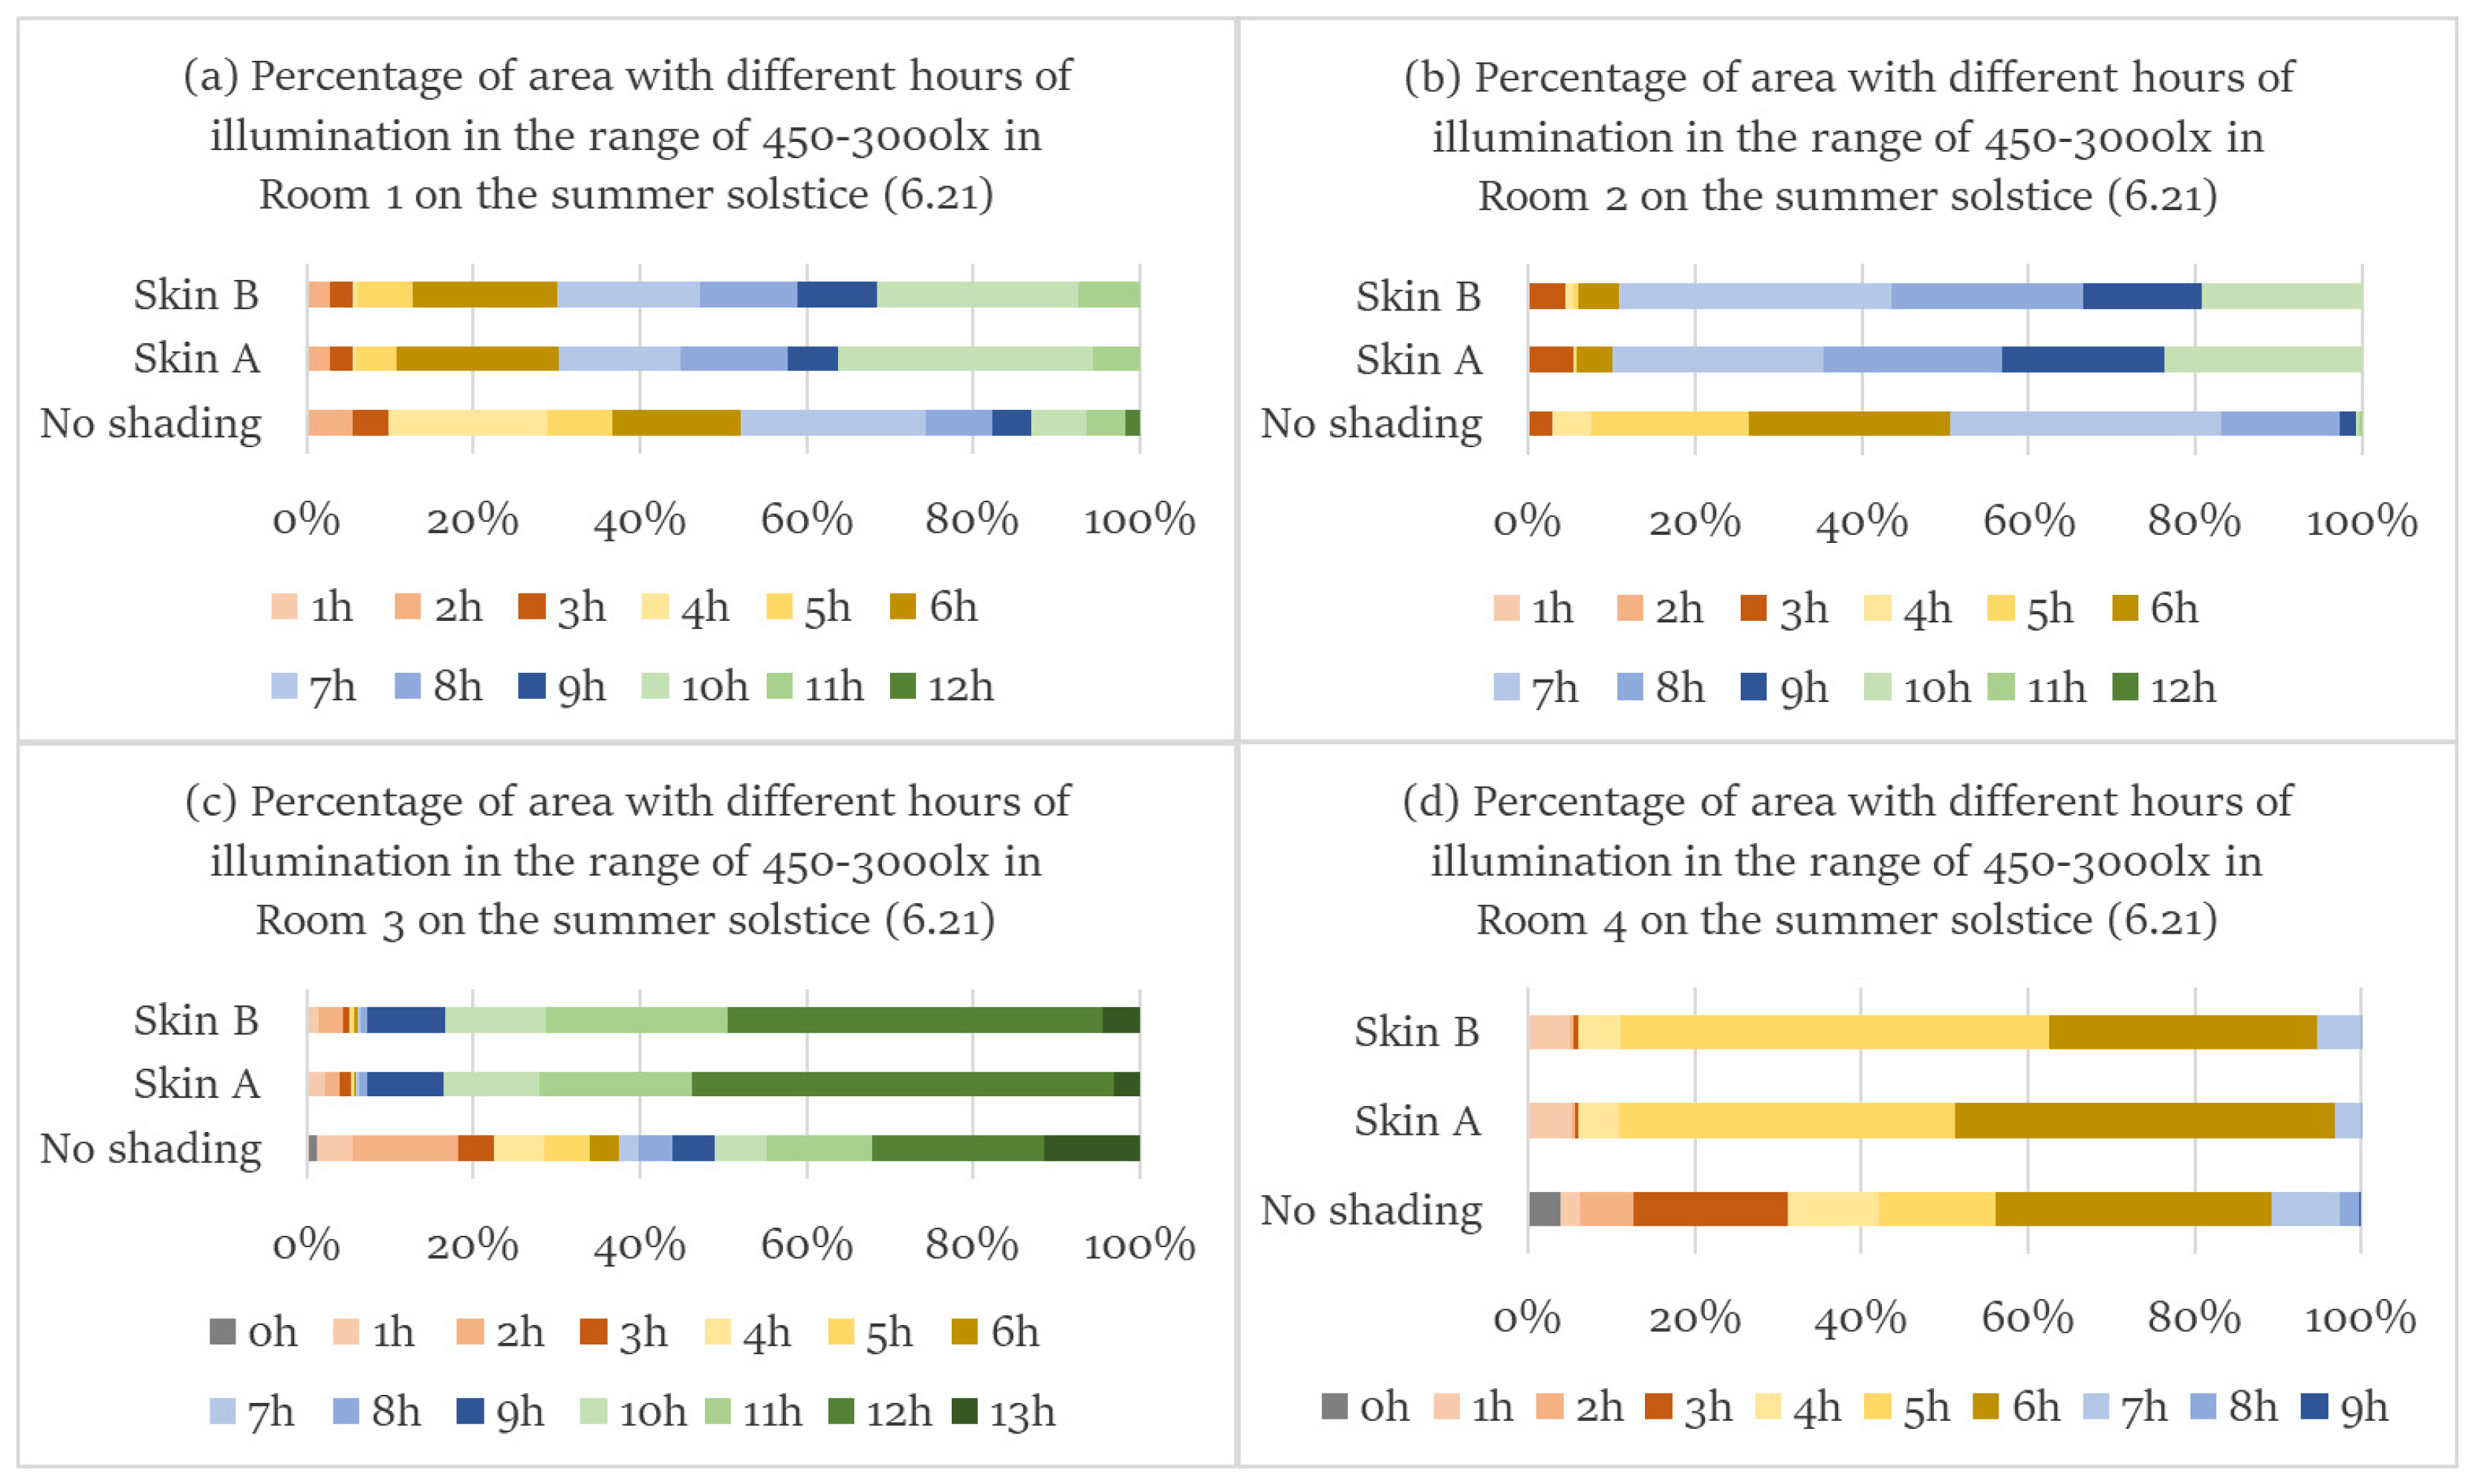
The time range where the luminance data is accessible on the summer solstice (6.21) is 7:00–19:00 (13 h). From Figure 17, the percentage of area with different hours of luminance values between 450–3000l× for all rooms on the summer solstice can be obtained. Figure 17 shows that in the absence of shading, the useful daylight effect deteriorates in the order of north, south, east, and west orientation. With the shading of Skin A and Skin B, the useful daylight effect of the room becomes better in all four directions. Moreover, the useful daylight effect in the room shaded by Skin A is better in all four directions.
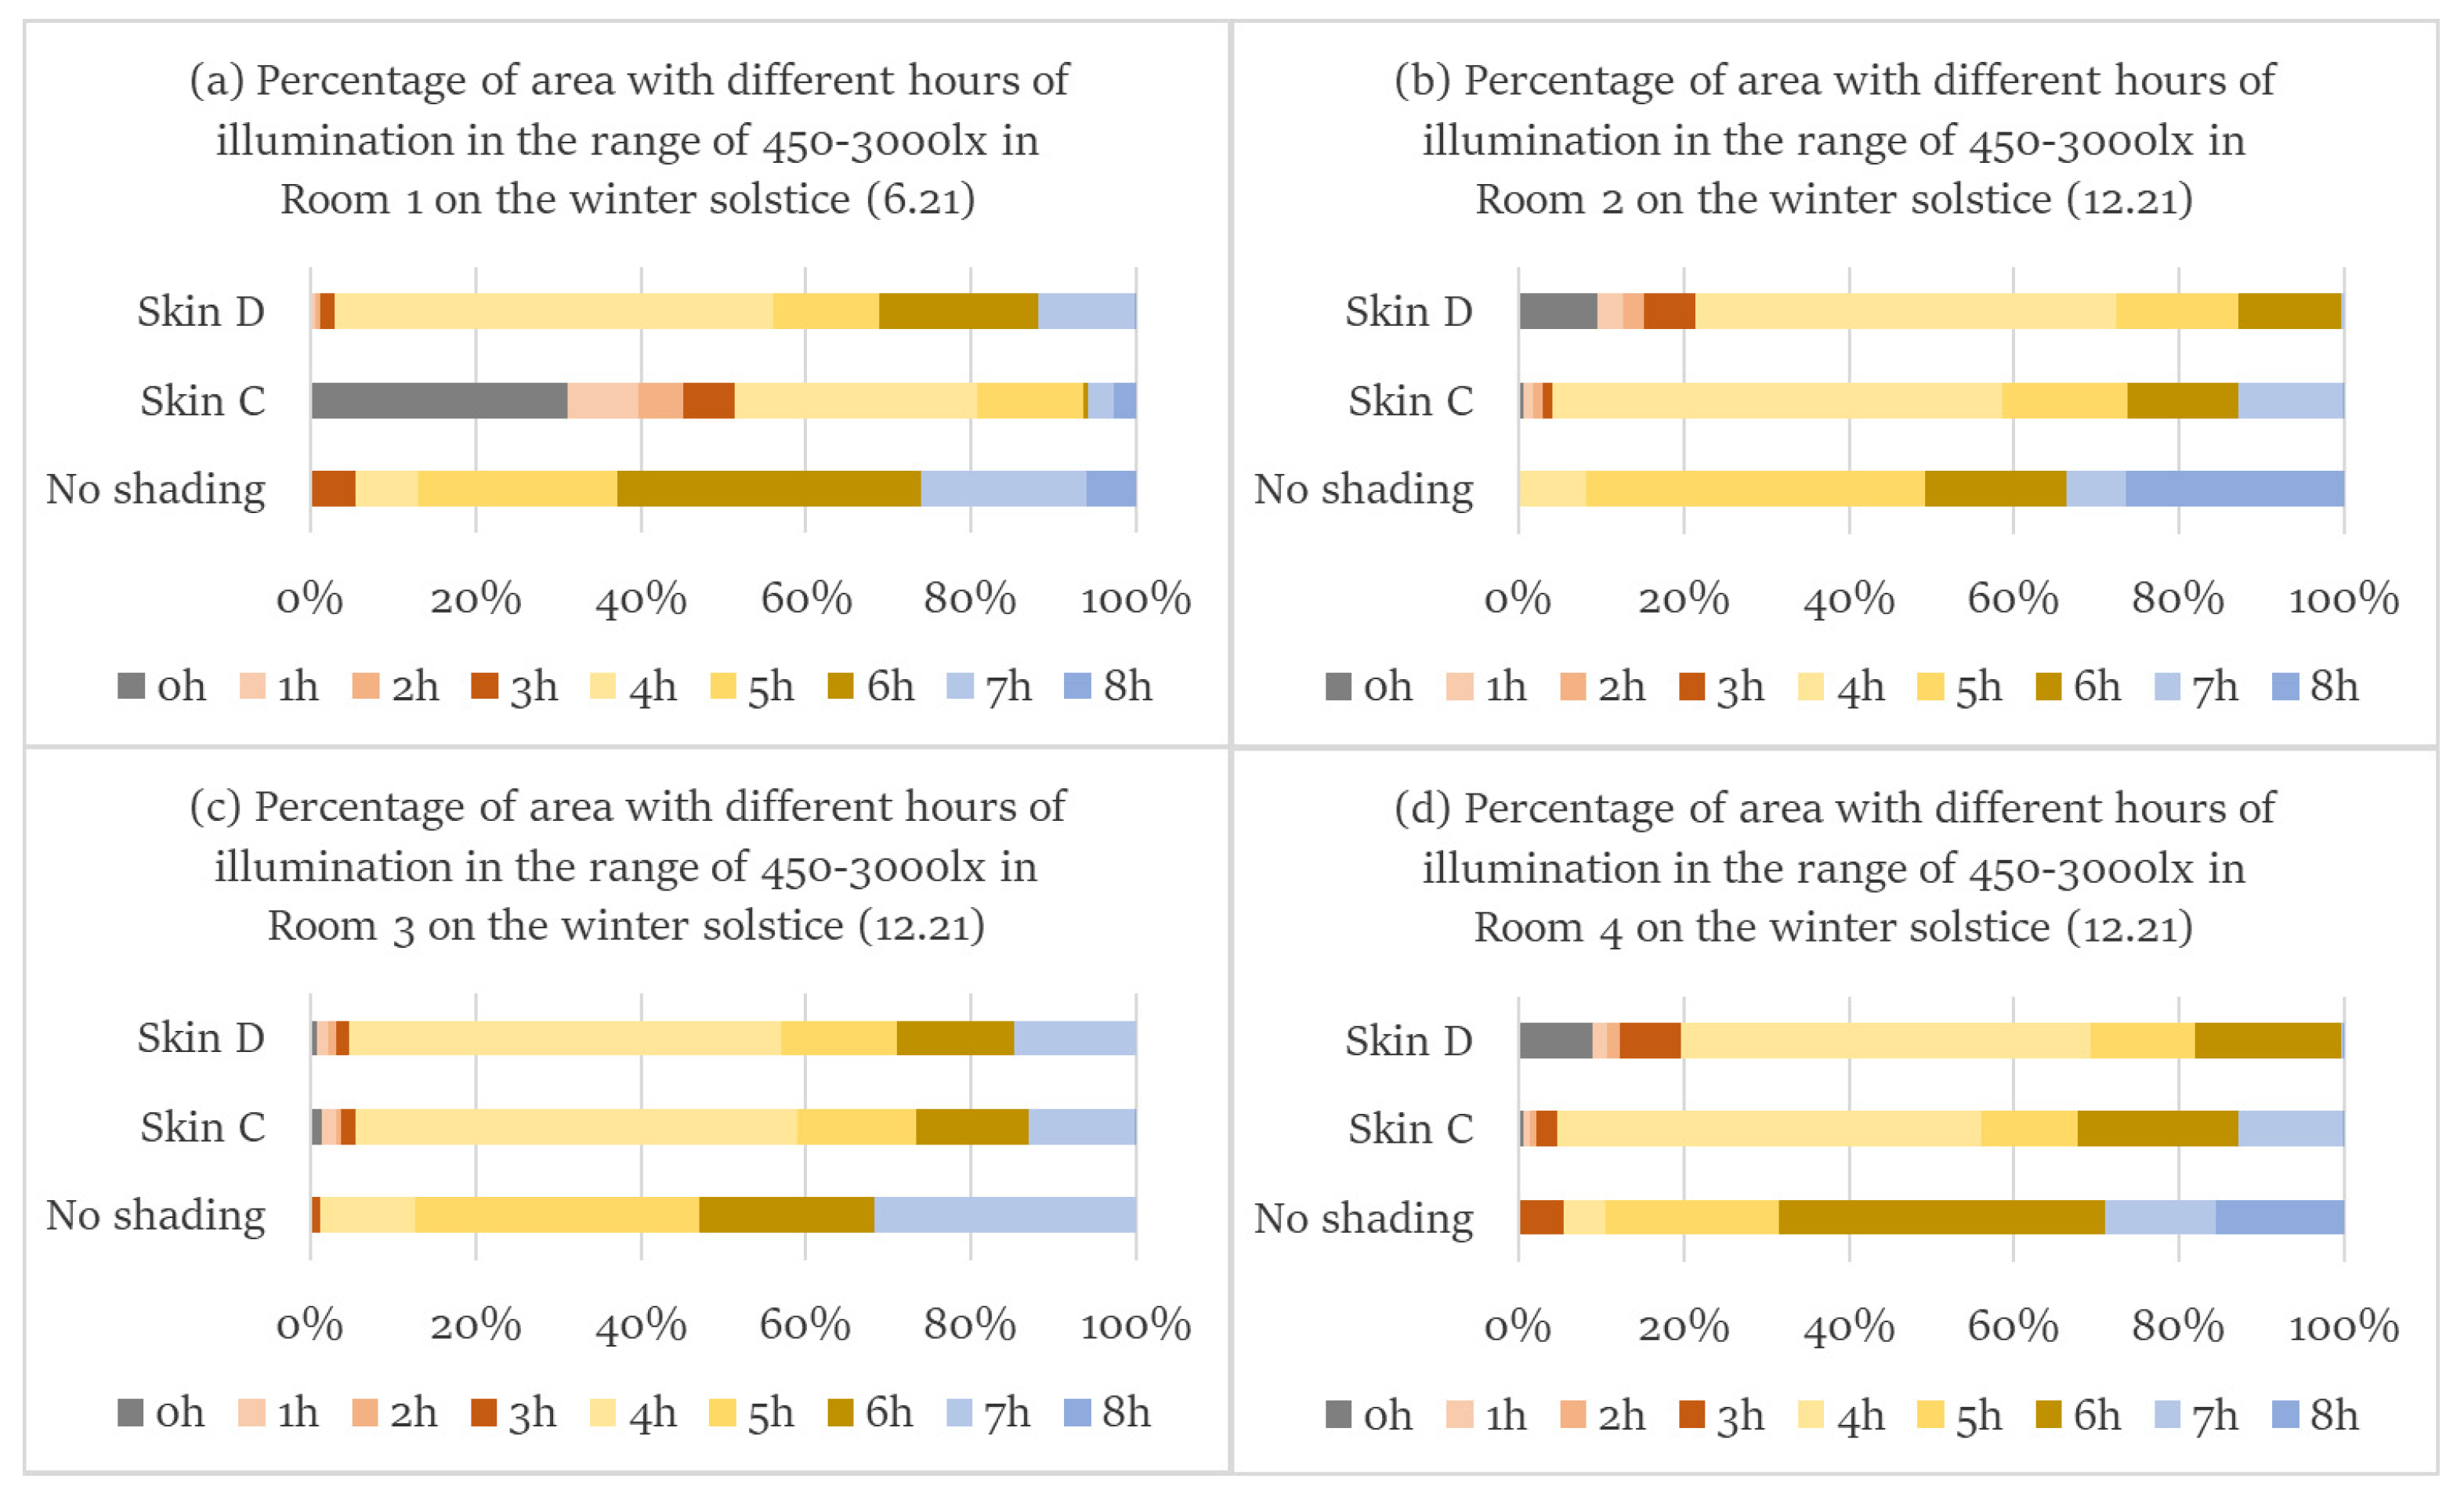
The time range for which luminance data is accessible on the winter solstice (12.21) is 8:00–17:00 (10 h). From Figure 18, the percentage of area with different hours of luminance values between 450–3000l× for all rooms on the winter solstice can be acquired. Figure 18 shows that the useful daylight effect does not differ significantly in the four directions without shading. With the shading of Skin A and Skin B, the useful daylight effect of the room deteriorates in all four directions. In the south direction, the useful daylight in the room shaded by Skin C is worse. In the east and west directions, the rooms are less effectively lit by natural light with Skin C. In the north direction, the difference in effective natural light between the rooms shaded by the two skins is insignificant.

4.3. Daylight Glare Probability (DGP)

The time range for which luminance data is accessible on the summer solstice (6.21) is 7:00–19:00 (13 h). Figure 19 shows the daylight glare probability (DGP) for all rooms on the summer solstice. Figure 19 highlights that the DGP values for the south-facing room vary more moderately throughout the day. The DGP values are higher in the morning for the east-facing room and higher in the afternoon for the north- and west-facing rooms, reaching a maximum of 1. The DGP values decrease in all directions under both shading skins. The effect of shading with the two shading skins is similar, with Skin A being slightly more effective in the south, east, and north directions. In the absence of shading, the percentage of time that the room has a DGP of 0.35 in all four directions is 84.6%, which decreases to 71.1% in the case of Skin A shading.
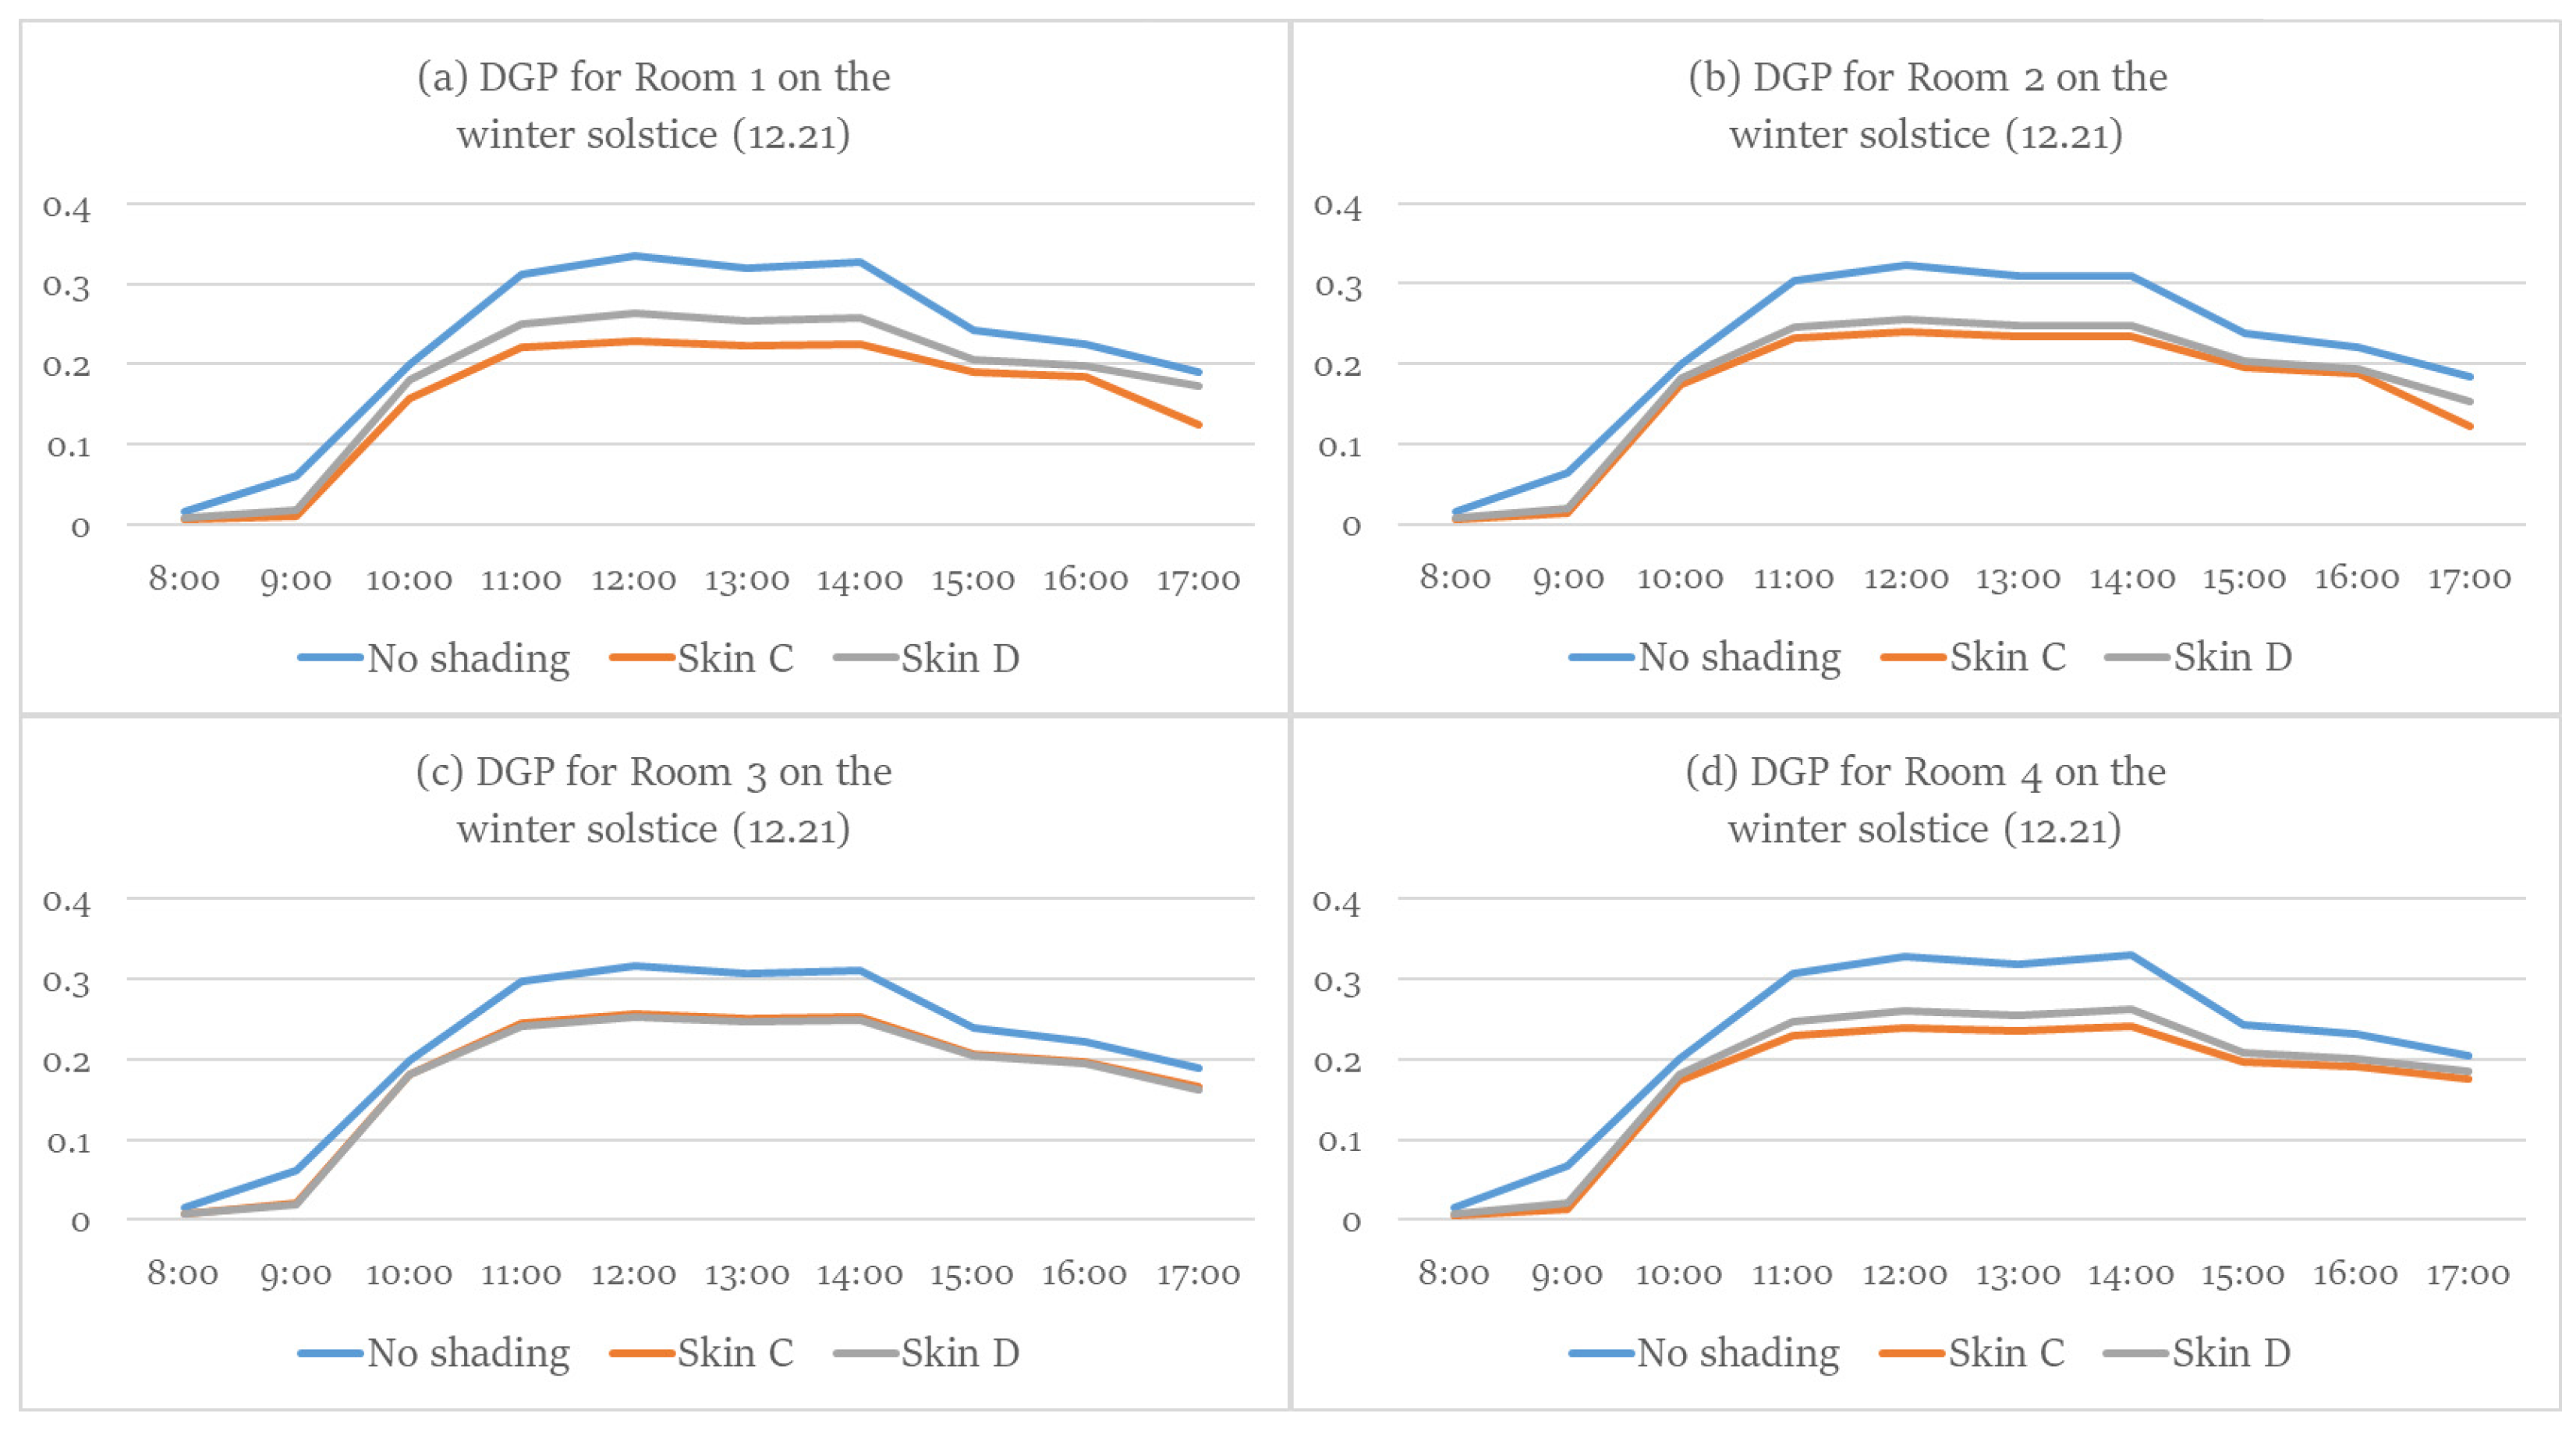
The time range for which illuminance data is accessible on the winter solstice (12.21) is 8:00–17:00 (10 h). From Figure 20, we obtain the daylight glare probability (DGP) for all rooms on the winter solstice, highlighting that during the day, with no shading, the DGP of the rooms, in all four directions, did not exceed 0.35, which is already a good, acceptable range. The trend in the DGP values for the room in the four directions is similar, and the DGP values in each direction decrease under both shading skins. The effect of shading with the two shading skins was similar, with Skin C faring slightly better in the south, east, and west directions.

4.4. Discussions

The simulation results of the three evaluation indicators were tabulated. The dynamic skin of the two photothermal parameter disturbances was compared to the environmental lighting performance of the studied rooms, with different orientations on the summer solstice and the winter solstice. The light and heat parameters which positively impact the environmental lighting performance under different conditions were also collated and listed in Table 5. The combined performance of the three evaluation indicators shows that both photothermal parameters can be more effectively used as influencing factors for dynamic phenology. The rooms’ environmental lighting performance, under dynamic skin shading based on sunlight hours data, was better in the east, west, south, and north directions on the summer solstice, and in the east and west directions on the winter solstice. The rooms’ environmental lighting performance was better, under dynamic skin shading based on the influence of daylight radiation data, in the south and north directions on the winter solstice.
Nevertheless, this study has the following limitations:
(1) This study’s performance verification of thermal simulation and light environment is based on the Ladybug Tools platform, using standard Chinese meteorological data (https://www.ladybug.tools/epwmap/, accessed on 1 October 2022) and accessible information (https://energyplus.net/weather/sources#CTYW, accessed on 1 October 2022). However, the data were published 17 years ago, in 2005, so there may be some differences between the data and the current climate.
(2) In this study, comparative experiments were conducted mainly on light and heat data, orientation, and season, while the other variables were not discussed further. Due to the constraints of the research conditions, this study only compares the differences between the two light and heat factors on the design results and does not further explore their combination to refine the comparison.
(3) The building and dynamic skin in this study are a simplified model whose parameters are set and idealized.
Future studies should focus on the following:
(1) It is suggested that more actual and updated basic meteorological data can be introduced into subsequent research.
(2) In this study, the building and skin parameters were set as fixed values, and only the sunshine duration and radiance were studied. It is suggested that further research should be conducted on the architectural form, dynamic skin size, and material as changing parameters.
(3) Currently, only specific summer and winter solstices have been studied; more typical dates should be studied in the future to obtain more comprehensive results.
(4) A genetic algorithm should be combined with automatic iterative calculations in the follow-up research.
(5) Attention must be paid to combining the design characteristics of architects with algorithms to achieve design optimization in future relevant research.

5. Conclusions

Based on the photothermal elements, this study conducts periodic regulation on a building’s dynamic skin and proposes a parameterized design method for the light environment of a library building, which is illustrated with a design example. From our work, we can reach the following conclusions:
  • The skin changes of the design method must correspond to the sunshine duration and sunshine radiation, so that a building’s skin changes can be based on data. This will provide a more accurate parameterized design method based on data analysis.
  • The research results show that a dynamic building skin based on sunshine duration and solar radiation can significantly improve the indoor light environment of a building on the summer solstice. The indoor illumination can be more comfortable and the probability of an uncomfortable glare can be reduced. In such a building, the indoor illumination will be less comfortable on the winter solstice, although the probability of an uncomfortable glare will be reduced.
  • The research results reveal differences in the effect of the dynamic shading skin generated based on sunshine duration and sunshine radiation data of the indoor light environment comfort in rooms with different orientations. However, the differences are relatively similar, demonstrating an insignificant role.
  • This research optimizes and evaluates a building’s environmental lighting performance with daily meteorological data to achieve more accurate skin optimization results.
  • Taking sunshine duration and sunshine radiation as the influencing factors, this study conducts interference design on the dynamic skin of buildings, making the optimal design of building skin more scientific and effective.
Based on the studied research objects’ climatic conditions, architectural forms, and parameter settings, dynamic skin generated based on sunshine duration data affords better environmental lighting performance. However, for north–south orientation, on the winter solstice, the dynamic skin generated based on sunshine radiation data presents an optimized light environment performance.

Author Contributions

Conceptualization, Q.L. and J.R.; methodology, Q.L., X.H. and J.R.; software, X.H.; validation, X.H., Q.L. and J.R.; formal analysis, X.H. and Y.Y.; investigation, X.H. and Y.Y.; resources, Q.L. and X.H.; data curation, Q.L. and X.H.; writing—original draft preparation, Q.L., X.H. and J.R.; writing—review and editing, Q.L. and J.R.; visualization, X.H. and Y.Y.; supervision, Q.L. and J.R.; project administration, Q.L.; funding acquisition, J.R. All authors have read and agreed to the published version of the manuscript.

Funding

This research was funded by Shaanxi Provincial Department of Housing and Urban-Rural Development, grant number: 2021-K29; Science and Technology Department of Shaanxi Province, grant number: 2021JQ-260; and the Fundamental Research Funds for the Central Universities, CHD, grant number: 300102230201.

Data Availability Statement

The data presented in this study are available on request from the corresponding author.

Conflicts of Interest

The authors declare no conflict of interest.

References

  1. Wilde, P.D. Ten questions concerning building performance analysis. Build. Environ. 2019, 153, 110–117. [Google Scholar]
  2. Markus, T.; Whyman, P.; Morgan, J.; Whitton, D.; Maver, T.; Canter, D.; Fleming, J. Building Performance; Applied Science Publishers: London, UK, 1972. [Google Scholar]
  3. Preiser, W.; Vischer, J. Assessing Building Performance; Elsevier: Oxford, UK, 2005. [Google Scholar]
  4. Sisi, L.; Weimin, Z. Building Performance Assessment: Ensuring Full Life Cycle and Environmental Sustainability of Buildings—Review of Building Performance Assessment. Architect 2007, 2, 147–150. [Google Scholar]
  5. GB/T 50378-2019; Assessment Standard for Green Building. Ministry of Housing and Urban-Rural Development of the People’s Republic of China: Beijing, China, 2019; pp. 95–101.
  6. Legates, T.A.; Fernandez, D.C.; Hattar, S. Light as a central modulator of circadian rhythms, sleep and affect. Nat. Rev. Neurosci. 2014, 15, 443–454. [Google Scholar] [PubMed]
  7. Cho, Y.; Ryu, S.H.; Lee, B.R.; Kim, K.H.; Lee, E.; Choi, J. Effects of artificial light at night on human health: A literature review of observational and experimental studies applied to exposure assessment. Chronobiol. Int. 2015, 32, 1294–1310. [Google Scholar] [CrossRef] [PubMed]
  8. Eltaweel, A.; Su, Y. Parametric design and daylighting: A literature review. Renew. Sustain. Energy Rev. 2017, 73, 1086–1103. [Google Scholar] [CrossRef]
  9. Lorenz, C.L.; Spaeth, A.B.; de Souza, C.B.; Packianather, M.S. Artificial neural networks for parametric daylight design. Archit. Sci. Rev. 2019, 63, 210–221. [Google Scholar] [CrossRef]
  10. Wagdy, A.; Fathy, F. A parametric approach for achieving optimum daylighting performance through solar screens in desert climates. J. Build. Eng. 2015, 3, 155–170. [Google Scholar] [CrossRef]
  11. Alsukkar, M.; Hu, M.; Gadi, M.; Su, Y. A Study on Daylighting Performance of Split Louver with Simplified Parametric Control. Buildings 2022, 12, 594. [Google Scholar] [CrossRef]
  12. Alsukkar, M.; Hu, M.; Eltaweel, A.; Su, Y. Daylighting performance improvements using of split louver with parametrically incremental slat angle control. Energy Build. 2022, 274, 112444. [Google Scholar] [CrossRef]
  13. Eltaweel, A.; Su, Y.; Hafez, M.; Eltaweel, W. An automated louver with innovative parametrically-angled reflective slats: Prototyping and validation via using parametric control in Grasshopper along with Arduino board. Energy Build. 2020, 231, 110614. [Google Scholar] [CrossRef]
  14. Xue, Y.B.; Liu, W.H. A Study on Parametric Design Method for Optimization of Daylight in Commercial Building’s Atrium in Cold Regions. Sustainablility 2022, 14, 7667. [Google Scholar] [CrossRef]
  15. Yi, Y.K.; Tariq, A.; Park, J.; Barakat, D. Multi-Objective Optimization (MOO) of a Skylight Roof System for Structure Integrity, Daylight, and Material Cost. J. Build. Eng. 2021, 34, 102056. [Google Scholar] [CrossRef]
  16. El-Abd, W.; Kamel, B.; Afify, M.; Dorra, M. Assessment of skylight design configurations on daylighting performance in shopping malls: A case study. Sol. Energy 2018, 170, 358–368. [Google Scholar] [CrossRef]
  17. Motamedi, S.; Liedl, P. Integrative algorithm to optimize skylights considering fully impacts of daylight on energy. Energy Build. 2017, 138, 655–665. [Google Scholar] [CrossRef]
  18. Hachem, C.; Athienitis, A.; Fazio, P. Parametric investigation of geometric form effects on solar potential of housing units. Sol. Energy 2011, 85, 1864–1877. [Google Scholar] [CrossRef]
  19. Zhang, L.W.; Zhang, L.L.; Wang, Y.T. Shape optimization of free-form buildings based on solar radiation gain and space efficiency using a multi-objective genetic algorithm in the severe cold zones of China. Sol. Energy 2016, 132, 38–50. [Google Scholar] [CrossRef]
  20. Kim, H.J.; Choi, W.S.; Kim, J.W. A study on parametric design tool for residential buildings securing valid sunlight hours on the winter solstice. J. Asian Archit. Build. Eng. 2022, 21, 1657–1676. [Google Scholar] [CrossRef]
  21. Rashwan, A.; Gizawi, L.; Sheta, S. Evaluation of the effect of integrating building envelopes with parametric patterns on daylighting performance in office spaces in hot-dry climate—ScienceDirect. Alex. Eng. J. 2019, 58, 551–557. [Google Scholar] [CrossRef]
  22. Eisazadeh, N.; Allacker, K.; Troyer, F.D. Integrated energy, daylighting and visual comfort analysis of window systems in patient rooms. Sci. Technol. Built Environ. 2021, 27, 1040–1055. [Google Scholar] [CrossRef]
  23. Yuan, F.; Cho, S. Design optimization of building geometry and fenestration for daylighting and energy performance. Sol. Energy 2019, 191, 7–18. [Google Scholar]
  24. Cammarano, S.; Pellegrino, A.; Lo Verso, V.R.M.; Aghemo, C. Assessment of daylight in rooms with different architectural features. Build. Res. Inf. 2015, 43, 222–237. [Google Scholar] [CrossRef]
  25. Mahmoud, A.H.A.; Elghazi, Y. Parametric-based designs for kinetic facades to optimize daylight performance: Comparing rotation and translation kinetic motion for hexagonal facade patterns. Sol. Energy 2016, 126, 111–127. [Google Scholar] [CrossRef]
  26. Hosseini, S.M.; Mohammadi, M.; Schrder, T.; Guerra-Santin, O. Integrating interactive kinetic facade design with colored glass to improve daylight performance based on occupants’ position. J. Build. Eng. 2020, 31, 101404. [Google Scholar] [CrossRef]
  27. Lin, C.H.; Tsay, Y.S. A metamodel based on intermediary features for daylight performance prediction of facade design. Build. Environ. 2021, 206, 108371. [Google Scholar] [CrossRef]
  28. Hosseini, S.M.; Mohammadi, M.; Guerra-Santin, O. Interactive kinetic facade: Improving visual comfort based on dynamic daylight and occupant’s positions by 2D and 3D shape changes. Build. Environ. 2019, 165, 106396. [Google Scholar] [CrossRef]
  29. Yi, Y.K. Building facade multi-objective optimization for daylight and aesthetical perception. Build. Environ. 2019, 156, 178–190. [Google Scholar] [CrossRef]
  30. Xs, A.; At, B.; Lw, A. Influence of two motion types on solar transmittance and daylight performance of dynamic faades. Sol. Energy 2020, 201, 561–580. [Google Scholar]
  31. Flor, J.F.; Liu, X.; Sun, Y.; Beccarelli, P.; Chilton, J.; Wu, Y. Switching daylight: Performance prediction of climate adaptive ETFE foil facades. Build. Environ. 2022, 209, 108650. [Google Scholar]
  32. Gao, Q.; Yang, Y.; Wang, Q. An integrated simulation method for PVSS parametric design using multi-objective optimization. Front. Archit. Res. 2022, 11, 509–526. [Google Scholar] [CrossRef]
  33. Jayathissa, P.; Caranovic, S.; Hofer, J.; Nagy, Z.; Schlueter, A. Performative design environment for kinetic photovoltaic architecture. Autom. Constr. 2018, 93, 339–347. [Google Scholar] [CrossRef]
  34. Bakmohammadi, P.; Noorzai, E. Investigating the optimization potential of daylight, energy and occupant satisfaction performance in classrooms using innovative photovoltaic integrated light shelf systems. Sci. Technol. Built Environ. 2022, 28, 467–482. [Google Scholar] [CrossRef]
  35. Cheng, Y.; Gao, M.; Jia, J.; Sun, Y.; Fan, Y.; Yu, M. An optimal and comparison study on daylight and overall energy performance of double-glazed photovoltaics windows in cold region of China. Energy 2019, 170, 356–366. [Google Scholar] [CrossRef]
  36. Nadiri, P.; Mahdavinejad, M.; Pilechiha, P. Optimization of Building Faade to Control Daylight Excessiveness and View to Outside. Sciendo 2019, 9, 161–168. [Google Scholar]
  37. Chi, D.A.; Moreno, D.; Navarro, J. Impact of perforated solar screens on daylight availability and low energy use in offices. Adv. Build. Energy Res. 2021, 15, 117–141. [Google Scholar] [CrossRef]
  38. Anzaniyan, E.; Alaghmandan, M.; Koohsari, A.M. Design, fabrication and computational simulation of a bio-kinetic facade inspired by the mechanism of the Lupinus Succulentus plant for daylight and energy efficiency. Sci. Technol. Built Environ. 2022, 28, 1456–1471. [Google Scholar] [CrossRef]
  39. Bande, L.; Hamad, H.; Alqahtani, D.; Alnahdi, N.; Ghunaim, A.; Fikry, F.; Alkhatib, O. Design of Innovative Parametric/Dynamic Facade Integrated in the Library Extension Building on UAEU Campus. Buildings 2022, 12, 1101. [Google Scholar] [CrossRef]
  40. Chi, D.A.; Moreno, D.; Navarro, J. Design optimisation of perforated solar facades in order to balance daylighting with thermal performance. Build. Environ. 2017, 125, 383–400. [Google Scholar] [CrossRef]
  41. Abediniangerabi, B.; Makhmalbaf, A.; Shahandashti, M. Deep learning for estimating energy savings of early-stage facade design decisions. Energy AI 2021, 5, 100077. [Google Scholar] [CrossRef]
  42. Ekici, B.; Cubukcuoglu, C.; Turrin, M.; Sariyildiz, I.S. Performative computational architecture using swarm and evolutionary optimisation: A review. Build. Environ. 2018, 147, 356–371. [Google Scholar] [CrossRef]
  43. Khalil, R.; El-Kordy, A.; Sobh, H. A review for using swarm intelligence in architectural engineering. Int. J. Archit. Comput. 2022, 20, 254–276. [Google Scholar] [CrossRef]
  44. Sariyildiz, I.S. Performative computational design, Keynote speech. In Proceedings of the ICONARCH-I: International Congress of Architecture-I, Selcuk University, Konya, Turkey, 15–17 November 2012. [Google Scholar]
  45. Machairas, V.; Tsangrassoulis, A.; Axarli, K. Algorithms for optimization of building design: A review, Renew. Sustain. Energy Rev. 2014, 31, 101–112. [Google Scholar]
  46. Evins, R. A review of computational optimisation methods applied to sustainable building design, Renew. Sustain. Energy Rev. 2013, 22, 230–245. [Google Scholar]
  47. Ciftcioglu, O.; Sariyildiz, I.S.; Bittermann, M.S. Building performance analysis supported by GA. In Proceedings of the IEEE Congress on Evolutionary Computation, CEC 2007, Singapore, 25–28 September 2007; pp. 859–866. [Google Scholar]
  48. Blum, C.; Li, X. Swarm Intelligence in Optimization. Swarm Intelligence; Springer: Berlin/Heidelberg, Germany, 2008; pp. 43–85. [Google Scholar]
  49. Mitchell, M.; Taylor, C.E. Evolutionary computation: An overview. Annu. Rev. Ecol. Syst. 1999, 30, 593–616. [Google Scholar] [CrossRef]
  50. Jalali, Z.; Noorzai, E.; Heidari, S. Design and optimization of form and facade of an office building using the genetic algorithm. Sci. Technol. Built Environ. 2019, 26, 128–140. [Google Scholar] [CrossRef]
  51. Taveres-Cachat, E.; Lobaccaro, G.; Goia, F.; Chaudhary, G. A methodology to improve the performance of PV integrated shading devices using multi-objective optimization. Appl. Energy 2019, 247, 731–744. [Google Scholar] [CrossRef]
  52. Luan, L.T.; Le-Duc, T.; Ngo-Minh, H.; Nguyen, Q.-H.; Nguyen-xuan, H. Optimal design of an Origami-inspired kinetic faade by balancing composite motion optimization for improving daylight performance and energy efficiency. Energy 2021, 219, 119557. [Google Scholar]
  53. Ekici, B.; Kazanasmaz, Z.T.; Turrin, M.; Taşgetiren, M.F.; Sariyildiz, I.S. Multi-zone optimisation of high-rise buildings using artificial intelligence for sustainable metropolises. Part 1: Background, methodology, setup, and machine learning results. Sol. Energy 2021, 224, 373–389. [Google Scholar] [CrossRef]
  54. Ekici, B.; Kazanasmaz, Z.; Tuğçe, T.M.; Taşgetiren, M.F.; Sariyildiz, I.S. Multi-zone optimisation of high-rise buildings using artificial intelligence for sustainable metropolises. Part 2: Optimisation problems, algorithms, results, and method validation. Sol. Energy 2021, 224, 309–326. [Google Scholar] [CrossRef]
  55. Weng, Z.Z.; Alfonso, P.; Ramallo, G.; Coley, D.A. The practical optimisation of complex architectural forms. Build. Simul. 2015, 8, 307–322. [Google Scholar] [CrossRef] [Green Version]
  56. Shen, H.; Tzempelikos, A.; Atzeri, A.M.; Gasparella, A. Dynamic Commercial Facades versus Traditional Construction: Energy Performance and Comparative Analysis. J. Energy Eng. 2015, 141, 04014041. [Google Scholar] [CrossRef]
  57. LEED V4 BD+C[S]; USGBC: Washington, DC, USA, 2016.
  58. GB 50033-2013; Standard for Daylighting Design of Buildings. Ministry of Housing and Urban-Rural Development of the People’s Republic of China: Beijing, China, 2013.
Figure 1. The campus library model (self-developed).
Energies 16 00832 g001
Figure 2. Parametric design method for library building light environment (self-developed).
Energies 16 00832 g002
Figure 3. Map of the dry bulb temperatures in Xi’an throughout the year.
Energies 16 00832 g003
Figure 4. Dimensions of library and reading room units (self-developed).
Energies 16 00832 g004
Figure 5. Parametric skin creation process (self-developed).
Energies 16 00832 g005
Figure 6. Parametric epidermal morphology generation results (self-developed).
Energies 16 00832 g006
Figure 7. Structure of the epidermal unit of the triangle (self-developed).
Energies 16 00832 g007
Figure 8. Simulation methods for (a) sunlight hours and (b) sunlight radiation (self-developed).
Energies 16 00832 g008
Figure 9. Simulation results of sunshine hours (a) and sunshine radiation (b) in the official Ladybug Tools sample file.
Energies 16 00832 g009
Figure 10. Simulation results for (a) summer solstice sunlight hours, (b) summer solstice sunlight radiation, (c) winter solstice sunlight hours, and (d) winter solstice sunlight radiation (self-developed).
Energies 16 00832 g010
Figure 11. (a) Photothermal data of skin interference method and (b) effect of skin cell change (self-developed).
Energies 16 00832 g011
Figure 12. Four different skin types, A-D (self-developed).
Energies 16 00832 g012
Figure 13. Environmental lighting performance simulation process (self-developed).
Energies 16 00832 g013
Figure 14. (a) Simulated room, (b) light intensity simulation grid, (c) glare simulation view (self-developed).
Energies 16 00832 g014
Figure 15. Percentage of area with different hours of illumination greater than 300l× in (a) Room 1, (b) Room 2, (c) Room 3, and (d) Room 4 on the summer solstice (6.21) (self-developed).
Energies 16 00832 g015
Figure 16. Percentage of the area with different hours of illumination greater than 300l× in (a) Room 1, (b) Room 2, (c) Room 3, and (d) Room 4 on the winter solstice (12.21) (self-developed).
Energies 16 00832 g016
Figure 17. Percentage of the area with different hours of illumination in the range of 450–3000l× in (a) Room 1, (b) Room 2, (c) Room 3, and (d) Room 4 on the summer solstice (6.21) (self-developed).
Energies 16 00832 g017
Figure 18. Percentage of the area with different hours of illumination in the range of 450–3000l× in (a) Room 1, (b) Room 2, (c) Room 3, and (d) Room 4 on the winter solstice (12.21) (self-developed).
Energies 16 00832 g018
Figure 19. DGP for (a) Room 1, (b) Room 2, (c) Room 3, and (d) and Room 4 on the summer solstice (6.21) (self-developed).
Energies 16 00832 g019
Figure 20. DGP for (a) Room 1, (b) Room 2, (c) Room 3, and (d) and Room 4 on the winter solstice (12.21) (self-developed).
Energies 16 00832 g020
Table 1. Selected representative research papers about building façades (self-developed).
Author/YearBuilding TypeFaçadeVariable ParameterPlatformOptimization ObjectiveMethod
Mahmoud AHA, et al./2016 [25]Office buildingDynamic façade (kinetic façades)Rotation motion, translation motionGrasshopper + DIVADaylightParametric modeling, simulation
Hosseini S M, et al./2020 [26]Traditional buildingDynamic façadeWindow glass color, interior space partitionsGrasshopper + DIVADaylightParametric modeling, simulation
Lin C H, et al./2022 [27]Office buildingFixed façadeAperture, aperture change rate, number of attraction points, random seed of attraction point positions, and panel thicknessGrasshopper + DIVA
Expert systems
DaylightParametric modeling, machine learning, artificial neural network
Yi Y K, et al./2019 [29]ApartmentFixed façadeSurface shape and amplitude, number of holes and sizeGrasshopperDaylight, aesthetic sensibilitiesParametric modeling, multiobjective optimization
Nadiri P, et al./2019 [36]Office buildingFixed façadeThe number, depth, angle, and thickness of south façade louversGrasshopper (Ladybug + Honeybee + Galapagos)Annual sun exposure, view to outsideParametric modeling, simulation, optimization
Chi D A, et al./2021 [37]Office buildingFixed façade (perforated solar screens)Orientations, perforation percentage, matrix, shapeGrasshopper + DIVA + Energy PlusDaylight, thermal analysisParametric modeling, simulation
Anzaniyan E, Chi D A, et al./2022 [38]Office buildingDynamic façade (biokinetic façade)Panel angleGrasshopper (Ladybug + Honeybee)Daylight, energyParametric modeling, simulation
Bande L, et al./2022 [39]Campus libraryDynamic façadeFolding modeREVIT + Grasshopper (Ladybug, Honeybee, and Daysim)Daylight energyParametric modeling, simulation
Chi D A, et al./2017 [40]Office buildingFixed façade (perforated solar screens)Perforation percentage, matrix, shapeDIVA/Grasshopper/Archsim + EnergyPlusDaylight energyParametric modeling, orthogonal, array simulation
Table 2. Environmental response strategies (self-developed).
SeasonEnvironmental Response Strategies
SummerAvoid excessive heat and light in the room, focus on shade and protection from the sun, and prevent glare
WinterCombines shading and heat storage to prevent glare
Spring & AutumnFocus on shade and sun protection to prevent glare
Table 3. Interior light environment evaluation indicators and comfort ranges (self-developed).
IndicatorUnitComfort Range
Daylight autonomy (DA)%DA_300l× ≥ 50%
Useful daylight illuminance (UDI)%UDI (450~3000l×): an acceptable level of daylight
Daylight glare probability (DGP)%DGP ≤ 0.35: undetectable glare
Table 4. Parameter values for simulated rooms and shading objects (self-developed).
ReflectanceSpecularityRoughnessTransmittanceDiffuse ReflectanceDiffuse Transmittance
Ceiling0.7500.05---
Floor0.5800.05---
Wall0.7500.05---
Glass (Low-E 6 + 12A + 6c)---0.68--
Shade (PTFE)--0.05-0.010.4
Table 5. Photothermal parameters with a positive improvement in environmental lighting performance (self-developed).
The Percentage of the Area of the Room with Different Hours of Luminance Greater than 300l×The Percentage of the Area with Different Hours of Useful Daylight LuminanceDGP
Summer SolsticeWinter SolsticeSummer SolsticeWinter SolsticeSummer SolsticeWinter Solstice
SouthSunlight radiationSunlight radiationSunlight hoursSunlight radiationSunlight hoursSunlight hours
EastSunlight radiationSunlight hoursSunlight hoursSunlight hoursSunlight hoursSunlight hours
NorthSunlight radiationSunlight RadiationSunlight hoursSunlight radiationSunlight hoursSunlight Radiation
WestSunlight hoursSunlight hoursSunlight hoursSunlight hoursSunlight radiationSunlight hours
Disclaimer/Publisher’s Note: The statements, opinions and data contained in all publications are solely those of the individual author(s) and contributor(s) and not of MDPI and/or the editor(s). MDPI and/or the editor(s) disclaim responsibility for any injury to people or property resulting from any ideas, methods, instructions or products referred to in the content.