

A Review on Numerical Simulation of Hydrogen Production from Ammonia Decomposition


Abstract
: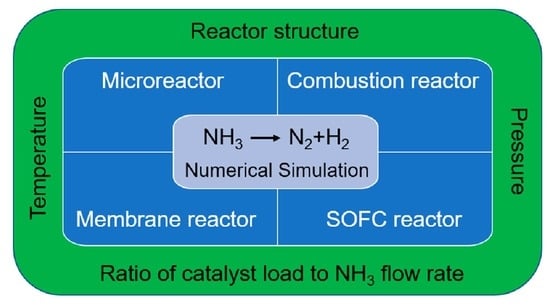
1. Introduction
2. Kinetics of NH3 Decomposition Reaction
3. Numerical Simulation of NH3 Decomposition in a Microreactor
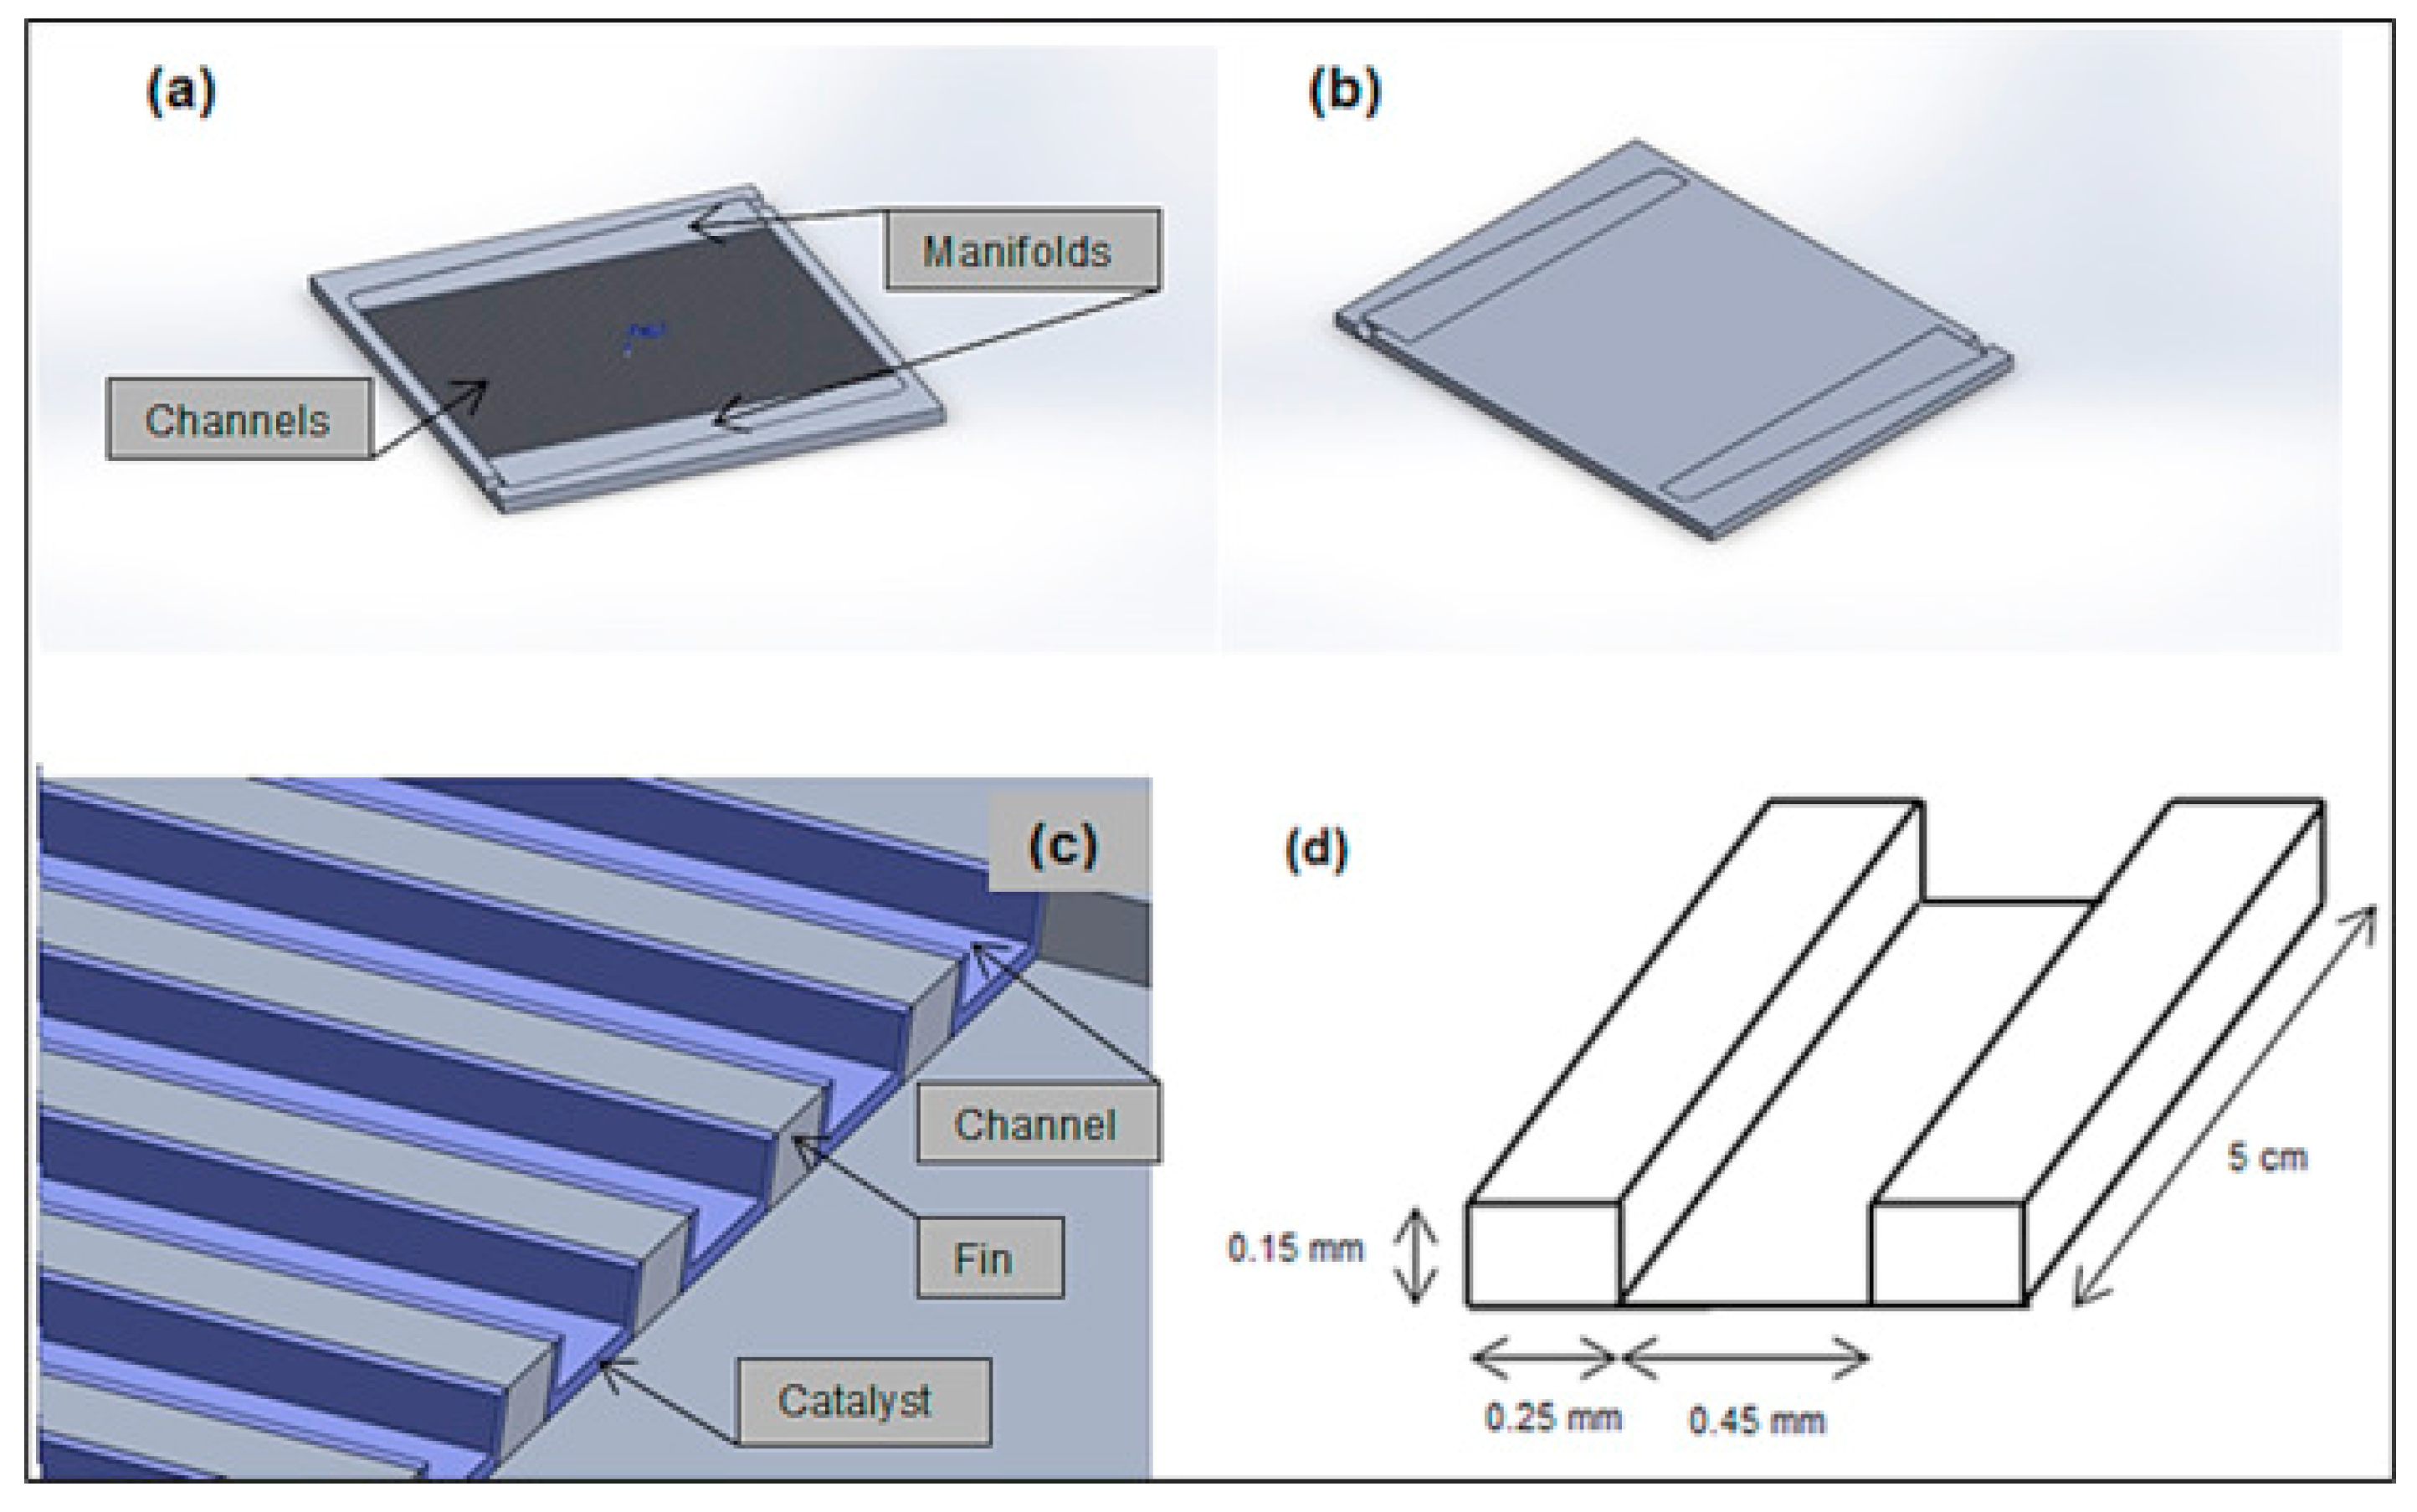
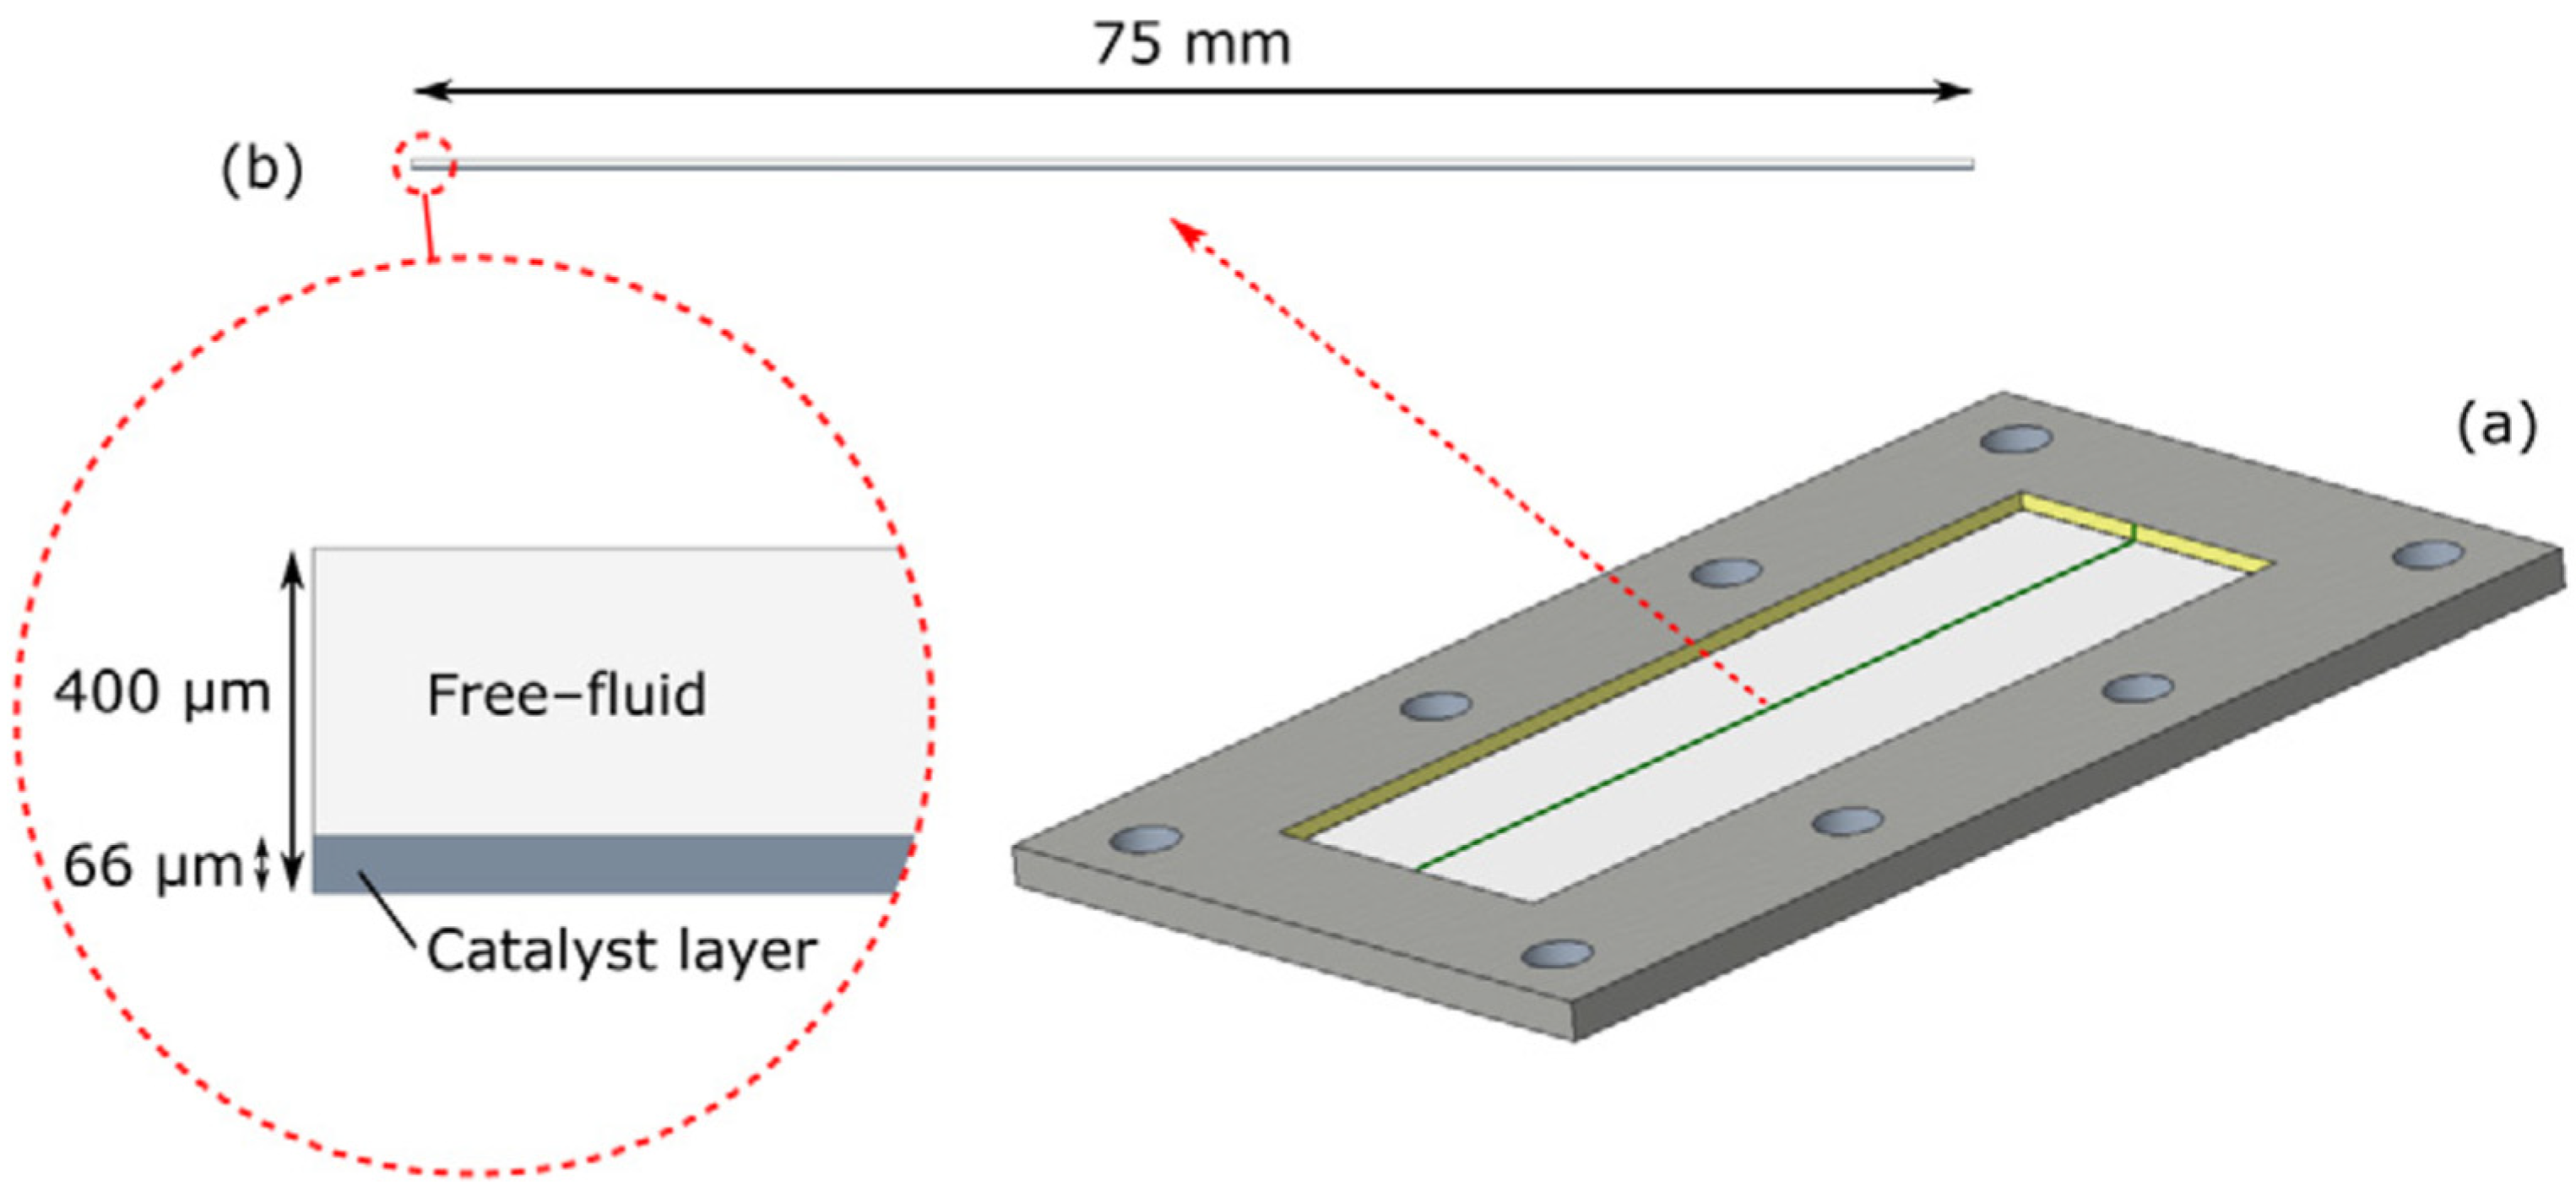
3.1. Description of NH3 Decomposition Model in a Microreactor
- (1)
- The flow is laminar and fully developed;
- (2)
- Gas types accord with ideal gas behavior;
- (3)
- Ignoring the homogeneous reaction in the bulk gas phase;
- (4)
- Negligible pressure drop due to small pressure drop in the reactor;
- (5)
- The catalyst layer is regarded as an isotropic porous medium;
- (6)
- Local thermal equilibrium is achieved between the gas mixture and catalyst layer;
- (7)
- For most channel microreactors, it is generally assumed that the intake distribution manifold distributes the fluid uniformly.
- (1)
- The concentration and velocity of gas at the inlet of the channel are specified, and the inlet velocity distribution is even;
- (2)
- A constant wall temperature is maintained to provide heat for the reaction;
- (3)
- At the outlet, the pressure is set to atmospheric pressure, and the temperature, velocity and species mass fraction obey Neumann boundary condition (i.e., the normal gradient is zero).
- (4)
- At all walls, No-slip velocity boundary condition is applied;
- (5)
- At the interface between the free fluid and catalyst, the velocity, pressure, temperature, and species flux continuity are obeyed.
3.2. Influence Factors on the Performance of NH3 Decomposition in a Microreactor
3.2.1. Effect of Operating Conditions
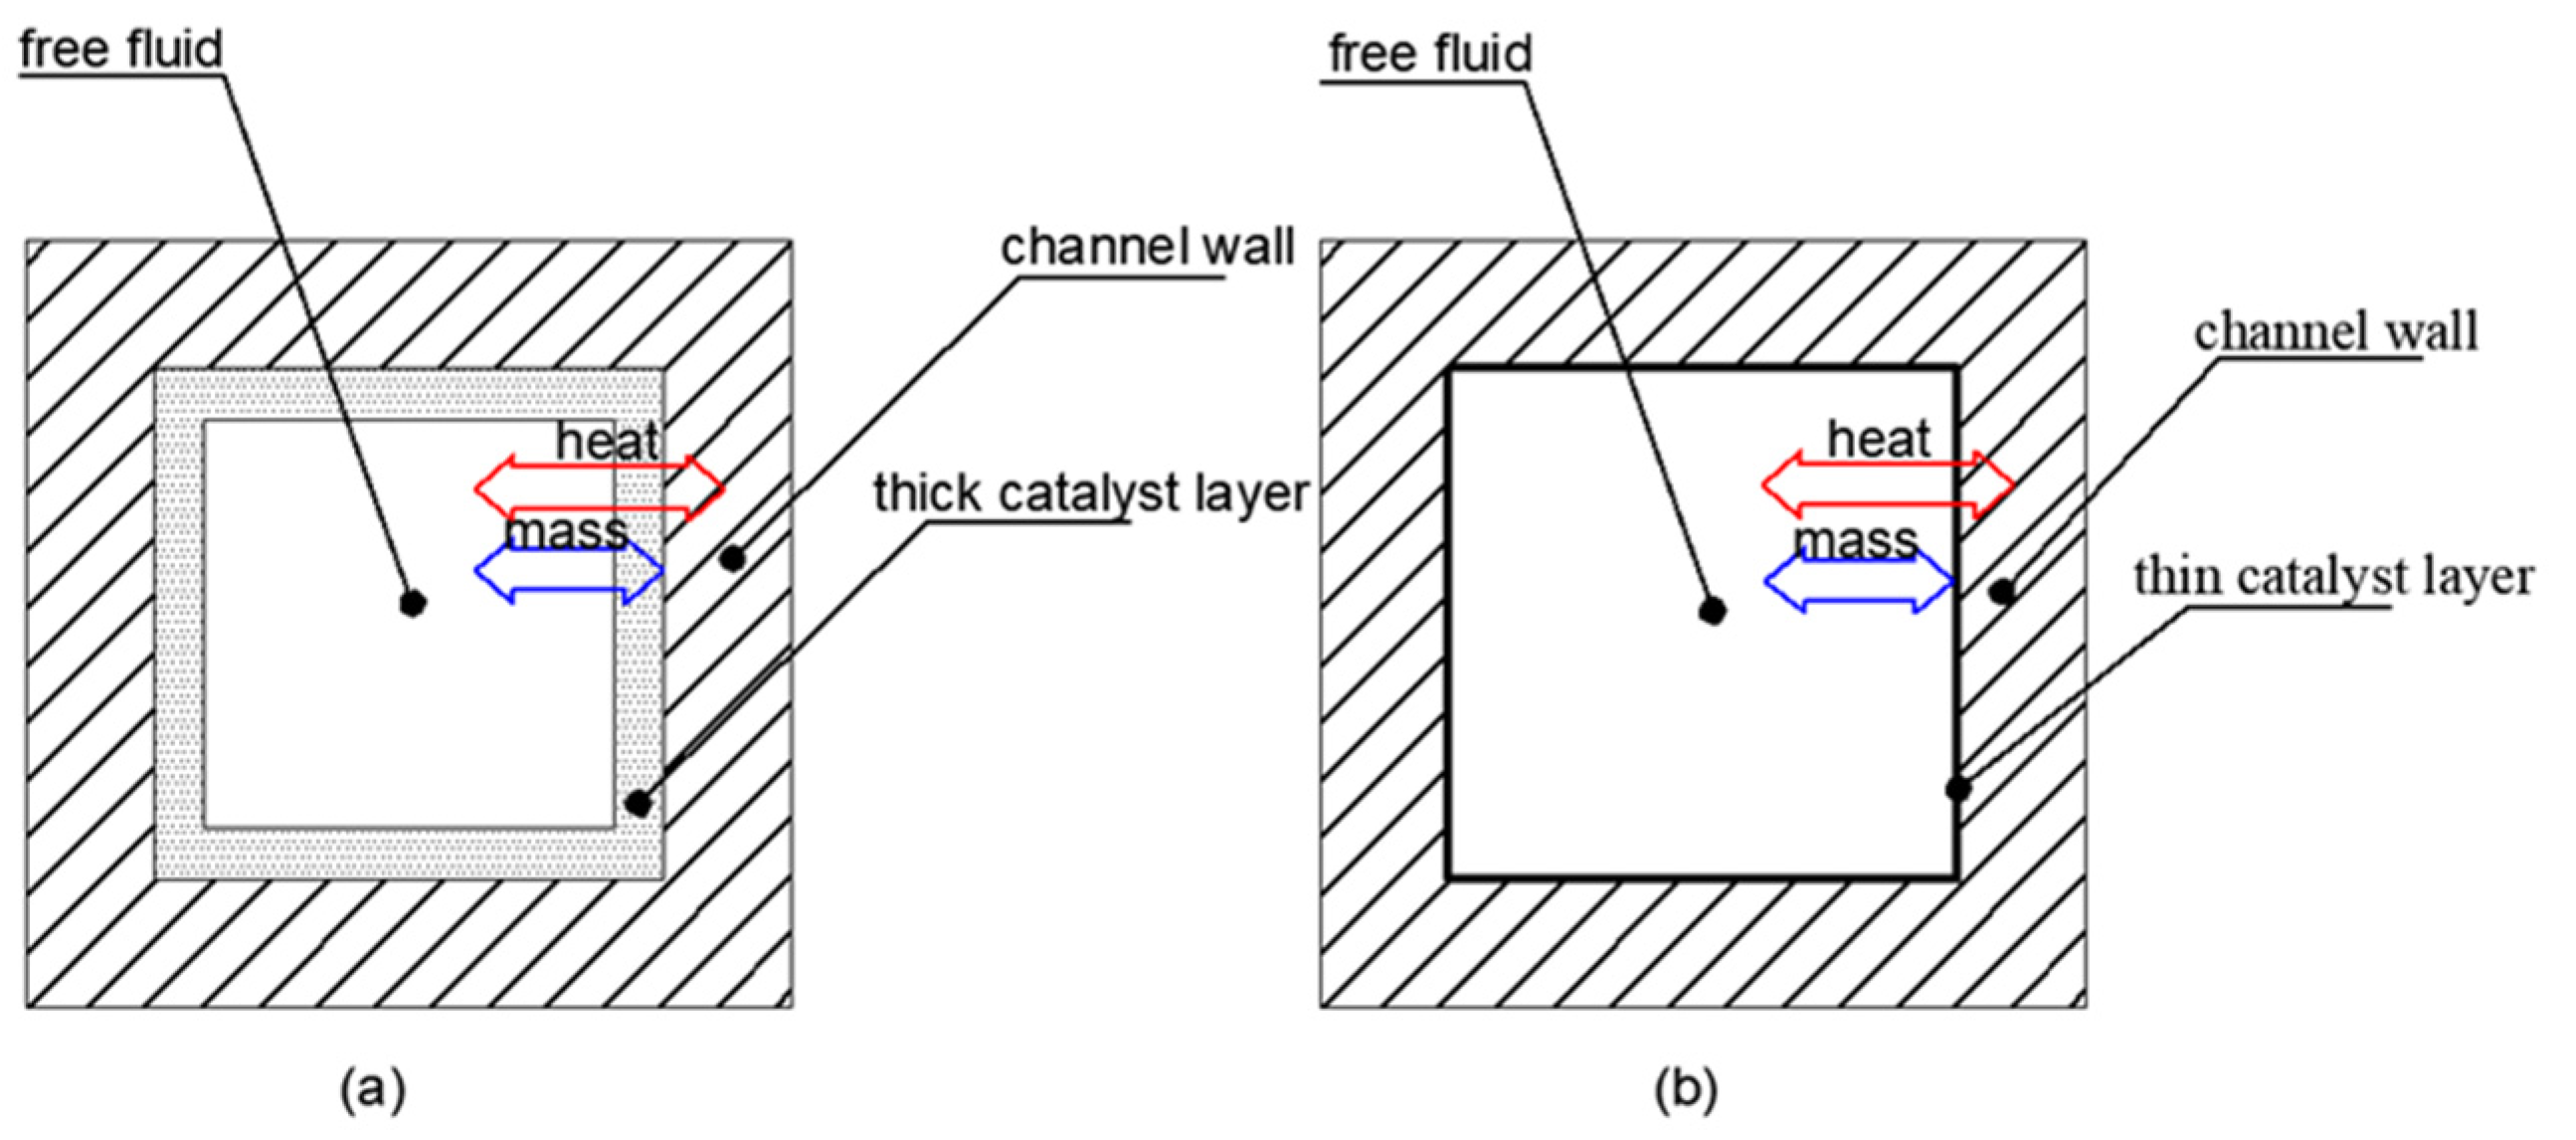
3.2.2. Effect of Mass Transfer
3.2.3. Effect of the Internal Structure
3.2.4. Effects of Concentration Jumps, Temperature Jumps, and Velocity Slips
4. Numerical Simulation of Coupled Combustion and Decomposition Reactions
4.1. Multifunctional Microreactor Model Description
- (1)
- At the inlet of the channel, the temperature and flow rate are constant and uniform.
- (2)
- The reactor outlet is maintained at a fixed pressure.
- (3)
- Neumann boundary condition is applied to the velocity, temperature, and species mass fraction at the outlet.
- (4)
- At all walls a no-slip boundary condition is applied for gas flow.
- (5)
- At all interfaces, the temperature and heat fluxes are continuous.
- (6)
- The device is adiabatic and no heat loss occurs at the sidewalls.
4.2. Homogeneous Combustion and Catalytic Combustion
4.3. Evaluation Index of Multifunctional Microreactor
4.3.1. Effect of Wall Parameters
4.3.2. Effects of Flow Rates of NH3 and Combustible Mixture
4.3.3. Impact of Flow Configuration
4.3.4. Effect of Other Factors
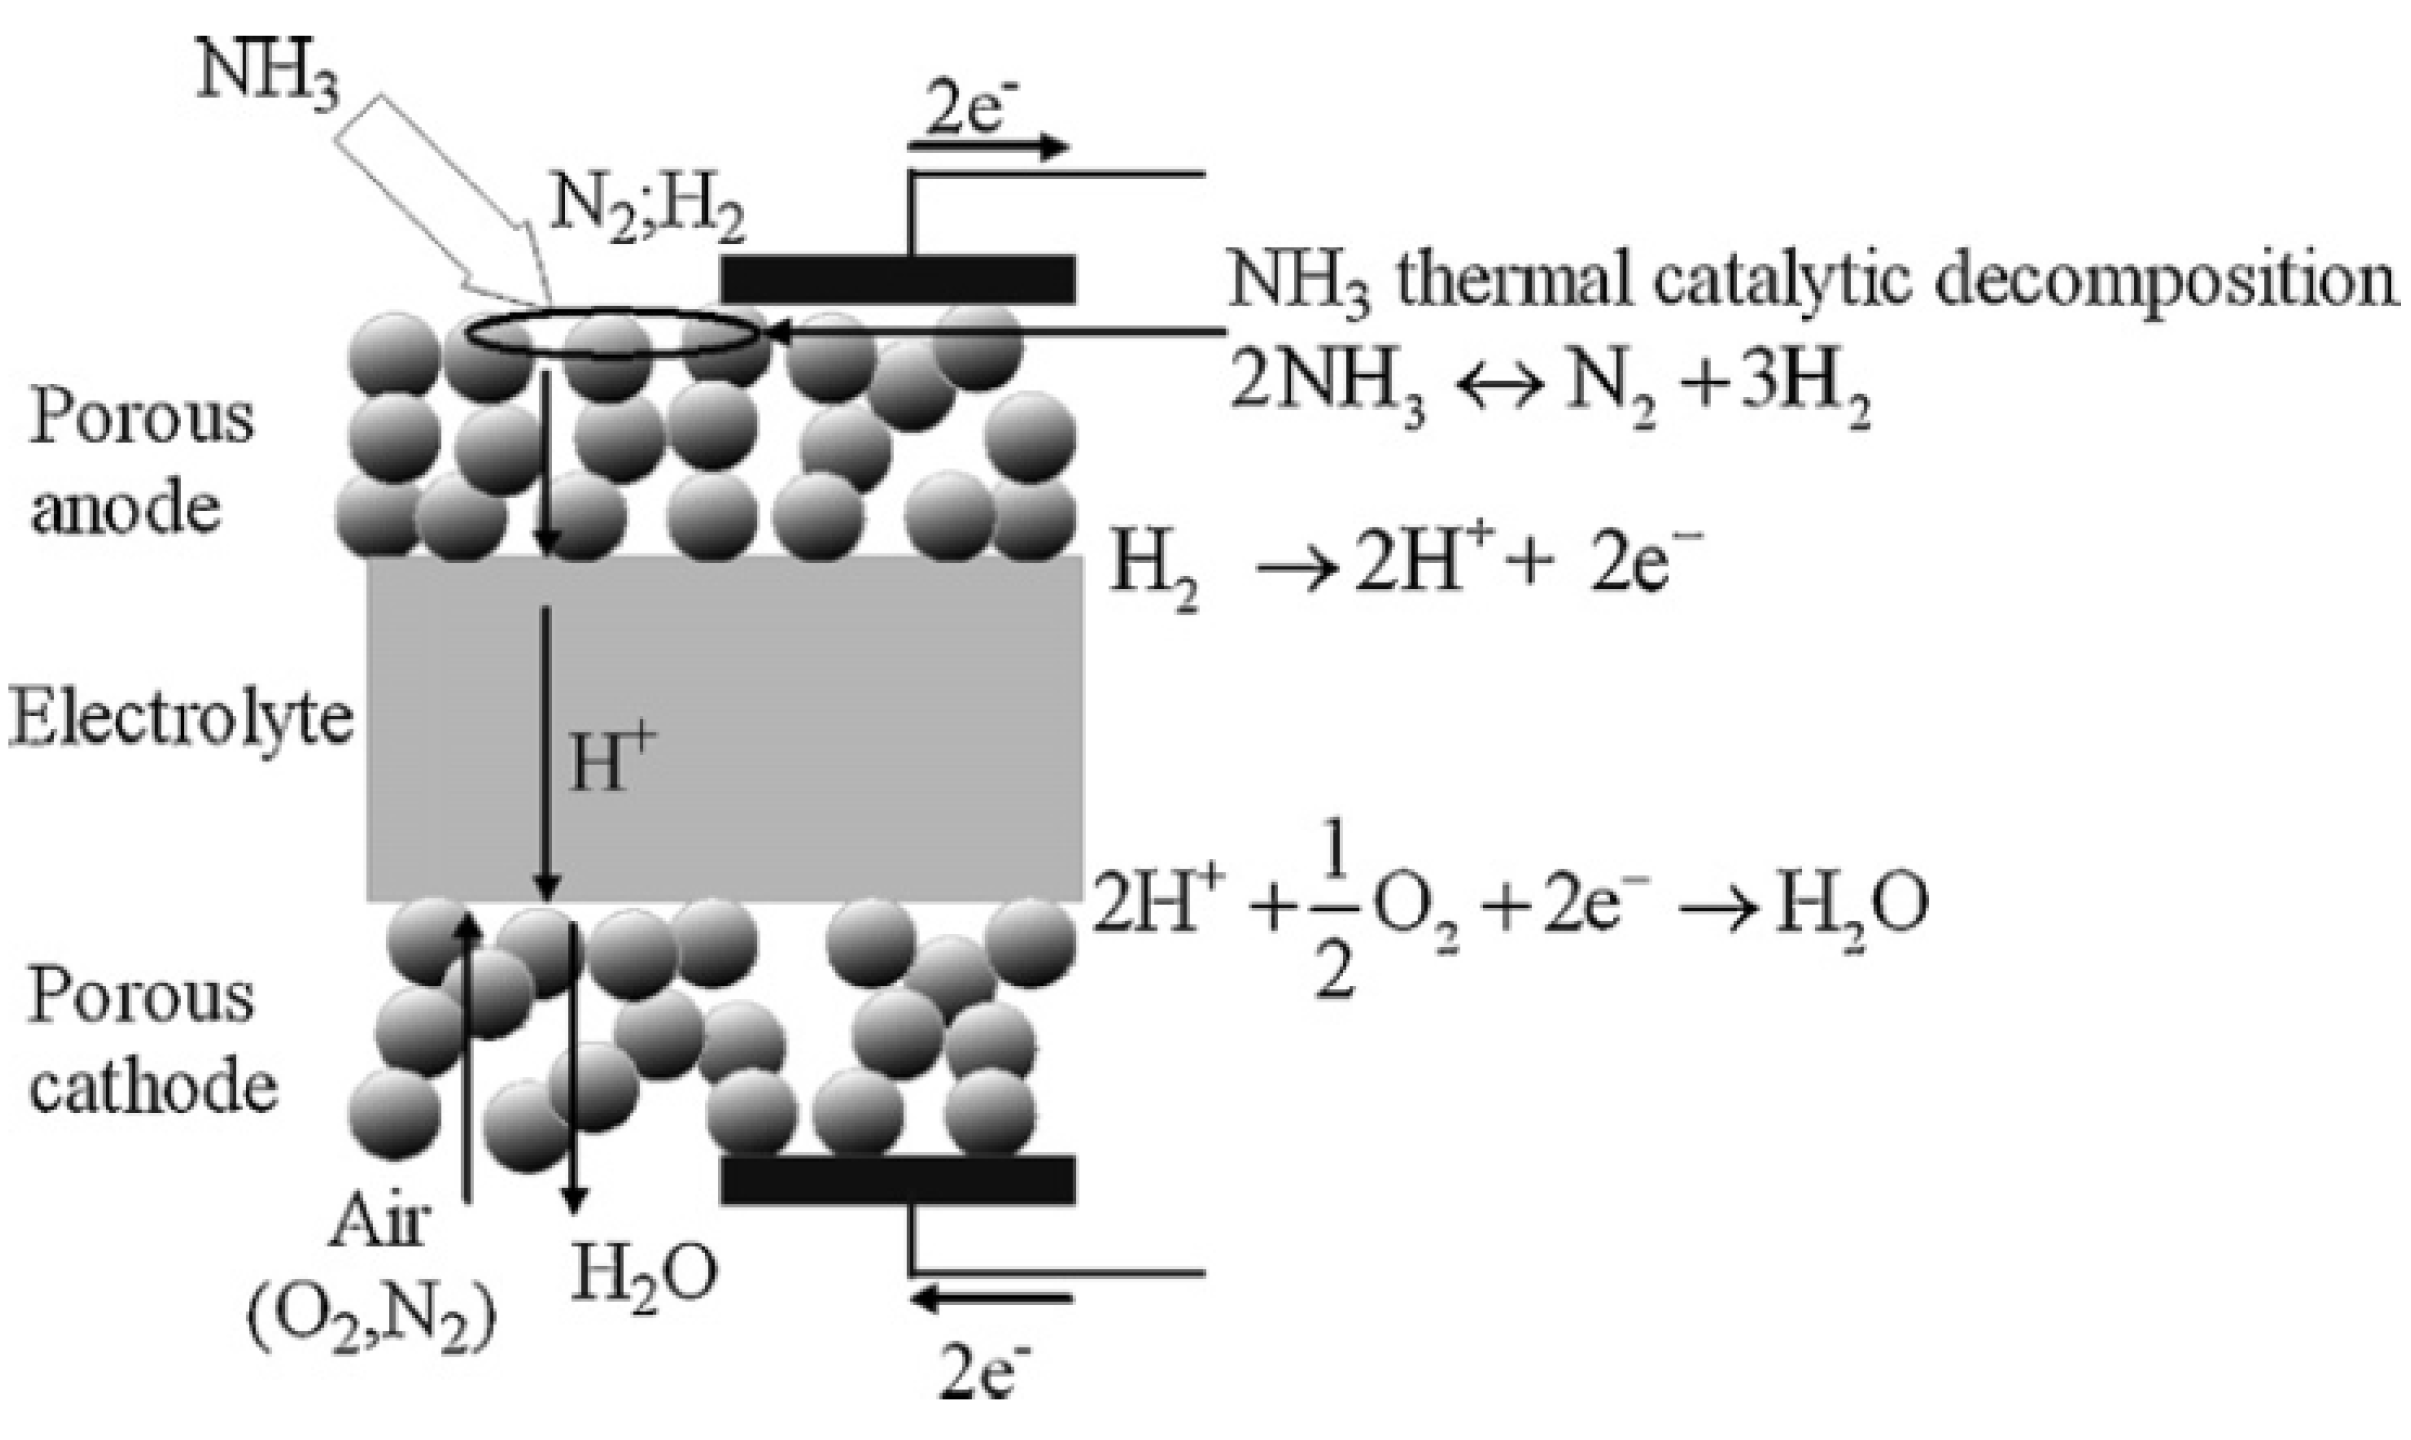
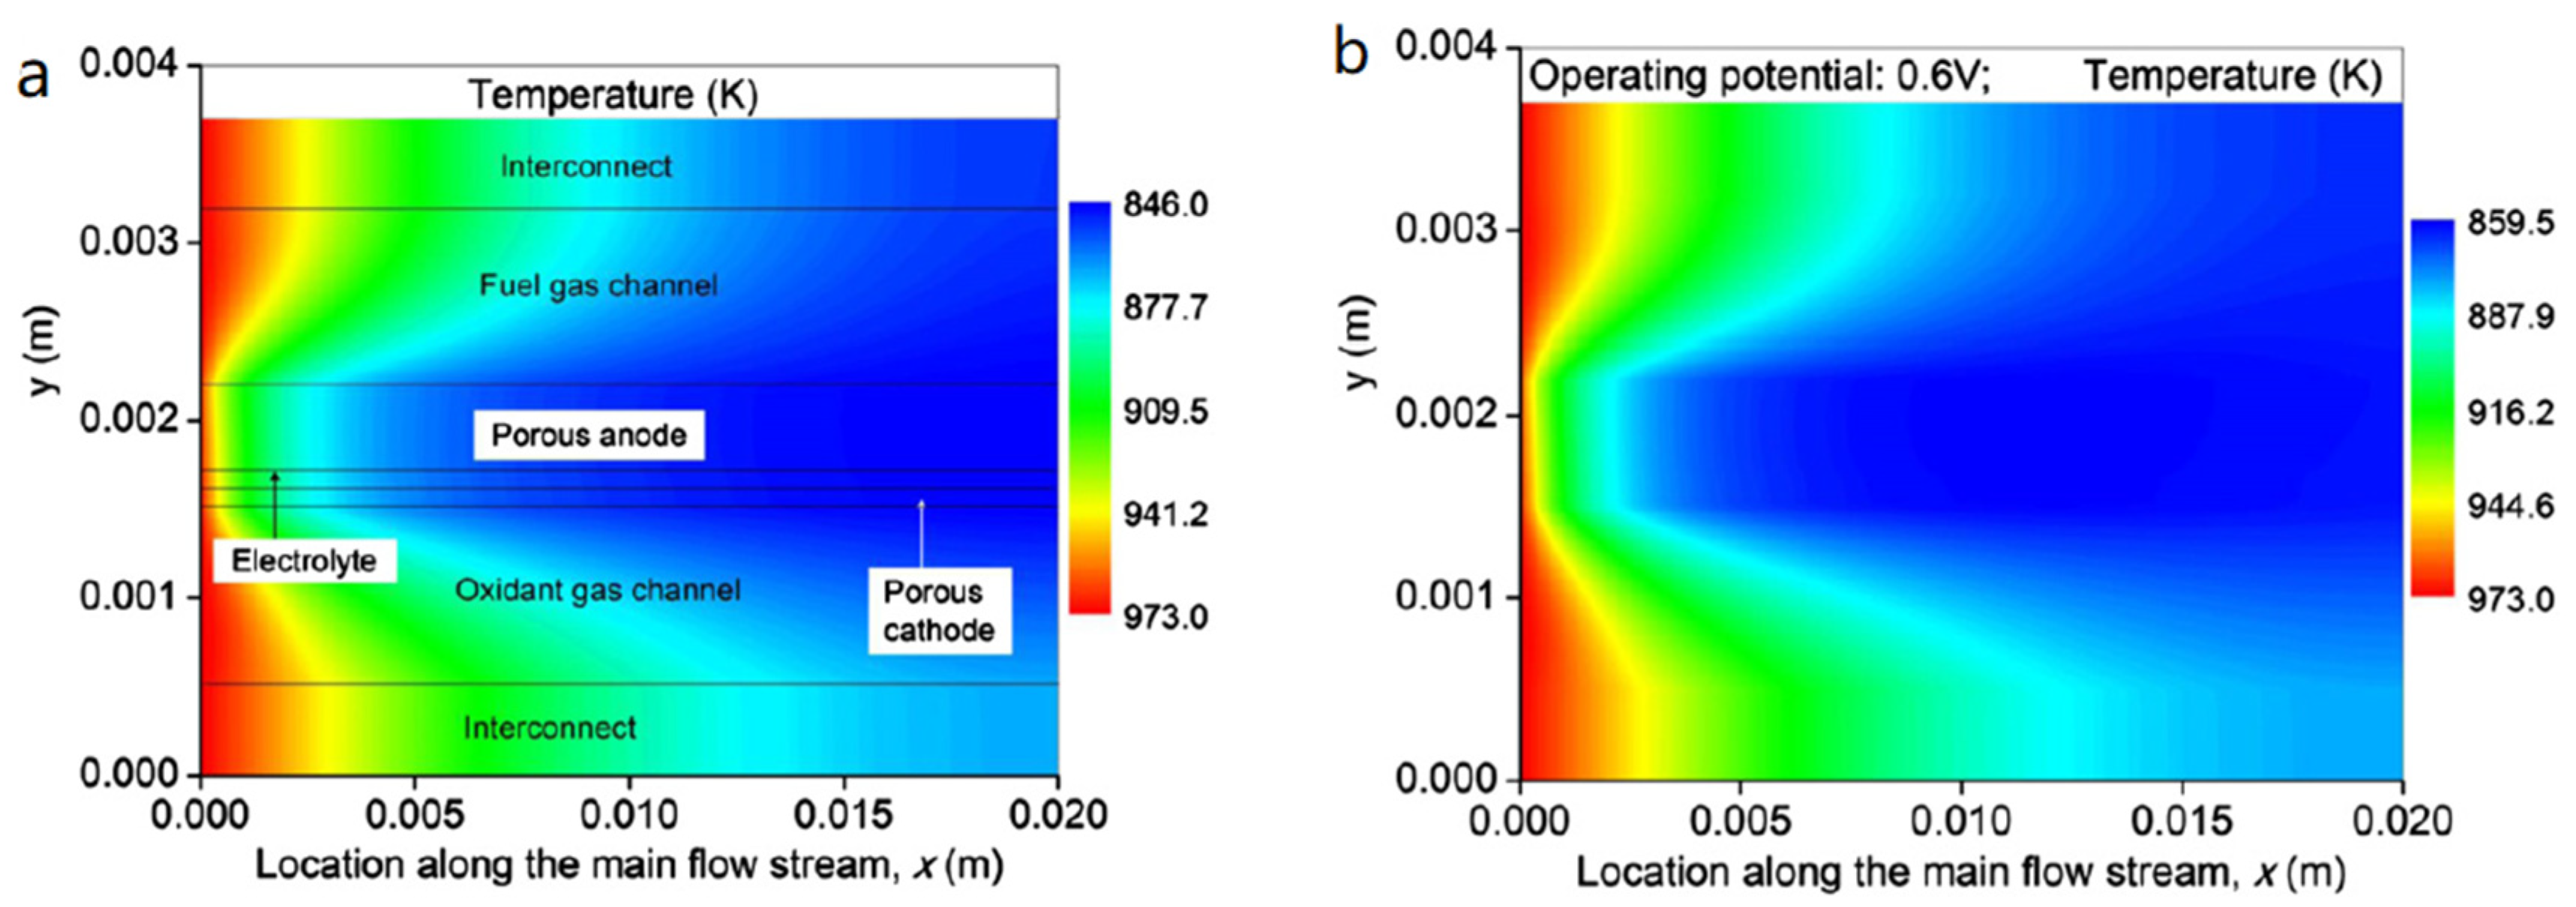
5. Numerical Simulation of NH3 Decomposition in SOFC
5.1. Description of SOFC Model
- (1)
- The NH3 decomposition is negligible at locations without a catalyst.
- (2)
- The electrochemical reaction involves only hydrogen and oxygen, and the electrochemical oxidation of NH3 is neglected.
- (3)
- At the electrode-electrolyte interface, the ohmic loss is negligible.
5.2. Effect of Temperature
5.3. Temperature Distribution in the SOFC
5.4. Effect of Operating Potential
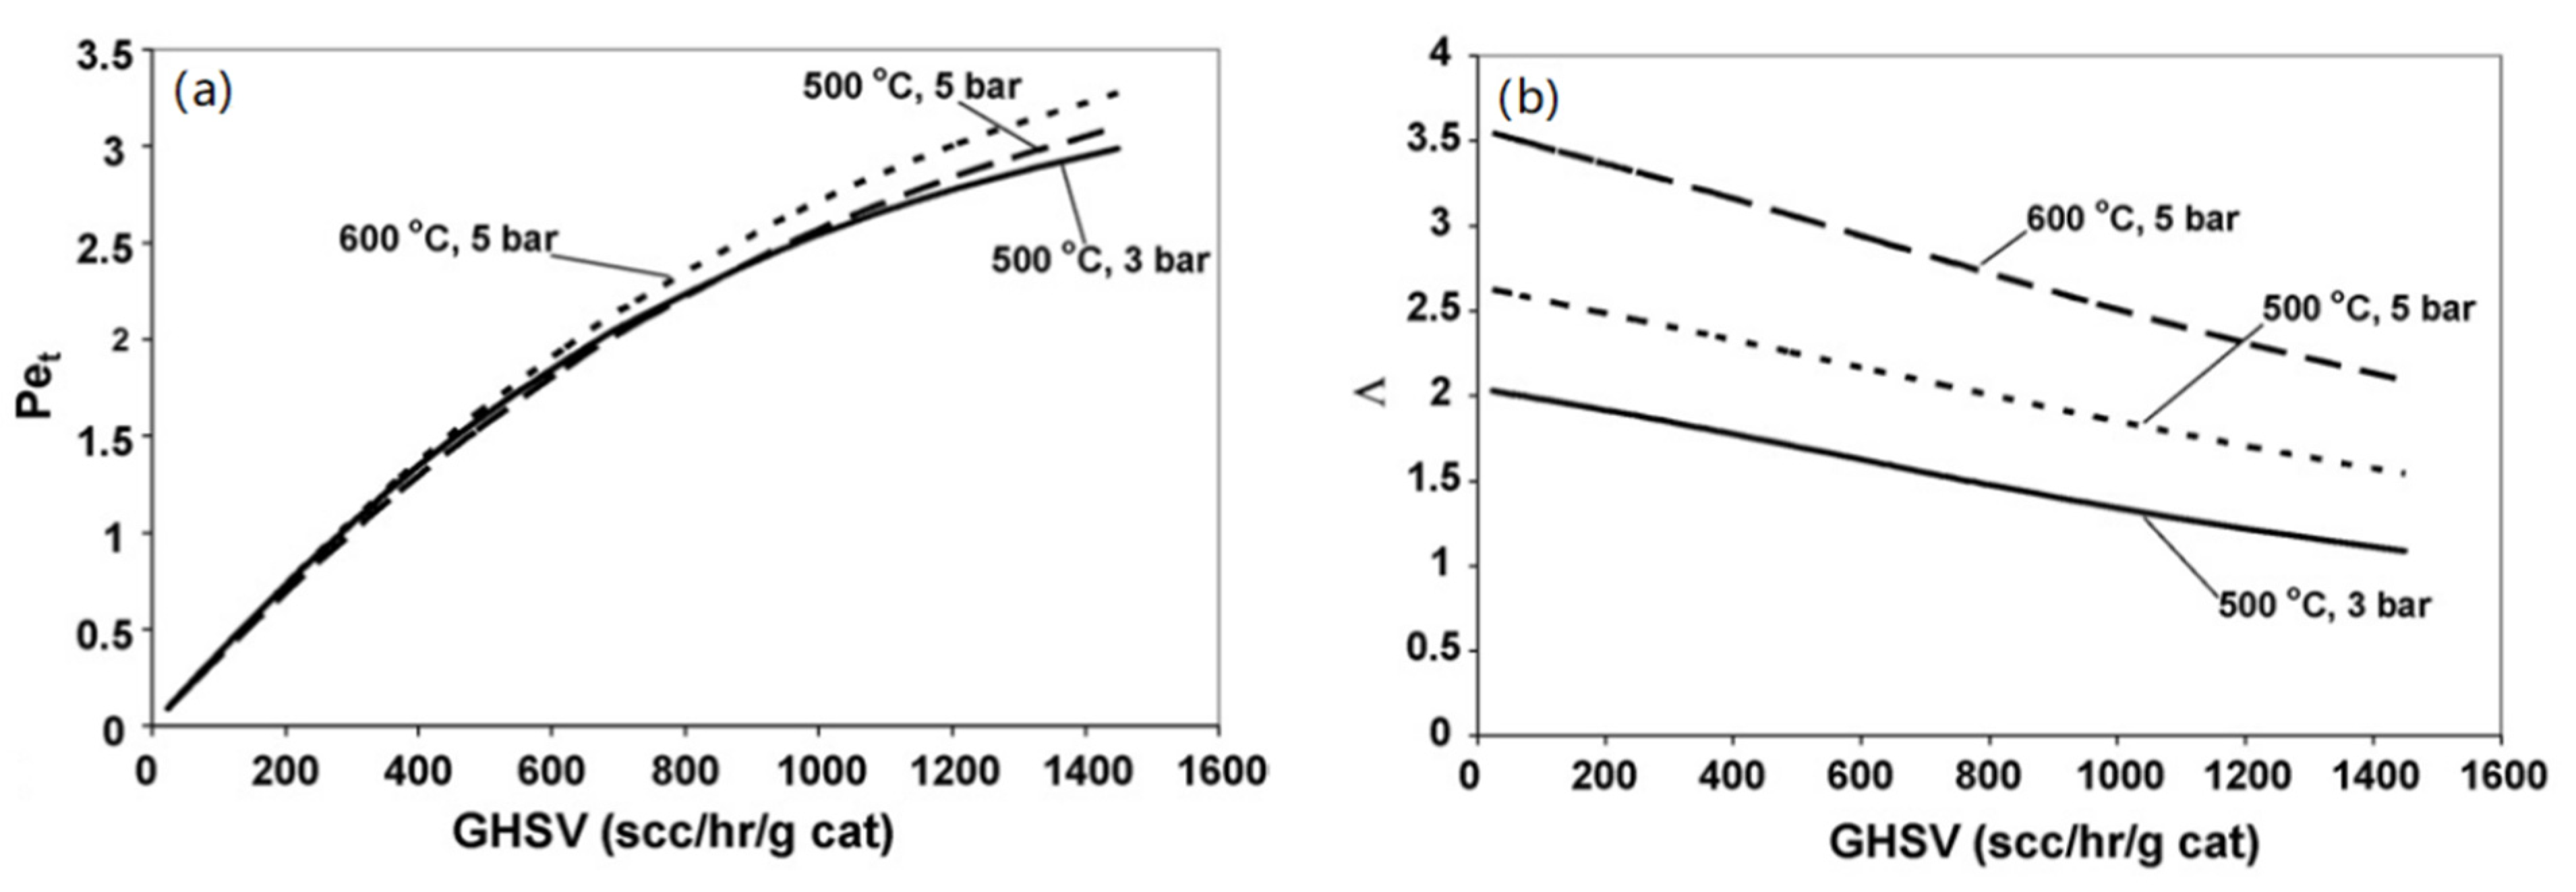
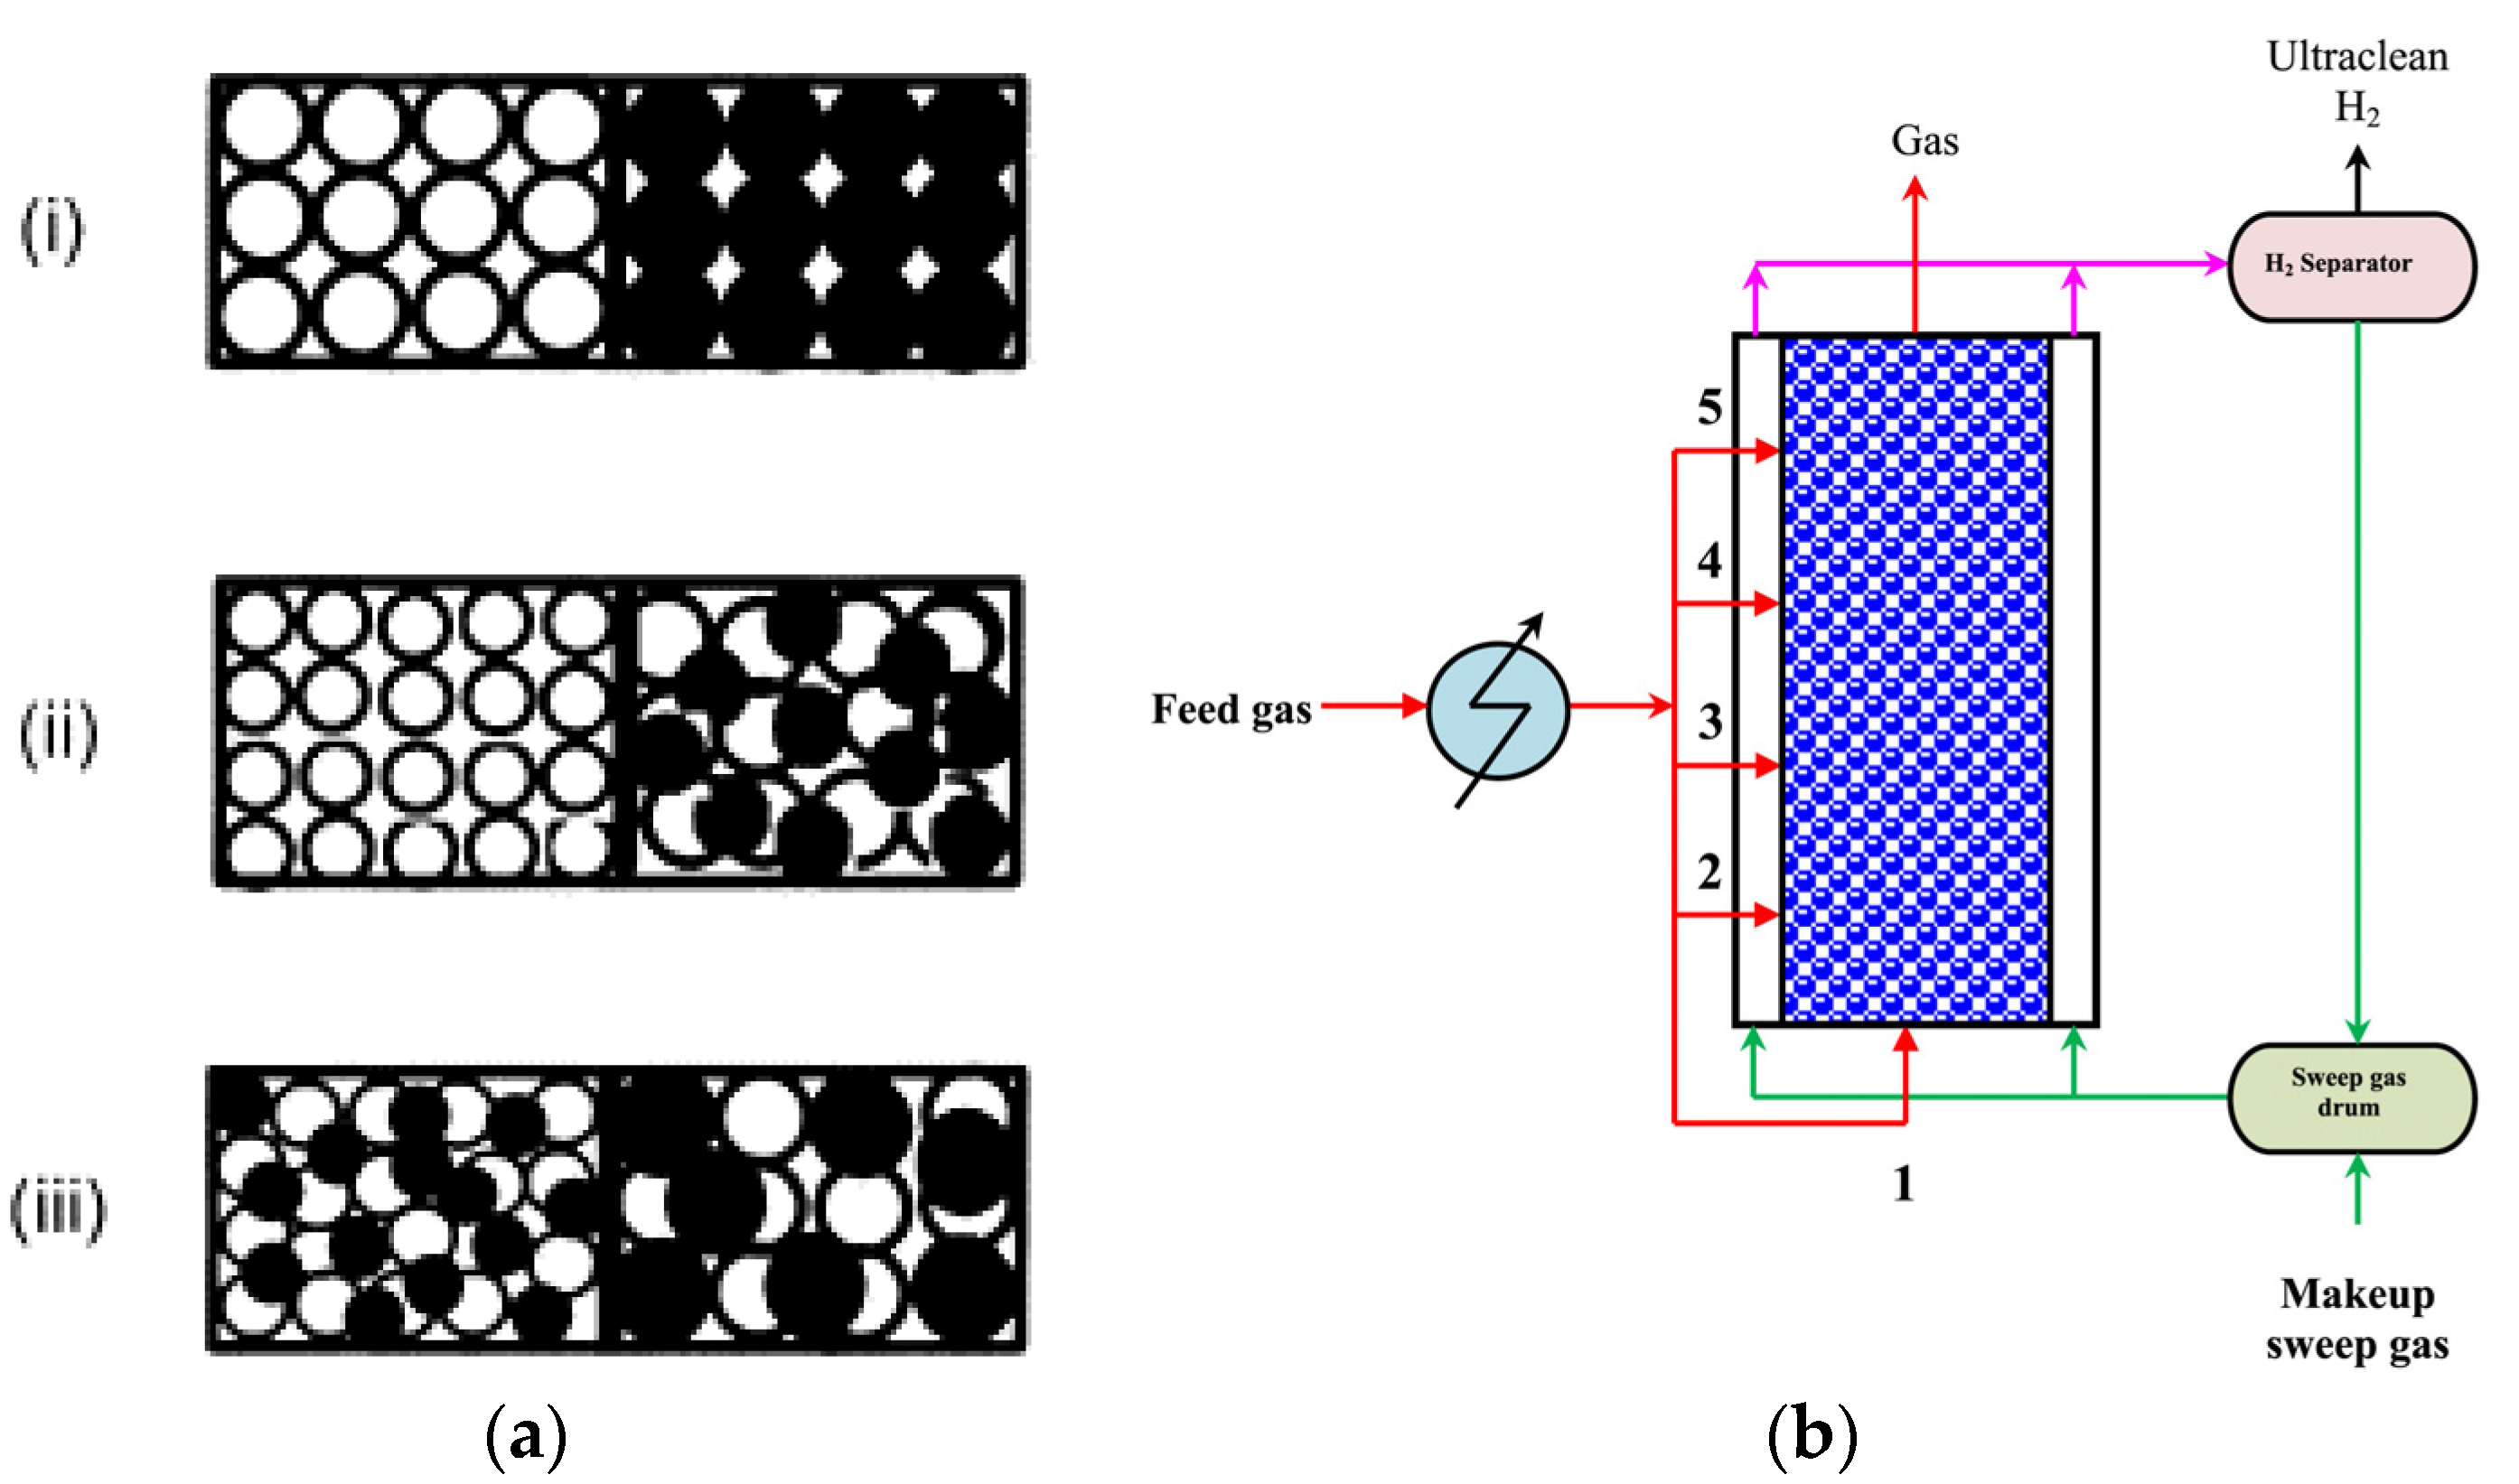
6. Numerical Simulation of NH3 Decomposition in the Membrane Reactor
6.1. Model Description of NH3 Decomposition in a Membrane Reactor
- (1)
- The membrane is permeable only to hydrogen;
- (2)
- There is no axial diffusion in the membrane;
- (3)
- NH3 and N2 do not cause membrane surface poisoning and lead to membrane performance degradation.
6.2. Influencing Factors of Membrane Reactor Performance
6.3. Rate-Limiting Step of Hydrogen Permeation in Membrane Reactor
6.4. Improvement of Membrane Reactor Performance
6.5. 3D Simulation in a Membrane Reactor
7. Summary
- (1)
- Increasing the reactor temperature, reducing the reaction pressure, especially the hydrogen partial pressure, and increasing the W/F can improve the NH3 conversion, which applies to all four scenarios discussed in this paper;
- (2)
- The kinetic model of the NH3 decomposition reaction is crucial to the simulation, and the accuracy of simulation results is highly correlated with the applicability of the selected kinetic model;
- (3)
- The microchannel reactor has high heat and mass transfer efficiency, and therefore the maximum temperature difference inside the reactor is very small (e.g., 0.03 K), and the reaction rate is not limited by mass transfer in the microchannel reactor;
- (4)
- In a multifunctional microreactor, a high-thermal-conductivity wall and co-flow configuration are preferred; if high NH3 conversion is pursued, a low-thermal-conductivity wall and counterflow configuration can be applied;
- (5)
- There is a significant temperature difference along the flow direction in SOFC. Lowering the working potential is conducive to reducing the temperature difference and increasing the average current density and average power density. However, when the working potential is lower than 0.3V, it may lead to lower output power;
- (6)
- In a membrane reactor, the radial diffusion and permeation of H2 are restricted due to the concentration polarization at the membrane surface; the membrane reactor structure should be tailored to facilitate the H2 removal in the reaction region to improve NH3 conversion.
- (1)
- The kinetics of the NH3 decomposition reaction deserves further study to achieve more accurate modeling.
- (2)
- Catalysts with high catalytic efficiency, low catalytic temperature, good stability, long service life and low cost are urgently required. Due to the high efficiency of mass and heat transfer in microreactors, improving the performance of catalysts will significantly improve the performance of microreactors.
- (3)
- The thermal gradient in the post microreactor is very large. It is necessary to seek ways to strengthen the heat transfer between posts and gases and reduce the internal temperature difference.
- (4)
- More carbon-free fuels should be applied to the multifunctional microreactor combining NH3 decomposition and combustion to reduce CO2 emission.
- (5)
- There is no model for the overall multi-channel microreactor in the literature, which should be developed.
- (6)
- Most models of membrane reactors are 1D and simplified 2D models, which cannot completely predict the behavior of membrane reactors. Accurate 2D and 3D models need to be developed.
Author Contributions
Funding
Data Availability Statement
Conflicts of Interest
References
- Mukherjee, S.; Devaguptapu, S.V.; Sviripa, A.; Lund, C.R.F.; Wu, G. Low-temperature ammonia decomposition catalysts for hydrogen generation. Appl. Catal. B Environ. 2018, 226, 162–181. [Google Scholar] [CrossRef]
- Makepeace, J.W.; He, T.; Weidenthaler, C.; Jensen, T.R.; Chang, F.; Vegge, T.; Ngene, P.; Kojima, Y.; de Jongh, P.E.; Chen, P.; et al. Reversible ammonia-based and liquid organic hydrogen carriers for high-density hydrogen storage: Recent progress. Int. J. Hydrogen Energy 2019, 44, 7746–7767. [Google Scholar] [CrossRef]
- Klerke, A.; Christensen, C.H.; Nørskov, J.K.; Vegge, T. Ammonia for hydrogen storage: Challenges and opportunities. J. Mater. Chem 2008, 18, 2285–2392. [Google Scholar] [CrossRef]
- Chein, R.-Y.; Chen, Y.-C.; Chang, C.-S.; Chung, J.N. Numerical modeling of hydrogen production from ammonia decomposition for fuel cell applications. Int. J. Hydrogen Energy 2010, 35, 589–597. [Google Scholar] [CrossRef]
- Waghode, A.N.; Hanspal, N.S.; Shigidi, I.M.T.A.; Nassehi, V.; Hellgardt, K. Computer modelling and numerical analysis of hydrodynamics and heat transfer in non-porous catalytic reactor for the decomposition of ammonia. Chem. Eng. Sci 2005, 60, 5862–5877. [Google Scholar] [CrossRef]
- Chiuta, S.; Everson, R.C.; Neomagus, H.W.J.P.; Bessarabov, D.G. Hydrogen production from ammonia decomposition over a commercial Ru/Al2O3 catalyst in a microchannel reactor: Experimental validation and CFD simulation. Int. J. Hydrogen Energy 2016, 41, 3774–3785. [Google Scholar] [CrossRef]
- Papadiasa, D.; Zwinkels, M.F.M.; Edsberg, L.; BjoÈrnbom, P. Modeling of high-temperature catalytic combustors: Comparison between theory and experimentaldata. Catal. Today 1999, 47, 315–319. [Google Scholar] [CrossRef]
- Hossain, M.K.; Chanda, R.; El-Denglawey, A.; Emrose, T.; Rahman, M.T.; Biswas, M.C.; Hashizume, K. Recent progress in barium zirconate proton conductors for electrochemical hydrogen device applications: A review. Ceram. Int 2021, 47, 23725–23748. [Google Scholar] [CrossRef]
- Hossain, M.K.; Hasan, S.M.K.; Hossain, M.I.; Das, R.C.; Bencherif, H.; Rubel, M.H.K.; Rahman, F.; Emrose, T.; Hashizume, K. A Review of Applications, Prospects, and Challenges of Proton-Conducting Zirconates in Electrochemical Hydrogen Devices. Nanomaterials 2022, 12, 3581. [Google Scholar] [CrossRef]
- Hossain, M.K.; Raihan, G.A.; Akbar, A.; Rubel, M.H.K.; Ahmed, M.H.; Khan, I.; Hossain, S.; Sen, S.K.; Jalal, M.I.E.; El-Denglawey, A. Current Applications and Future Potential of Rare Earth Oxides in Sustainable Nuclear, Radiation, and Energy Devices: A Review. ACS Appl. Electron. Mater. 2022, 4, 3327–3353. [Google Scholar] [CrossRef]
- Lamb, K.E.; Dolan, M.D.; Kennedy, D.F. Ammonia for hydrogen storage; A review of catalytic ammonia decomposition and hydrogen separation and purification. Int. J. Hydrogen Energy 2019, 44, 3580–3593. [Google Scholar] [CrossRef]
- Chen, C.; Wu, K.; Ren, H.; Zhou, C.; Luo, Y.; Lin, L.; Au, C.; Jiang, L. Ru-Based Catalysts for Ammonia Decomposition: A Mini-Review. Energy Fuels 2021, 35, 11693–11706. [Google Scholar] [CrossRef]
- Lucentini, I.; Garcia, X.; Vendrell, X.; Llorca, J. Review of the Decomposition of Ammonia to Generate Hydrogen. Ind. Eng. Chem. Res. 2021, 60, 18560–18611. [Google Scholar] [CrossRef]
- Ganley, J.C.; Thomas, F.S.; Seebauer, E.G.; Masel, R.I. A priori catalytic activity correlations the difficult case of hydrogen production from ammonia. Catal. Lett. 2004, 96, 117–122. [Google Scholar] [CrossRef]
- Temkin, M.; Pyzhev, V. Kinetics of the synthesis of ammonia on promoted iron catalysts. Acta Physicochim. 1940, 12, 217–222. [Google Scholar]
- Harrison, R.H.; Kobe, K.A. Thermodynamics of ammonia synthesis and oxidation. Chem. Eng. Prog. 1953, 49, 349–353. [Google Scholar]
- Tamara, K. A “New” General Mechanism of Ammonia Synthesis and Decomposition on Transition Metals. Acc. Chem. Res. 1988, 21, 88–94. [Google Scholar] [CrossRef]
- Ge´rald Dje´ga-Mariadassou, G.; Chae-Ho Shin, C.H.; Bugli, G. Tamaru’s model for ammonia decomposition over titanium oxynitride. J. Mol. Catal. A Chem. 1999, 141, 263–267. [Google Scholar] [CrossRef]
- Maleki, H.; Fulton, M.; Bertola, V. Kinetic assessment of H2 production from NH3 decomposition over CoCeAlO catalyst in a microreactor: Experiments and CFD modelling. Chem. Eng. J. 2021, 411, 128595. [Google Scholar] [CrossRef]
- Chen, L.; Kang, Q.; He, Y.-L.; Tao, W.-Q. Pore-scale simulation of coupled multiple physicochemical thermal processes in micro reactor for hydrogen production using lattice Boltzmann method. Int. J. Hydrogen Energy 2012, 37, 13943–13957. [Google Scholar] [CrossRef]
- Deshmukh, S.R.; Mhadeshwar, A.B.; Vlachos, D.G. Microreactor Modeling for Hydrogen Production from Ammonia Decomposition on Ruthenium. Ind. Eng. Chem. Res. 2004, 43, 2986–2999. [Google Scholar] [CrossRef]
- Zade, A.Q.; Renksizbulut, M.; Friedman, J. Ammonia Decomposition for Hydrogen Production in Catalytic Microchannels with Slip/Jump Effects. J. Appl. Fluid Mech. 2015, 8, 703–712. [Google Scholar]
- Jacob, B. Dynamics of Fluids in Porous Media; Courier Corporation: Chelmsford, MA, USA, 1988. [Google Scholar]
- Reid, R.C.; Prausnitz, J.M.; Poling, B.E. The Properties of Gases and Liquids; U.S. Department of Energy Office of Scientific and Technical Information: Oak Ridge, TN, USA, 1987. [Google Scholar]
- Bessler, W.G.; Gewies, S.; Vogler, M. A new framework for physically based modeling of solid oxide fuel cells. Electrochim. Acta 2007, 53, 1782–1800. [Google Scholar] [CrossRef]
- Hayes, R.E.; Kolaczkowski, S.T. Introduction to Catalytic Combustion; Routledge: London, UK, 2021. [Google Scholar]
- Lamb, K.; Hla, S.S.; Dolan, M. Ammonia decomposition kinetics over LiOH-promoted, α-Al2O3-supported Ru catalyst. Int. J. Hydrogen Energy 2019, 44, 3726–3736. [Google Scholar] [CrossRef]
- Chiuta, S.; Everson, R.C.; Neomagus, H.W.J.P.; Le Grange, L.A.; Bessarabov, D.G. A modelling evaluation of an ammonia-fuelled microchannel reformer for hydrogen generation. Int. J. Hydrogen Energy 2014, 39, 11390–11402. [Google Scholar] [CrossRef]
- Di Carlo, A.; Dell’Era, A.; Del Prete, Z. 3D simulation of hydrogen production by ammonia decomposition in a catalytic membrane reactor. Int. J. Hydrogen Energy 2011, 36, 11815–11824. [Google Scholar] [CrossRef]
- Itoh, N.; Oshima, A.; Suga, E.; Sato, T. Kinetic enhancement of ammonia decomposition as a chemical hydrogen carrier in palladium membrane reactor. Catal. Today 2014, 236, 70–76. [Google Scholar] [CrossRef]
- Molaeimanesh, G.R.; Davarani, M.H.S. A pore-scale model for microfibrous ammonia cracking microreactors via lattice Boltzmann method. Korean J. Chem. Eng. 2016, 33, 1211–1219. [Google Scholar] [CrossRef]
- Schumacher, K.; Engelbrecht, N.; Everson, R.C.; Friedl, M.; Bessarabov, D.G. Steady-state and transient modelling of a microchannel reactor for coupled ammonia decomposition and oxidation. Int. J. Hydrogen Energy 2019, 44, 6415–6426. [Google Scholar] [CrossRef]
- Badakhsh, A.; Kwak, Y.; Lee, Y.-J.; Jeong, H.; Kim, Y.; Sohn, H.; Nam, S.W.; Yoon, C.W.; Park, C.W.; Jo, Y.S. A compact catalytic foam reactor for decomposition of ammonia by the Joule-heating mechanism. Chem. Eng. J. 2021, 426, 130802. [Google Scholar] [CrossRef]
- Wang, B.; Kong, H.; Wang, H.; Wang, Y.; Hu, X. Kinetic and thermodynamic analyses of mid/low-temperature ammonia decomposition in solar-driven hydrogen permeation membrane reactor. Int. J. Hydrogen Energy 2019, 44, 26874–26887. [Google Scholar] [CrossRef]
- Regatte, V.R.; Kaisare, N.S. Hydrogen generation in spatially coupled cross-flow microreactors. Chem. Eng. J. 2013, 215–216, 876–885. [Google Scholar] [CrossRef]
- Zanfir, M.; Gavriilidis, A. Catalytic combustion assisted methane steam reforming in a catalytic plate reactor. Chem. Eng. Sci. 2003, 58, 3947–3960. [Google Scholar] [CrossRef]
- Chen, J.; Yan, L.; Song, W.; Xu, D. Operating strategies for thermally coupled combustion-decomposition catalytic microreactors for hydrogen production. Int. J. Hydrogen Energy 2016, 41, 21532–21547. [Google Scholar] [CrossRef]
- Deutschmanna, O.; Maier, L.I.; Riedel, U.; Stroemman, A.H.; Dibble, R.W. Hydrogen assisted catalytic combustion of methane on platinum. Catal. Today 2000, 59, 141–150. [Google Scholar] [CrossRef]
- Karagiannidis, S.; Mantzaras, J.; Bombach, R.; Schenker, S.; Boulouchos, K. Experimental and numerical investigation of the hetero-/homogeneous combustion of lean propane/air mixtures over platinum. Proc. Combust. Inst. 2009, 32, 1947–1955. [Google Scholar] [CrossRef]
- Qin, Z.W.; Lissianski, V.V.; Yang, H.X.; Gardiner, W.C.; Davis, S.G.; Wang, H. Combustion chemistry of propane: A case study of detailed reaction mechanism optimization. Proc. Combust. Inst. 2000, 28, 1663–1669. [Google Scholar] [CrossRef]
- Deshmukh, S.R.; Vlachos, D.G. CFD Simulations of Coupled, Countercurrent Combustor/Reformer Microdevices for Hydrogen Production. Ind. Eng. Chem. Res. 2005, 44, 4982–4992. [Google Scholar] [CrossRef]
- Jejurkar, S.Y.; Mishra, D.P. Thermal performance characteristics of a microcombustor for heating and propulsion. Appl. Therm. Eng. 2011, 31, 521–527. [Google Scholar] [CrossRef]
- Kaisare, N.S.; Stefanidis, G.D.; Vlachos, D.G. Millisecond Production of Hydrogen from Alternative, High Hydrogen Density Fuels in a Cocurrent Multifunctional Microreactor. Ind. Eng. Chem. Res. 2009, 48, 1749–1760. [Google Scholar] [CrossRef]
- Deshmukh, S.R.; Vlachos, D.G. Effect of flow configuration on the operation of coupled combustor/reformer microdevices for hydrogen production. Chem. Eng. Sci. 2005, 60, 5718–5728. [Google Scholar] [CrossRef]
- Ni, M.; Leung, D.Y.C.; Leung, M.K.H. An improved electrochemical model for the NH3 fed proton conducting solid oxide fuel cells at intermediate temperatures. J. Power Sources 2008, 185, 233–240. [Google Scholar] [CrossRef]
- Ni, M. Thermo-electrochemical modeling of ammonia-fueled solid oxide fuel cells considering ammonia thermal decomposition in the anode. Int. J. Hydrogen Energy 2011, 36, 3153–3166. [Google Scholar] [CrossRef]
- Chan, S.H.; Khor, K.A.; Xia, Z.T. A complete polarization model of a solid oxide fuel cell and its sensitivity to the change of cell component thickness. J. Power Sources 2001, 93, 130–140. [Google Scholar] [CrossRef]
- Ni, M.; Leung, M.K.H.; Leung, D.Y.C. Parametric study of solid oxide fuel cell performance. Energy Convers. Manag. 2007, 48, 1525–1535. [Google Scholar] [CrossRef]
- Ni, M.; Leung, D.Y.C.; Leung, M.K.H. Mathematical modeling of ammonia-fed solid oxide fuel cells with different electrolytes. Int. J. Hydrogen Energy 2008, 33, 5765–5772. [Google Scholar] [CrossRef]
- Chase, M.W. NIST-JANAF Thermochemical Tables, 4th ed.; American Institute of Physics: College Park, MD, USA, 1998. [Google Scholar]
- Lin, Y.; Ran, R.; Guo, Y.; Zhou, W.; Cai, R.; Wang, J.; Shao, Z. Proton-conducting fuel cells operating on hydrogen, ammonia and hydrazine at intermediate temperatures. Int. J. Hydrogen Energy 2010, 35, 2637–2642. [Google Scholar] [CrossRef]
- Ji, G.Z.; Yao, J.G.; Clough, P.T.; Diniz da Costa, J.C.; Anthony, E.J.; Fennell, P.S.; Wang, W.; Zhao, M. Enhanced hydrogen production from thermochemical processes—a review. Energy Environ. Sci. 2018, 11, 2647–2672. [Google Scholar] [CrossRef] [Green Version]
- Abashar, M.E.E.; Al-Sughair, Y.S.; Al-MutazI, S. Investigation of low temperature decomposition of ammonia using spatially patterned catalytic membrane reactors. Appl. Catal. A Gen. 2002, 236, 35–53. [Google Scholar] [CrossRef]
- Hurlburt, R.C.; Konency, J.O. Diffusion of hydrogen through palladium. J. Chem. Phys. 1961, 34, 655–658. [Google Scholar] [CrossRef]
- Ackerman, F.J.; Koskinas, G.J. Permeation of Hydrogen and Deuterium Through Palladium-silver Alloys. J. Chem. Eng. 1972, 17, 51–55. [Google Scholar] [CrossRef]
- Rahimpour, M.R.; Mottaghi, H.R.; Barmaki, M.M. Hydrogen production from urea wastewater using a combination of urea thermal hydrolyser–desorber loop and a hydrogen-permselective membrane reactor. Fuel Process. Technol. 2010, 91, 600–612. [Google Scholar] [CrossRef]
- Rahimpour, M.R.; Asgari, A. Modeling and simulation of ammonia removal from purge gases of ammonia plants using a catalytic Pd-Ag membrane reactor. J. Hazard Mater. 2008, 153, 557–565. [Google Scholar] [CrossRef] [PubMed]
- Israni, S.H.; Nair, B.K.R.; Harold, M.P. Hydrogen generation and purification in a composite Pd hollow fiber membrane reactor: Experiments and modeling. Catal. Today 2009, 139, 299–311. [Google Scholar] [CrossRef]
- Li, G.; Kanezashi, M.; Yoshioka, T.; Tsuru, T. Ammonia decomposition in catalytic membrane reactors: Simulation and experimental studies. AIChE J. 2013, 59, 168–179. [Google Scholar] [CrossRef]
- Zhang, Z.; Liguori, S.; Fuerst, T.F.; Way, J.D.; Wolden, C.A. Efficient Ammonia Decomposition in a Catalytic Membrane Reactor To Enable Hydrogen Storage and Utilization. ACS Sustain. Chem. Eng. 2019, 7, 5975–5985. [Google Scholar] [CrossRef]
- Abashar, M.E.E. The impact of ammonia feed distribution on the performance of a fixed bed membrane reactor for ammonia decomposition to ultra-pure hydrogen. Int. J. Hydrogen Energy 2019, 44, 82–90. [Google Scholar] [CrossRef]


| Name | Symbol | Definition | Values |
|---|---|---|---|
| Residence time | tR | VR/Qin | 0.11–0.56 s |
| Characteristic reaction time | tkR | 1/kapp | 0.012 s |
| Diffusion time (fluid) | tD | h2/D | 5.71 × 10⁻³ s |
| Effective diffusion time | tDe | h02/De | 9.7 × 10⁻⁴ s |
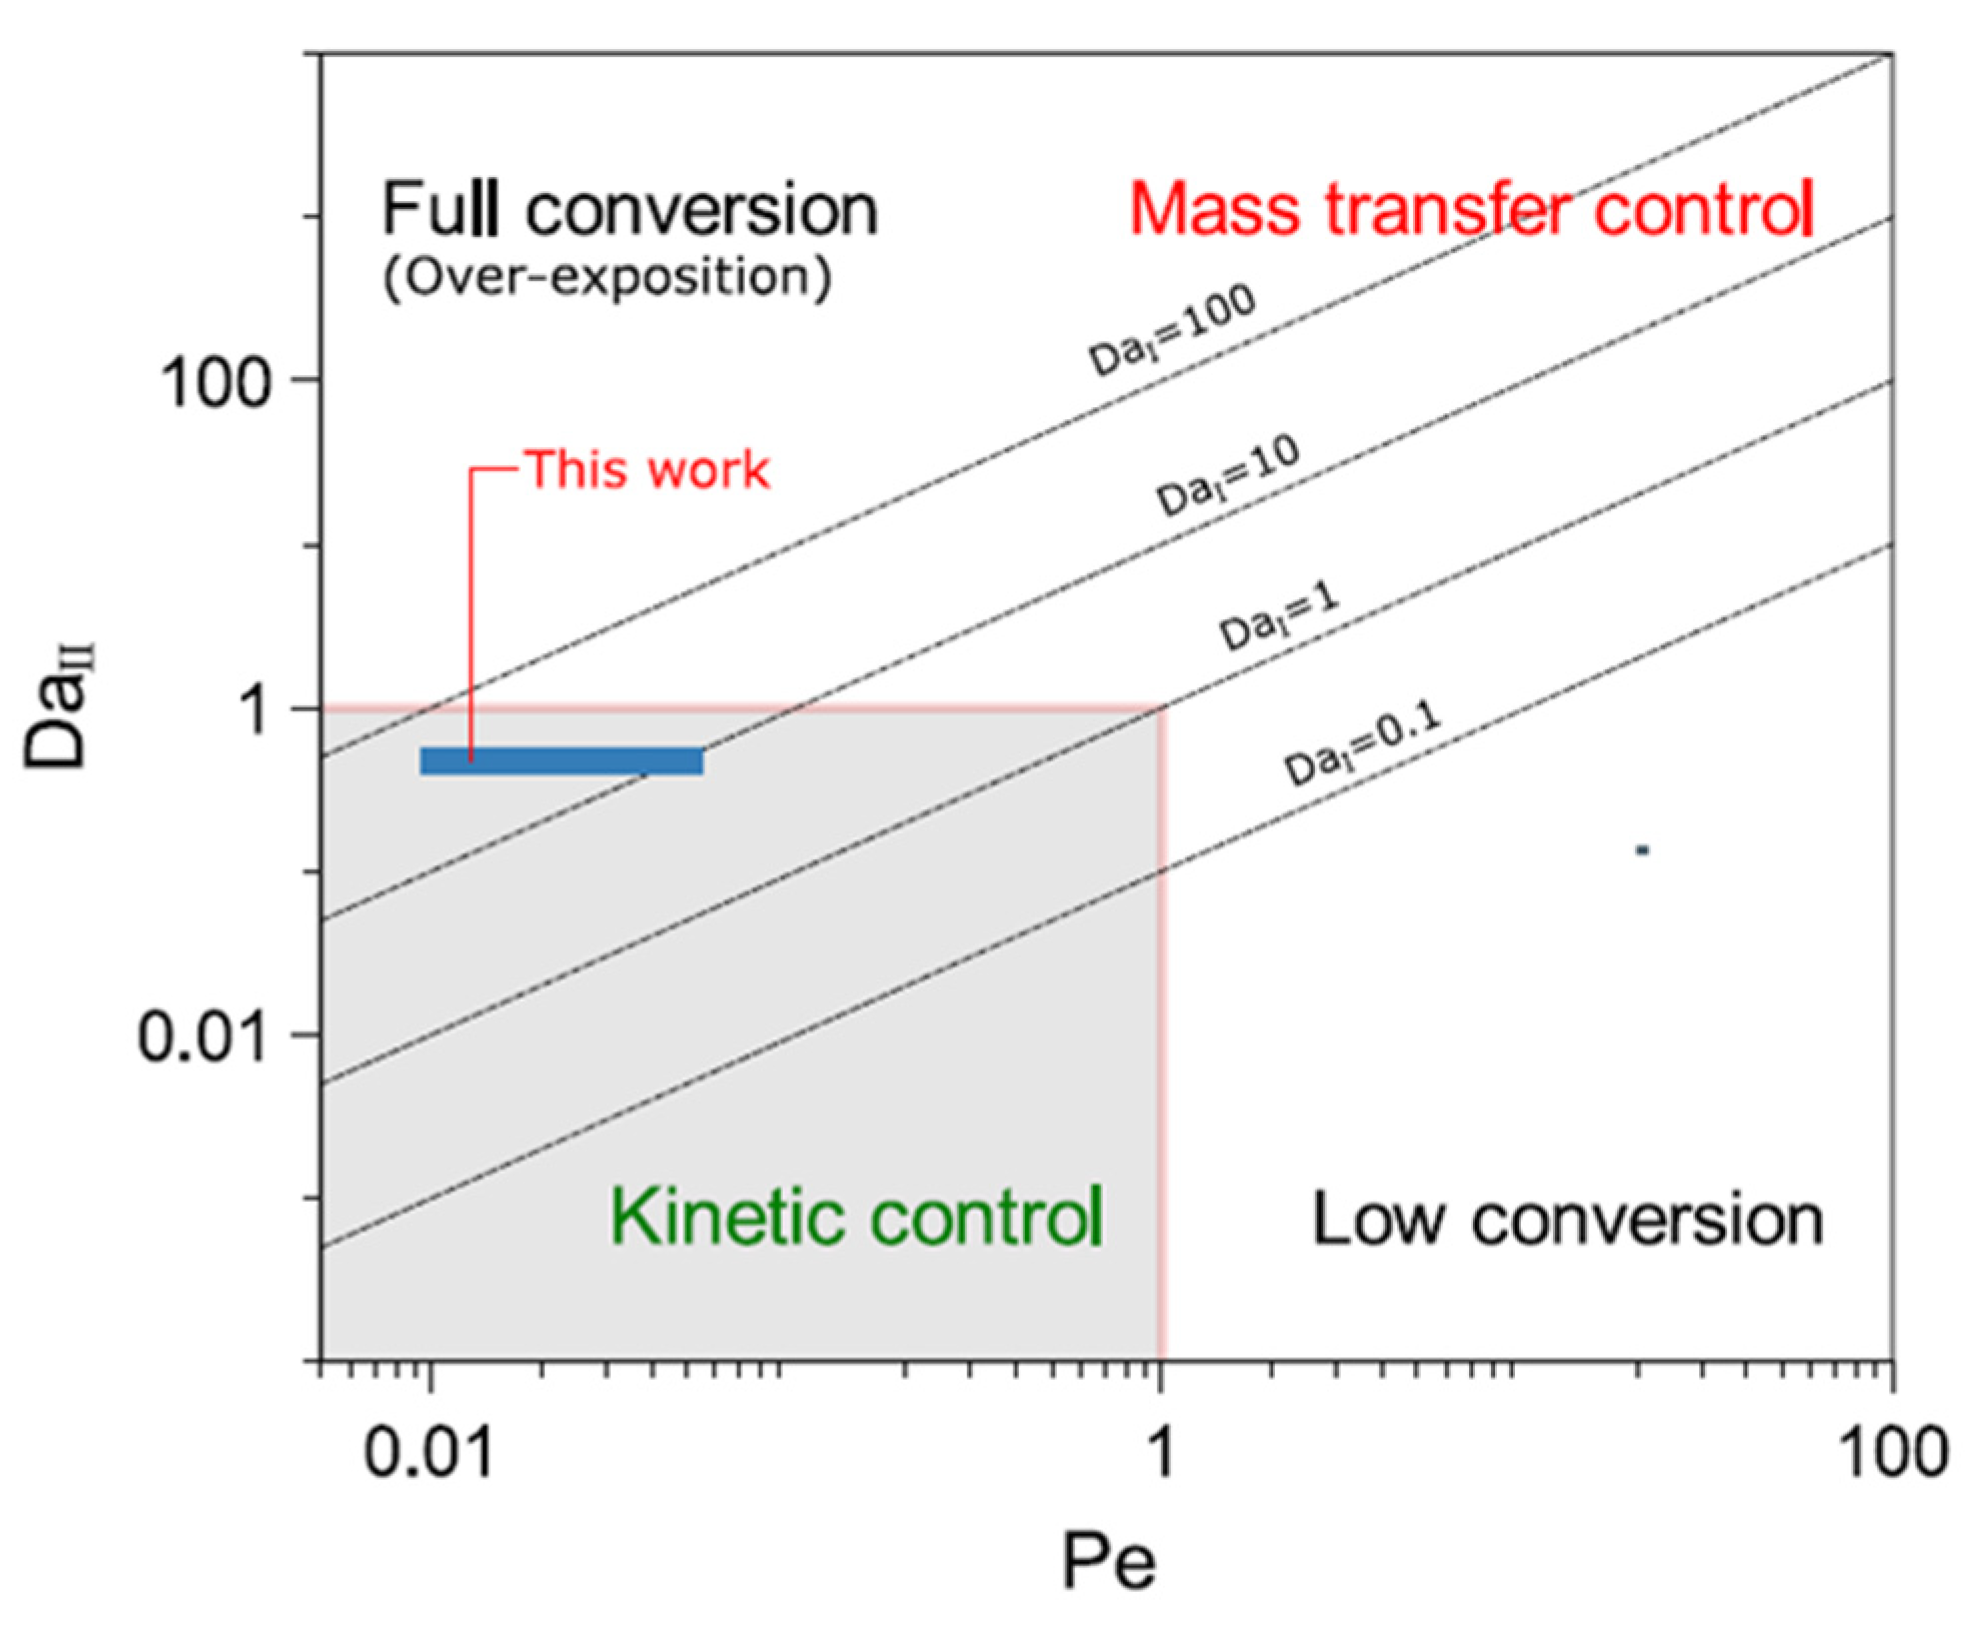
| Péclet number | Pe | tD/tR | 0.01–0.051 |
| Damköhler I number | 𝐷𝑎I | tR/tkR | 9.2–46 |
| Damköhler II number | 𝐷𝑎II | tD/tkR | 0.47 |
| Thiele modulus | 𝜙 | (tDe/tkR)0.5 | 0.28 |
| Catalyst | Solving Method or Tool | Nature of Work | Key Points | Ref |
|---|---|---|---|---|
| Ni | Discrete using finite element method | Sim | In the microreactor with catalytically active cartridges placed in the center, the overall temperature inside the microreactor did not change significantly, and the effect of heat and mass transfer mechanisms was negligible in the two microreactors studied. | [5] |
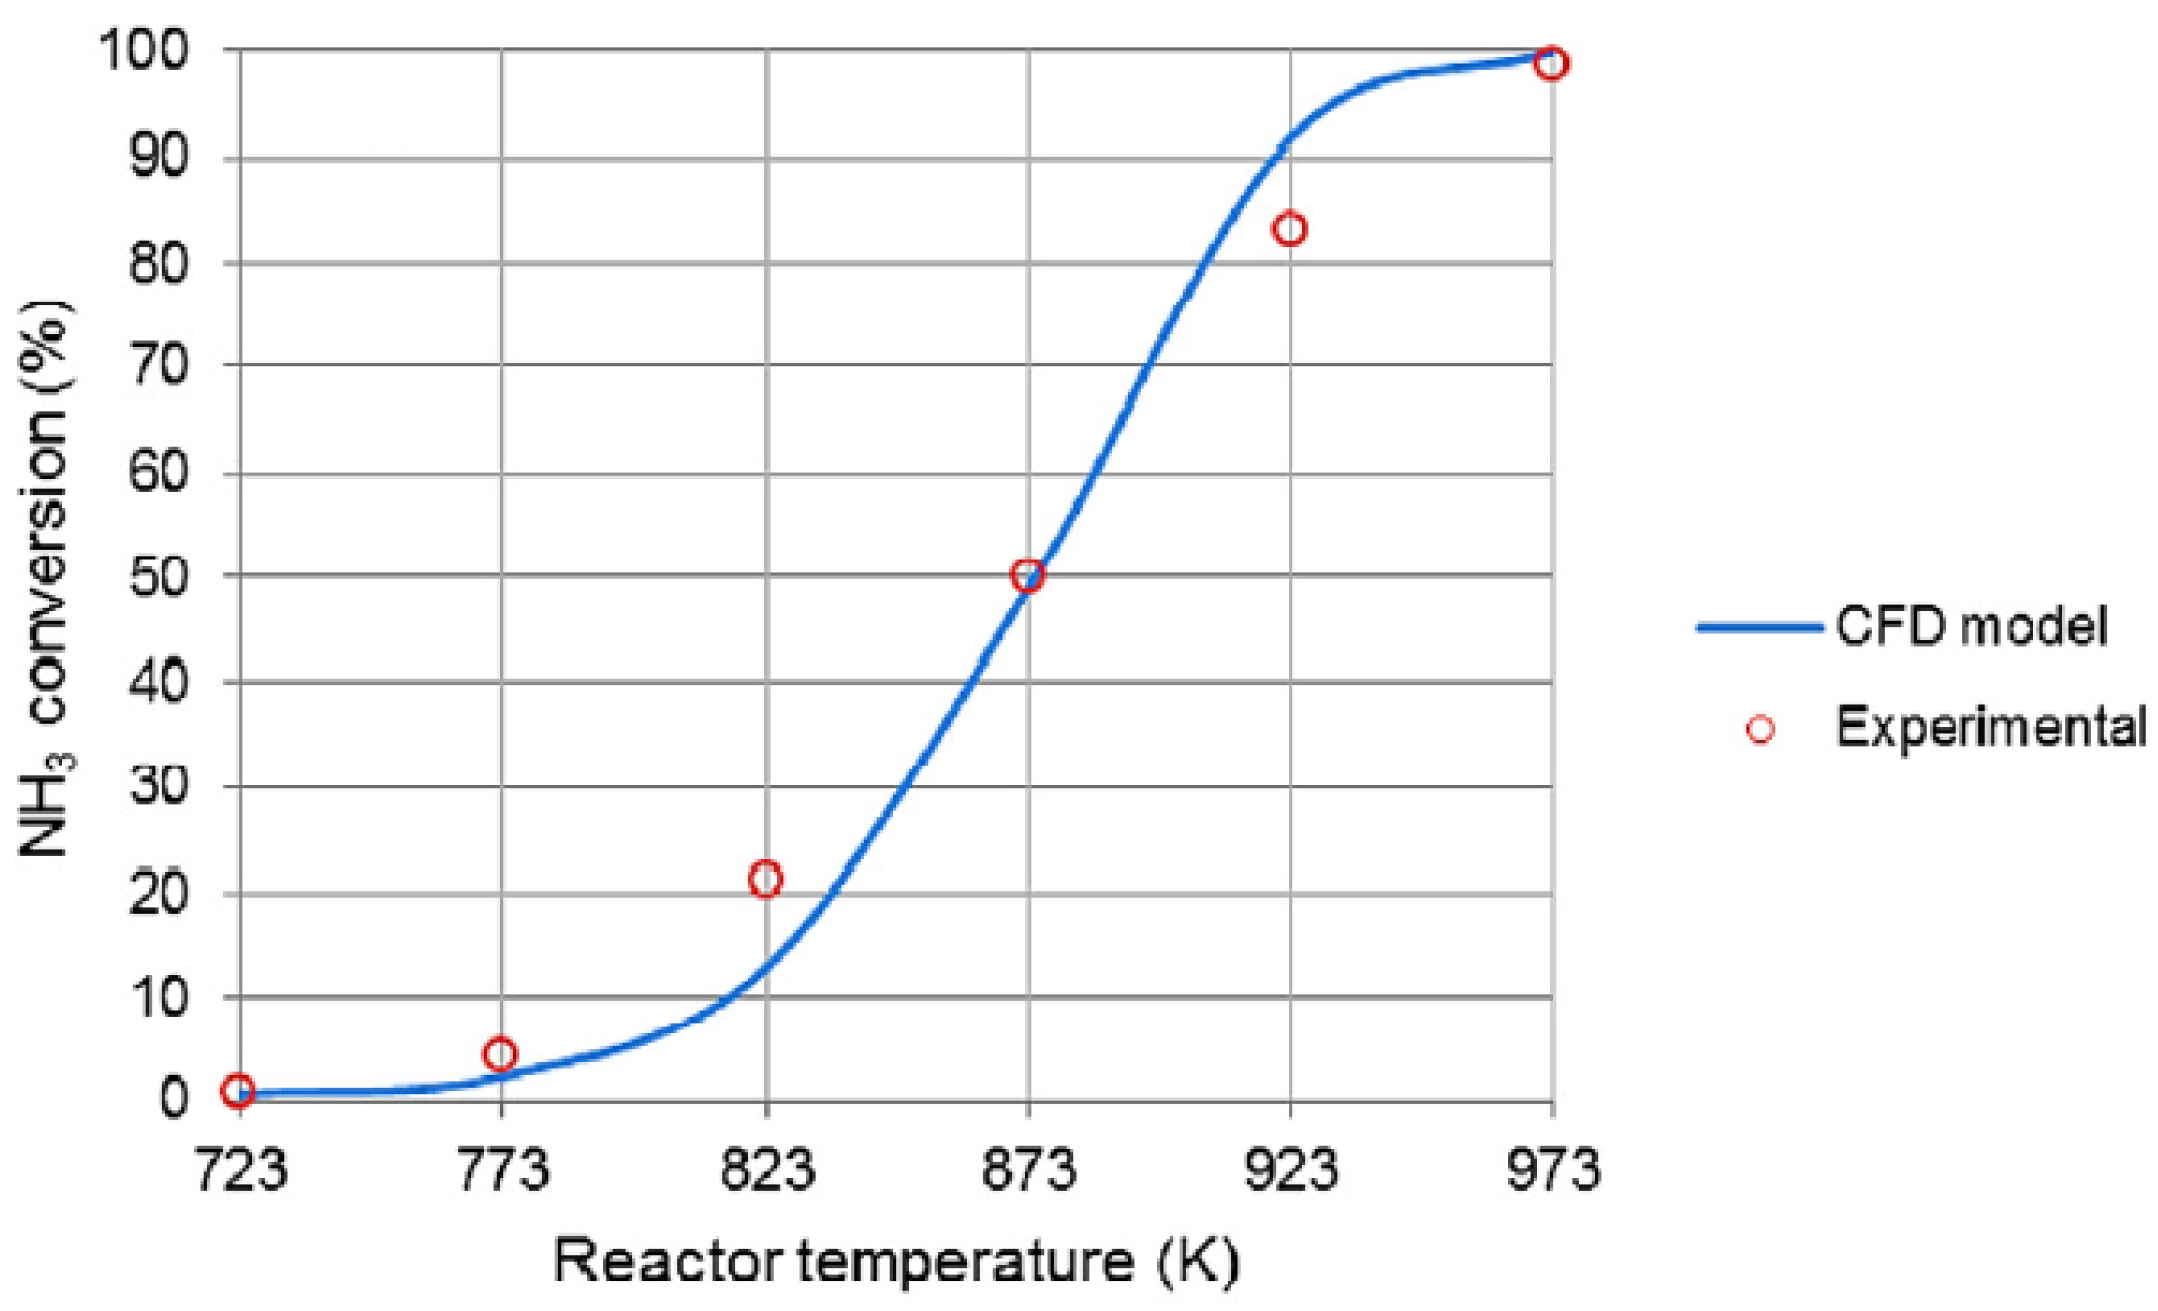
| Ru | FLUENT (version 6.0) | Expt + Sim | The conversion of NH3 increased sharply with temperature. The effect of post shape on conversion was found to be insignificant and the chemical reaction rate was slower than the lateral mass transfer in the reactor. | [21] |
| Ni-Pt/Al2O3 | Lattice Boltzmann method | Expt + Sim | The microfiber reactor had the best NH3 conversion rate and the highest heat consumption | [31] |
| Ru/Al2O3 | COMSOL Multiphysics | Expt + Sim | The microchannel reactor operated under isothermal conditions, and the NH3 conversion increased with reaction temperature, and this increase was more pronounced in the temperature range of 723–773 K. Heat and mass transfer resistance of the microchannel reactor was quite low. | [6] |
| CoCeAlO | ANSYS FLUENT 17.2 | Expt + Sim | Lateral mass transfer in microchannels was efficient, and thicker catalyst layers ensured higher NH3 conversion but increased the pressure drop. | [19] |
| Ni-Pt/Al2O3 | Lattice Boltzmann method | Expt + Sim | The highest decomposition efficiency of 0.677 was achieved when the posts were staggered; fixing the catalyst near the reactor wall was beneficial to obtain a high reactor performance. | [20] |
| Ni-Pt/Al2O3 | COMSOL Multiphysics | Expt + Sim | A porous catalyst layer with a thickness of 40 μm and a channel hydraulic diameter of 225 μm were most desirable for high NH3 conversion. Mass transfer limitations within the porous catalyst layer and gas phase were inappreciable for the microreactor. | [28] |
| Fuel | Solving Method or Tool | Nature of Work | Key Points | Ref |
|---|---|---|---|---|
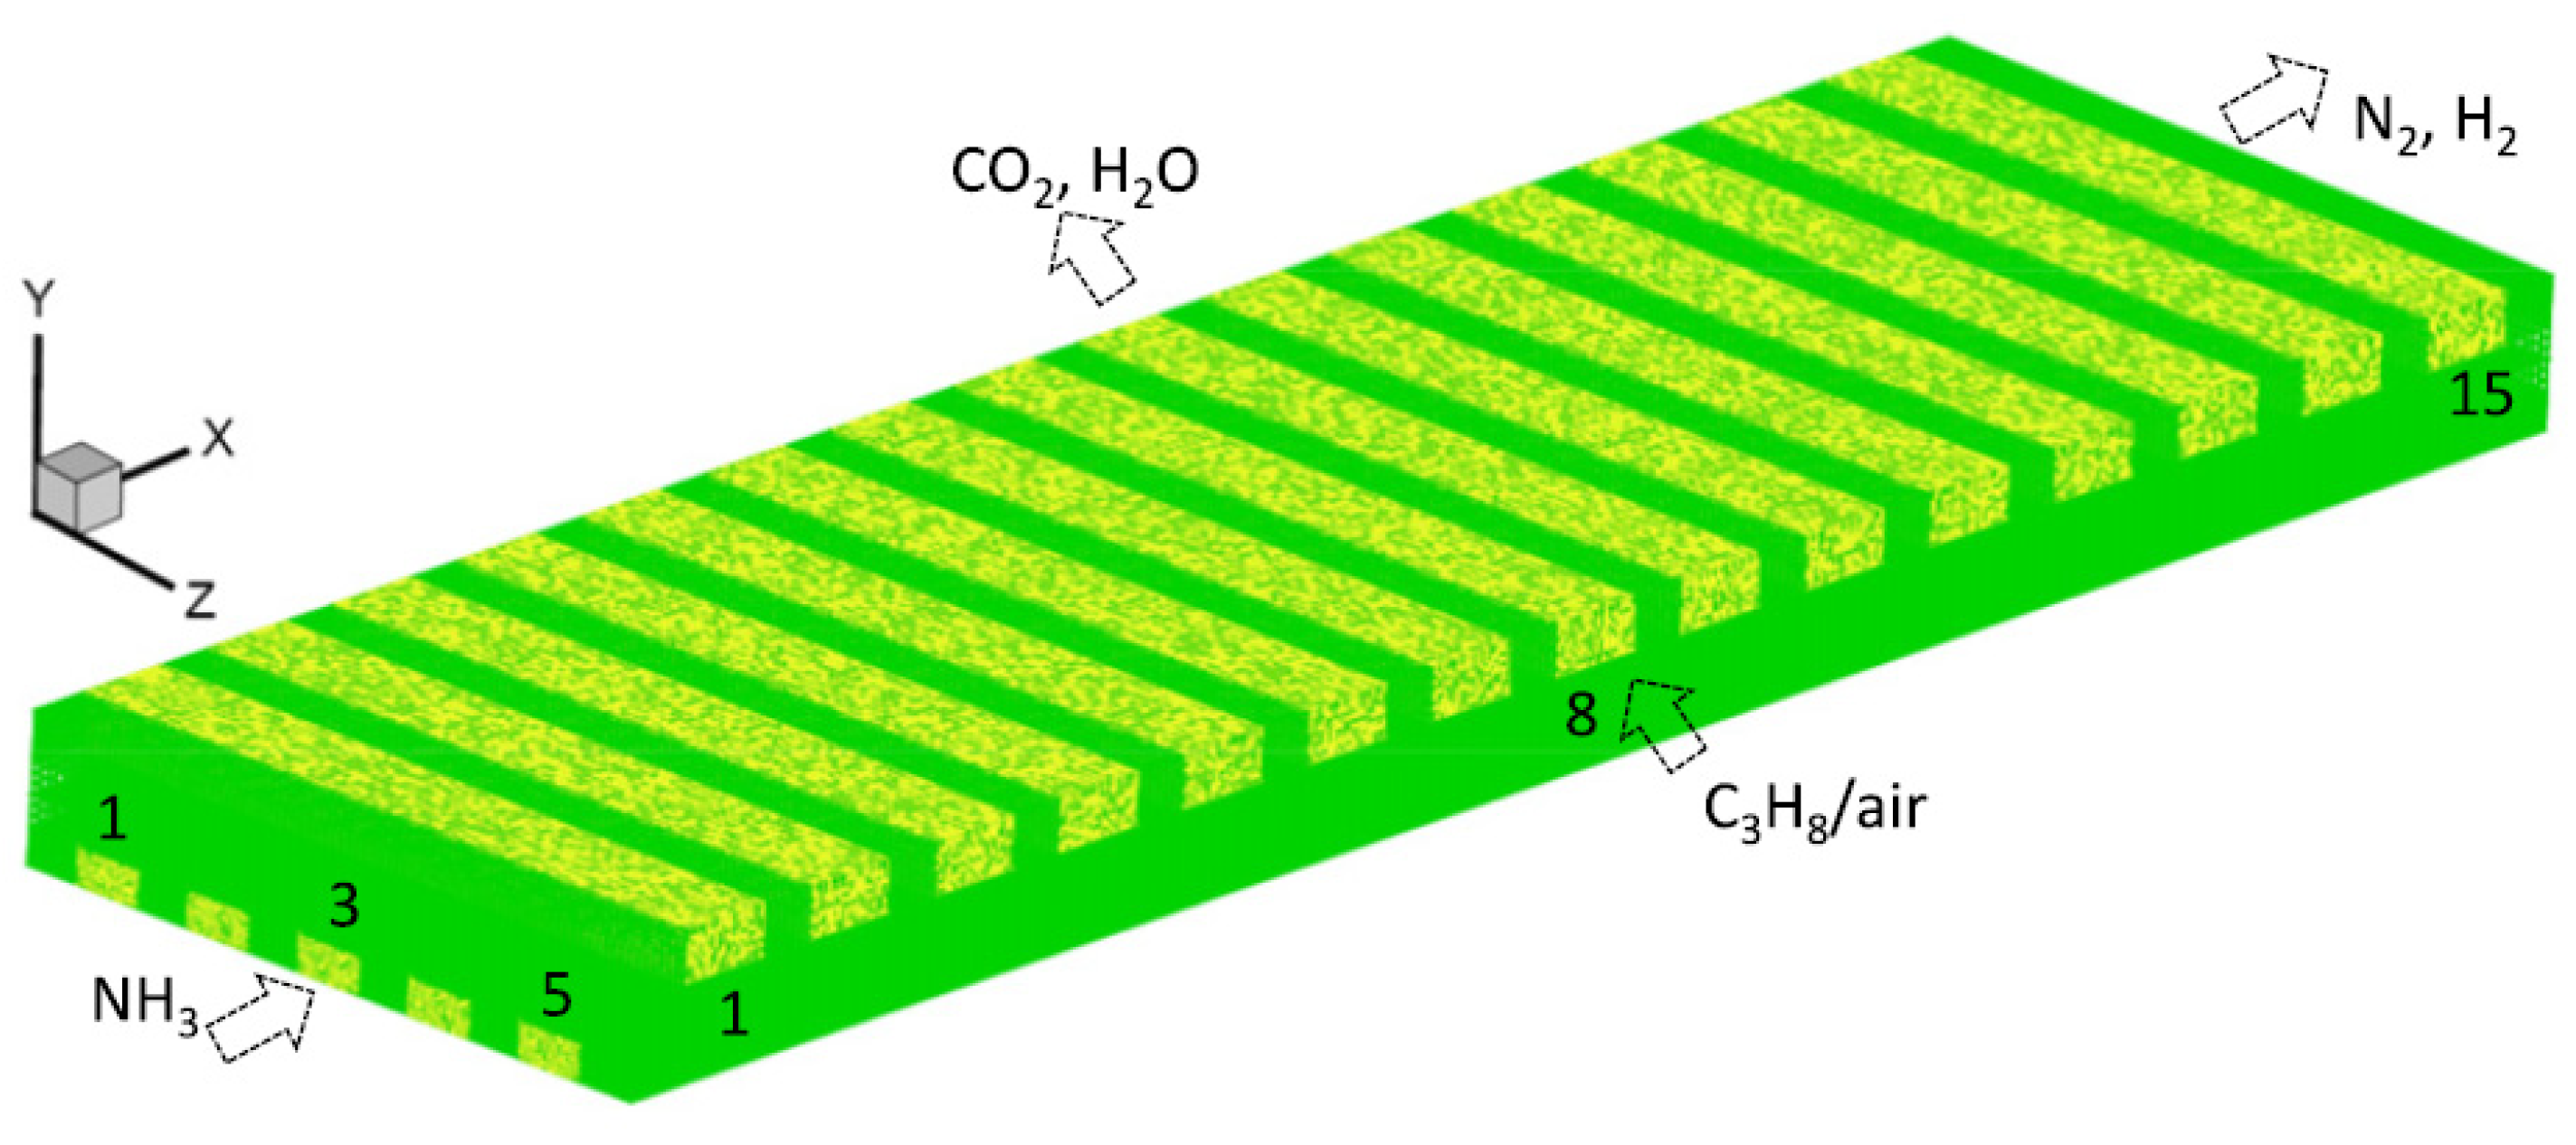
| Methane and propane | FLUENT Release 6.3 combined with CHEMKIN | Sim | Co-flow structures can lead to lower temperatures and allow for a wider choice of materials. Propane can produce a higher maximum power output than methane. NH3 decomposition is feasible within a contact time on the order of milliseconds. | [37] |
| Propane | FLUENT | Sim | Low thermal conductivity walls lead to very high local wall temperatures and significant longitudinal temperature gradients. A higher equipment temperature is obtained at a lower NH3 flow rate. | [41] |
| Propane | FLUENT | Sim | Co-flow structure has lower NH3 conversion, but better reactor stability. A higher NH3 flow rate reduces the equipment temperature. | [44] |
| NH3 | ANSYS CFX | Expt + Sim | As the flow rate of NH3 for decomposition decreases, the heat consumed by the NH3 decomposition reaction decreases, resulting in an increase in the steady-state reactor temperature. | [32] |
| Propane | DASPK software package | Sim | The NH3 decomposition process is kinetically controlled and the combustion process is controlled by heat transport. | [43] |
| Propane | FLUENT | Sim | Cross-flow coupled microreactors outperform co-flow microreactors for lower power (lower hydrogen production) applications at a lower NH3 flow rate. | [35] |
Disclaimer/Publisher’s Note: The statements, opinions and data contained in all publications are solely those of the individual author(s) and contributor(s) and not of MDPI and/or the editor(s). MDPI and/or the editor(s) disclaim responsibility for any injury to people or property resulting from any ideas, methods, instructions or products referred to in the content. |
© 2023 by the authors. Licensee MDPI, Basel, Switzerland. This article is an open access article distributed under the terms and conditions of the Creative Commons Attribution (CC BY) license (https://creativecommons.org/licenses/by/4.0/).
Share and Cite
Ao, R.; Lu, R.; Leng, G.; Zhu, Y.; Yan, F.; Yu, Q. A Review on Numerical Simulation of Hydrogen Production from Ammonia Decomposition. Energies 2023, 16, 921. https://doi.org/10.3390/en16020921
Ao R, Lu R, Leng G, Zhu Y, Yan F, Yu Q. A Review on Numerical Simulation of Hydrogen Production from Ammonia Decomposition. Energies. 2023; 16(2):921. https://doi.org/10.3390/en16020921
Chicago/Turabian StyleAo, Rui, Ruihua Lu, Guanghui Leng, Youran Zhu, Fuwu Yan, and Qinghua Yu. 2023. "A Review on Numerical Simulation of Hydrogen Production from Ammonia Decomposition" Energies 16, no. 2: 921. https://doi.org/10.3390/en16020921