Article

Load Prediction Algorithm Applied with Indoor Environment Sensing in University Buildings

School of Architectural, Civil, Environmental, and Energy Engineering, Kyungpook National University, 80 Daehakro, Buk-gu, Daegu 41566, Republic of Korea
*
Author to whom correspondence should be addressed.
Energies 2023, 16(2), 999; https://doi.org/10.3390/en16020999
Submission received: 23 December 2022 / Revised: 7 January 2023 / Accepted: 11 January 2023 / Published: 16 January 2023
(This article belongs to the Special Issue Energy Evaluation and Energy-Savings for Sustainable Buildings)

Abstract

:
Recently, building automation system (BAS) and building energy management system (BEMS) technologies have been applied to efficiently reduce the energy consumption of buildings. In addition, studies on utilizing large quantities of building data have been actively conducted using artificial intelligence and machine learning. However, the high cost and installation difficulties limit the use of measuring devices to sense the indoor environment of all buildings. Therefore, this study developed a comprehensive indoor environment sensor module with relatively inexpensive sensors to measure the indoor environment of a university building. In addition, an algorithm for predicting the load in real time through machine learning based on indoor environment measurement is proposed. When the reliability of the algorithm for predicting the number of occupants and load according to the indoor CO2 concentration was quantitatively assessed, the mean squared error (MSE), root mean square deviation (RMSD), and mean absolute error (MAE) were calculated to be 23.1, 4.8, and 2.5, respectively, indicating the high accuracy of the algorithm. Since the sensor used in this study is economical and can be easily applied to existing buildings, it is expected to be favorable for the dissemination of load prediction technology.

1. Introduction

With rapid climate change, efforts to reduce greenhouse gas (GHG) emissions have been made in various fields worldwide [1]. The Republic of Korea set its Nationally Determined Contribution (NDC) at 26.3% compared to 2018 by establishing a carbon neutrality committee, but its NDC increased by 40% from 2018 to October 2021. Accordingly, the carbon reduction goal of the building sector significantly increased from 19.5 to 32.8% [2].
In addition, the Ministry of Land, Infrastructure, and Transport in the Republic of Korea implemented “The Zero-Energy Building Roadmap 2030” in 2020. According to the roadmap, zero-energy buildings became mandatory for public buildings over 1000 m2 in 2020. They will also become compulsory for public buildings over 500 m2, private buildings over 1000 m2, and apartments with 30 households or more in 2025, as well as all buildings over 500 m2 in 2030 [3,4].
In the Republic of Korea, the energy consumption of the building sector accounts for more than 30% of the national energy consumption. As of 2020, the building sector represents 2.5% of the companies with high energy consumption of over 2000 tons per year. Excluding large companies that consume over 10^5 tons per year in the industrial sector, the energy consumption of the building sector was found to represent approximately 14.4% of the total energy consumption. Among buildings with high energy consumption, the energy consumption of public facilities, apartments, hospitals, and Internet data center (IDC) industries was found to continuously increase. IDC exhibited the highest average building energy consumption, followed by research institutes, public facilities, hospitals, hotels, and schools [5].
For most buildings with a high energy consumption, it is difficult to save energy without lowering the quality of service because such buildings must be operated 24 h a day and 365 days a year to provide high-quality services [6,7]. Therefore, a method was developed to reduce energy consumption by generating usable energy through renewable energy systems [8]. However, as of 2020, buildings with high energy consumption were found to produce very little renewable energy—just 3.5% of the total energy consumption.
The university building used in this study has relatively regular occupant schedules, but it is difficult to maintain a comfortable indoor environment because the load on the equipment to maintain a comfortable thermal environment rapidly changes due to the high number of people occupying a single space [9]. In addition, as cooling/heating devices and lighting are manually controlled, energy is often wasted because the equipment is not properly turned off even after the occupants’ exit [10].
As such, research on building automation system (BAS) and building energy management system (BEMS) technologies has been conducted [11]. These systems reduce energy consumption by predicting the energy consumed in buildings and applying the optimal operation method for equipment [12], which helps save the energy consumed in buildings and results in eco-friendly buildings. In addition, artificial intelligence and machine learning, which are useful in recognizing and predicting data patterns, have been actively applied in building energy scenarios to rapidly calculate energy consumption using large quantities of building data [13].
Byung-Ki Jeon et al. recently attempted to achieve multiple goals for thermal comfort and energy saving by applying an energy storage system (ESS) and an energy predictive control algorithm (model predictive control, also known as MPC) to save the energy consumed in buildings. They reduced electrical energy consumption by 55% compared to the existing operation method using MPC based on a genetic algorithm [14].
Hossein Moayedi et al. investigated the cooling/heating energy consumption of residential buildings and predicted cooling and heating loads according to the floor area using the Grasshopper Optimization Algorithm, Wind-Driven Optimization, and Biogeography-Based Optimization (BBO) to reduce energy consumption in smart cities. They found that the BBO-based prediction algorithm has the highest accuracy [15].
Finally, Anam-Nawaz Khan et al. studied the power consumption of residential buildings to analyze the occupants’ demand–consumption patterns. They proposed a model for predicting short-term power consumption according to the floor area by conducting a time-series clustering analysis using the hourly energy consumption data of multi-family housing as basic data [16].
Aparna Kumari et al. proposed a model for predicting the energy consumption of home appliances using machine learning and Long-Short Term Memory (LSTM) among deep learning technologies. They also proposed an algorithm for a priority analyzer to efficiently solve peak power by providing consumers with the optimal home appliance usage time [17].
Ayub N. et al. proposed a short-term and medium-term power load prediction model using deep learning and machine learning based on the eight-year electricity load data of a British power company. For load prediction, Support Vector Machines (SVM), Gated Recurrent Units (GRU), and Convolutional Neural Networks (CNN) were applied as a hybrid. When parameter tuning was performed with the Gray Wolf Optimization (GWO) and Earth Worm Optimization (EWO) algorithms, performance was improved by approximately 7% for CNN-GRU-EWO and 3% for SVM-GWO compared to the existing prediction model [18].
In recent studies, prediction data with a low error rate and high accuracy were obtained because the power load can be predicted using machine learning and deep learning based on a large amount of past data, as mentioned above.
Load prediction technologies to date, however, have not been applied to many buildings due to the high cost and a lack of experts, as they use data from the distant past or collect data using expensive equipment and perform prediction through machine learning and deep learning algorithms. In addition, it was difficult to analyze small spaces that belong to large buildings, such as offices and classrooms, because the entire data sheet of a building was used.
As such, this study aimed to produce a comprehensive sensor module for sensing the indoor environment in real time and propose a machine-learning algorithm for predicting the load in real time using the data obtained from the sensor and machine learning so as to effectively reduce building energy consumption.
The main contributions of this paper are provided below:
  • A relatively simple and inexpensive sensor module, which can measure the indoor thermal environment and air environment, was produced and used in experiments so that load-prediction-related technology was not limited to some buildings.
  • Buildings with high energy consumption and irregular energy use schedules, which have not commonly been looked at in previous studies, were selected as targets.
  • Among the machine learning algorithms, the multiple linear regression algorithm was applied because it is simple and suitable for real-time prediction as it can rapidly process many variables.
  • Quantitative assessment was performed by comparing the values predicted by the load prediction algorithm with the actual indoor load.

2. Indoor Environment Measurement and Analysis

2.1. Status of the Target Building

The target building is a university building comprising professor laboratories, graduate school laboratories, and lecture rooms, as shown in Figure 1. It is a three-story reinforced concrete (RC) structure with a building area of 1504 m2, as shown in Table 1. When the number of occupants and schedules was analyzed, it was predicted that a constant load would be maintained for most of the professor and graduate school laboratories. However, relatively irregular energy use was expected for lecture rooms due to class schedules and irregular student occupancy.

2.2. Comprehensive Indoor Environment Sensor Module

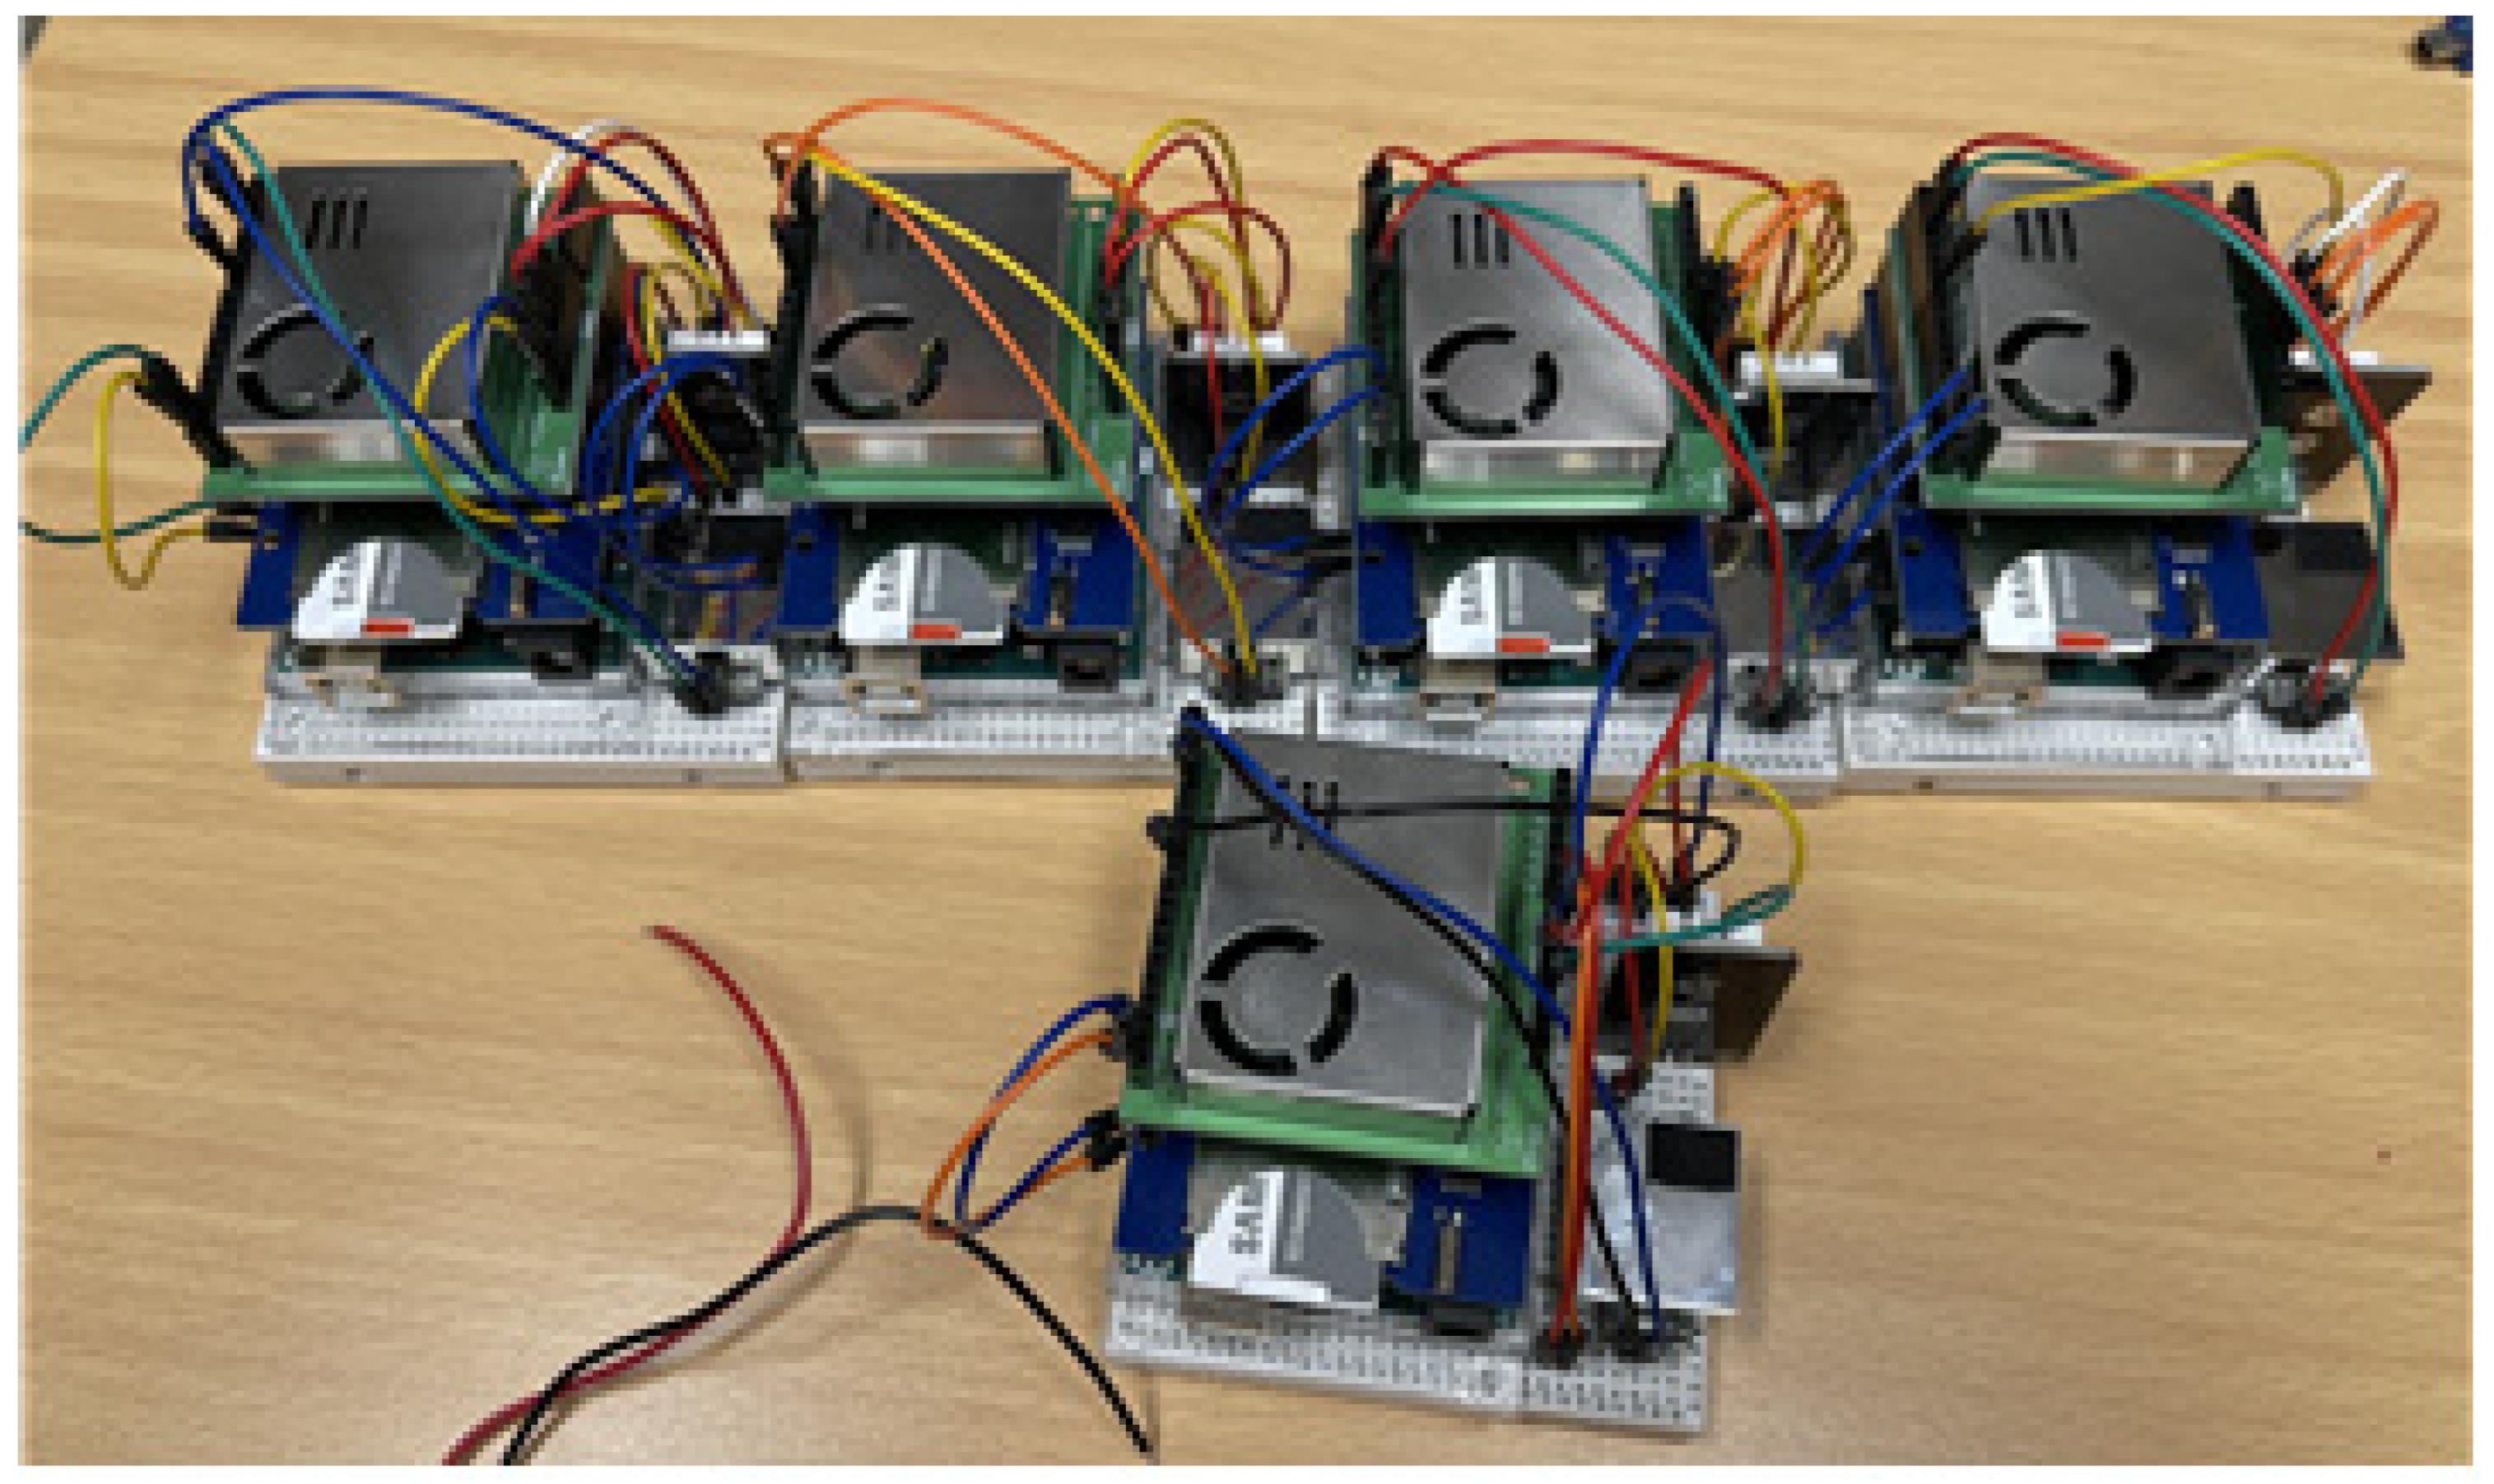
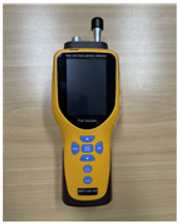
A comprehensive indoor environment sensor module was developed using Arduino, as shown in Figure 2 [19]. The module consists of a temperature and humidity sensor, CO2 sensor, particulate matter (PM) sensor, and light/illuminance sensor, as shown in Table 2. The module is powered by four 3.7 v batteries and is capable of continuous measurement for approximately 25 h, with data measurement and storage possible every minute.

2.3. Verification of the Comprehensive Sensor Module

Considering the comprehensive sensor module (CSM) was not developed with precision sensors, it was verified using precision measuring devices for testing to secure the reliability of the experiment. The precision measuring devices used for sensor accuracy verification are shown in Table 3. Data were collected by performing measurements in a space with stable indoor airflow using the CSM and precision measuring devices. Measurements were performed every minute for 3 h, with the error rate analyzed using the hourly average data, as shown in Table 4.
The CSM showed error rates of 5, 0.3, and 1% for CO2, temperature, and humidity, respectively. As these values are close to the error rate (3%) of the precision devices, the CO2, temperature, and humidity measurement performances of the CSM were considered reliable.
The CSM showed errors of 12 to 18% for PM2.5 and PM10, respectively, possibly because the PM concentration of the module was measured to be lower than the precision devices due to the precision difference and air intake performance of the Arduino sensor.
However, the number of PM2.5 particles measured over time (shown in Figure 3) shows that the PM2.5 increase and decrease patterns were similar for all three measuring devices.
Therefore, the measurements of the CSM were used without additional correction because this study analyzed the increase and decrease patterns according to indoor environment changes, such as the number of occupants and air conditioning.

2.4. Measurement Method

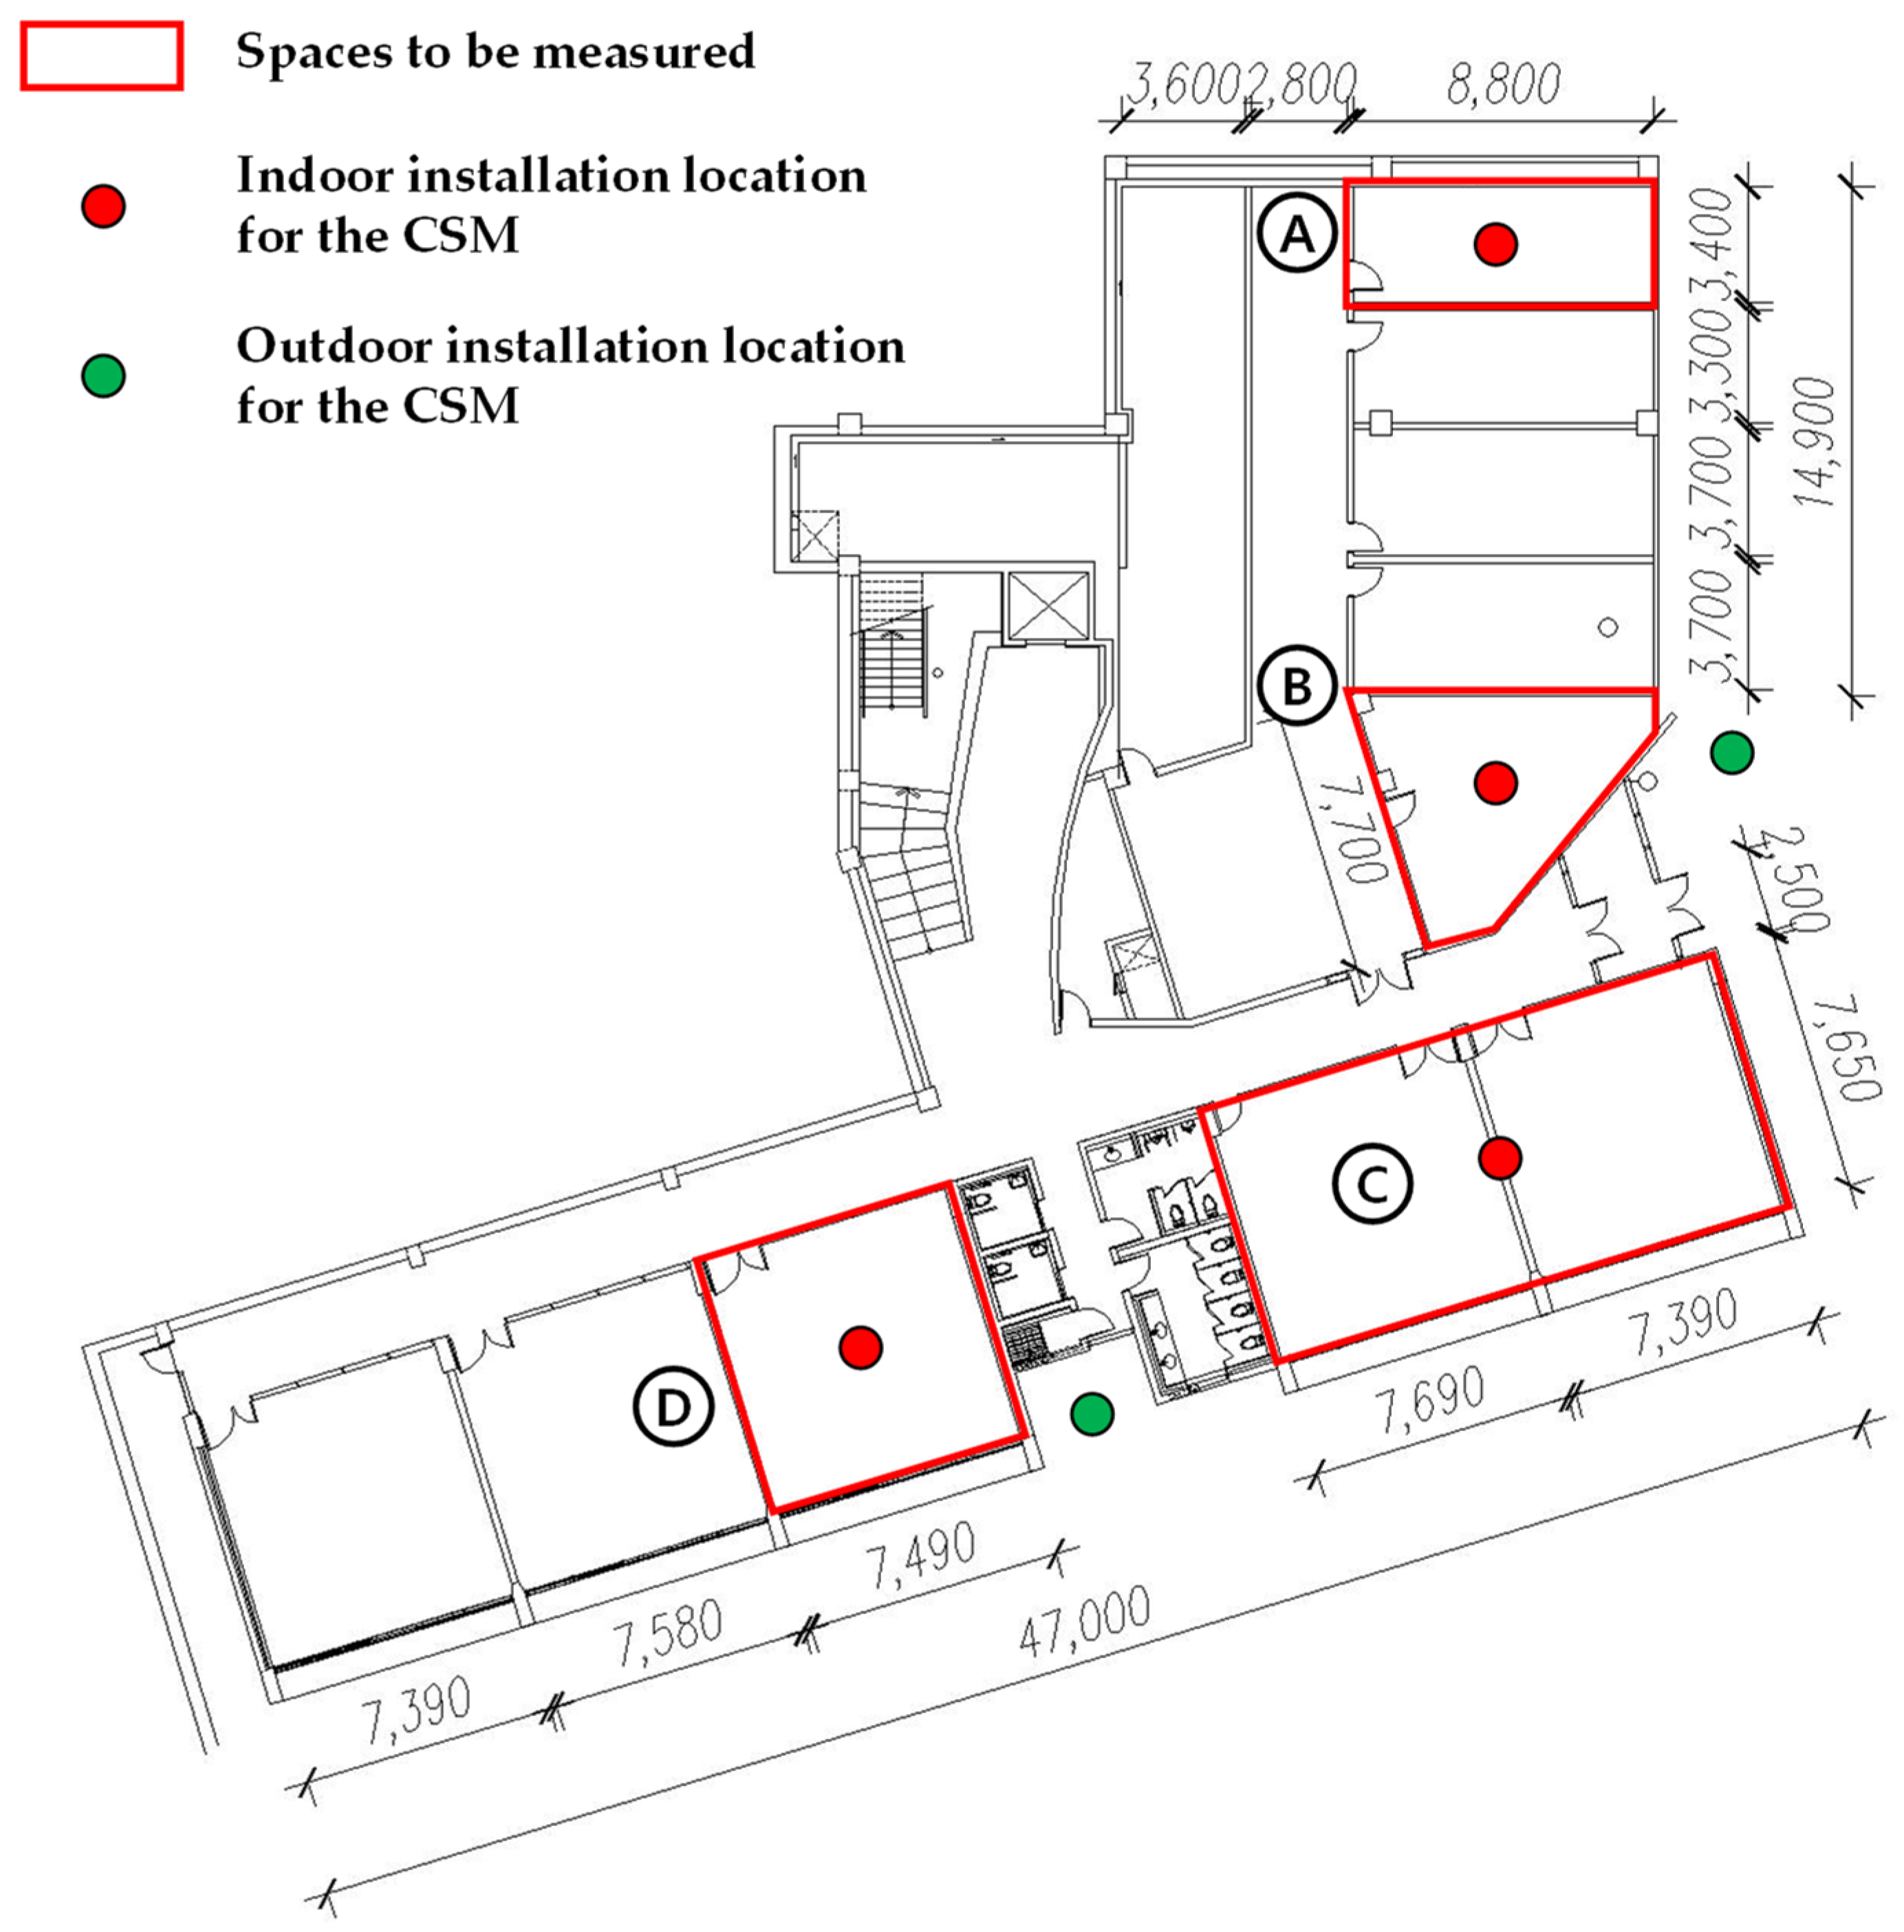
Figure 4 shows the spaces to be measured and the installation locations of the CSM. Spaces A and B are laboratories with a relatively constant number of occupants, while Spaces C and D are lecture rooms. The CSM was installed in the four target spaces to measure the indoor environment, with two additional units installed to measure the outdoor environment. To prevent sensor malfunction errors, data were supplemented by installing one additional CSM at each measurement point. The experiment was performed for ten days from 2 to 15 September, excluding weekends (when there were no occupants).

3. Proposal of a Real-Time Load Prediction Method

Overview of a Real-Time Load Prediction Algorithm

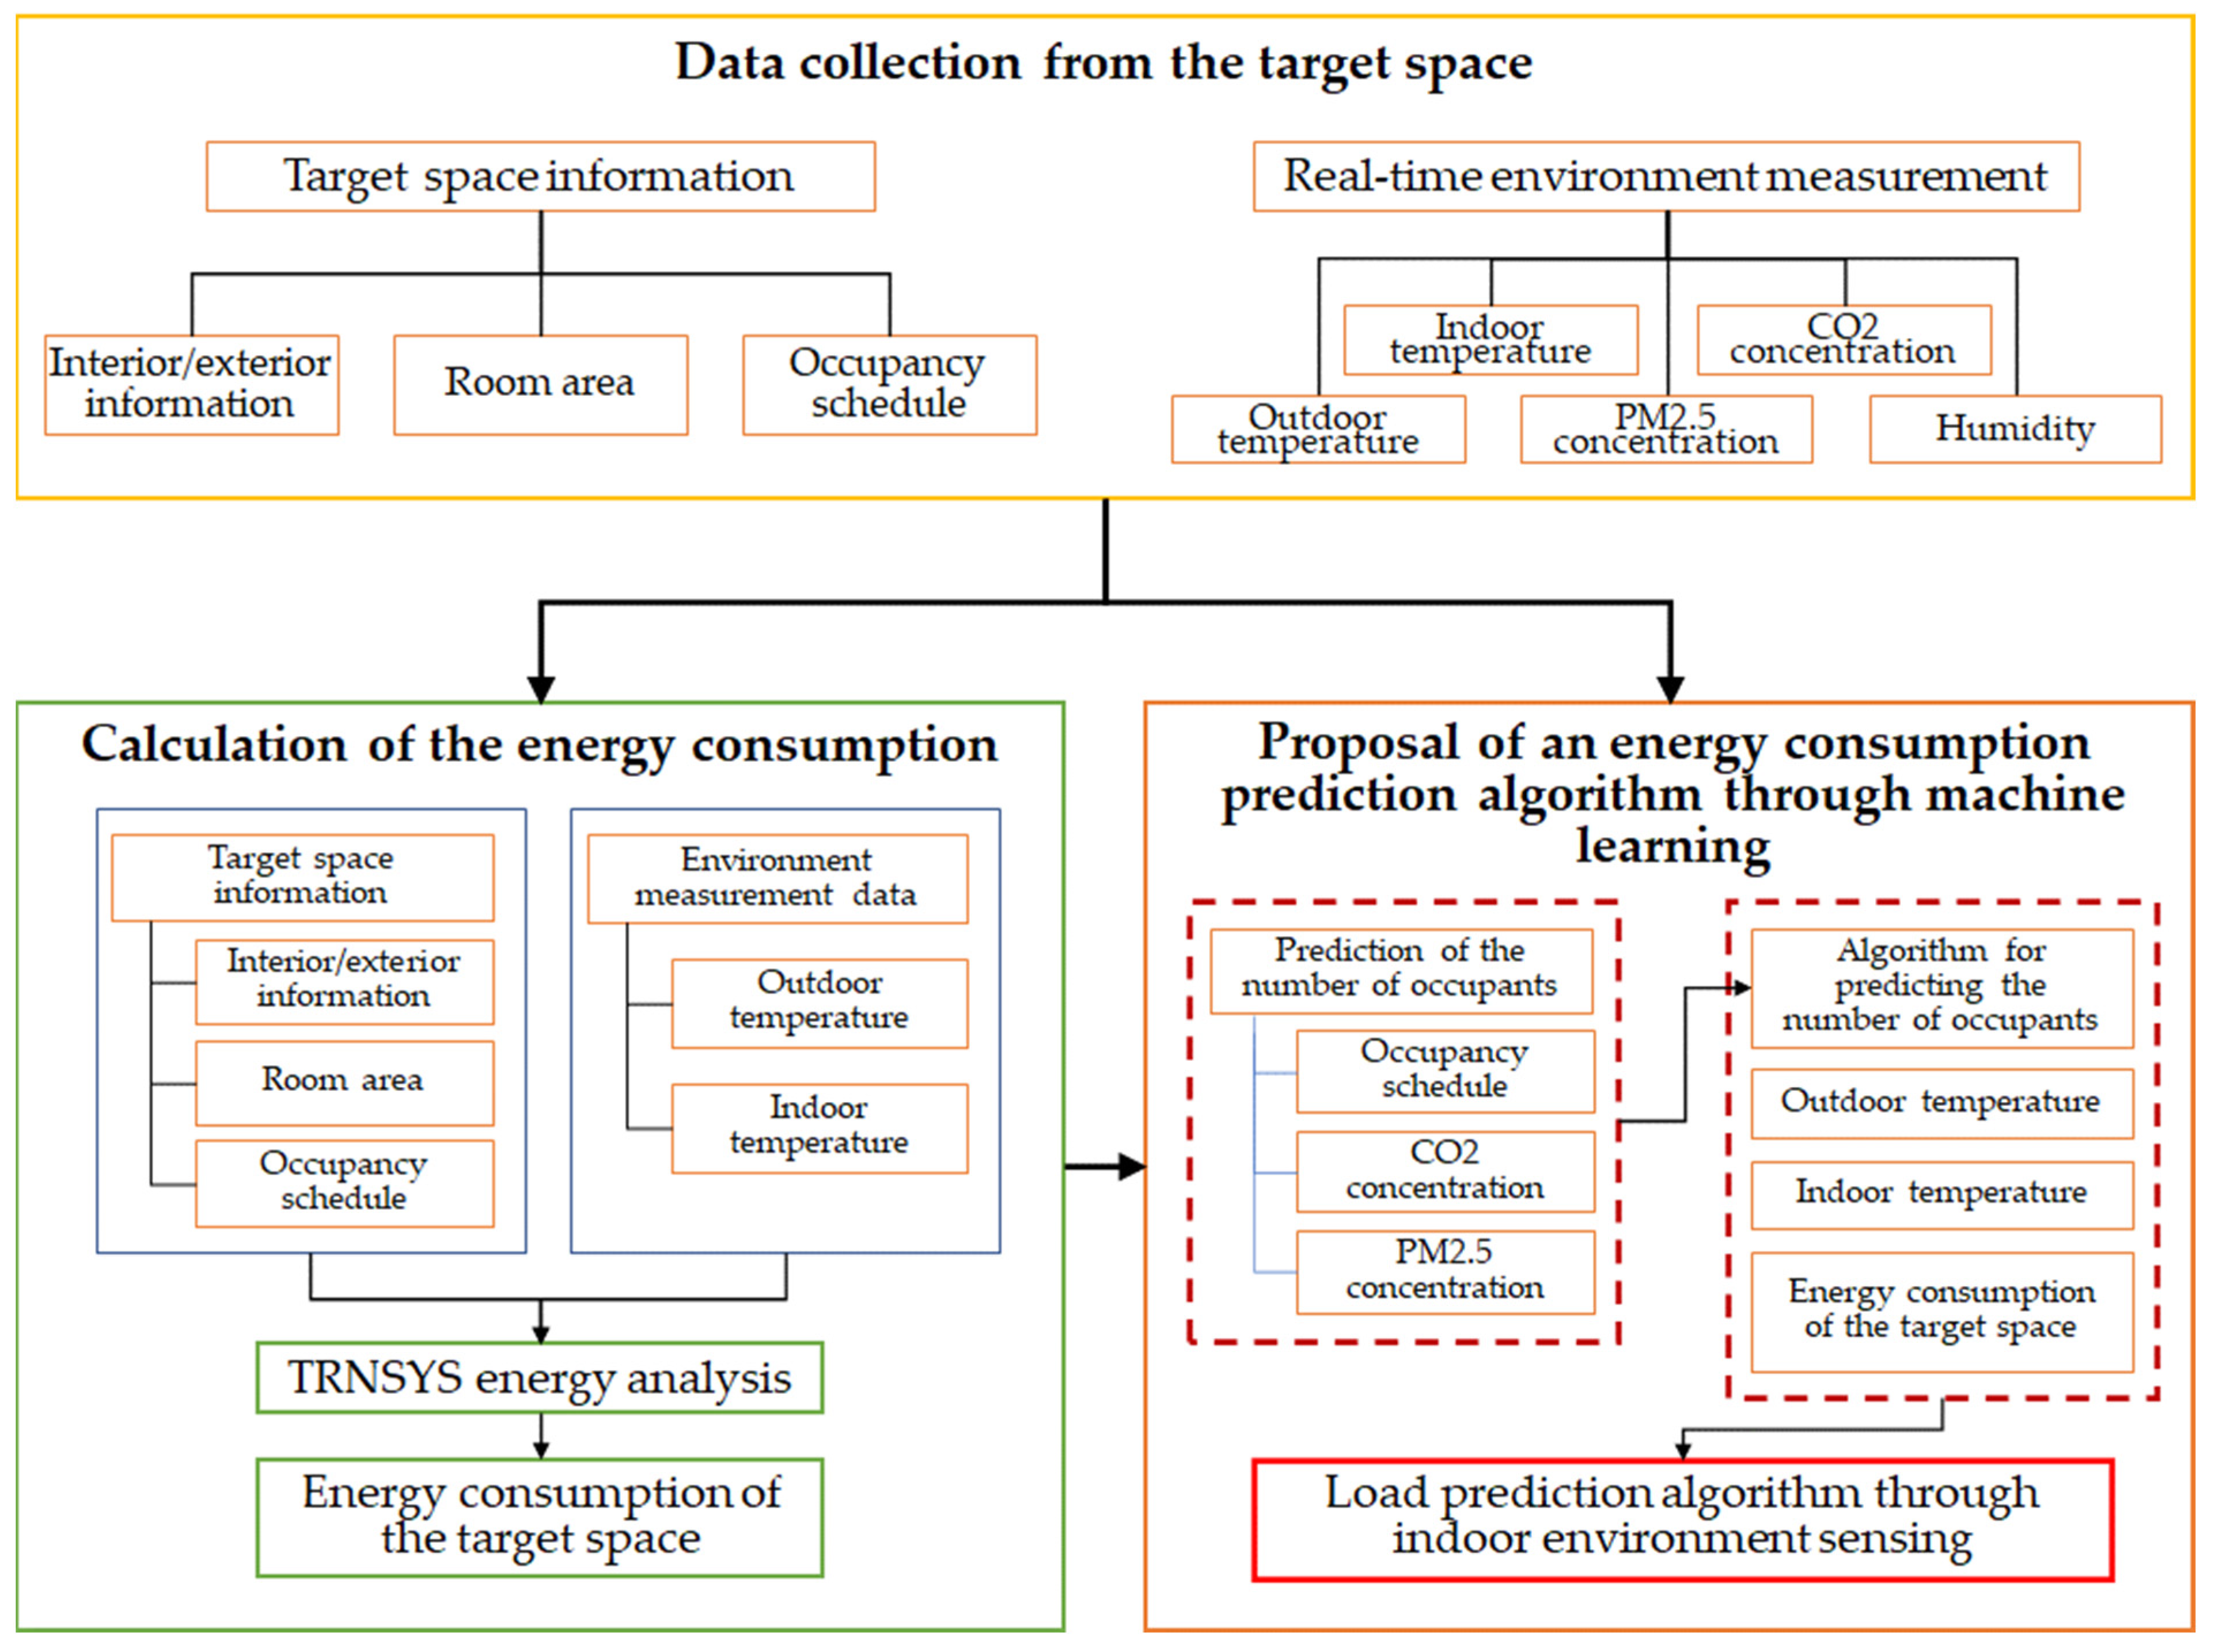
The temperature, humidity, CO2 concentration, and PM (PM2.5) concentration of each room were measured using the sensor; the number of occupants was measured through the schedule and observation of each room. Such comprehensive indoor environment measurements were necessary to develop a real-time load prediction algorithm. The energy consumption of each room was analyzed by applying the measured data as the input data of the TRNSYS energy analysis software. An algorithm for predicting the number of occupants was developed using machine learning to analyze the temperature, humidity, CO2 concentration, and PM concentration according to the number of occupants.
In addition, an algorithm for predicting the load according to the number of occupants was proposed by analyzing the energy consumption analysis data for each room and the algorithm for predicting the number of occupants using machine learning.
In this study, a hypothesis that the indoor temperature, humidity, CO2 concentration, and PM will increase alongside the increase in the number of occupants was established [20,21,22], and the linear regression analysis algorithm was selected as a machine learning algorithm under the judgment that there would be a certain linear relationship between the measured indoor environment data and the number of occupants. These algorithms are supervised learning algorithms for predicting correlations between data and their trends. Among such linear regression analysis algorithms, the multiple linear regression analysis algorithm was used in this study due to the presence of multiple variables, such as temperature, humidity, CO2 concentration, PM concentration, and the number of occupants.
Equation (1) is the basic equation of the multiple linear regression model. X is an explanatory variable, and Y is the response variable. w0 is the y-intercept, and w1, w2… are the coefficients of the explanatory variables.
Y = w 0 + w 1 X 1 + w 2 X 2 + w 3 X 3 + + w p X p
TRNSYS energy analysis software was used for calculating the target space energy consumption, as shown in Figure 5. A simulation was performed to calculate the energy consumption through the input of the wall and window structures of the target space, the equipment data, and the indoor and outdoor temperature and humidity among the measured data as variables. In addition, indoor heating equipment and the number of occupants were considered as variables.

4. Results and Discussion

4.1. Analysis of the Indoor Environment of the Target Building

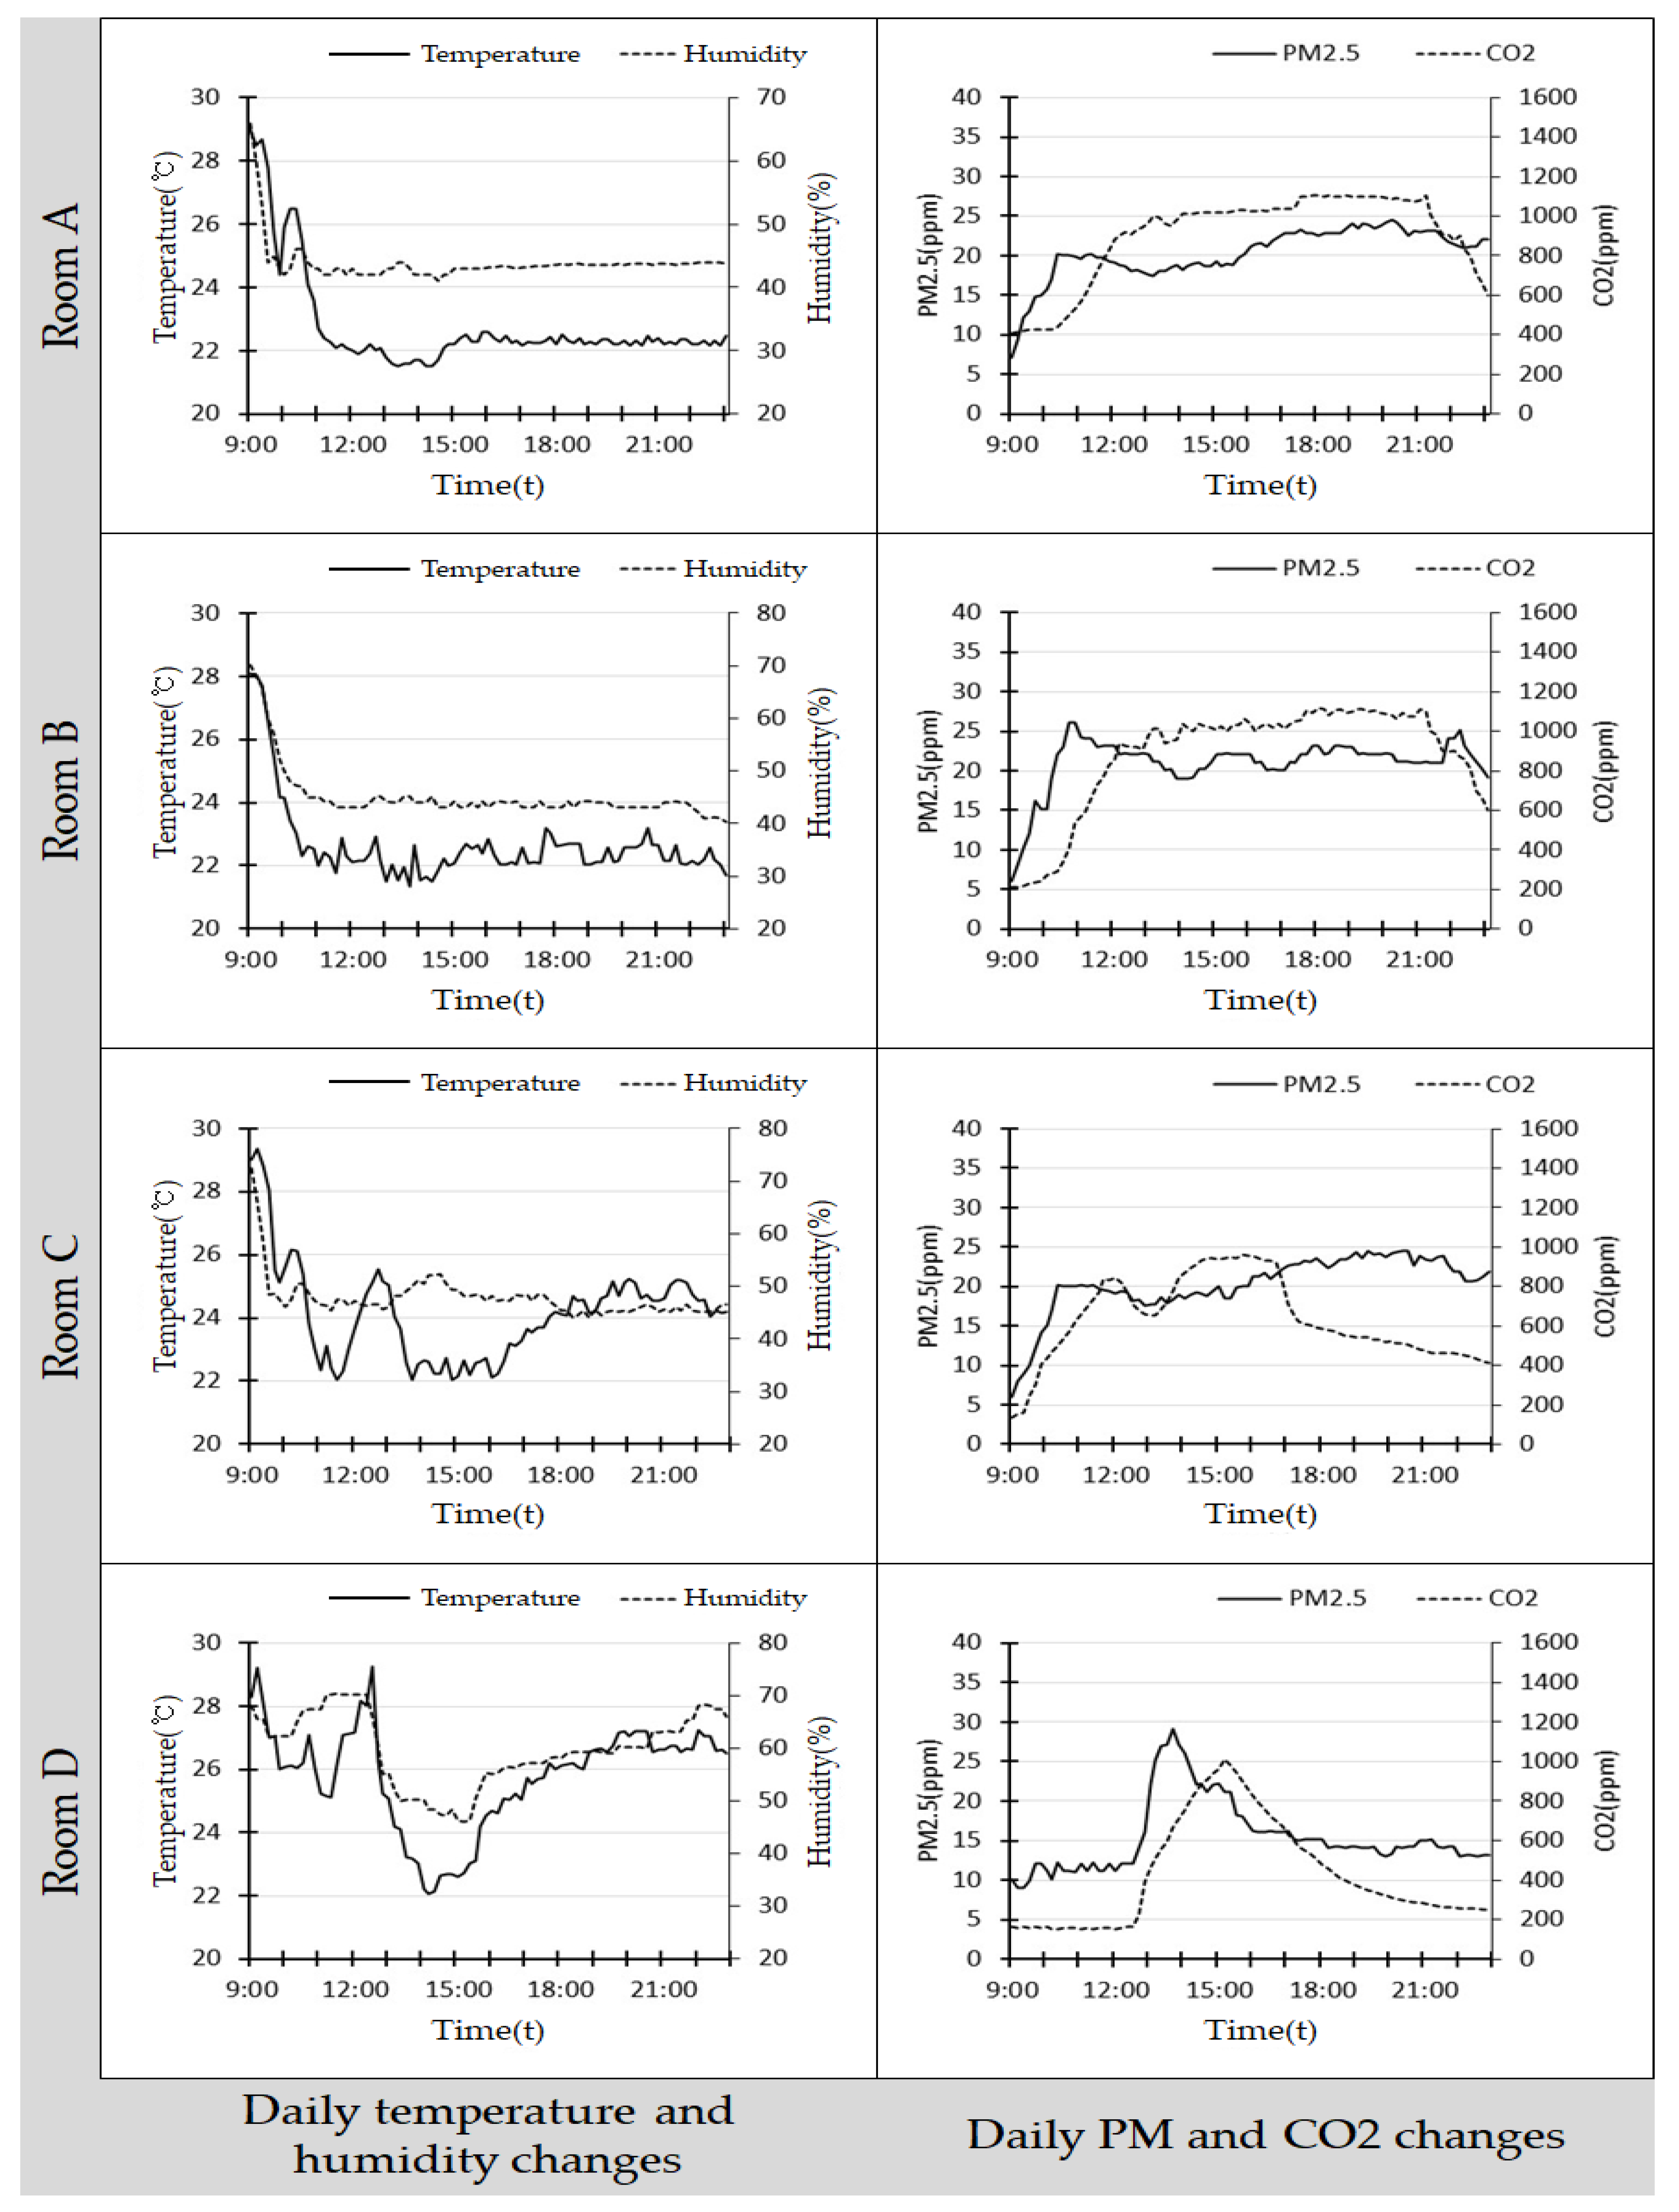
A day with relatively stable measurement results was selected during the measurement period, with changes in the daily indoor temperature, humidity, PM2.5 concentration, and CO2 concentration compared and analyzed, as shown in Figure 6. The indoor temperature was found to vary depending on the operation of EHP (air conditioner) rather than changes in the number of occupants; the humidity was relatively constant regardless of changes in occupant numbers. The number of PM2.5 particles was inversely proportional to the CO2 concentration due to the influence of changing occupant numbers, activities, and ventilation.
For Rooms A and B, which were laboratories, the indoor environment was found to be relatively constant after the entrance of occupants because the number of occupants did not significantly change. In the case of Rooms C and D, which were lecture rooms, the indoor temperature varied significantly depending on indoor cooling due to severe fluctuations in the number of occupants. However, the humidity was irregular under external influence.
PM and CO2 were found to increase or decrease relatively regularly according to changes in the occupant number in all rooms, regardless of the measurement location. These two can be set as the reference variables of the algorithm because the change in the number of occupants is closely related to variations in indoor PM and CO2 concentrations.
The PM2.5 concentration was found to be proportional to the ventilation rate or occupant activity rather than occupant number, while the CO2 concentration varied constantly according to changes in occupant number, indicating that the PM2.5 concentration may decrease despite many indoor occupants if the occupant activity is low, as would be the case during a lecture.

4.2. Algorithm for Predicting the Number of Indoor Occupants

The algorithm for predicting the number of indoor occupants was developed using the multiple linear regression model to analyze the occupant number and the data measured through the CSM. The significance of the proposed algorithm was analyzed using statistical techniques for testing algorithms, such as the sample regression coefficient, standard deviation, and significance level, as shown in Table 5. The regression coefficient shows the influence of the independent variable on the dependent variable; the influence increases with the absolute value of the coefficient. The standard deviation indicates a relationship by measuring the nominal scale between variables. The significance level represents the significance and significance probability of the proposed algorithm data and the actual data. In statistical research, a significance level of 0.05 or less typically corresponds to a significant algorithm.
For the algorithm to predict the occupant number, the regression coefficient of the CO2 concentration was found to be 24.074, indicating that the CO2 concentration has the largest influence on predicting the number of indoor occupants. As the value of the significance level (0.002) was close to zero, the algorithm was found to be highly significant.
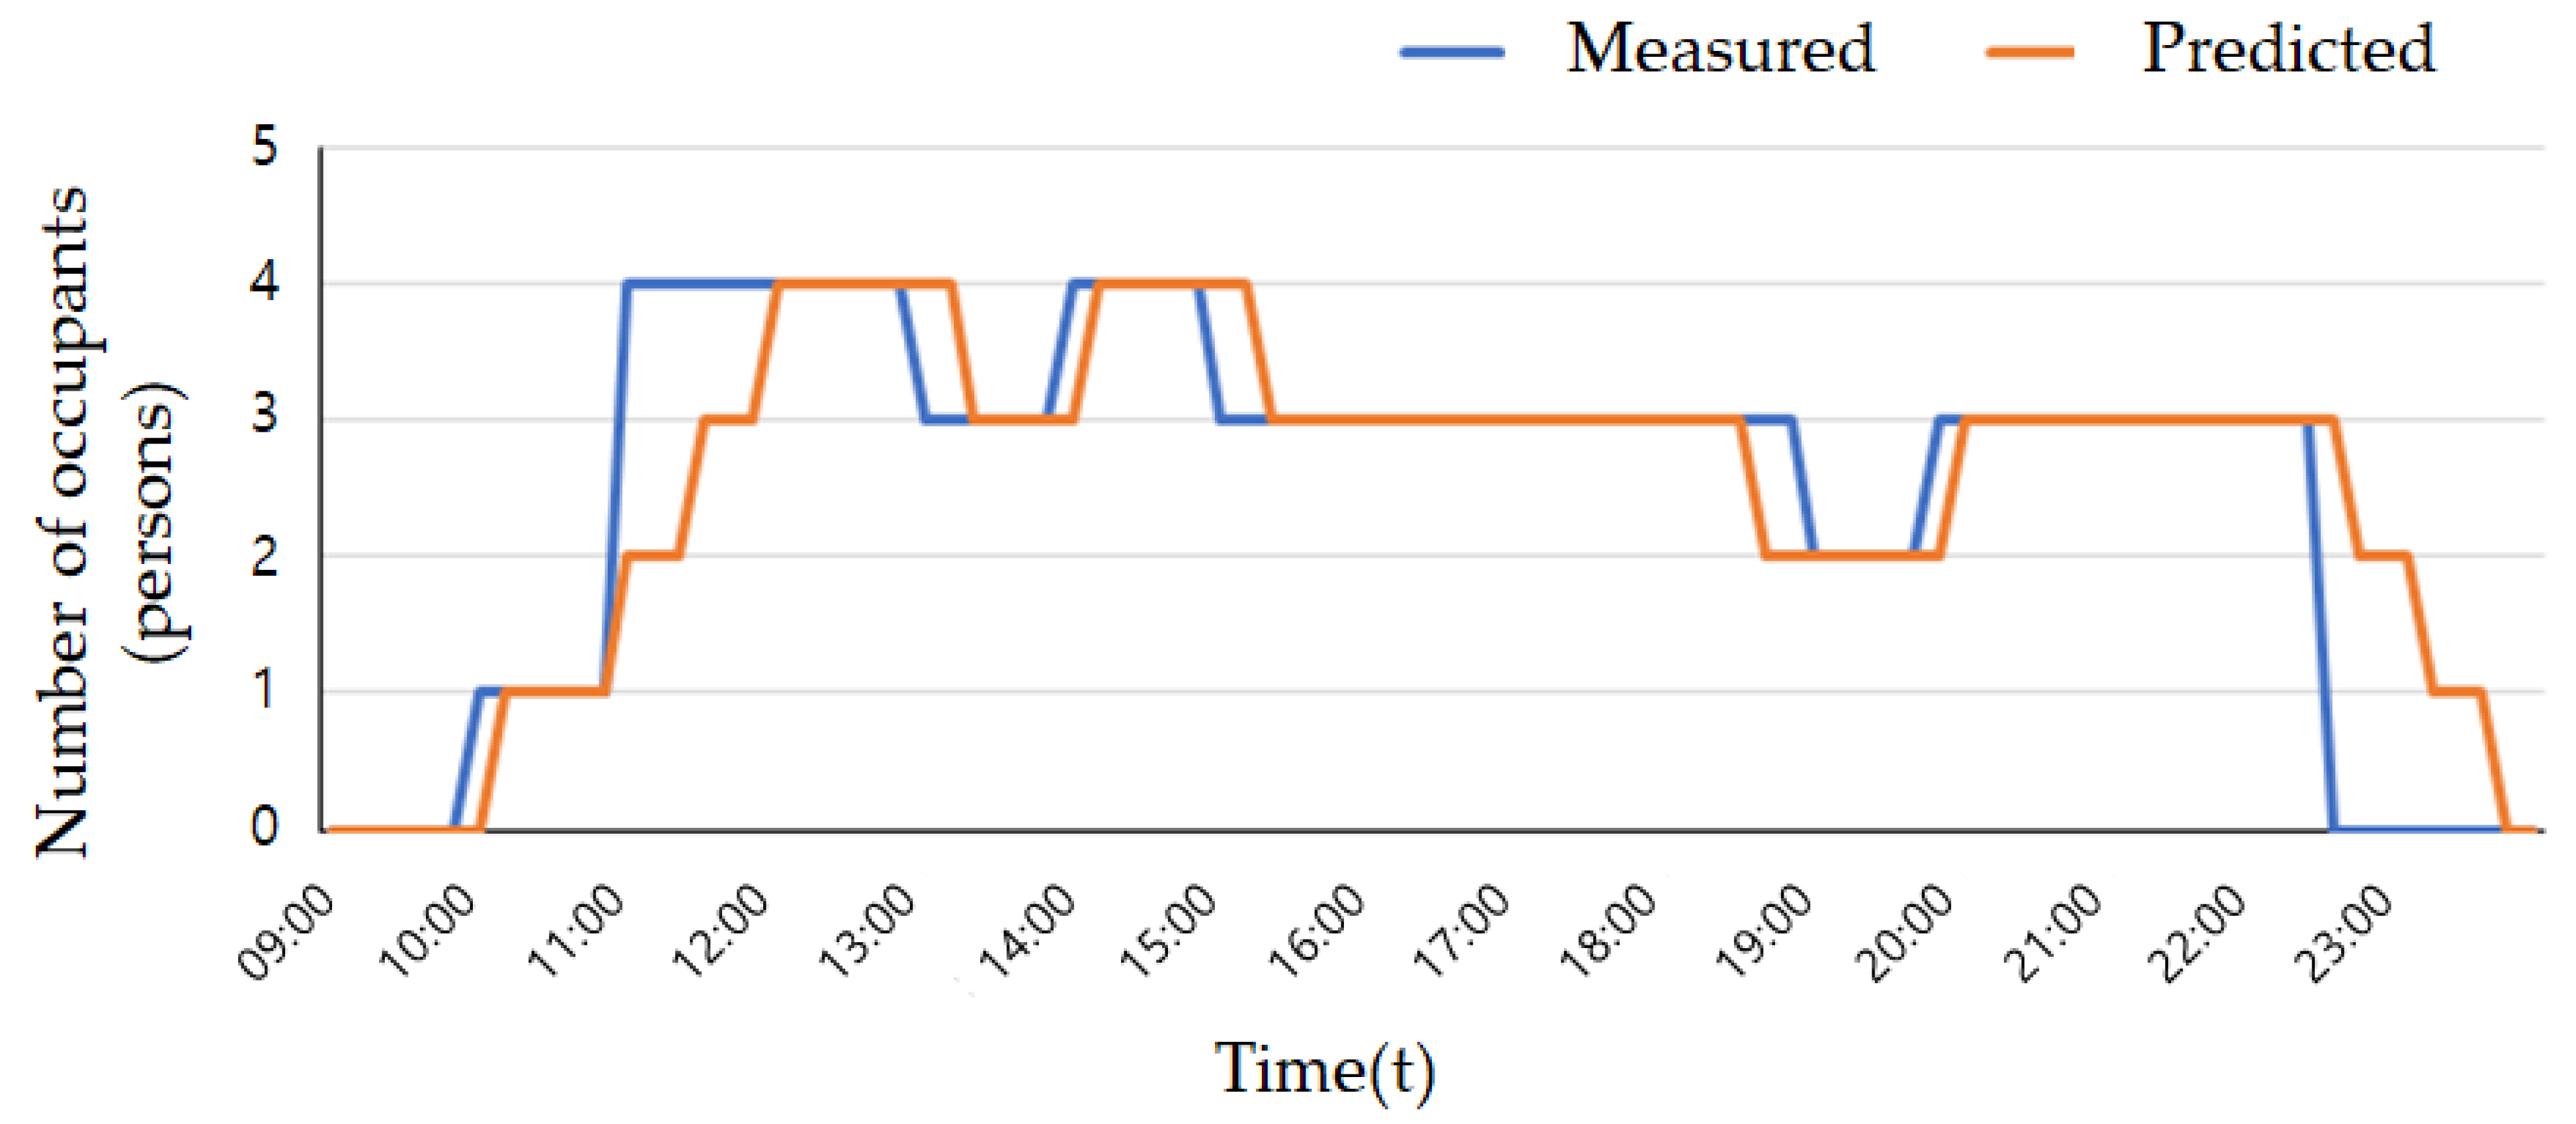
The number of occupants in Room A on measurement Day 1 was predicted using the proposed algorithm. When the results were compared with the measured values, as shown in Figure 7, errors occurred as gradual changes in the number of indoor occupants were predicted according to changes in indoor environments. Slight errors were also observed in the predicted occupancy time compared to the measured values because the number of occupants was calculated using the indoor environment measurement data. However, as the occupancy time of residents was found to be almost identical, it can be concluded that the algorithm is reliable.

4.3. Derivation and Verification of the Algorithm for Predicting the Load in Real Time

The energy consumption of each room was calculated by entering the data measured using the CSM and the number of occupants predicted through the algorithm for predicting the number of occupants into the TRNSYS energy analysis software as variables and conducting energy analysis, as shown in Table 6.
An algorithm for predicting the actual energy consumption according to the difference between indoor/outdoor environmental variables and the number of occupants was implemented by entering the following as variables: measured indoor/outdoor temperature, humidity, and CO2 concentration data; number of occupants calculated using the occupant prediction algorithm; and energy consumption calculated through TRNSYS energy analysis into the multiple linear regression model.
The significance of the proposed algorithm was analyzed, with the results shown in Table 7. The number of occupants (predicted) showed the highest regression coefficient (35.1), followed by the indoor temperature (31.1) and indoor CO2 concentration (29). The p-value was also closest to zero for the number of occupants (predicted), indoor temperature, and indoor CO2 concentration.
Therefore, it was found that the predicted energy consumption is significantly affected by the number of occupants (predicted), indoor temperature, and indoor CO2 concentration. This appears to be because indoor and outdoor temperatures were used for the actual indoor load and the number of occupants was predicted using the indoor CO2 concentration.
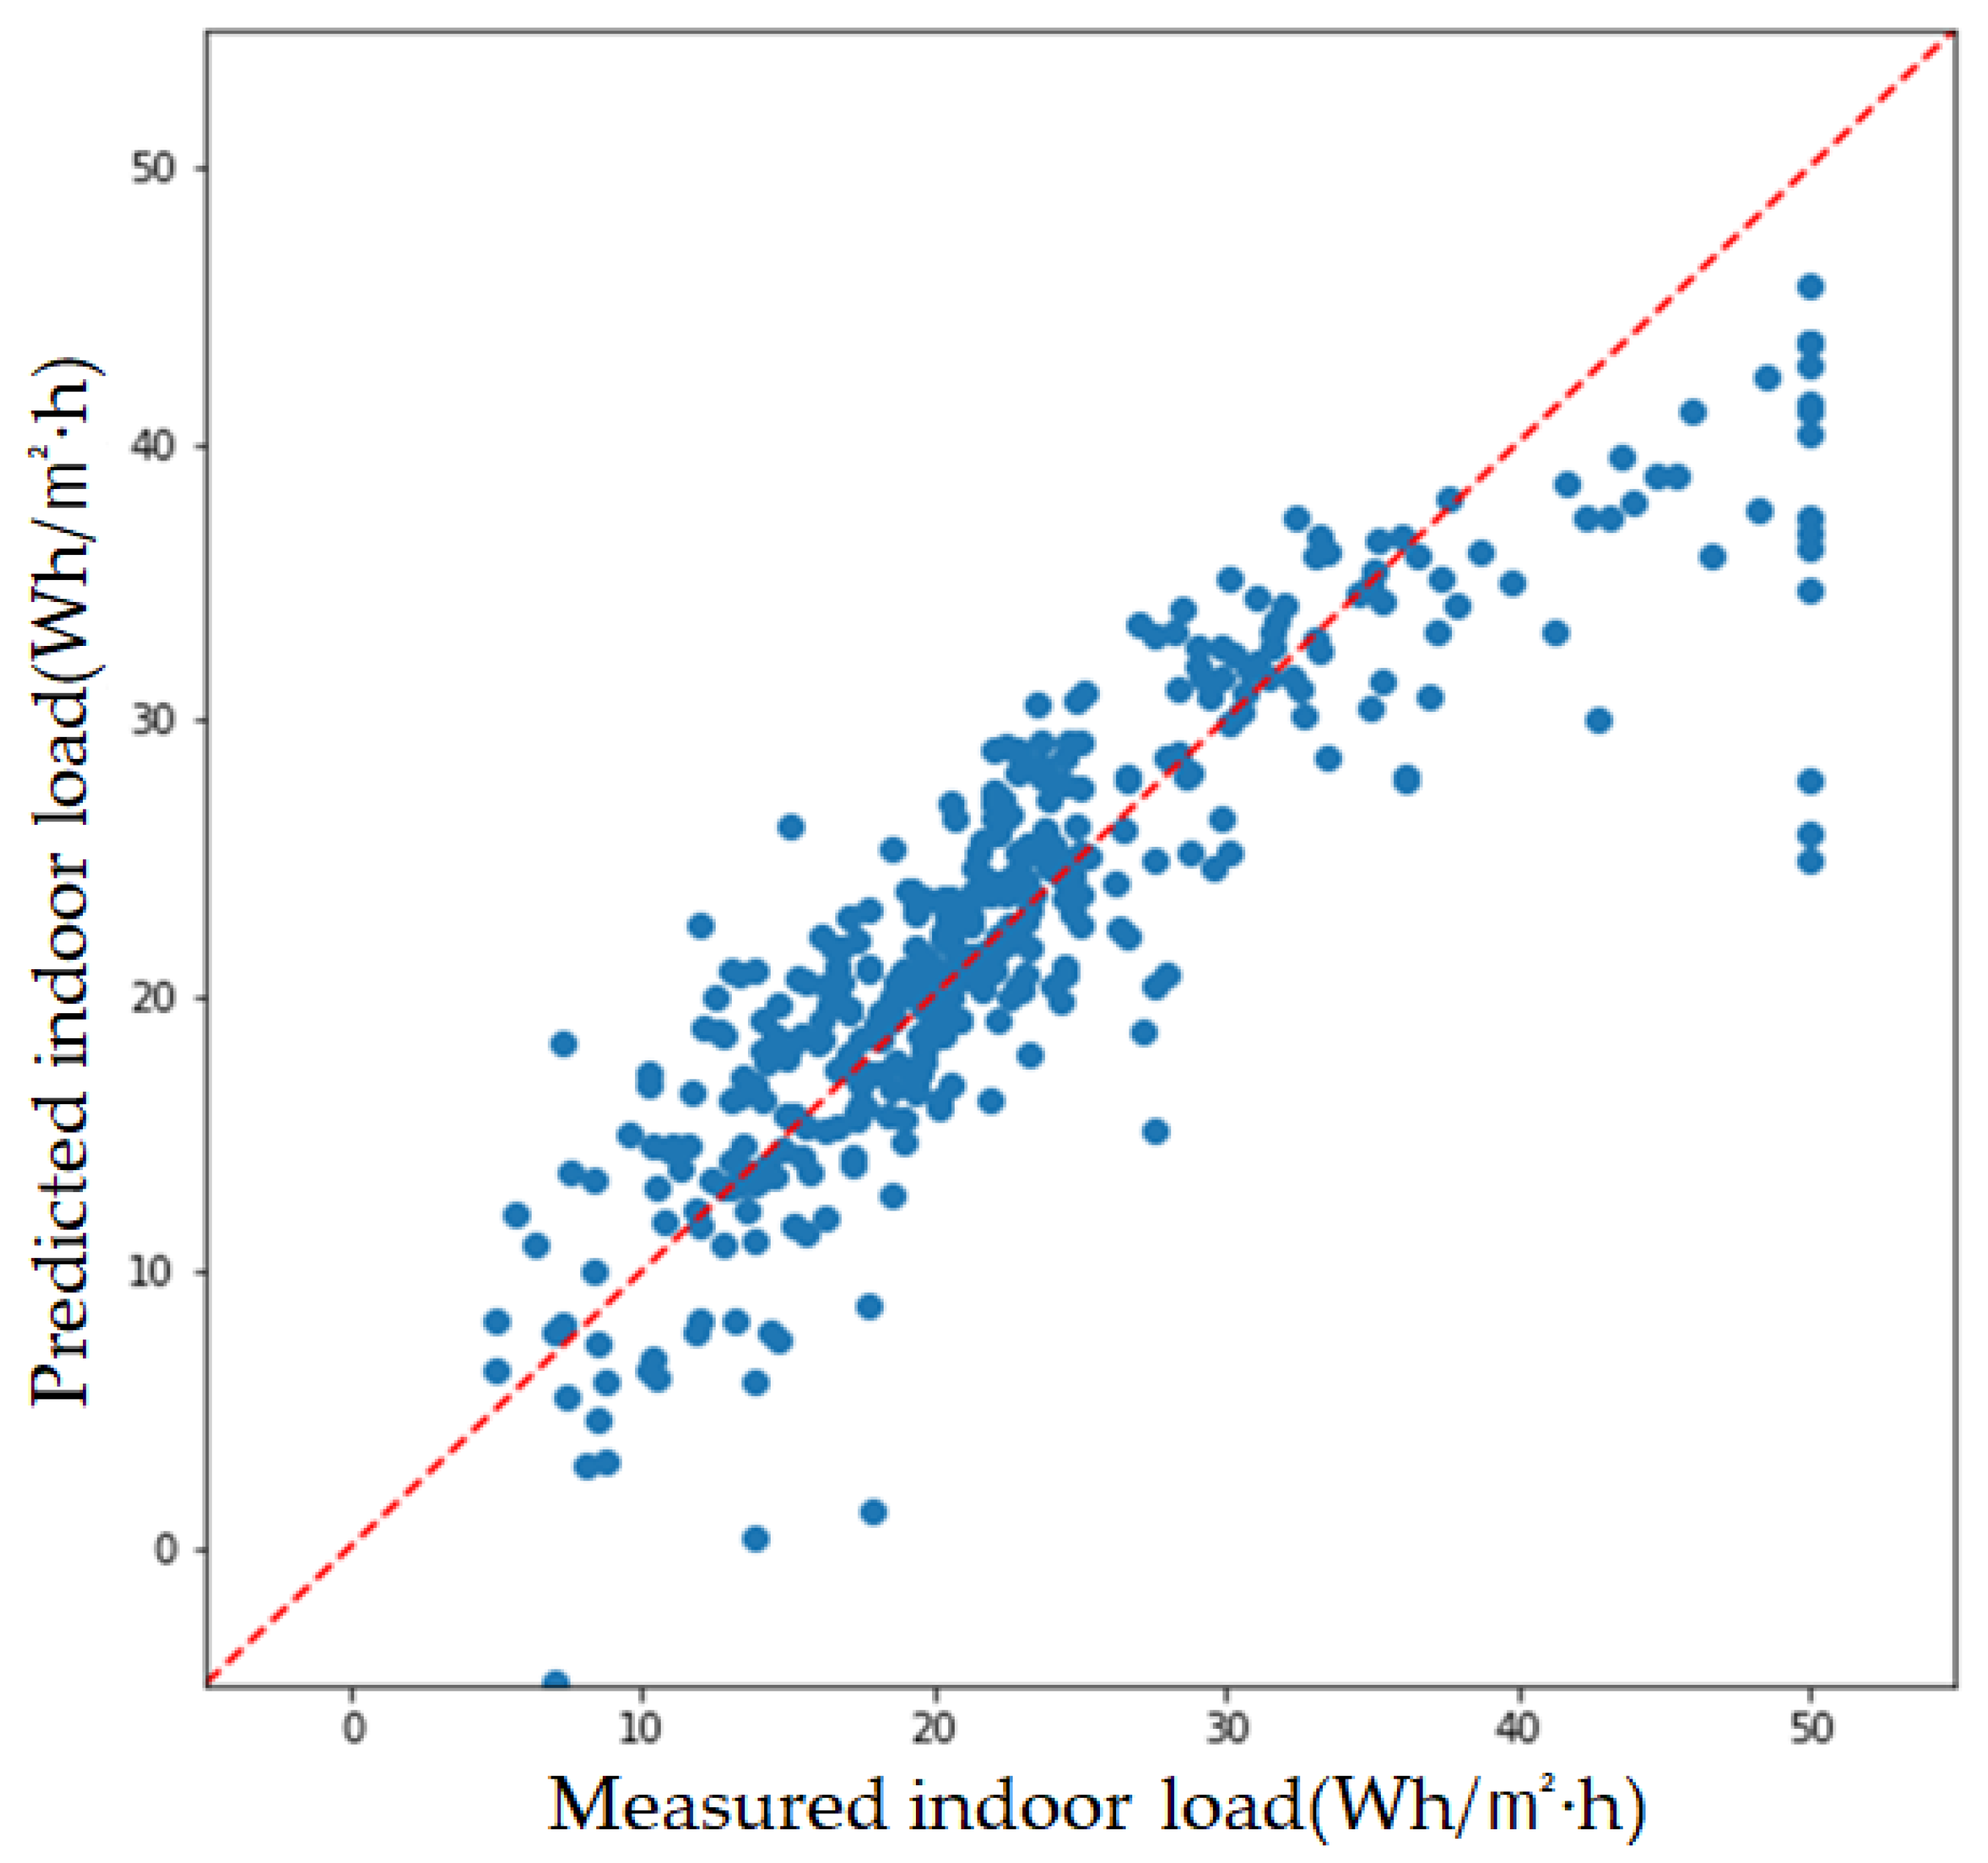
The measurement data of the indoor environment of Room A and the algorithm for predicting the occupant number were applied to the proposed load prediction algorithm as variables. Then, the results were compared with the measured values, as shown in Figure 8. The degree of similarity between the data predicted using the algorithm and the measured data was analyzed. As shown in Figure 8, the degree of data distribution is very similar for the predicted and measured load data with respect to the X = Y line.
Quantitative analysis methods used to analyze and evaluate the difference between the value estimated by machine learning or predicted by a model with the value measured in the actual environment include the mean squared error (MSE), root mean square deviation (RMSD), and mean absolute error (MAE), which are calculated using Equations (2)–(4).
1 n i = 1 n ( y i y ^ i ) 2
1 n i = 1 n | y i y ^ i |
The MSE, RMSD, and MAE of the proposed load prediction algorithm were calculated, as shown in Table 8. MSE is the average of the squares of the errors between the measured and predicted values. An MSE closer to zero indicates that the predicted value is closer to the original value and thus corresponds to higher accuracy. RMSD is the standard deviation for the error between the measured and predicted values, representing the degree of dispersion based on the regression line as a value. Thus, an RMSD closer to zero corresponds to higher accuracy. MAE is mainly used as an indicator for regression assessment; an MAE closer to zero indicates a model of higher quality.
Therefore, the accuracy and quality of the proposed load prediction algorithm are considered high because the RMSD and MAE were calculated to be 4.8 and 2.5, respectively. However, the MSE was calculated to be 23.1, indicating that the accuracy can be evaluated to be relatively low.

5. Conclusions

This study investigated algorithms for the automatic control of equipment according to the indoor environment to save energy in buildings. Algorithms for predicting the number of occupants and energy consumption using a simple comprehensive indoor/outdoor environment sensor module were proposed. The results can be summarized as follows.
  • When the indoor environment of the measured space was analyzed using the CSM, the temperature, humidity, particulate matter (PM), and CO2 level changed according to variations in occupant numbers. When the significance of machine learning was tested for the prediction of occupant number, the regression coefficient and significance level of CO2 were calculated to be 24 and 0.002, respectively, indicating that the CO2 concentration is closely related to the occupant number.
  • A load prediction algorithm was proposed by reflecting the algorithm for predicting the number of occupants according to the CO2 concentration. When the significance of each variable was tested, the regression coefficient and significance level of indoor temperature were calculated to be 31 and 0.001, respectively, excluding the CO2 concentration reflected in the occupant prediction algorithm and the number of occupants. This result indicates that the energy consumption prediction algorithm is closely related to the predicted number of occupants and indoor temperature.
When the accuracy of the proposed load prediction algorithm was quantitatively assessed, the mean squared error (MSE), root mean square deviation (RMSD), and mean absolute error (MAE) were calculated to be 23.1, 4.8, and 2.5, respectively. As the RMSD and MAE values are close to zero even though the MSE value is not relatively close to zero, the accuracy and quality of the proposed algorithm can be considered to be high.
According to the results of this study, we propose a simple and new method to indirectly predict occupant numbers using the CO2 concentration and predict the energy consumption using the predicted occupant number and the indoor and outdoor temperatures measured in real time.
In particular, the proposed load prediction algorithm is economical compared to the existing method that uses several precision sensors and energy consumption measuring devices because it measures the indoor environment using relatively inexpensive sensors. The algorithm also has high usability because it can be easily applied to spaces in existing buildings.
However, the proposed algorithm is limited to school buildings. Therefore, in the future, it is necessary to expand the usability and reliability of the proposed model by applying various types of building data and comparing it with the existing method that uses precision sensors.

Author Contributions

Writing—original draft preparation, Y.K.; writing—review and editing, Y.K., Y.P. and H.S.; project administration, Y.K. and Y.P.; supervision, J.H.; All authors have read and agreed to the published version of the manuscript.

Funding

This work was supported by the National Research Foundation of Republic of Korea (NRF) grant funded by the Republic of Korea government (MSIT) (No. 2020R1C1C1007127 and 2022R1A2C1008535).

Conflicts of Interest

The funders had no role in the design of the study; in the collection, analyses, or interpretation of data; in the writing of the manuscript, or in the decision to publish the results.

References

  1. Chu, W.; Vicidomini, M.; Calise, F.; Duić, N.; Østergaard, P.A.; Wang, Q.; da Graça Carvalho, M. Recent Advances in Technologies, Methods, and Economic Analysis for Sustainable Development of Energy, Water, and Environment Systems. Energies 2022, 15, 7129. [Google Scholar] [CrossRef]
  2. Ministry of Foreign Affairs of KOREA, The Republic of Korea’s Enhanced Update of its First Nationally Determined Contributionits. 2021. Available online: https://www.mofa.go.kr/www/brd/m_4080/view.do?seq=371966 (accessed on 23 December 2019).
  3. Ministry of Trade, Industry and Energy of KOREA, Industry and Energy (New Renewable Energy Policy Division). New Energy and Renewable Energy Development, Use, and Spread Promotion Law. 2005. Available online: https://www.law.go.kr/lsInfoP.do?lsiSeq=231683#0000 (accessed on 4 December 1987).
  4. Ministry of Land, Infrastructure and Transport of KOREA, Building Energy Certification Rules. 2017. Available online: https://www.law.go.kr/lsInfoP.do?lsiSeq=191338#0000 (accessed on 20 May 2013).
  5. KOREA Energy Agency, 2021 Energy Statistics Handbook. 2021. Available online: https://www.energy.or.kr/web/kem_ho-me_new/info/statistics/data/kem_list.asp (accessed on 3 August 2021).
  6. Ragab, K.M.; Orhan, M.F.; Saka, K.; Zurigat, Y. A Study and Assessment of the Status of Energy Efficiency and Conservation at School Buildings. Sustainability 2022, 14, 10625. [Google Scholar] [CrossRef]
  7. Mancini, F.; Nardecchia, F.; Groppi, D.; Ruperto, F.; Romeo, C. Indoor Environmental Quality Analysis for Optimizing Energy Consumptions Varying Air Ventilation Rates. Sustainability 2020, 12, 482. [Google Scholar] [CrossRef] [Green Version]
  8. Zinzi, M.; Pagliaro, F.; Agnoli, S.; Bisegna, F.; Iatauro, D. On the Built-Environment Quality in Nearly Zero-Energy Renovated Schools: Assessment and Impact of Passive Strategies. Energies 2021, 14, 2799. [Google Scholar] [CrossRef]
  9. Franco, A.; Bartoli, C.; Conti, P.; Miserocchi, L.; Testi, D. Multi-Objective Optimization of HVAC Operation for Balancing Energy Use and Occupant Comfort in Educational Buildings. Energies 2021, 14, 2847. [Google Scholar] [CrossRef]
  10. Simanic, B.; Nordquist, B.; Bagge, H.; Johansson, D. Influence of User-Related Parameters on Calculated Energy Use in Low-Energy School Buildings. Energies 2020, 13, 2985. [Google Scholar] [CrossRef]
  11. Kim, E.; Ha, Y. Vitalization Strategies for the Building Energy Management System (BEMS) Industry Ecosystem Based on AHP Analysis. Energies 2021, 14, 2559. [Google Scholar] [CrossRef]
  12. Hwang, J.S.; Rosyiana Fitri, I.; Kim, J.-S.; Song, H. Optimal ESS Scheduling for Peak Shaving of Building Energy Using Accuracy-Enhanced Load Forecast. Energies 2020, 13, 5633. [Google Scholar] [CrossRef]
  13. Cho, J.-K.; Moon, J.; Kang, H. Energy Performance Analysis for Energy Saving Potentials of a Hospital Building: A Case Study Methodology Based on Annual Energy Demand Profiles. Korean J. Air-Cond. Refrig. Eng. 2017, 29, 29–37. [Google Scholar] [CrossRef]
  14. Jeon, B.-K.; Kim, E.-J. White-Model Predictive Control for Balancing Energy Savings and Thermal Comfort. Energies 2022, 15, 2345. [Google Scholar] [CrossRef]
  15. Moayedi, H.; Mosavi, A. Double-Target Based Neural Networks in Predicting Energy Consumption in Residential Buildings. Energies 2021, 14, 1331. [Google Scholar] [CrossRef]
  16. Khan, A.-N.; Iqbal, N.; Rizwan, A.; Ahmad, R.; Kim, D.-H. An Ensemble Energy Consumption Forecasting Model Based on Spatial-Temporal Clustering Analysis in Residential Buildings. Energies 2021, 14, 3020. [Google Scholar] [CrossRef]
  17. Kumari, A.; Vekaria, D.; Gupta, R.; Tanwar, S. Redills: Deep Learning-Based Secure Data Analytic Framework for Smart Grid Systems. In Proceedings of the 2020 IEEE International Conference on Communications Workshops (ICC Workshops), Dublin, Ireland, 7–11 June 2020. [Google Scholar] [CrossRef]
  18. Ayub, N.; Irfan, M.; Awais, M.; Ali, U.; Ali, T.; Hamdi, M.; Alghamdi, A.; Muhammad, F. Big Data Analytics for Short and Medium-Term Electricity Load Forecasting Using an AI Techniques Ensembler. Energies 2020, 13, 5193. [Google Scholar] [CrossRef]
  19. Chekired, F.; Taabli, O.; Khellili, Z.M.; Tilmatine, A.; de Almeida, A.T.; Canale, L. Near-Zero-Energy Building Management Based on Arduino Microcontroller—On-Site Lighting Management Application. Energies 2022, 15, 9064. [Google Scholar] [CrossRef]
  20. Grygierek, K.; Ferdyn-Grygierek, J. Design of Ventilation Systems in a Single-Family House in Terms of Heating Demand and Indoor Environment Quality. Energies 2022, 15, 8456. [Google Scholar] [CrossRef]
  21. Aldekheel, M.; Altuwayjiri, A.; Tohidi, R.; Jalali Farahani, V.; Sioutas, C. The Role of Portable Air Purifiers and Effective Ventilation in Improving Indoor Air Quality in University Classrooms. Int. J. Environ. Res. Public Health 2022, 19, 14558. [Google Scholar] [CrossRef] [PubMed]
  22. Fan, G.; Chang, H.; Sang, C.; Chen, Y.; Ning, B.; Liu, C. Evaluating Indoor Carbon Dioxide Concentration and Ventilation Rate of Research Student Offices in Chinese Universities: A Case Study. Processes 2022, 10, 1434. [Google Scholar] [CrossRef]
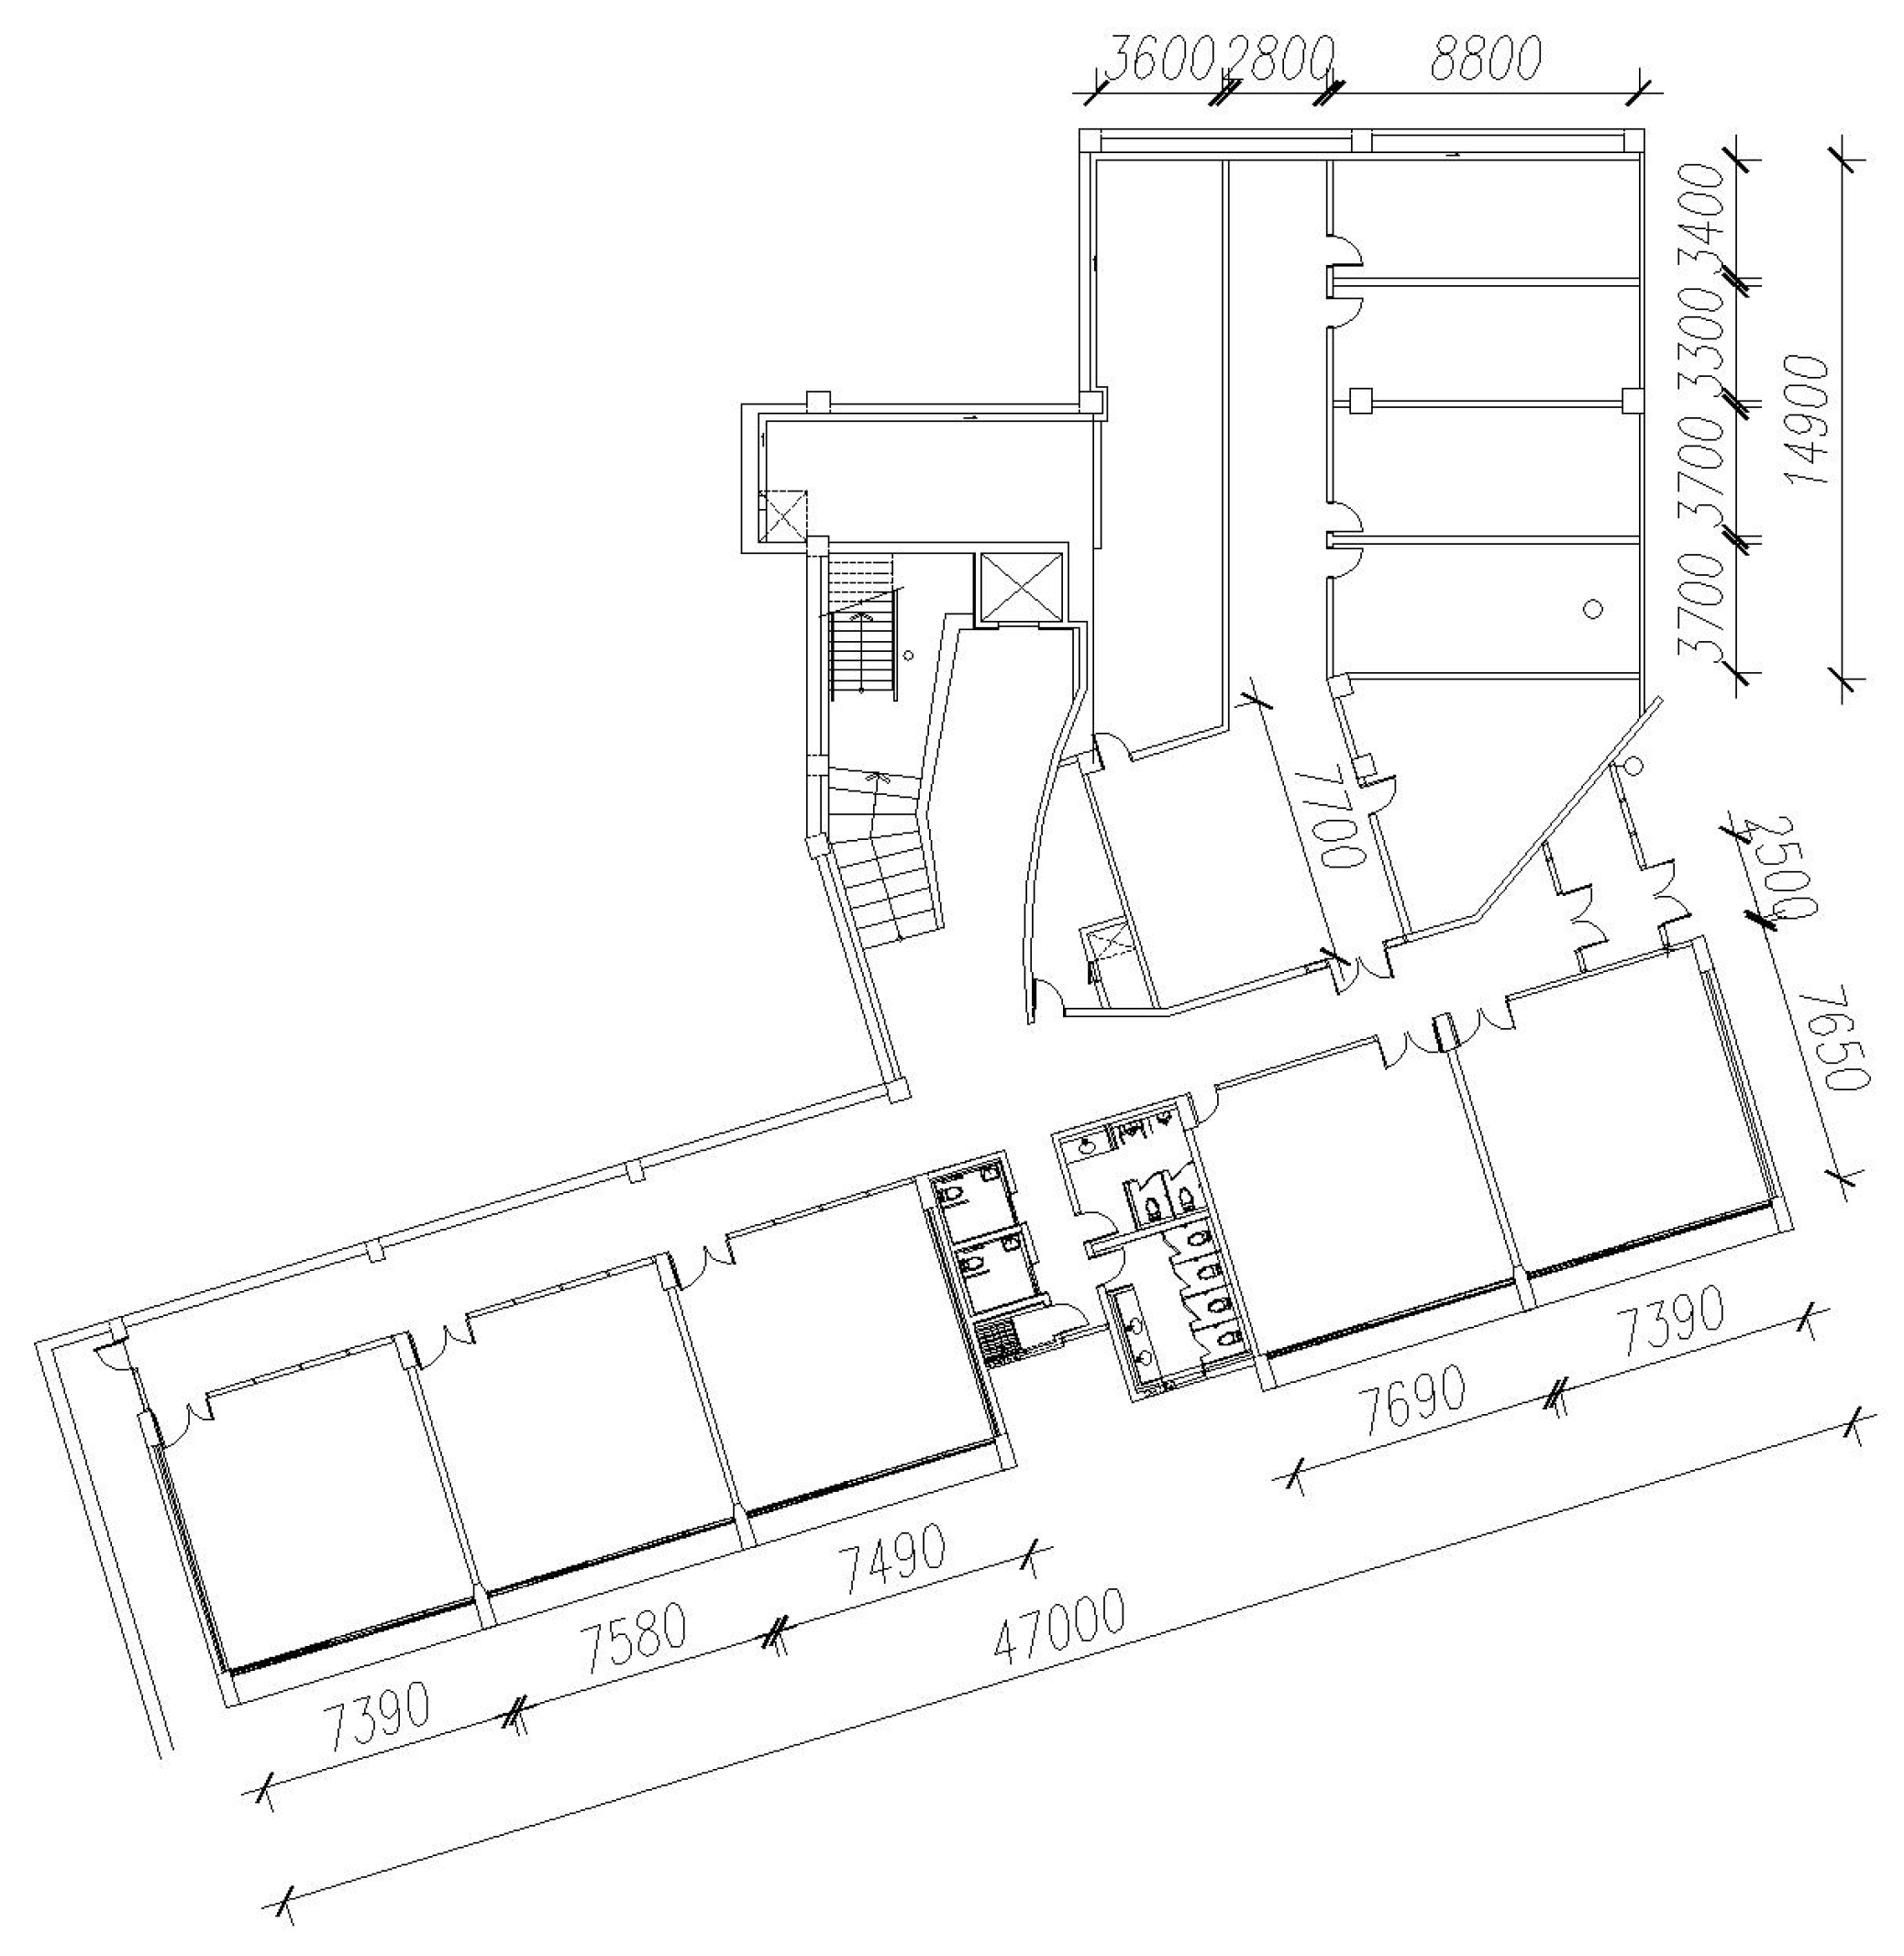
Figure 1. Floor plan of the target building (reference floor).
Energies 16 00999 g001
Figure 2. Comprehensive sensor module for environment measurement.
Energies 16 00999 g002
Figure 3. Number of PM2.5 particles over time.
Energies 16 00999 g003
Figure 4. Spaces to be measured and CSM installation locations.
Energies 16 00999 g004
Figure 5. Conceptual diagram of the algorithm for predicting the load according to the number of occupants.
Energies 16 00999 g005
Figure 6. Analysis of daily indoor environment for each room.
Energies 16 00999 g006
Figure 7. Comparison between the measured and predicted values for the number of occupants.
Energies 16 00999 g007
Figure 8. Comparison of the measured and predicted values for the indoor load.
Energies 16 00999 g008
Table 1. Details of the target building.
CategoryContent
StructureRC structure
Steel frame structure
Building area1504.41 m2
Total floor area1453.62 m2
Window area ratio70%
FinishingConcrete exposure/water-repellent coating
24 mm double glazing
0.5 mm wrinkle resin galvanized sheet
Table 2. Qualification of each sensor.
Device NameModel NameMeasurement RangeError Rate
MainboardArduino UNO R3--
Temperature and humidity sensorDHT22Temperature: −40~80 °C
Humidity: 20~90% RH
Temperature: ±0.5 °C
Humidity: ±2% RH
CO2 sensorCM11070~5000 ppm±50 ppm + 3%
Particulate matter sensorPM2008PM1.0: 0~1000 μg/m2
PM2.5: 0~1000 μg/m2
PM10: 0~1000 μg/m2
PM1.0 & 2.5: 0~100 μg/m2: ±10 μg/m2
101~1000 μg/m2: ±10%
PM10: 0~100 μg/m2: ±25 μg/m2
101~1000 μg/m2: ±25%
Table 3. Precision sensor details.
SKT100-X5TSI-9306
Measuring deviceEnergies 16 00999 i001Energies 16 00999 i002
Measurement range
-
PM: PM2.5~PM10
-
CO2: 1~1000 ppm
-
Temperature: –40~120
-
Humidity: 0~100%
-
PM: PM0.3~PM25
Flow rate0.5~1 L/min2.83 L/min
Resolution
-
PM: 1 μm
-
CO2: 1 ppm
-
PM: 0.5 μm
Precision±3%±1%
Table 4. Analysis of the error rate between the CSM and precision measuring devices.
CSM (A)SKT100-X5 (B)TSI-9306 (C)Error Rate
FirstSecondThirdAvg.FirstSecondThirdAvg.FirstSecondThirdAvg.B/AC/A
PM2.512.713.113.813.215.215.716.015.614.315.015.214.818%12%
PM1022.923.223.523.226.626.926.826.826.326.827.026.716%15%
CO2228230223227241239235238 5%
Temperature25.325.626.025.625.625.525.925.7 0.3%
Humidity55515252.756515353.3 1%
Table 5. Significance test for the algorithm to predict the number of indoor occupants.
Regression Coefficient (Coef)Standard Deviation (Std Err)Significance Level (p-Value > |t|)
Temperature5.5787.2270.022
Humidity1.5081.0130.004
CO2 concentration24.0745.8440.002
PM (PM2.5)−6.1354.2110.425
Table 6. Calculation of the energy consumption of each room (Wh/m2·Day).
Measurement Space Measurement Day 1Measurement Day 2Measurement Day 3
AAverage number of occupants333
Energy consumption511494523
BAverage number of occupants122
Energy consumption401439443
CAverage number of occupants202525
Energy consumption610623655
DAverage number of occupants171815
Energy consumption439444460
Table 7. Significance test for the energy consumption prediction algorithm.
Regression Coefficient (Coef)Standard Deviation (Std Err)Significance Level (p-Value > |t|)
Number of occupants (predicted)35.134.4410.001
OutdoorTemperature7.8840.0660.014
Humidity5.0060.0570.009
CO2 concentration1.0140.0150.305
IndoorTemperature−31.0775.5410.001
Humidity−18.1352.2690.004
CO2 concentration29.0023.9440.001
Table 8. Quantitative assessment of the load prediction algorithm.
MetricValue
MSE23.063
RMSD4.802
MAE2.512
Disclaimer/Publisher’s Note: The statements, opinions and data contained in all publications are solely those of the individual author(s) and contributor(s) and not of MDPI and/or the editor(s). MDPI and/or the editor(s) disclaim responsibility for any injury to people or property resulting from any ideas, methods, instructions or products referred to in the content.