
Benchmarking of Energy Consumption in Higher Education Buildings in Saudi Arabia to Be Sustainable: Sulaiman Al-Rajhi University Case


Abstract
:1. Introduction
2. Literature Review
- ❖
- Climate conditions in the location, CDD or HDD;
- ❖
- The type and price of the energy used, used—electric only or as a whole;
- ❖
- Type of university, and nature and use of buildings;
- ❖
- Structure and age of the buildings;
- ❖
- Users’ behavior.

| Location and Country | CDD (°C) | HDD (°C) | Building Type | EUI (kWh/m2 Year) | Reference and Date of Publishing |
|---|---|---|---|---|---|
| Memorial University, Canada | 199 | 4222 | General | 250 in 2016 | Abdo-Allah et al., 2019 [30] |
| University of Maryland’s Architecture Building, USA | 816 | 2432 | General | 148 | Hu, 2018 [9] |
| Paricarana Campus of Federal University of Roraima, Brazil | 3316 | - | Library | 297 | Almeida et al., 2017 [11] |
| Offices | 162 | ||||
| Administrative | 132 | ||||
| Griffith University, Australia | 615 | 1104 | Research lab | 379 | Khoshbakht et al., 2018 [12] |
| Library | 148 | ||||
| Teaching Rooms | 145 | ||||
| Offices | 121 | ||||
| Australian Universities, Australia | - | - | Teaching Rooms | 131 | Gui et al., 2021 [31] |
| Research Centre | 427 | ||||
| University teaching building in Xi’an, China | Teaching Rooms | 30 | Sun et al., 2021 [32] | ||
| Southwest University of Science and Technology, China | 908 | 1765 | Dormitory | 84 | Deng et al., 2021 [33] |
| Soongsil University, Korea | 871 | 2692 | General | 223 | Chung and Rhee, 2014 [14] |
| Universiti Malaya, Malaysia | 233 | 394 | Research Lab | 54 to 64 | Ali et al., 2020 [34] |
| London South Bank University, United Kingdom | 222 | 2436 | Offices | 119 | Amber et al., 2017 [35] |
| Offices and Teaching Rooms | 115 | ||||
| University of Almeria, Spain | 1112 | 690 | Research Lab | 119.5 | Chihib et al., 2020 [17] |
| Library | 82.7 | ||||
| Teaching Rooms | 29.0 | ||||
| Offices | 28.8 | ||||
| Restaurant | 41.1 | ||||
| Sports Centre | 47.3 | ||||
| University of Bordeaux, France | 534 | 1850 | Library | 25 | Bonnet et al., 2002 [20] |
| Administration | 45 | ||||
| Classrooms | 41 | ||||
| Student Housing | 39 | ||||
| Sports Centre | 37 | ||||
| Research Centre | 117 | ||||
| University building in northeastern Greece | 761 | 2127 | General | 41 to 167 | Mytafides et al., 2017 [21] |
| The University of Sharjah, United Arab Emirates. | 3972 | 76 | Administration | ≈165 | Ghenai and Bettayeb, 2019 [36] |
| Educational buildings, Dammam City, KSA | ≈3800 | ≈80 | General | 167–217 | Hamida et al., 2021 [25] |
3. Methodology
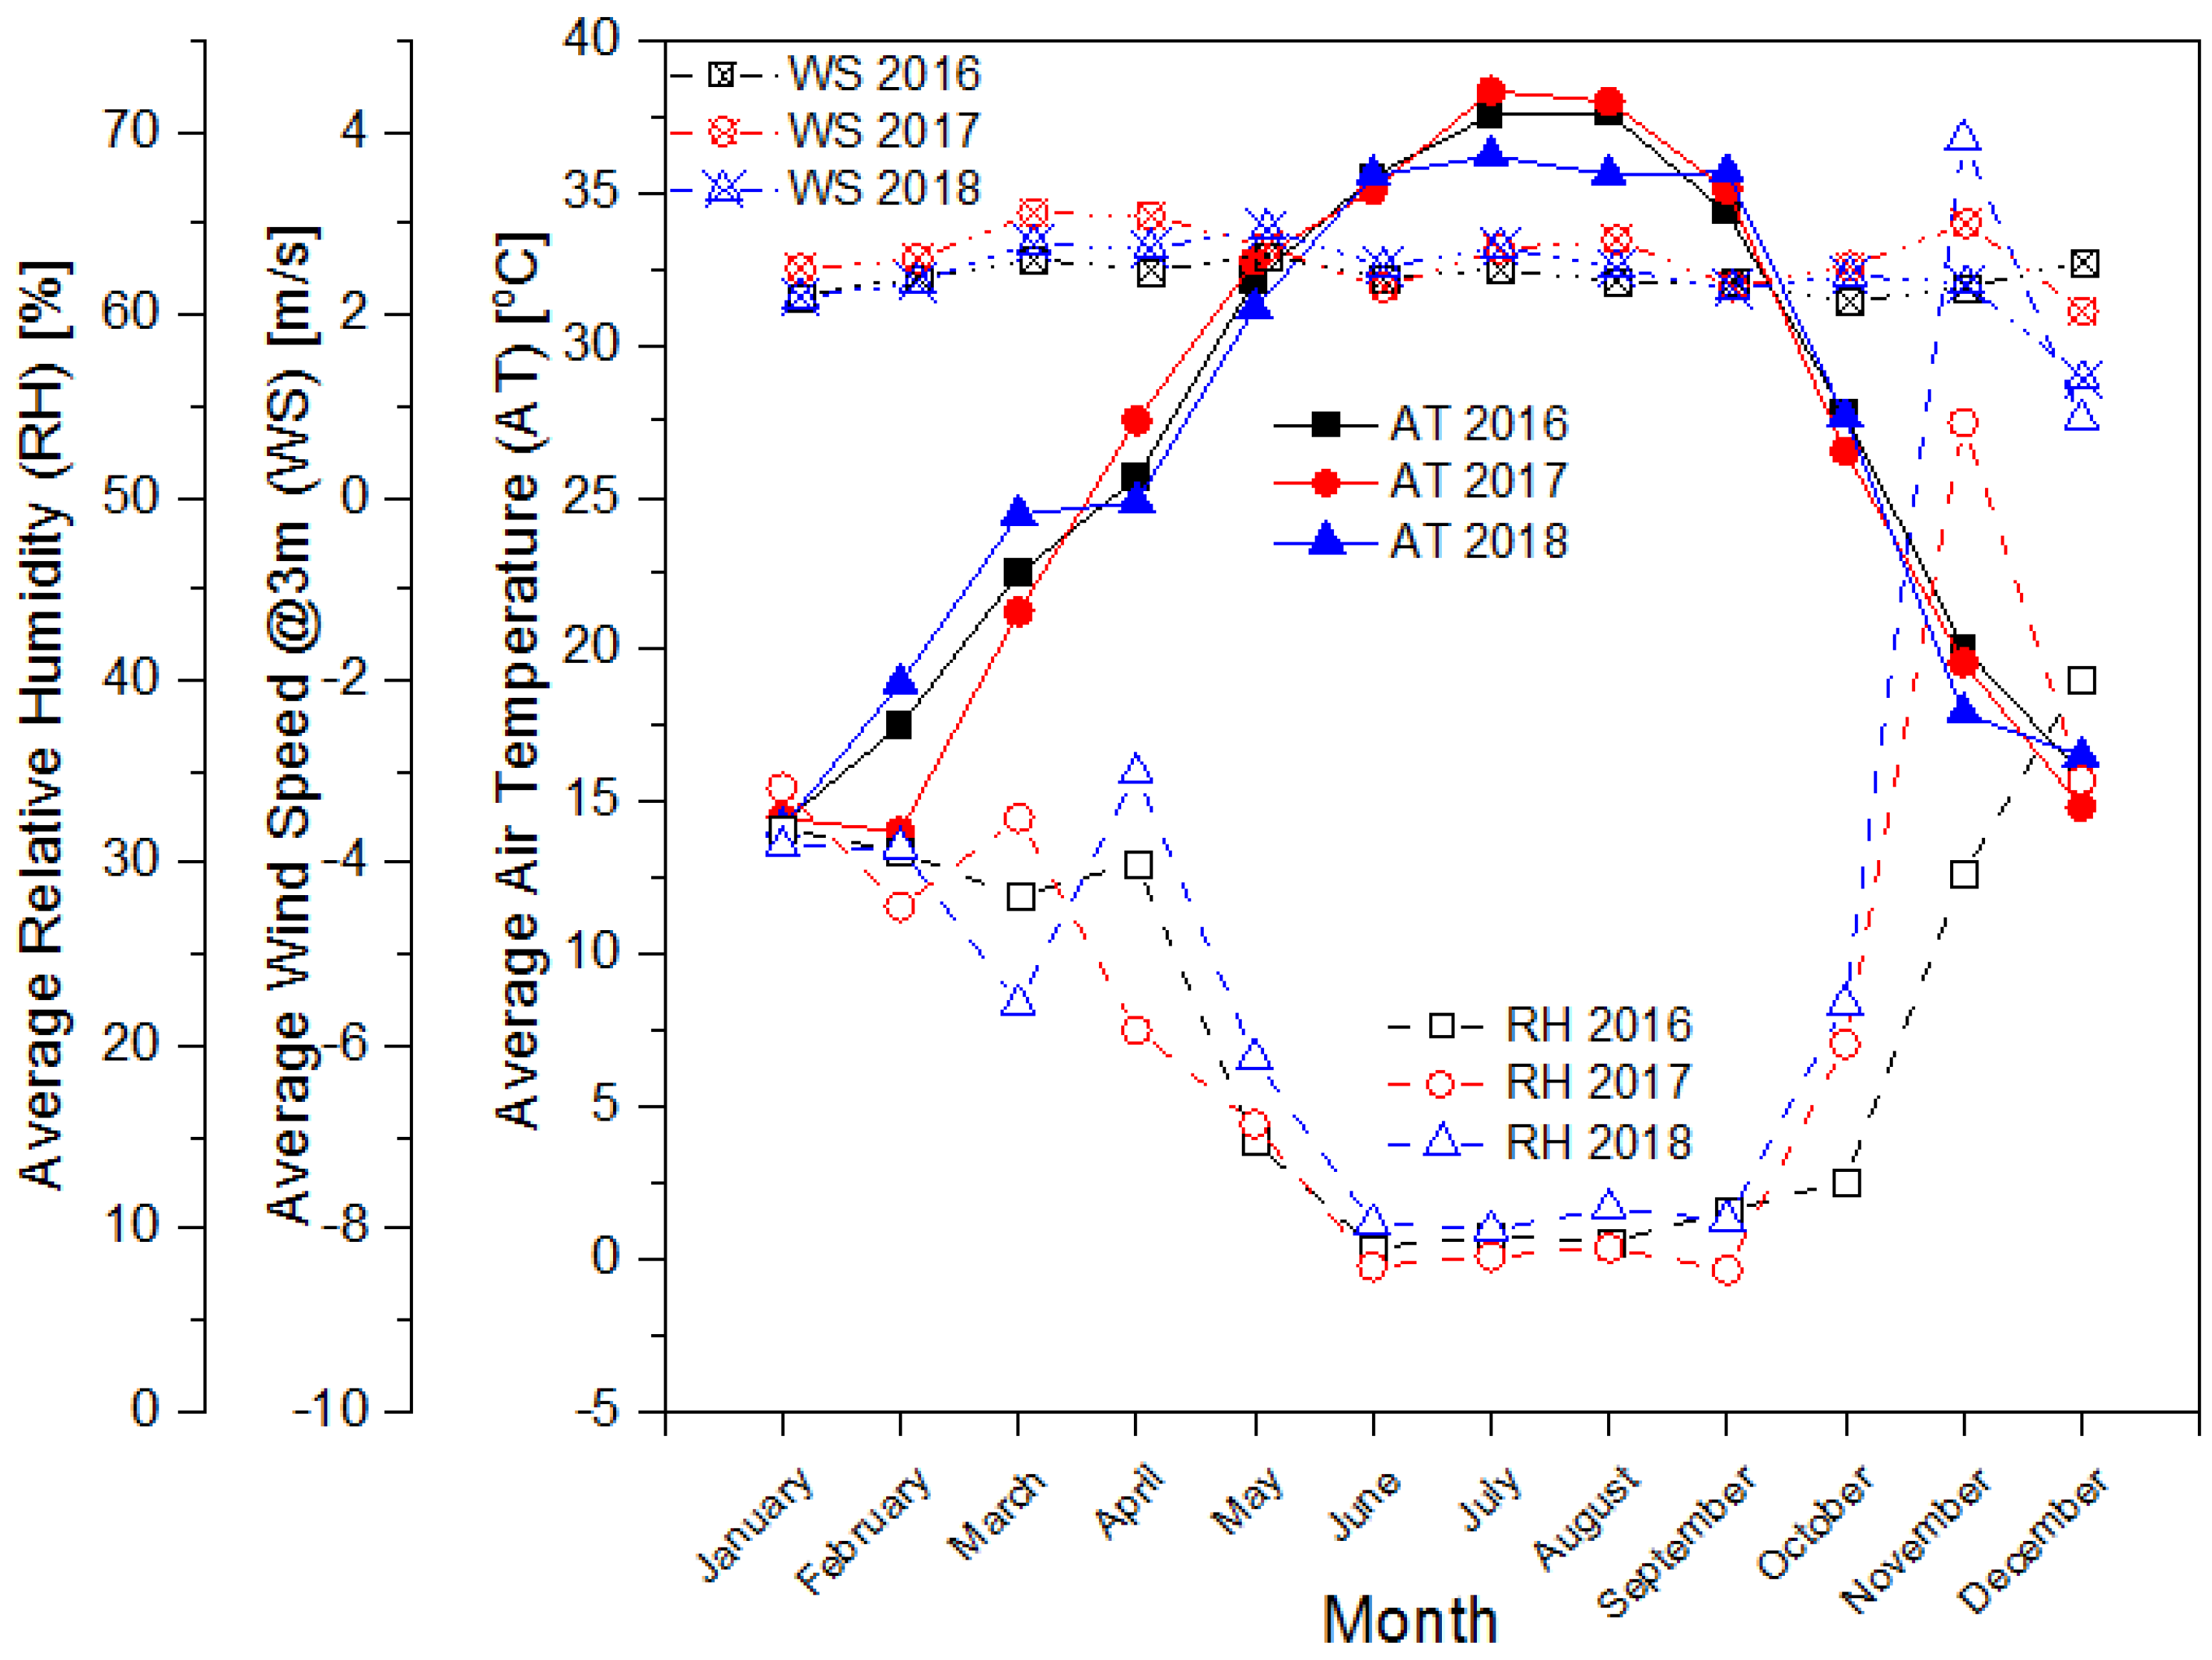
3.1. Meteorological Condition
3.2. Data Sources
3.3. Energy Analysis and Indicators
3.4. Energy Conservation Measures
3.5. Environmental Analysis
3.6. Economic Analysis
- ES, Energy-saving;
- PU, Price per unit of electricity (0.18 from the national grid or 0.39 SR/kWh from SRU generators).
4. Results and Analysis
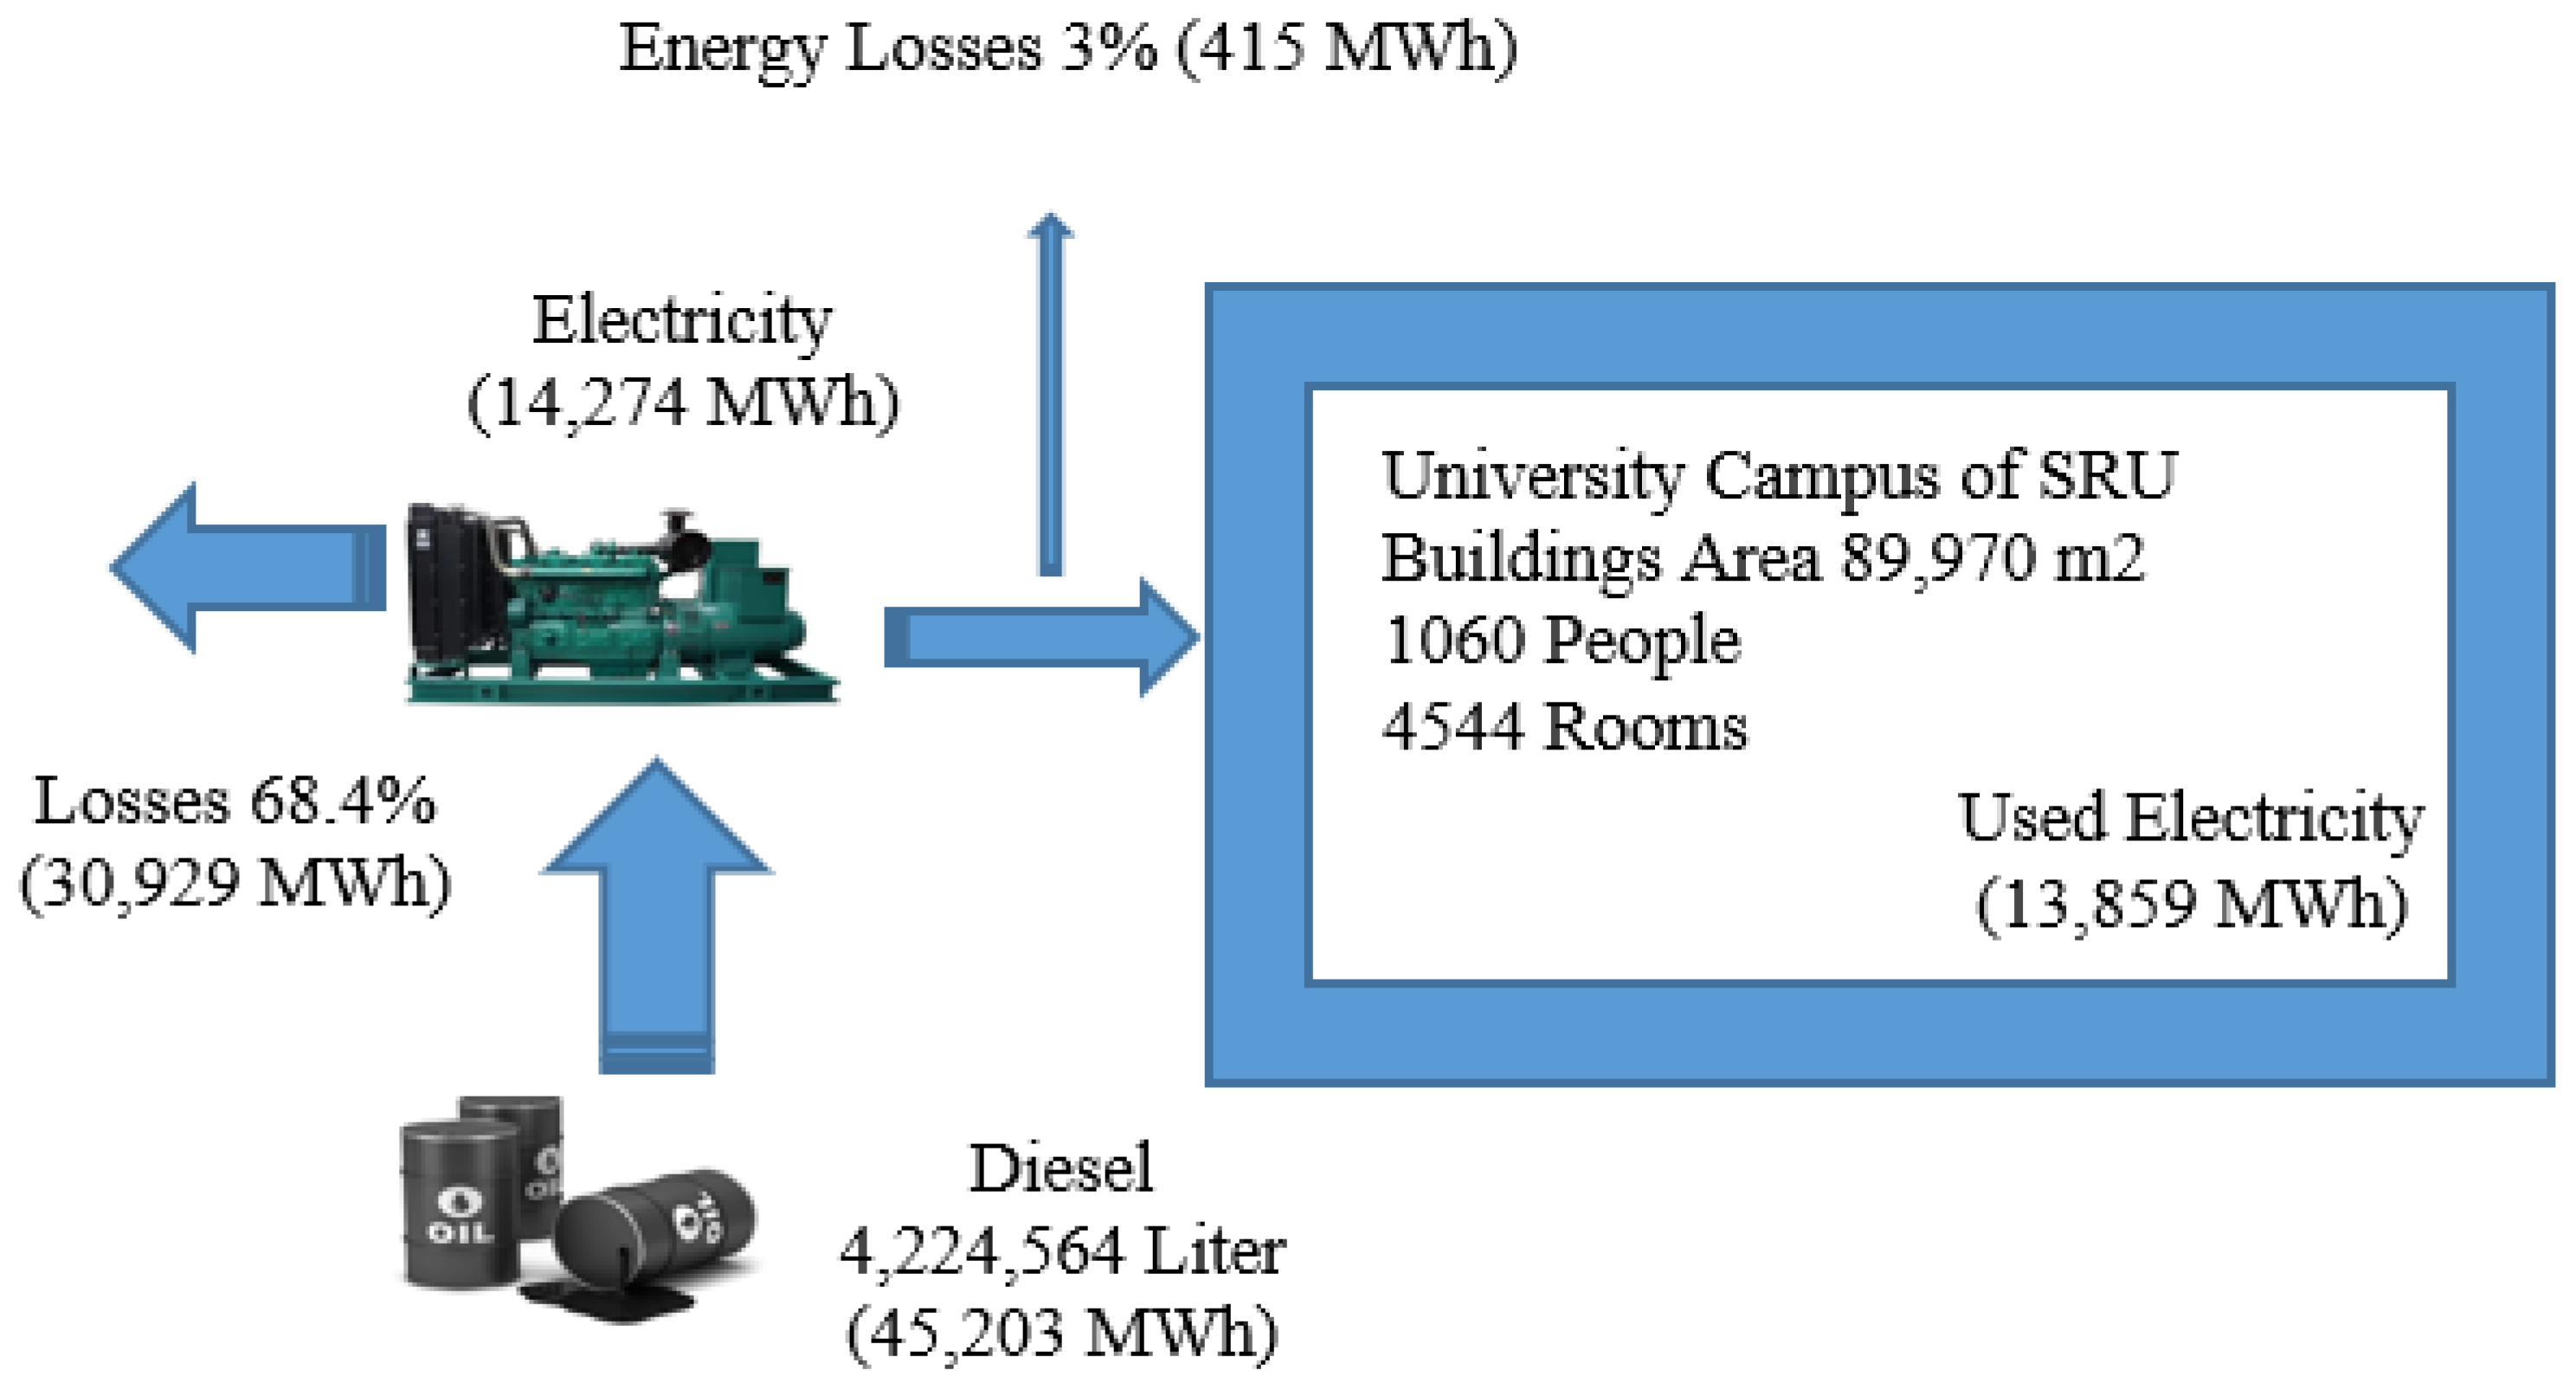
4.1. Energy Consumption
4.2. End-Use of Electricity
- Electricity Consumption by Air-Conditioning
- 2.
- Electricity Consumption by Lighting
- 3.
- Electricity Consumption in the Case of ‘Others’
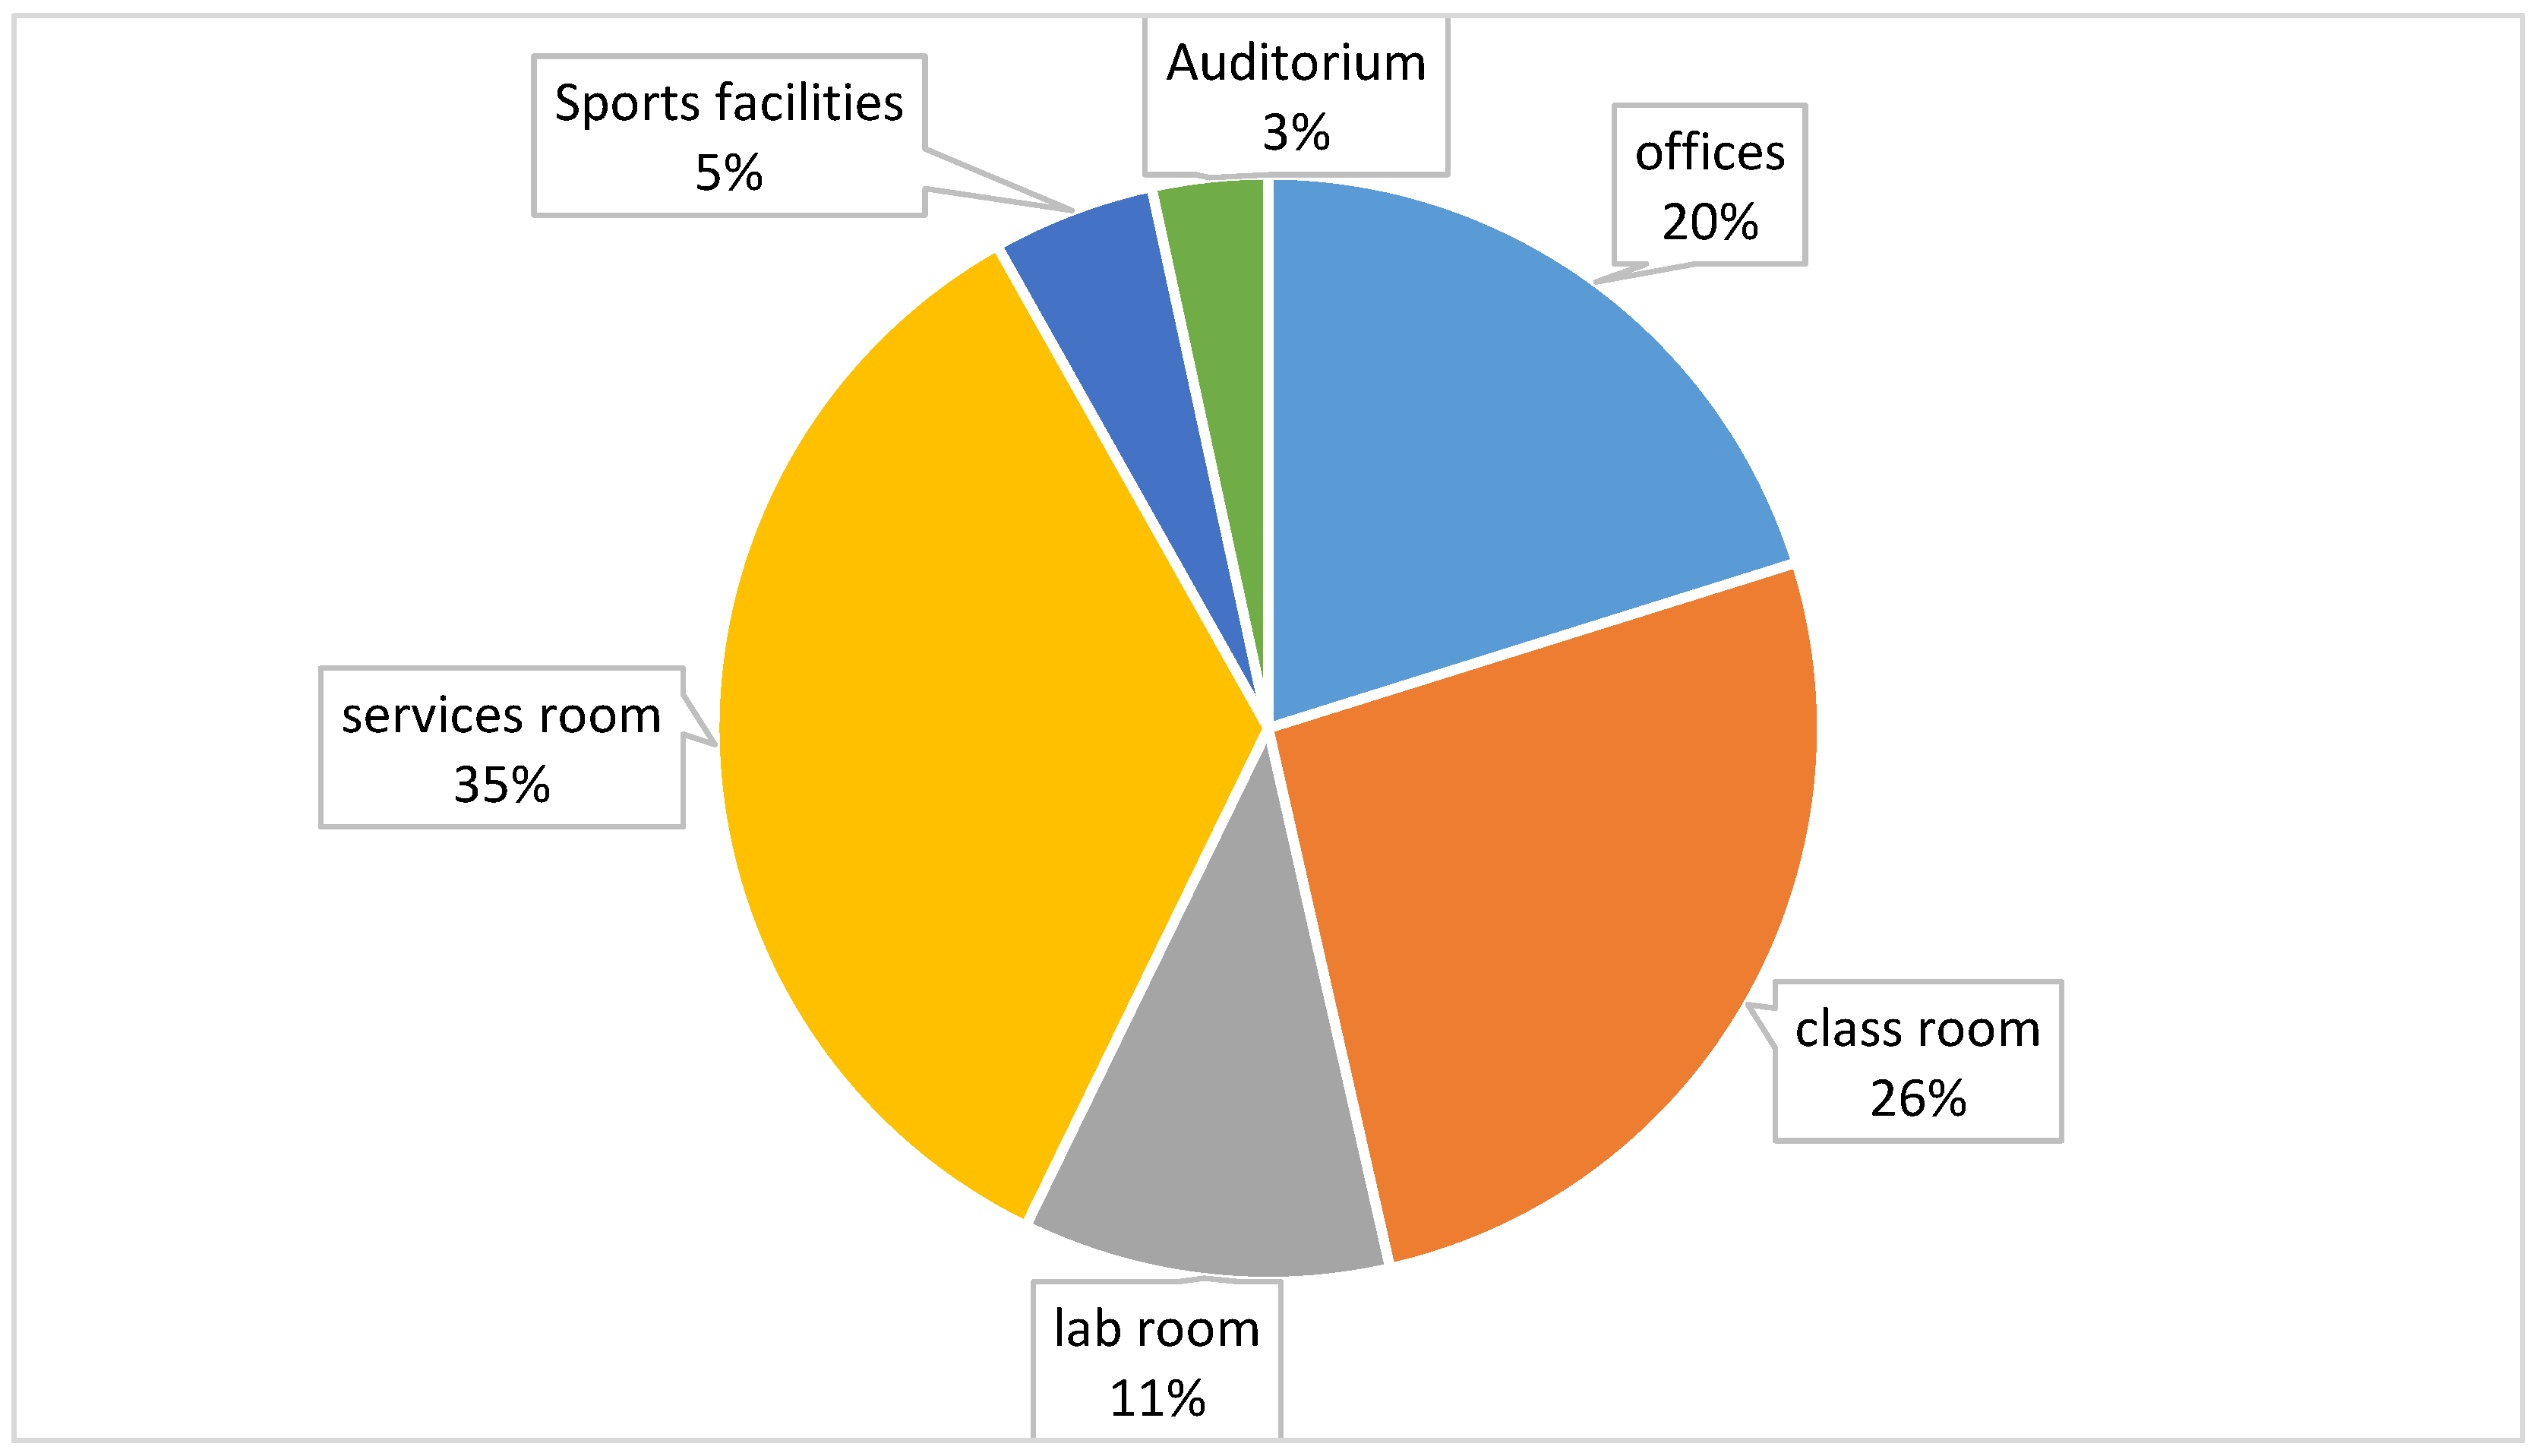
4.3. Electricity Consumption by Activities
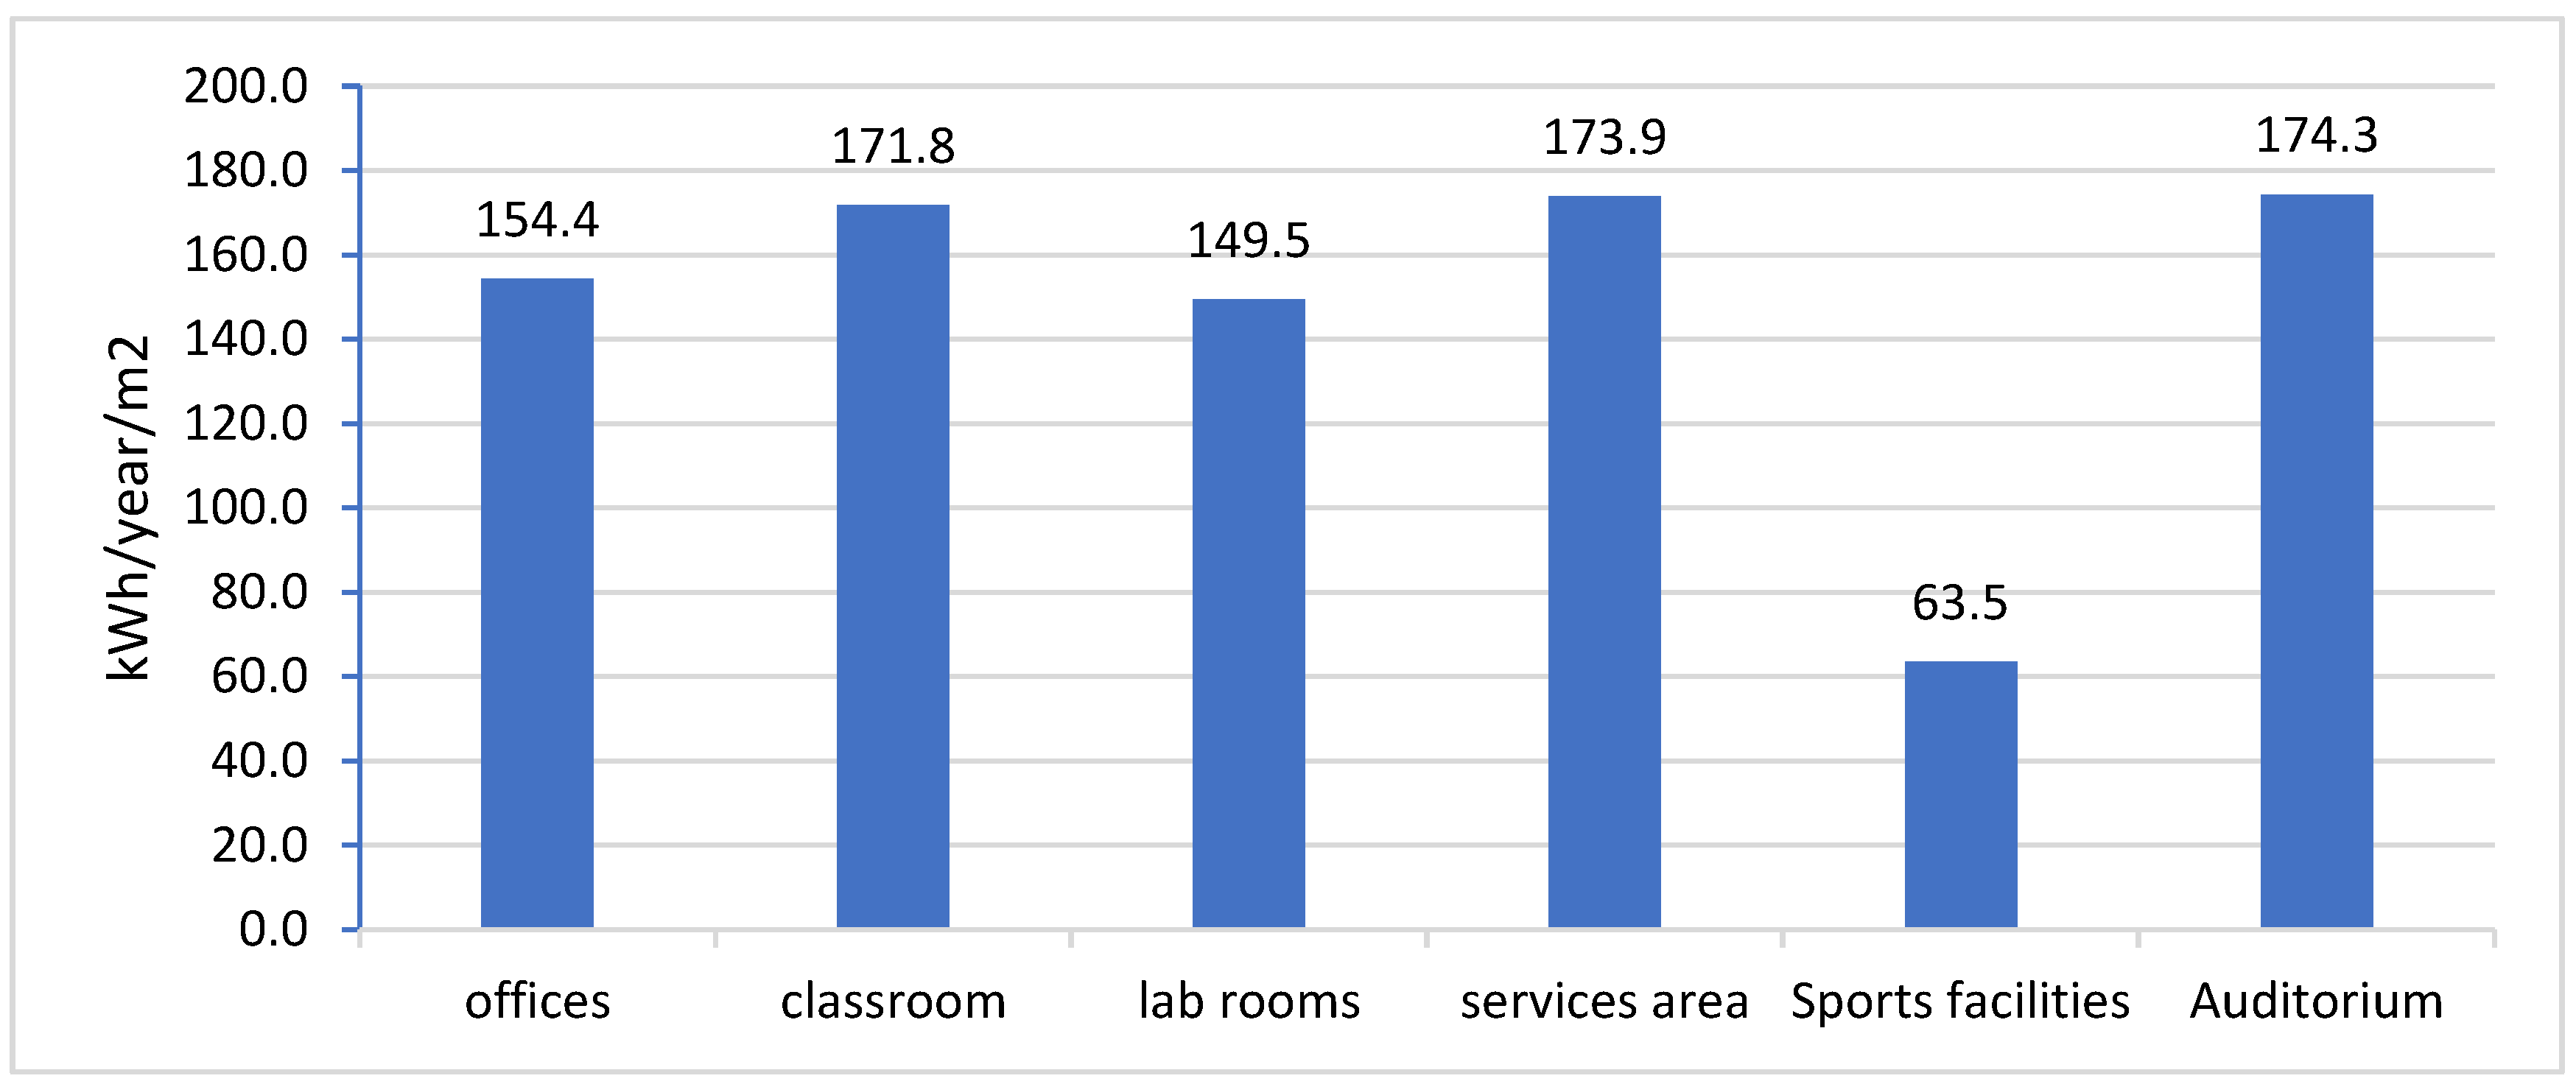
4.4. Electricity Consumption Indicators
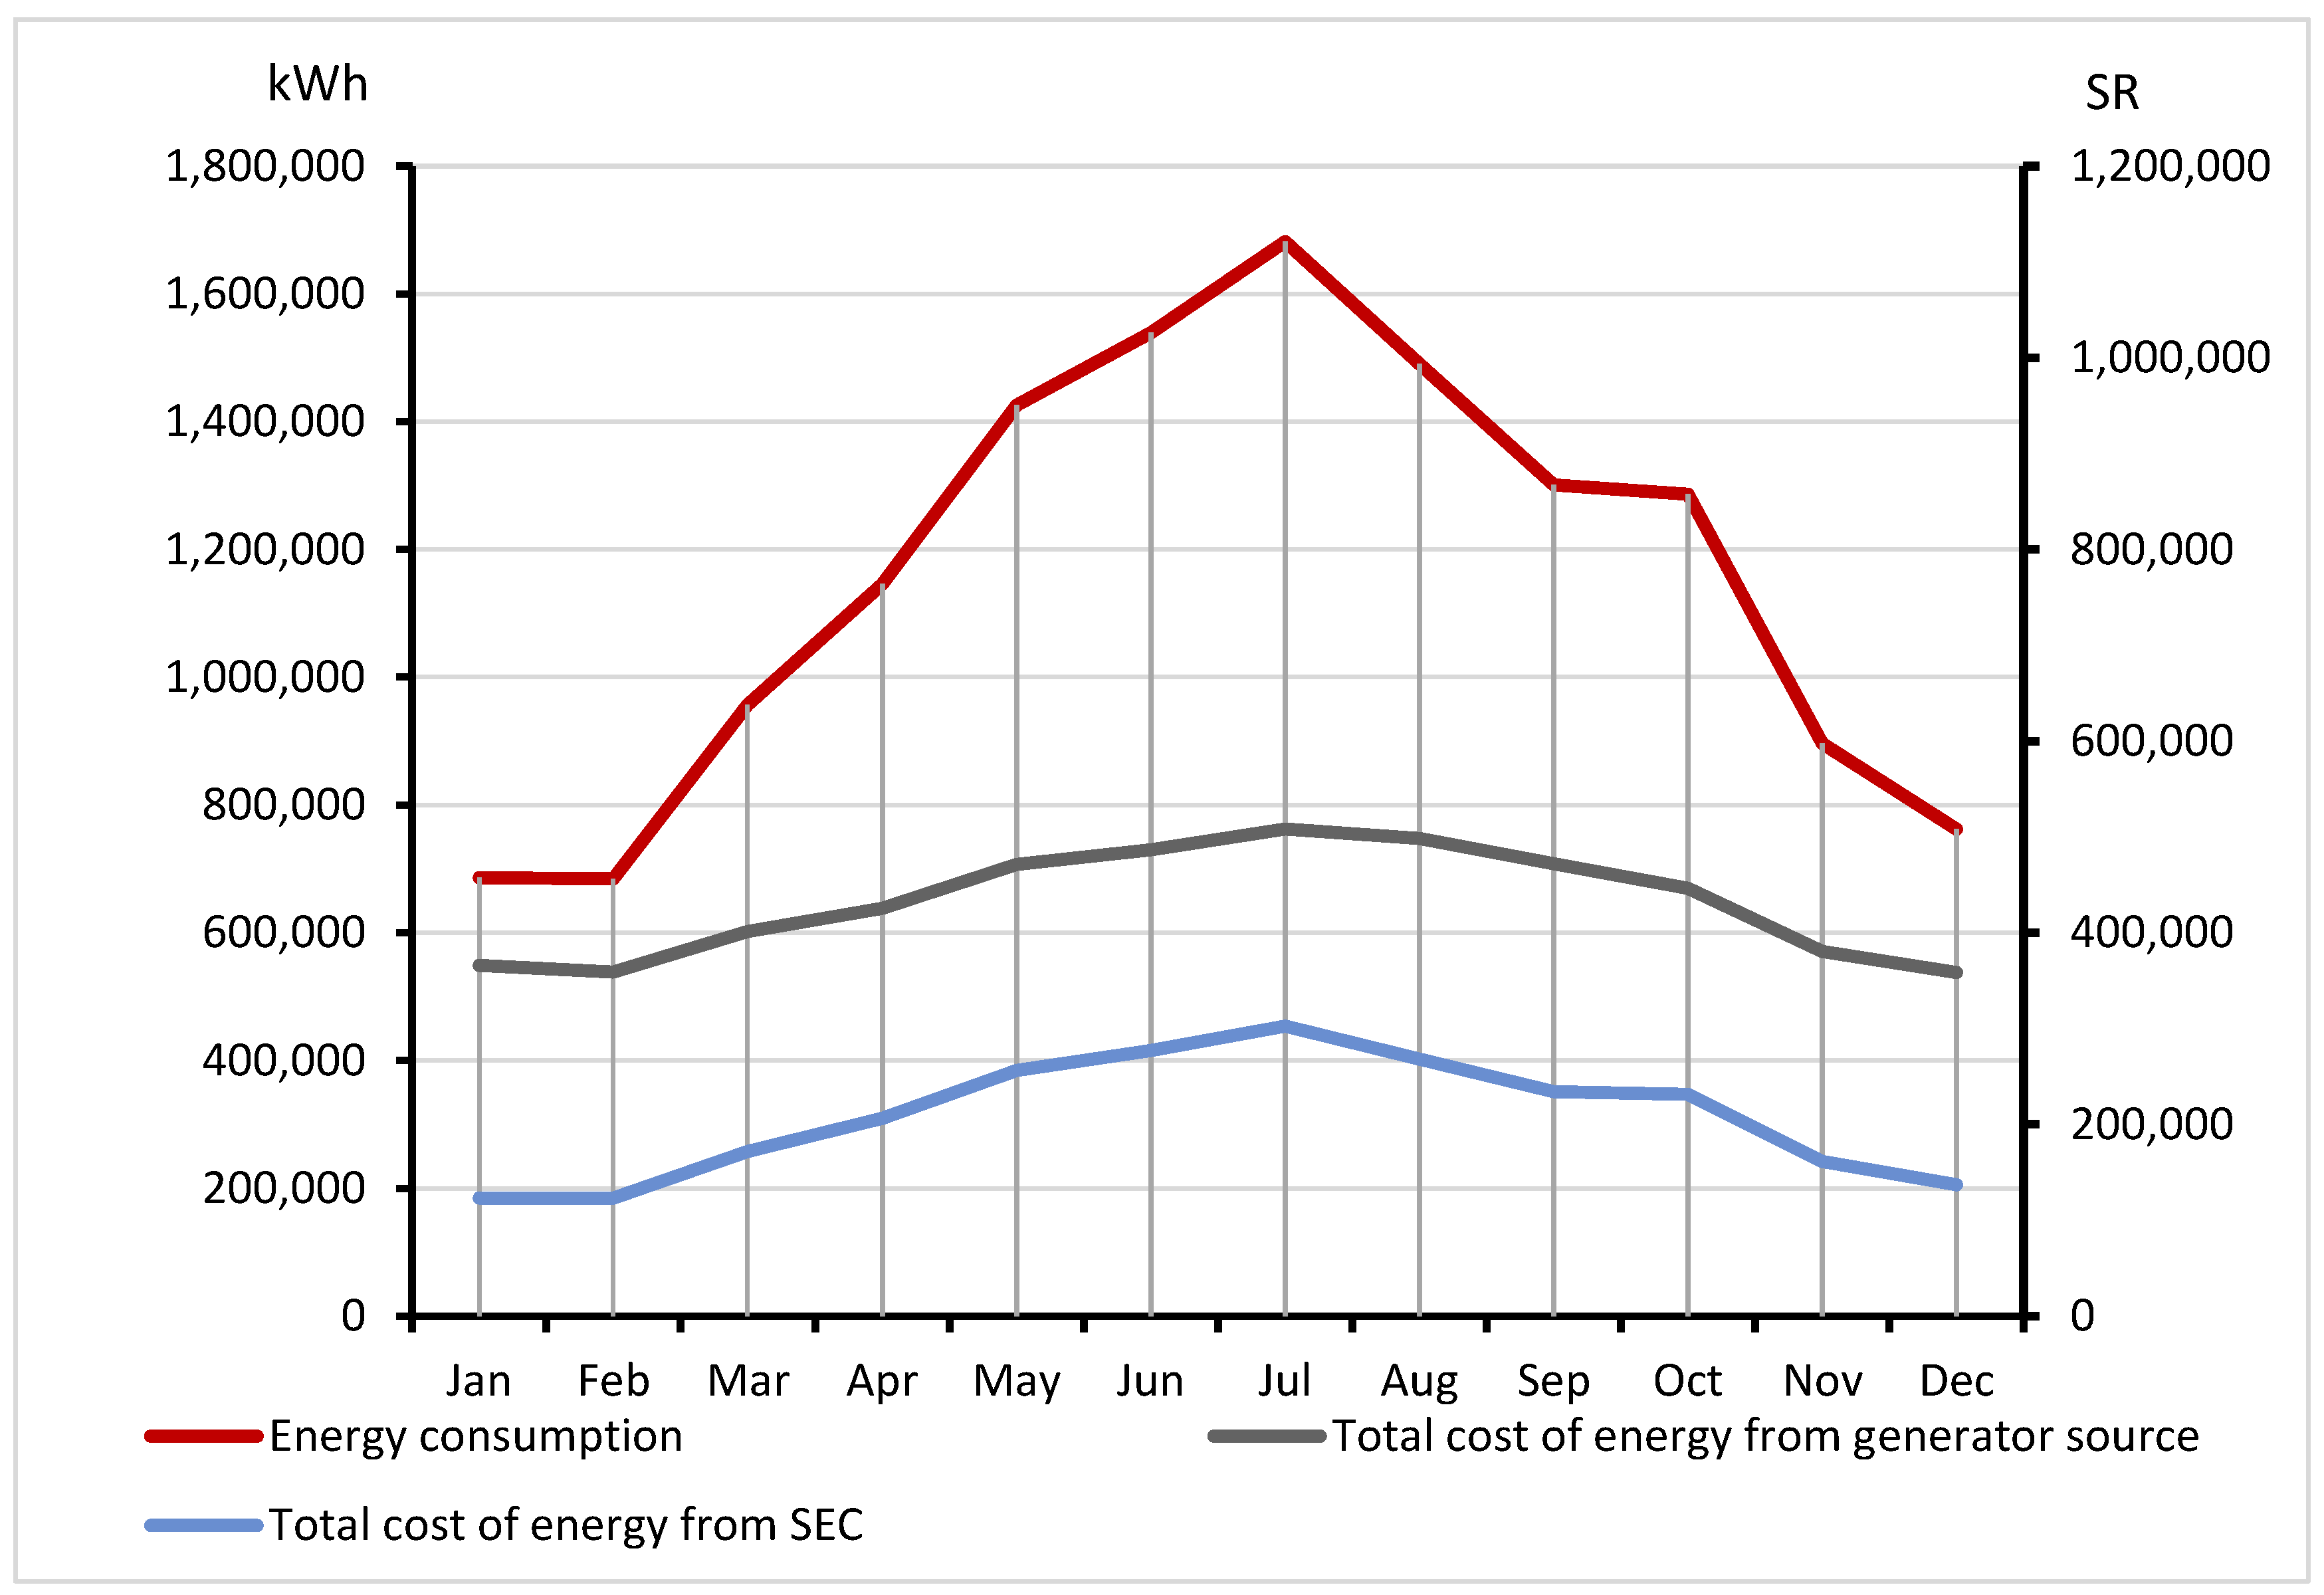
4.5. Costs of Public-Grid and Privately Generated Electricity
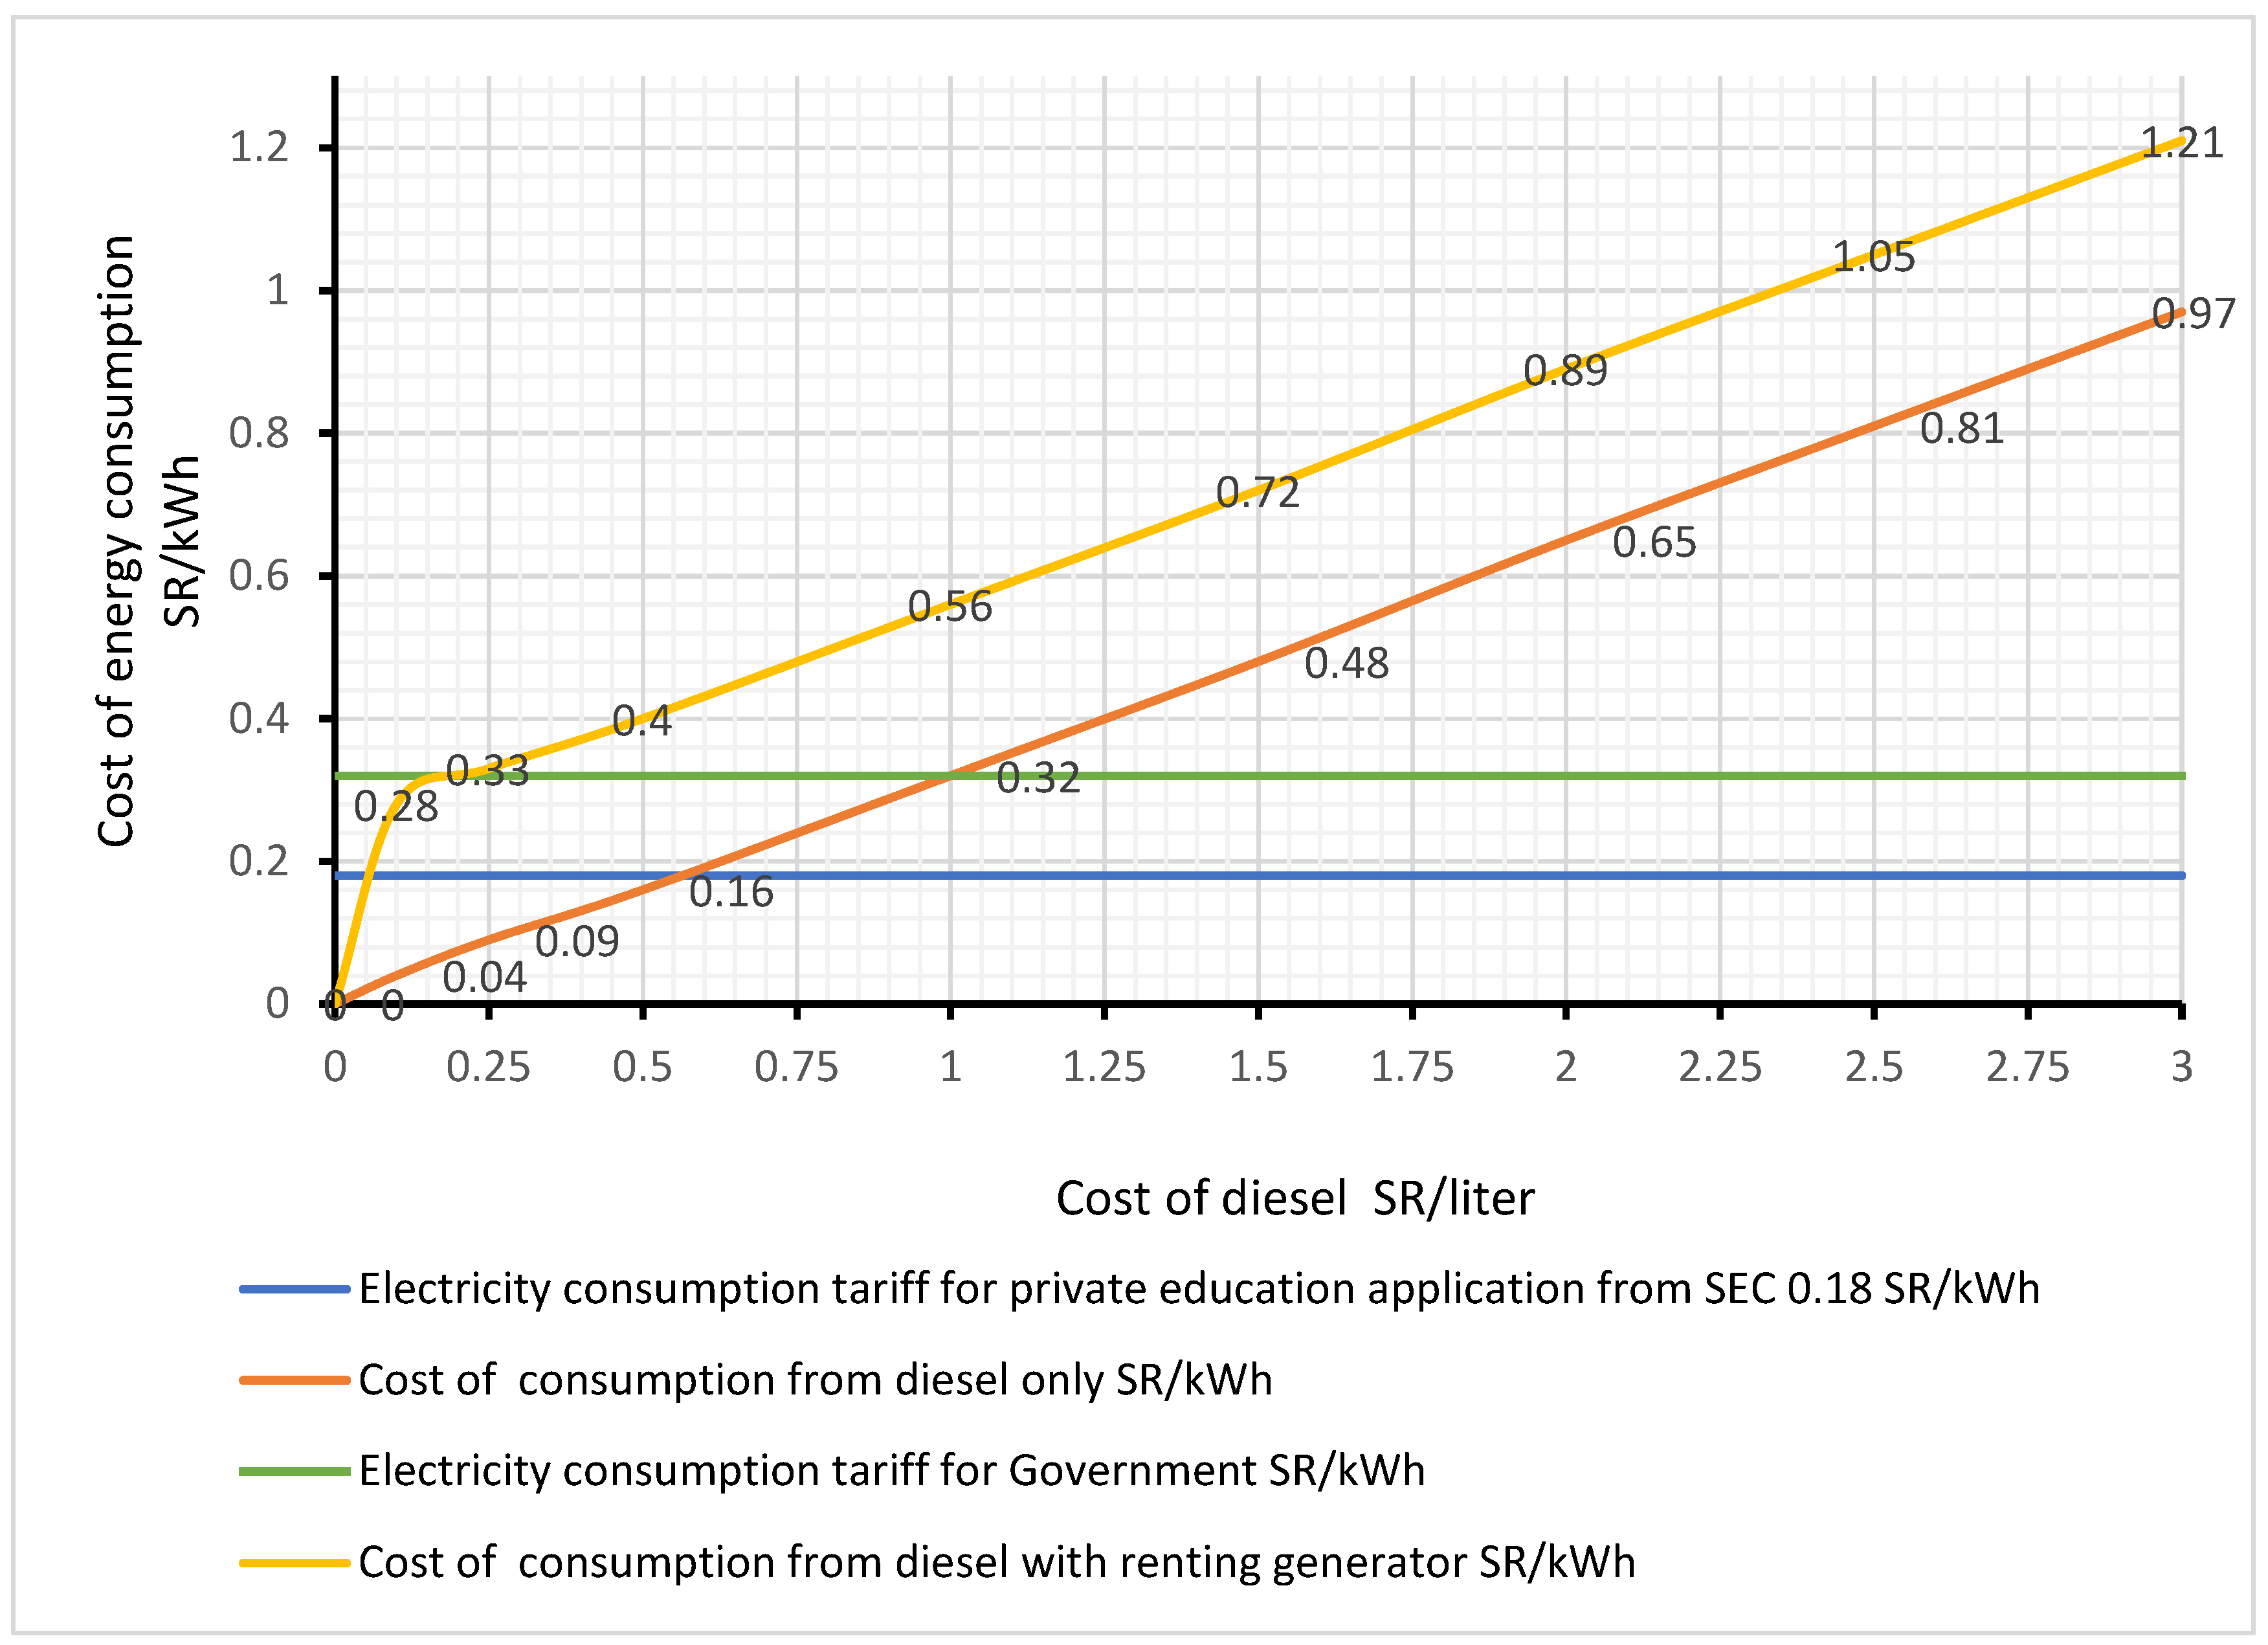
4.6. Effect of Diesel Price on Electrical Energy
5. Energy Conservation Measures
5.1. Building Envelope
5.2. Improving HVAC System
5.2.1. Set Point Temperature
5.2.2. Replacing with a More Efficient System
5.2.3. Reducing Temperature Difference
5.3. Improving Light System
5.3.1. Replacing with Efficient Lamps
5.3.2. Motion Sensor Installation
5.3.3. Installing a Motion Sensor and Using Efficient Lights
5.4. Improving Water-Heating System (Operational Strategies)
5.5. Economic Analysis
5.6. Environmental Benefits
6. Conclusions
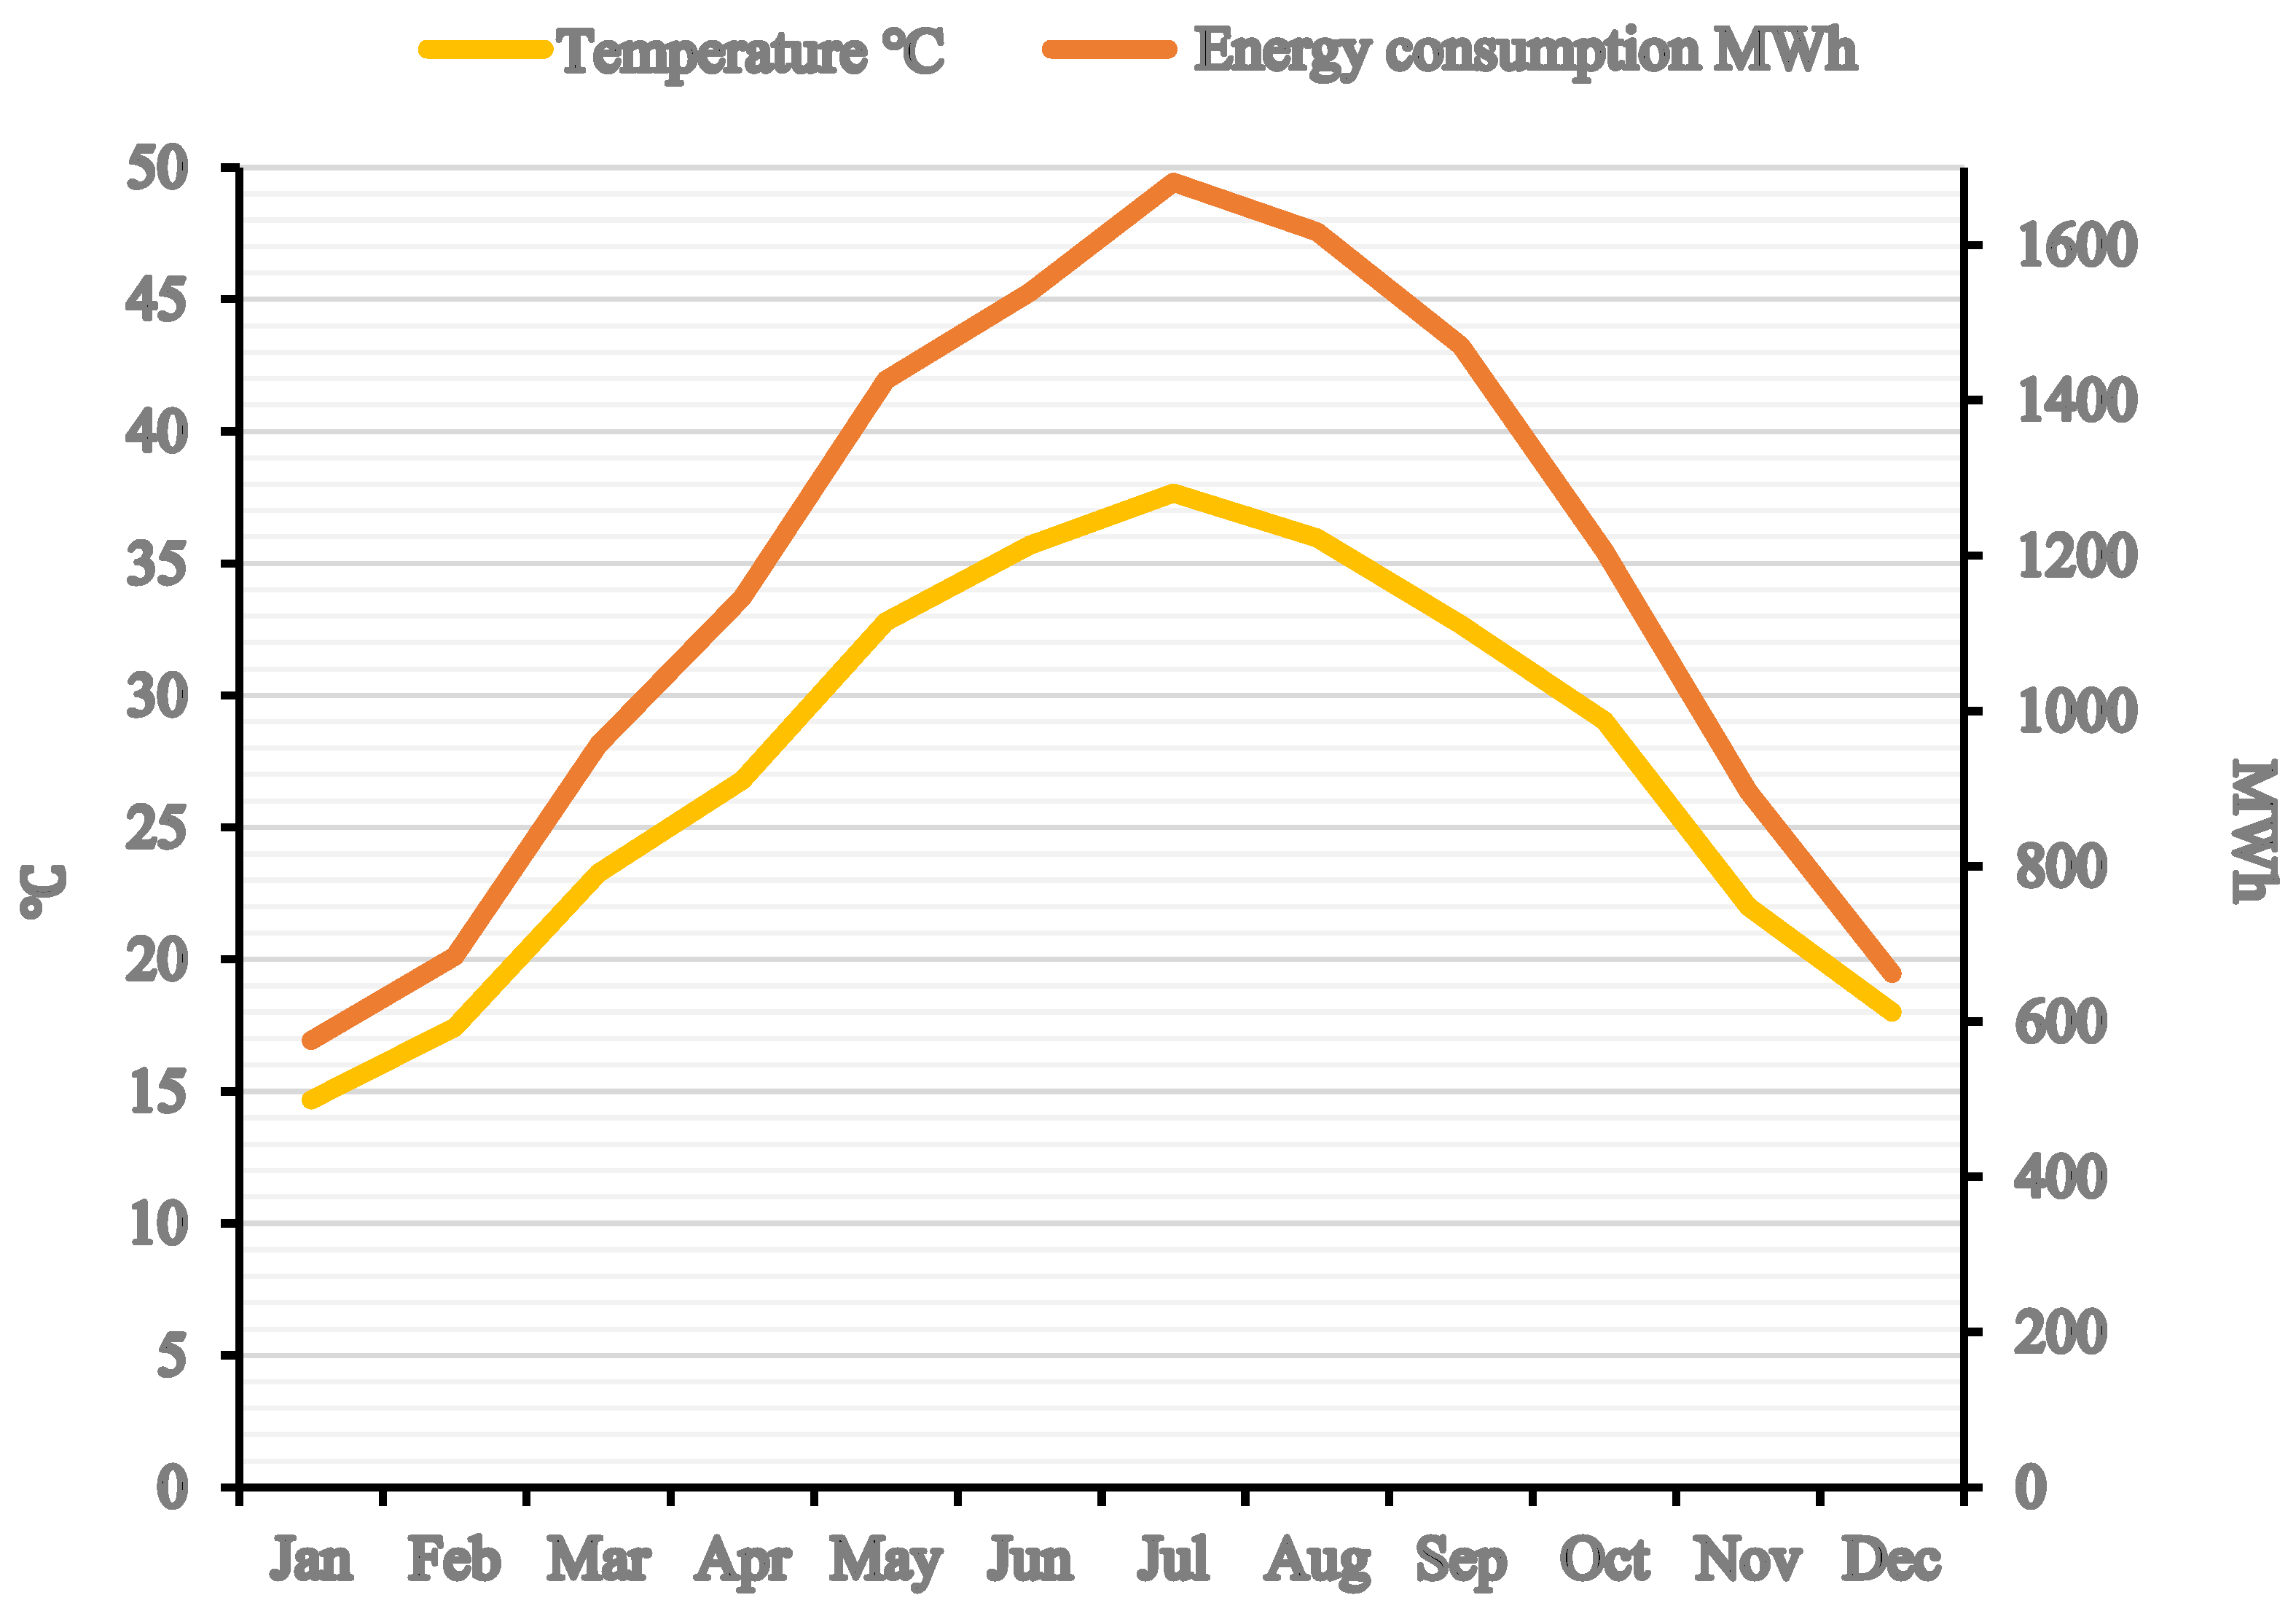
- ❖
- The lowest electricity consumption was recorded in February, when it went down to approximately 684 MWh, and the highest in July—approximately 1681 MWh of the total consumed in 2021, 13,859 MWh.
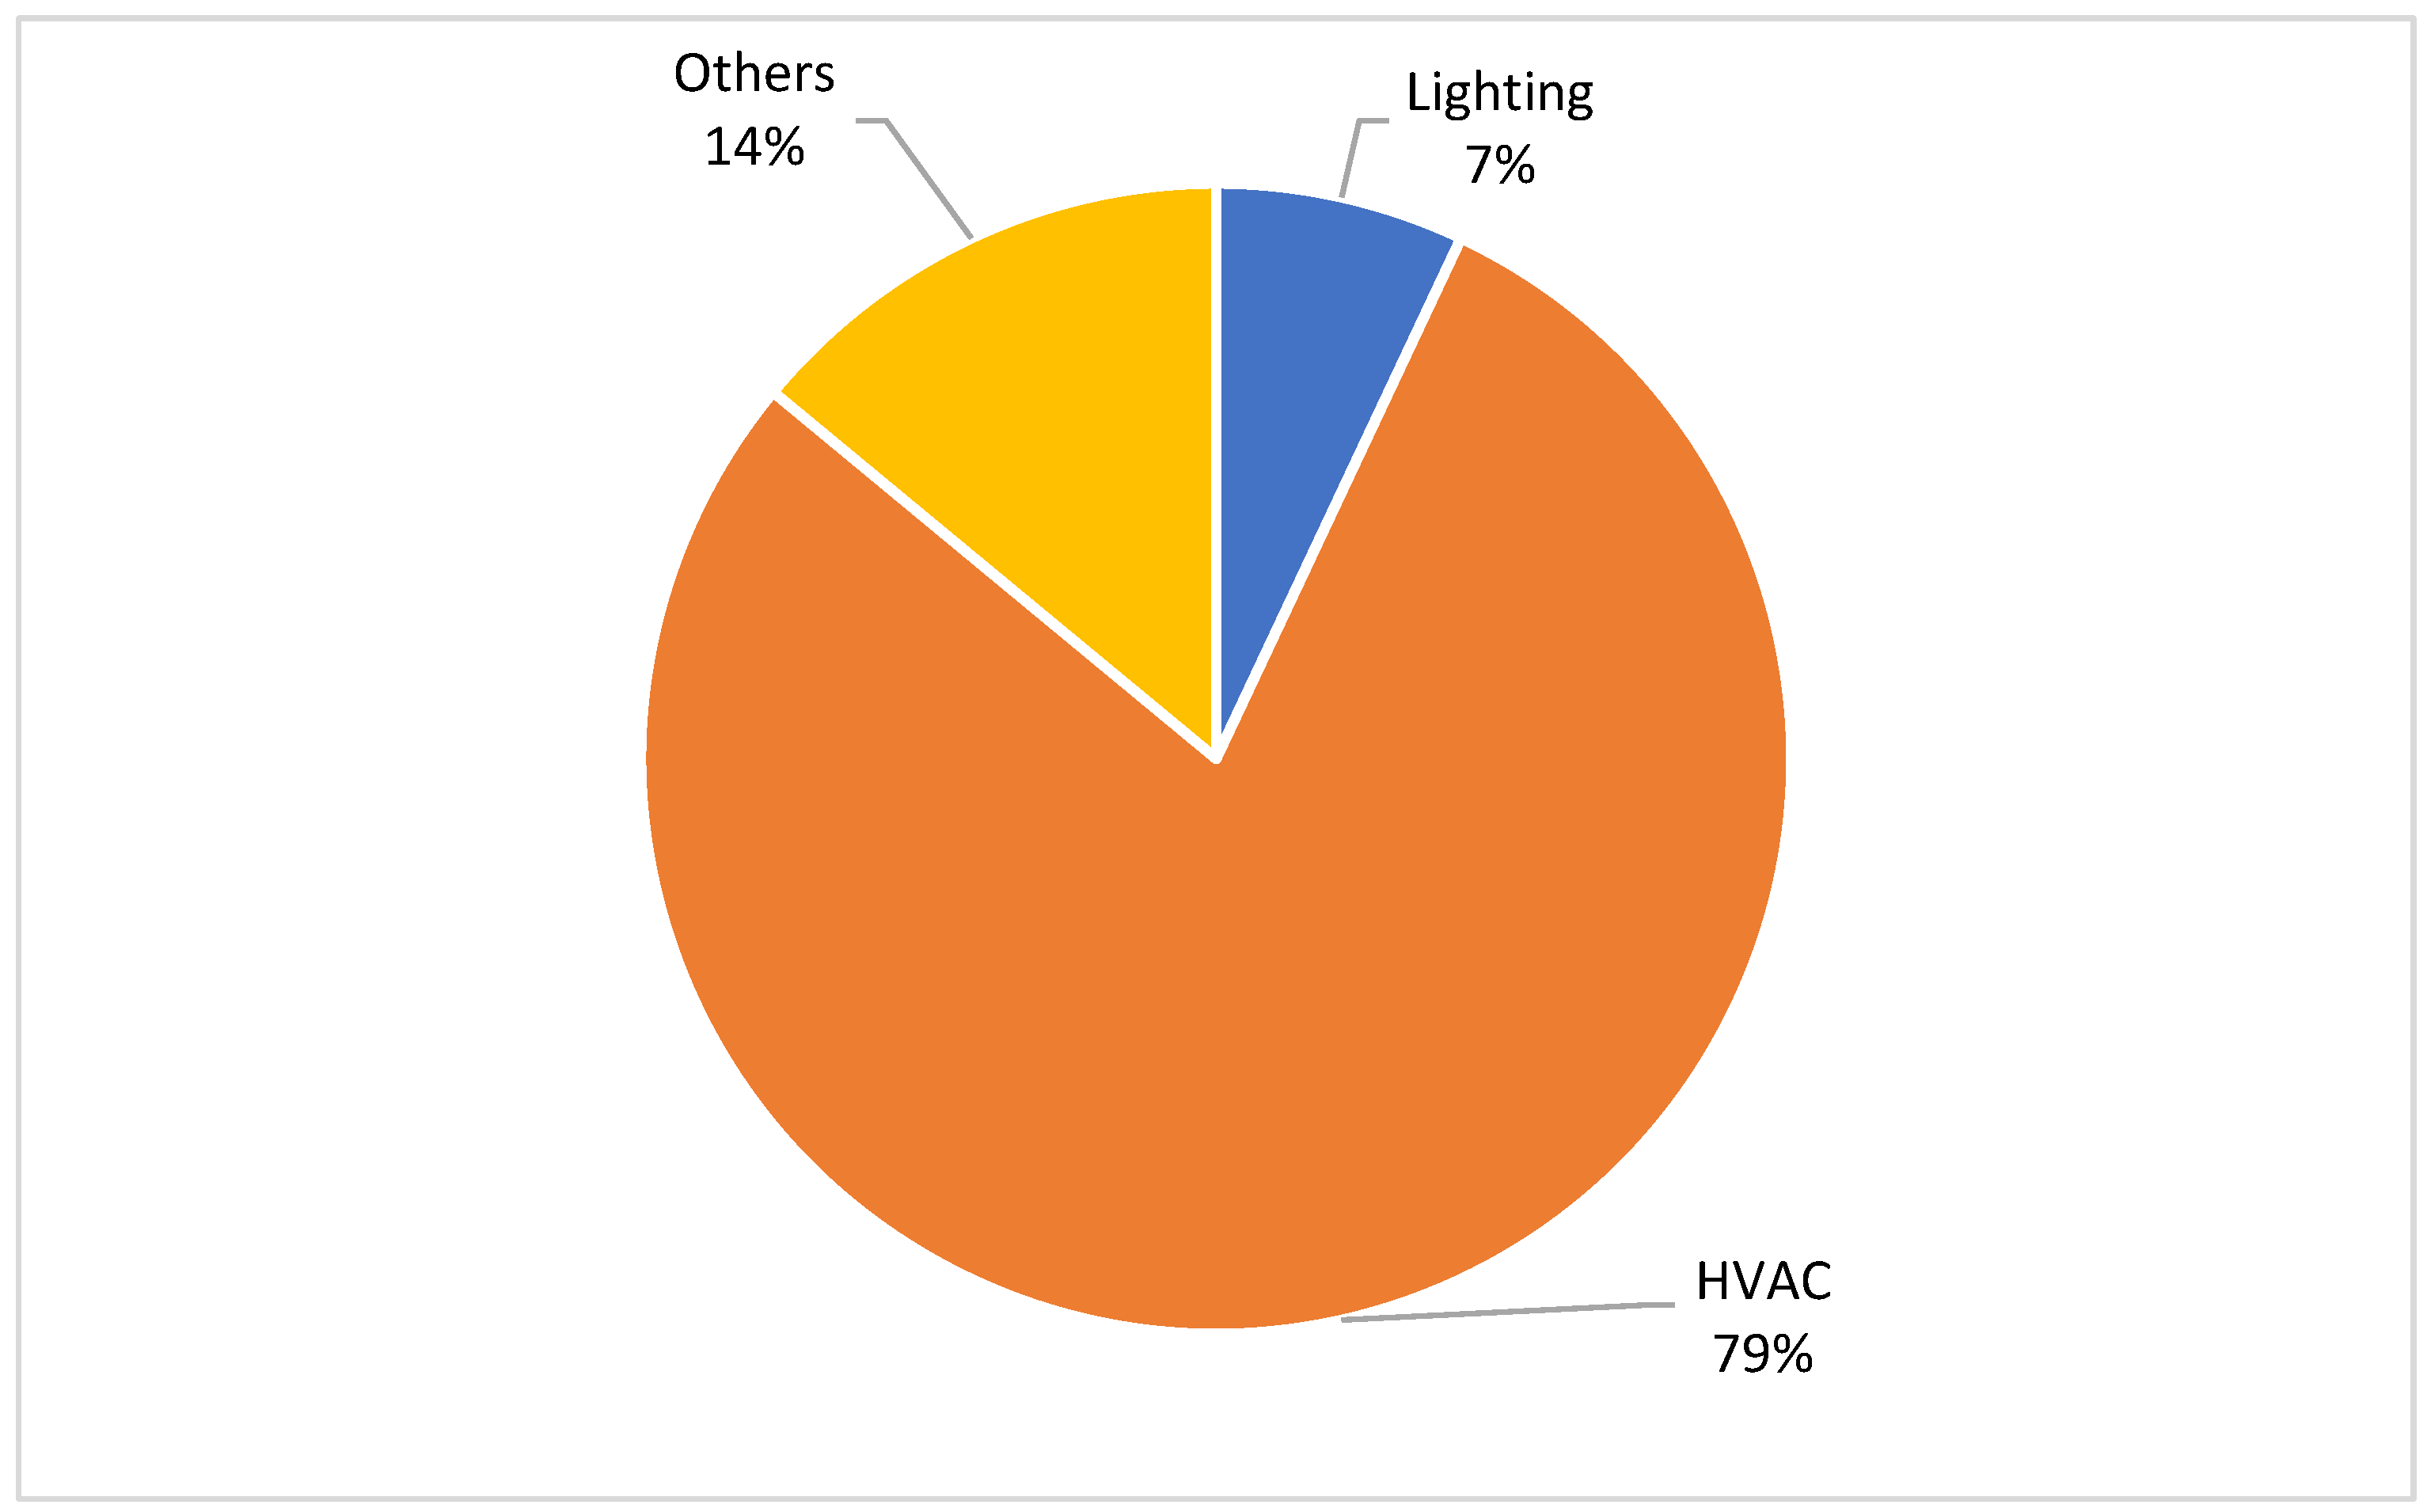
- ❖
- The HVAC system accounts for the biggest percentage—79%—of the total consumption of electricity, followed by “others,” with 14%, and lighting, with 7%, of the total consumption.
- ❖
- In the period 2017–2021, the electricity consumption intensity is approximately 145–155 kWh/m2 and the per capita consumption is approximately 12,987–16,351 kWh.
- ❖
- The percentage of electricity consumption decreased by 7% in 2020 compared to previous years, which was a result of COVID-19 conditions.
- ❖
- The average price of energy generated at the university, 0.39 SR/kWh during 2021, was higher than the energy price drawn from the electrical network of educational institutions, 0.18 SR/kWh, and governmental institutions, 0.32 SR/kWh. This means that the public grid was 50% cheaper than campus-generated electricity.
- ❖
- The energy-saving measures in the air conditioning system are the most important for obtaining a sustainable system, even though the building envelope is insulated.
- ❖
- The walls, roofs, and windows meet the required conditions in terms of thermal insulation in zone 1 in KSA, and there is no need for energy-saving measures.
- ❖
- The total SPBT of the suggested energy-saving measures is 4.13 years at the price of a unit of energy generated by generators, whereas the total SPBT of the national grid is 8.96 years.
- ❖
- Annual reductions in CO2, CO, N2O, and SO2 emissions yielded by suggested energy-saving measures at SRU were 3,438,817, 8756, 7827, and 7191 respectively.
Author Contributions
Funding
Institutional Review Board Statement
Informed Consent Statement
Data Availability Statement
Conflicts of Interest
Abbreviations
| A | Building-floor Area |
| AC | Air-Conditioning |
| AHU | Air Handling Units |
| ASHP | Air-Source Heat Pumps |
| ASHRAE | American Society of Heating, Refrigerating, and Air-Conditioning Engineers |
| CDD | Cooling-Degree Days |
| CFL | Compact Fluorescent lamps |
| COP | Coefficient of Performance |
| E | Total Electricity Consumption |
| EC | Consumption or Saving of Electricity |
| ECMs | Energy-Conservation Measures |
| EE | Energy Efficiency |
| EER | Energy Efficiency Ratio |
| EF | Emissions Factor |
| Eh | Energy Consumption per Hour. |
| ES | Energy-Saving |
| EUI | Energy Use Intensity |
| FCU | Fan Coil Unit |
| FTL | Fluorescent Tube Lamps |
| GSHP | Ground-Source Heat Pumps |
| HDD | Heating-Degree Days |
| HPS | High-Pressure Sodium |
| HVAC | Heating, ventilation, and air conditioning |
| KSA | Kingdom of Saudi Arabia |
| LEDs | Light-Emitting Diodes |
| N | Number of People |
| OL | Ownership Level |
| OT | Operation Time |
| PU | Price per Unit of Electricity |
| RE | Renewable Energy |
| RP | Rated Power |
| RS | Ratio of the Saving of Energy |
| SBC | Saudi Building Code |
| SD | Sports Stadium |
| SEC | Saudi Electricity Company |
| SPBT | Simple Payback Time |
| SR | Saudi Riyal |
| SRU | Sulaiman Al-Rajhi University |
| U | Overall Heat Transfer Coefficient |
| VFD | Variable Frequency Drive |
References
- Saudi Arabia Energy Consumption. 2018. Available online: https://www.iea.org/sankey/#?c=Saudi%20Arabia&s=Balance (accessed on 20 June 2021).
- Saudi Electric Company. Annual Statistical Booklet for Electricity and Seawater Desalination Industries. p. 164. Available online: https://www.ecra.gov.sa/en-us/MediaCenter/doclib2/Pages/SubCategoryList.aspx?categoryID=5 (accessed on 20 January 2022).
- Vision 2030 of Kingdom of Saudi Arabia. 2016. Available online: http://vision2030.gov.sa/en/ntp (accessed on 14 December 2020).
- More Than 4 Million Riyals the Rate of Waste of Electricity at the University Annually! Available online: https://rs.ksu.edu.sa/issue-1365/16391 (accessed on 29 June 2021).
- Climate Transparency Report Comparing G20 Climate Action and Responses to the COVID-19 Crisis. 2020. Available online: https://www.climate-transparency.org/wp-content/uploads/2021/10/CT2021SaudiArabia.pdf (accessed on 16 June 2022).
- Yüksel, A.; Arıcı, M.; Krajčík, M.; Civan, M.; Karabay, H. A Review on Thermal Comfort, Indoor Air Quality and Energy Consumption in Temples. J. Build. Eng. 2020, 35, 102013. [Google Scholar] [CrossRef]
- Li, S.; Chen, Y. Internal benchmarking of higher education buildings using the floor-area percentages of different space usages. Energy Build. 2021, 231, 110574. [Google Scholar] [CrossRef]
- Ligade, J.; Razban, A. Investigation of Energy Efficient Retrofit HVAC Systems for a University: Case Study. Sustainability 2019, 11, 5593. [Google Scholar] [CrossRef] [Green Version]
- Husein, M.; Chung, I.-Y. Optimal design and financial feasibility of a university campus microgrid considering renewable energy incentives. Appl. Energy 2018, 225, 273–289. [Google Scholar] [CrossRef]
- Batlle, E.A.O.; Palacio, J.C.E.; Lora, E.E.S.; Reyes, A.M.M.; Moreno, M.M.; Morejon, M.B. A methodology to estimate baseline energy use and quantify savings in electrical energy consumption in higher education institution buildings: Case study, Federal University of Itajubá (UNIFEI). J. Clean. Prod. 2020, 244, 118551. [Google Scholar] [CrossRef]
- Almeida, A.P.; Sousa, V.; Silva, C.M. Methodology for estimating energy and water consumption patterns in university buildings: Case study, Federal University of Roraima (UFRR). Heliyon 2021, 7, e08642. [Google Scholar] [CrossRef]
- Khoshbakht, M.; Gou, Z.; Dupre, K. Energy use characteristics and benchmarking for higher education buildings. Energy Build. 2018, 164, 61–76. [Google Scholar] [CrossRef] [Green Version]
- Liu, Q.; Ren, J. Research on the building energy efficiency design strategy of Chinese universities based on green performance analysis. Energy Build. 2020, 224, 110242. [Google Scholar] [CrossRef]
- Chung, M.H.; Rhee, E.K. Potential opportunities for energy conservation in existing buildings on university campus: A field survey in Korea. Energy Build. 2014, 78, 176–182. [Google Scholar] [CrossRef]
- Samira, A.; Nurmammad, M. Multi-disciplinary Energy Auditing of Educational Buildings in Azerbaijan: Case Study at a University Campus. IFAC-PapersOnLine 2018, 51, 311–315. [Google Scholar] [CrossRef]
- Jradi, M.; Sangogboye, F.C.; Mattera, C.G.; Kjærgaard, M.B.; Veje, C.; Jørgensen, B.N. A World Class Energy Efficient University Building by Danish 2020 Standards. Energy Procedia 2017, 132, 21–26. [Google Scholar] [CrossRef]
- Chihib, M.; Salmerón-Manzano, E.; Manzano-Agugliaro, F. Benchmarking Energy Use at University of Almeria (Spain). Sustainability 2020, 12, 1336. [Google Scholar] [CrossRef] [Green Version]
- Gaspar, K.; Gangolells, M.; Casals, M.; Pujadas, P.; Forcada, N.; Macarulla, M.; Tejedor, B. Assessing the impact of the COVID-19 lockdown on the energy consumption of university buildings. Energy Build. 2022, 257, 111783. [Google Scholar] [CrossRef] [PubMed]
- Bourdeau, M.; Guo, X.; Nefzaoui, E. Buildings energy consumption generation gap: A post-occupancy assessment in a case study of three higher education buildings. Energy Build. 2018, 159, 600–611. [Google Scholar] [CrossRef] [Green Version]
- Bonnet, J.-F.; Devel, C.; Faucher, P.; Roturier, J. Analysis of electricity and water end-uses in university campuses: Case-study of the University of Bordeaux in the framework of the Ecocampus European Collaboration. J. Clean. Prod. 2002, 10, 13–24. [Google Scholar] [CrossRef]
- Mytafides, C.K.; Dimoudi, A.; Zoras, S. Transformation of a university building into a zero energy building in Mediterranean climate. Energy Build. 2017, 155, 98–114. [Google Scholar] [CrossRef]
- Stavropoulos, T.G.; Koutitas, G.; Vrakas, D.; Kontopoulos, E.; Vlahavas, I. A smart university platform for building energy monitoring and savings. J. Ambient Intell. Smart Environ. 2016, 8, 301–323. [Google Scholar] [CrossRef] [Green Version]
- Droutsa, K.G.; Kontoyiannidis, S.; Dascalaki, E.; Balaras, C. Benchmarking Energy Use of Existing Hellenic Non-residential Buildings. Procedia Environ. Sci. 2017, 38, 713–720. [Google Scholar] [CrossRef]
- Emil, F.; Diab, A. Energy rationalization for an educational building in Egypt: Towards a zero energy building. J. Build. Eng. 2021, 44, 103247. [Google Scholar] [CrossRef]
- Hamida, M.B.; Ahmed, W.; Asif, M.; Almaziad, F. Techno-Economic Assessment of Energy Retrofitting Educational Buildings: A Case Study in Saudi Arabia. Sustainability 2021, 13, 179. [Google Scholar] [CrossRef]
- Sait, H.H. Auditing and analysis of energy consumption of an educational building in hot and humid area. Energy Convers. Manag. 2013, 66, 143–152. [Google Scholar] [CrossRef]
- Saeed, S.A.R. Thermal comfort requirements in hot dry regions with special reference to Riyadh, Part 1: For university students. Int. J. Ambient Energy 1993, 14, 147–154. [Google Scholar] [CrossRef]
- Degree Days Calculated Accurately for Locations Worldwide. 2022. Available online: https://www.degreedays.net/ (accessed on 12 March 2022).
- Ma, Y.T.; Lu, M.Y.; Weng, J.T. Energy Consumption Status and Characteristics Analysis of University Campus Buildings. In Proceedings of the 5th International Conference on Civil Engineering and Transportation, Guangzhou, China, 28–29 November 2015. [Google Scholar]
- Abdo-Allah, A.; Iqbal, M.T.; Pope, K. Energy Consumption Analysis of a Large Building at Memorial University. J. Energy 2019, 2019, 5243737. [Google Scholar] [CrossRef]
- Gui, X.; Gou, Z.; Lu, Y. Reducing university energy use beyond energy retrofitting: The academic calendar impacts. Energy Build. 2021, 231, 110647. [Google Scholar] [CrossRef]
- Sun, Y.; Luo, X.; Liu, X. Optimization of a university timetable considering building energy efficiency: An approach based on the building controls virtual test bed platform using a genetic algorithm. J. Build. Eng. 2021, 35, 102095. [Google Scholar] [CrossRef]
- Deng, Y.; Gou, Z.; Gui, X.; Cheng, B. Energy consumption characteristics and influential use behaviors in university dormitory buildings in China’s hot summer-cold winter climate region. J. Build. Eng. 2021, 33, 101870. [Google Scholar] [CrossRef]
- Ali, S.B.M.; Hasanuzzaman, M.; Rahim, N.; Mamun, M.; Obaidellah, U. Analysis of energy consumption and potential energy savings of an institutional building in Malaysia. Alex. Eng. J. 2021, 60, 805–820. [Google Scholar]
- Amber, K.P.; Aslam, M.W.; Mahmood, A.; Kousar, A.; Younis, M.Y.; Akbar, B.; Chaudhary, G.Q.; Hussain, S.K. Energy consumption forecasting for university sector buildings. Energies 2017, 10, 1579. [Google Scholar] [CrossRef] [Green Version]
- Ghenai, C.; Bettayeb, M. Modelling and performance analysis of a stand-alone hybrid solar PV/Fuel Cell/Diesel Generator power system for university building. Energy 2019, 171, 180–189. [Google Scholar] [CrossRef]
- Residential SBC 602; Saudi Building Energy Conservation Code. Saudi Building Code National Committee: Riyadh, Saudi Arabia, 2018; p. 64. Available online: https://www.sbc.gov.sa/En/BuildingCode/Pages/SBC_602E.aspx (accessed on 20 January 2022).
- Almasri, R.A.; Akram, R.; Almarshoud, A.; Omar, H.M.; Alshitawi, M.S.; Esmaeil, K.K. Evaluation of the total exergy and energy consumptions in residential sector in Qassim Region, Saudi Arabia. Alex. Eng. J. 2022, 62, 455–473. [Google Scholar] [CrossRef]
- Google Maps. 2023. Available online: https://www.google.com/maps/place/26%C2%B008’34.5%22N+43%C2%B043’53.3%22E/@26.1418056,43.7309094,463m/data=!3m1!1e3!4m5!3m4!1s0x0:0xeabea1ea0a9d809c!8m2!3d26.1429129!4d43.73146?hl=en-SA (accessed on 20 January 2022).
- Alardhi, A.; Alaboodi, A.S.; Almasri, R. Impact of the new Saudi energy conservation code on Saudi Arabia residential buildings. Aust. J. Mech. Eng. 2022, 20, 1392–1406. [Google Scholar] [CrossRef]
- Esmaeil, K.K.; Alshitawi, M.S.; Almasri, R.A. Analysis of energy consumption pattern in Saudi Arabia’s residential buildings with specific reference to Qassim region. Energy Effic. 2019, 12, 2123–2145. [Google Scholar] [CrossRef]
- Kharseh, M.; Al-Khawaja, M.; Hassani, F. Comparison between different measures to reduce cooling requirements of residential building in cooling-dominated environment. Energy Build. 2015, 88, 409–412. [Google Scholar] [CrossRef]
- Al-Mumin, A.; Khattab, O.; Sridhar, G. Occupants’ behavior and activity patterns influencing the energy consumption in the Kuwaiti residences. Energy Build. 2003, 35, 549–559. [Google Scholar] [CrossRef]
- Almasri, R.A.; Almarshoud, A.F.; Omar, H.M.; Esmaeil, K.K.; Alshitawi, M. Exergy and Economic Analysis of Energy Consumption in the Residential Sector of the Qassim Region in the Kingdom of Saudi Arabia. Sustainability 2020, 12, 2606. [Google Scholar] [CrossRef] [Green Version]
- Tazay, A. Techno-Economic Feasibility Analysis of a Hybrid Renewable Energy Supply Options for University Buildings in Saudi Arabia. Open Eng. 2021, 11, 39–55. [Google Scholar] [CrossRef]
- Leal Filho, W.; Salvia, A.L.; Paço, A.D.; Anholon, R.; Quelhas, O.L.G.; Rampasso, I.S.; Ng, A.; Balogun, A.-L.; Kondev, B.; Brandli, L.L. A comparative study of approaches towards energy efficiency and renewable energy use at higher education institutions. J. Clean. Prod. 2019, 237, 117728. [Google Scholar] [CrossRef]
- Indoor Air Quality and Thermal Comfort in Open-Plan Offices. October 2005. Available online: https://nrc-publications.canada.ca/eng/view/ft/?id=1fd04d81-dad1-4859-aa7a-9cc66a2f8150 (accessed on 16 April 2021).
- Baseer, M.A.; Alqahtani, A.; Rehman, S. Techno-economic design and evaluation of hybrid energy systems for residential communities: Case study of Jubail industrial city. J. Clean. Prod. 2019, 237, 117806. [Google Scholar] [CrossRef]
- Engineering ToolBox. Illuminance—Recommended Light Level. 2004. Available online: https://www.engineeringtoolbox.com/light-level-rooms-d_708.html (accessed on 14 January 2021).
- Chalfoun, N. Greening University Campus Buildings to Reduce Consumption and Emission while Fostering Hands-on Inquiry-based Education. Procedia Environ. Sci. 2014, 20, 288–297. [Google Scholar] [CrossRef] [Green Version]
- Guidelines for Thermal Insulation Systems and Materials According to the Requirements of the Saudi Building Code; Saudi Energy Efficiency Center: Riyadh, Saudi Arabia, 2021; p. 67.
- Khan, H.S.; Asif, M. Impact of Green Roof and Orientation on the Energy Performance of Buildings: A Case Study from Saudi Arabia. Sustainability 2017, 9, 640. [Google Scholar] [CrossRef] [Green Version]
- Khalid, N. Efficient energy management: Is variable frequency drives the solution. Procedia—Soc. Behav. Sci. 2014, 145, 371–376. [Google Scholar] [CrossRef] [Green Version]
- Zhe, J.W.S. Optimization Strategy & Energy Savings of Water-Cooled Chiller Plant System. Bachelor Thesis, Universiti Teknologi PETRONAS, Seri Iskandar, Malaysia, 2015; p. 36. Available online: https://utpedia.utp.edu.my/15699/1/Dissertation%20-%20Optimization%20Strategy%20and%20Energy%20Savings%20of%20Water-cooled%20chiller%20plant%20system.pdf (accessed on 16 March 2022).
- Guide to Best Practice Maintenance & Operation of HVAC Systems for Energy Efficiency. 2012. Available online: https://www.airah.org.au/Content_Files/UsefulDocuments/DCCEE_HVAC_HESS_GuideToBestPractice2012.PDF (accessed on 1 January 2021).
- Chiller Plant Energy Use Spectrum. 2021. Available online: https://optimumenergyco.com/how-to-optimize-an-hvac-system/ (accessed on 5 January 2021).
- Alshehri, F.; Beck, S.; Ingham, D.; Ma, L.; Pourkashanian, M. Technico-economic modelling of ground and air source heat pumps in a hot and dry climate. Proc. Inst. Mech. Eng. Part A J. Power Energy 2020, 235, 1225–1239. [Google Scholar] [CrossRef]
- Almasri, R.A.; Abu-Hamdeh, N.H.; Alajlan, A.; Alresheedi, Y. Utilizing a Domestic Water Tank to Make the Air Conditioning System in Residential Buildings More Sustainable in Hot Regions. Sustainability 2022, 14, 15456. [Google Scholar] [CrossRef]
- Woolley, J.; Harrington, C.; Modera, M. Swimming pools as heat sinks for air conditioners: Model design and experimental validation for natural thermal behavior of the pool. Build. Environ. 2011, 46, 187–195. [Google Scholar] [CrossRef]
- Harrington, C.; Modera, M. Swimming pools as heat sinks for air conditioners: California feasibility analysis. Energy Build. 2013, 59, 252–264. [Google Scholar] [CrossRef]
- Kuo, C.-P.; Liao, H.-J. Challenge of Using Groundwater for Buildings Air Conditioning in Subtropical Areas. Sustainability 2022, 14, 364. [Google Scholar] [CrossRef]
- Other Ways to Improve Lighting Efficiency. Available online: https://smarterhouse.org/lighting/other-ways-improve-lighting-efficiency (accessed on 20 December 2022).


| Energy Sources | Total | Oil Products | Natural Gas | Electricity | Oil | |
|---|---|---|---|---|---|---|
| (Mtoe) | (%) | (%) | (%) | (%) | (%) | |
| Industry | 48.1 | 33 | 48 | 42 | 8 | 2 |
| Transport | 45.5 | 31 | 100 | - | - | - |
| Other | 24.4 | 16 | 7 | - | 93 | - |
| Non-Energy Use | 29.9 | 20 | 82 | 18 | - | - |
| Total Consumption by Use | 147.9 | 100 | ||||
| Parameter | Value |
|---|---|
| Function | Educational Building |
| Location | Al Qassim, Al Bukhariyah, KSA 26°08′26.2″N 43°43′54.8″E |
| Occupants’ Number | 1060, in 2021 |
| Gross Area | 89,970 m2 |
| Floor Height | 4 m |
| Space Use | Classrooms, Offices, Labs, Services Rooms, Auditorium, and Sports Facilities |
| Tariff Category | Private |
| Envelope Specifications | Roof = 250 mm of precast slap, 200 mm of screed double layer 4 mm, 80 mm of heat insulation, and 90 mm of gravel Wall = 150 mm thick precast concrete 12 mm of an air gap, 80 mm of polystyrene density 35 kg/m3, and 18 mm of gypsum board |
| Glazing Type | Double/k-lite 6 mm ss08 on green with 12 mm air spacer |
| Air Infiltration | 12 air change/h |
| Activity | Offices | Classrooms | Laboratories | Services Area | Sports Facilities | Auditorium |
|---|---|---|---|---|---|---|
| Area (m2) | 18,100 | 21,212 | 9968 | 27,600 | 10,400 | 2690 |
| Area Percentage (%) | 20 | 24 | 11 | 31 | 11 | 3 |
| Area | Temperatures (°C) | Relative Humidity (%) | ||||
|---|---|---|---|---|---|---|
| Summer | Winter | |||||
| Measured | Recommended | Measured | Recommended | Measured | Recommended | |
| Offices | 18–22 | 23–26 | 20–22 | 20–23 | 28–33 | 30–60 |
| Classrooms | 19–22 | 23–26 | 20–22 | 20–23 | 29–34 | 30–60 |
| Service rooms | 16–22 | 23–26 | 18–22 | 20–23 | 30–34 | 30–60 |
| Corridors | 19–22 | 23–26 | 21–22 | 20–23 | 28–33 | 30–60 |
| Auditorium | 19–22 | 23–26 | 20–22 | 20–23 | 27–34 | 30–60 |
| Toilets | 20–23 | 23–26 | 21–22 | 20–23 | 30–33 | 30–60 |
| Lobbies | 19–22 | 23–26 | 20–22 | 20–23 | 29–35 | 30–60 |
| Area | Type of Lamps | Power (W) | Number of Fixtures | Operating Hours per Day (h) | Operating Days per Month | Control Type | Measured Light Level (Lux) | Standard Light Level (Lux) | Yearly Consumption of Electricity (kWh) |
|---|---|---|---|---|---|---|---|---|---|
| Offices and Classrooms | FTL 2FT | 72 | 1604 | 9 | 22 | Sensor | 250–350 | 300 | 274,399 |
| FTL 2FT | 72 | 390 | 24 | 30 | Switch | 250–350 | 300 | 242,611 | |
| Basement Parking Lot | FTL | 72 | 117 | 24 | 30 | Switch | 50–60 | 50–100 | 72,783 |
| Corridors | LED | 18 | 160 | 9 | 22 | Sensor | 150–250 | 100 | 6843 |
| LED | 18 | 270 | 24 | 30 | Switch | 150–250 | 100 | 41,990 | |
| CFL | 52 | 125 | 24 | 30 | Switch | 50–100 | 100 | 56,160 | |
| CFL | 52 | 180 | 9 | 22 | Sensor | 50–100 | 100 | 22,239 | |
| CFL | 52 | 87 | 9 | 22 | Sensor | 250–350 | 100 | 10,749 | |
| CFL | 52 | 73 | 24 | 30 | Switch | 250–350 | 100 | 32,797 | |
| Toilets | FTL | 52 | 360 | 24 | 30 | Switch | 30–60 | 100–300 | 161,741 |
| Studios | HPS | 400 | 50 | 5 | 30 | Switch | 150–200 | 75 | 36,000 |
| Auditorium | CFL | 52 | 124 | 9 | 22 | Sensor | 200–300 | 500 | 15,320 |
| Total | 973,634 |
| Appliances | Number of Devices | Weighted Power (W) | Operation Time per Day (h) | Daily Electricity Consumption (kWh) | Yearly Electricity Consumption (MWh) |
|---|---|---|---|---|---|
| Service Devices (Elevators, Cleaning Machines, etc.) | 52 | 1100 | 8 | 457.6 | 120.8 |
| Offices Devices (Computers, Printers, etc.) | 800 | 8 | 8 | 51.2 | 13.5 |
| Communication Devices (Datacenter, Routers, Servers, etc.) | 535 | 8 | 24 | 102.7 | 37 |
| Electro-mechanical Devices (Pumps, Transformers, etc.) | 72 | 1000 | 24 | 1728 | 622 |
| Safety Devices (Alarm Systems, CCTV Cameras, etc.) | 250 | 5 | 24 | 30 | 10.8 |
| Water Heater System | 97 | 2000 | 11 | 2134 | 512.2 |
| Central Water Heater | 39 | 6000 | 11 | 2574 | 617.8 |
| Lab Devices (Fume Hood, Electron Microscope, etc.) | 30 | 300 | 3 | 27 | 7.1 |
| Total | 7104 | 1941 | |||
| AC | Lighting | Equipment | Other | Data Center | PC/Laptops | Reference and Date of Publication | |
|---|---|---|---|---|---|---|---|
| University of Arizona, USA | 37.4 | 33.5 | 24.7 | 4.4 | - | Chalfoun, 2014 [50] | |
| Smart International Hellenic University, Greece | 9.2 | - | 6.1 | 12.1 | 53.6 | Stavropoulos et al. [22] | |
| Universiti Malaya, Malaysia | 34 | 18 | 23 | 15 | - | 10 | Ali et al., 2020 [34] |
| University classroom building in Xi’an, China | 53 | 41 | 6 | - | - | - | Sun et al., 2021 [32] |
| Paricarana Campus of the Federal University of Roraima, Brazil | 63 | 18 | 15 | 4 | - | - | Almeida et al., 2017 [11] |
| Administration Building, University of Sharjah, UAE | 72 | 10 | - | 18 | - | - | Ghenai and Bettayeb, 2019 [36] |
| Current Study, SRU, Center of KSA. | 79 | 7 | - | 14 | - | - | 2021–2022 |
| Diesel Consumption (Liter) | Annual Electricity Consumption (kWh) | EUI (kWh/m2) | Number of People | Electricity Consumption per Capita (kWh/capita) | |
|---|---|---|---|---|---|
| 2017 | 3,951,973 | 13,081,031 | 145.4 | 800 | 16,351 |
| 2018 | 4,034,996 | 13,355,535 | 148.4 | 850 | 15,712 |
| 2019 | 4,157,260 | 13,762,553 | 153.0 | 910 | 14,959 |
| 2020 | 3,915,000 | 12,961,108 | 144.1 | 998 | 12,987 |
| 2021 | 4,224,564 | 13,859,029 | 155.0 | 1060 | 13,075 |
| Month | Energy Consumption (kWh) | Quantity of Diesel Supplied (L) | Diesel Consumed (L) | Total Cost of Diesel Consumed (SR) | Total Cost of Fuel & Generator Rental (SR) | Cost of kWh from Diesel-Only (SR/kWh) | Cost of kWh from Rented Generator (SR/kWh) | Total Cost of kWh from Generator (SR/kWh) | Amount of Energy Produced per liter (kWh/L) |
|---|---|---|---|---|---|---|---|---|---|
| Jan | 686,525 | 224,000 | 221,800 | 110,900 | 366,200 | 0.16 | 0.37 | 0.53 | 3.10 |
| Feb | 684,532 | 192,000 | 208,017 | 104,009 | 359,309 | 0.15 | 0.37 | 0.52 | 3.29 |
| Mar | 956,737 | 288,000 | 291,868 | 145,934 | 401,234 | 0.15 | 0.27 | 0.42 | 3.28 |
| Apr | 1,146,000 | 352,000 | 341,009 | 170,505 | 425,805 | 0.15 | 0.22 | 0.37 | 3.36 |
| May | 1,426,364 | 384,000 | 432,616 | 216,308 | 471,608 | 0.15 | 0.18 | 0.33 | 3.30 |
| Jun | 1,539,369 | 640,000 | 463,291 | 231,646 | 486,946 | 0.15 | 0.17 | 0.32 | 3.32 |
| Jul | 1,681,900 | 544,000 | 506,210 | 253,105 | 508,405 | 0.15 | 0.15 | 0.30 | 3.32 |
| Aug | 1,490,673 | 544,000 | 485,785 | 242,893 | 498,193 | 0.16 | 0.17 | 0.33 | 3.07 |
| Sep | 1,301,418 | 416,000 | 434,260 | 217,130 | 472,430 | 0.17 | 0.20 | 0.36 | 3.00 |
| Oct | 1,286,700 | 320,000 | 382,965 | 191,483 | 446,783 | 0.15 | 0.20 | 0.35 | 3.36 |
| Nov | 896,530 | 288,000 | 250,065 | 125,033 | 380,333 | 0.14 | 0.28 | 0.42 | 3.59 |
| Dec | 762,281 | 256,000 | 206,678 | 103,339 | 358,639 | 0.14 | 0.33 | 0.47 | 3.69 |
| Material | Thickness, L (mm) | Thermal Conductivity, k (W/m K) | Density, ƍ (kg/m3) |
|---|---|---|---|
| Exterior Walls | |||
| Precast Concrete | 150 | 1.6 | 2300 |
| Air Gap | 12 | - | - |
| Insulation/Polystyrene | 80 | 0.034 | 35 |
| Gypsum Board | 18 | 0.27 | 800 |
| Roofs | |||
| Precast Slap | 250 | 1.4 | 2800 |
| Foam Concrete | 45 | 0.07 | 700 |
| Insulation/Polystyrene | 80 | 0.03 | 35 |
| Gravel | 90 | 1.01 | 800 |
| Zone 1 | Zone 2 | Zone 3 | ||||
| Walls | Roofs | Walls | Roofs | Walls | Roofs | |
| Non-Residential SBC 601 | 0.511 | 0.272 | 0.591 | 0.340 | 0.698 | 0.397 |
| Residential SBC 601 | 0.454 | 0.511 | 0.591 | |||
| Residential SBC 602 | 0.403 | 0.454 | 0.511 | |||
| Windows–Wall Ratio (%) | U (W/m2 K) | Solar Heat Gain Coefficient (%) | |
|---|---|---|---|
| Non-Residential SBC 601, and Residential SBC 601 | Less than 40 | 2.890 | 0.25 |
| 40–50 | 2.380 | ||
| More than 50 | 1.870 | ||
| Residential SBC 602 | All Cases | 2.668 |
| Model | 30XAB4002-0-75 |
| Type | Air-Cooled Screw |
| Cooling-Capacity, kW | 1350 |
| Nominal Capacity, ton | 384 |
| Total Power, kW | 449 |
| Full Load EER | 10.2 |
| Full Load COP | 3.0 |
| VFD | No |
| Technical Data | Chiller 1 | Chiller 2 |
|---|---|---|
| Capacity (TR) | 384 | 384 |
| Input Power (kW) | 212 | 549.1 |
| COP (-) | 2.9 | 2.0 |
| Area | Operating Days per Month | Operating Hours per Day (h) | Number of Fixtures | Base Case | LED | ||
|---|---|---|---|---|---|---|---|
| Power (W) | Yearly Consumption of Electricity (kWh) | Power (W) | Yearly Consumption of Electricity (kWh) | ||||
| Offices and Classrooms | 22 | 9 | 1604 | 72 | 274,399 | 18 | 68,600 |
| 30 | 24 | 390 | 72 | 242,611 | 18 | 60,653 | |
| Basement Parking Lot | 30 | 24 | 117 | 72 | 72,783 | 18 | 18,196 |
| Corridors | 22 | 9 | 160 | 18 | 6843 | 18 | 6843 |
| 30 | 24 | 270 | 18 | 41,990 | 18 | 41,990 | |
| 22 | 9 | 267 | 52 | 32,988 | 18 | 11,419 | |
| 30 | 24 | 198 | 52 | 88,957 | 18 | 30,793 | |
| Toilets | 30 | 24 | 360 | 52 | 161,741 | 18 | 55,987 |
| Studios | 15 | 9 | 50 | 400 | 36,000 | 80 | 7200 |
| Auditorium | 22 | 9 | 124 | 52 | 15,320 | 18 | 5303 |
| Total | 973,634 | 306,984 | |||||
| Energy Saving (kWh) | 666,650 | ||||||
| Energy Saving (%) | 68 | ||||||
| Area | Type of Lamps | Power (W) | Number of Fixtures | Base Case | Sensor | ||||
|---|---|---|---|---|---|---|---|---|---|
| Operating Hours per Day (h) | Operating Days per Month | Yearly Consumption of Electricity (kWh) | Operating Hours per Day (h) | Operating Days per Month | Yearly Consumption of Electricity (kWh) | ||||
| Offices and Classrooms | FTL 2FT | 72 | 1604 | 9 | 22 | 274,399 | 9 | 22 | 274,399 |
| FTL 2FT | 72 | 390 | 24 | 30 | 242,611 | 9 | 22 | 66,718 | |
| Basement Parking Lot | FTL | 72 | 117 | 24 | 30 | 72,783 | 9 | 22 | 20,015 |
| Corridors | LED | 18 | 160 | 9 | 22 | 6843 | 9 | 22 | 6843 |
| LED | 18 | 270 | 24 | 30 | 41,990 | 9 | 22 | 11,547 | |
| CFL | 52 | 267 | 9 | 22 | 32,988 | 9 | 22 | 32,988 | |
| CFL | 52 | 198 | 24 | 30 | 88,957 | 9 | 22 | 24,463 | |
| Toilets | FTL | 52 | 360 | 24 | 30 | 161,741 | 9 | 22 | 44,479 |
| Studios | HPS | 400 | 50 | 5 | 30 | 36,000 | 5 | 16 | 19,200 |
| Auditorium | CFL | 52 | 124 | 9 | 22 | 15,320 | 9 | 22 | 15,320 |
| Total | 973,634 | 515,974 | |||||||
| Saving (%) | 0 47 | ||||||||
| Area | Operating Hours per Day (h) | Operating Days per Month | Power (W) | Number of Fixtures | Yearly Consumption of Electricity (kWh) | |
|---|---|---|---|---|---|---|
| Base Case | LED & Sensor | |||||
| Offices and Classrooms | 9 | 22 | 18 | 1604 | 274,399 | 60,600 |
| 9 | 22 | 18 | 390 | 242,611 | 16,680 | |
| Basement Parking Lot | 9 | 22 | 18 | 117 | 72,783 | 5004 |
| Corridors | 9 | 22 | 18 | 160 | 6843 | 6843 |
| 9 | 22 | 18 | 270 | 41,990 | 11,547 | |
| 9 | 22 | 18 | 267 | 32,988 | 11,419 | |
| 9 | 22 | 18 | 198 | 88,957 | 8468 | |
| Toilets | 9 | 22 | 18 | 360 | 161,741 | 15,396 |
| Studios | 5 | 16 | 80 | 50 | 36,000 | 3840 |
| Auditorium | 9 | 22 | 18 | 124 | 15,320 | 5303 |
| Total | 973,634 | 151,100 | ||||
| Saving (%) | 0 | 84 | ||||
| ECMs | Energy-Saving (kWh) | Replacement Cost (SR) | Price per Unit of Electricity, 0.39 (SR/kWh) | Price per Unit of Electricity, 0.18 (SR/kWh) | ||
|---|---|---|---|---|---|---|
| Saving Cost (SR) | Payback Time (year) | Cost Saving (SR) | Payback Time (year) | |||
| Set Point Temperature | 1,917,648 | 0 | 747,883 | 0 | 344,177 | 0 |
| Using Efficient Chillers | 1,445,200 | 3,800,000 | 563,745 | 6.74 | 260,136 | 14.61 |
| Improving Light Systems | 822,534 | 254,160 | 320,788 | 0.79 | 148,056 | 1.72 |
| Improving Water-Heating Systems | 706,250 | 0 | 275,340 | 0 | 127,013 | 0 |
| Total | 4,891,632 | 7,854,160 | 1,899,487 | 4.13 | 879,436 | 8.96 |
| ECMs | Energy-Saving (kWh) | Reduction in CO2 Emissions (kg) | Reduction in CO Emissions (kg) | Reduction in N2O Emissions (kg) | Reduction in SO₂ Emissions (kg) |
|---|---|---|---|---|---|
| Set Point Temperature | 1,917,648 | 1,348,107 | 3433 | 3068 | 2819 |
| Using Efficient Chillers | 1,445,200 | 1,015,976 | 2587 | 2312 | 2124 |
| Improving Light Systems | 822,534 | 578,241 | 1472 | 1316 | 1209 |
| Improving Water-Heating Systems | 706,250 | 496,494 | 1264 | 1130 | 1038 |
| Total | 4,891,632 | 3,438,817 | 8756 | 7827 | 7191 |
Disclaimer/Publisher’s Note: The statements, opinions and data contained in all publications are solely those of the individual author(s) and contributor(s) and not of MDPI and/or the editor(s). MDPI and/or the editor(s) disclaim responsibility for any injury to people or property resulting from any ideas, methods, instructions or products referred to in the content. |
© 2023 by the authors. Licensee MDPI, Basel, Switzerland. This article is an open access article distributed under the terms and conditions of the Creative Commons Attribution (CC BY) license (https://creativecommons.org/licenses/by/4.0/).
Share and Cite
Alfaoyzan, F.A.; Almasri, R.A. Benchmarking of Energy Consumption in Higher Education Buildings in Saudi Arabia to Be Sustainable: Sulaiman Al-Rajhi University Case. Energies 2023, 16, 1204. https://doi.org/10.3390/en16031204
Alfaoyzan FA, Almasri RA. Benchmarking of Energy Consumption in Higher Education Buildings in Saudi Arabia to Be Sustainable: Sulaiman Al-Rajhi University Case. Energies. 2023; 16(3):1204. https://doi.org/10.3390/en16031204
Chicago/Turabian StyleAlfaoyzan, Faouzan Abdulaziz, and Radwan A. Almasri. 2023. "Benchmarking of Energy Consumption in Higher Education Buildings in Saudi Arabia to Be Sustainable: Sulaiman Al-Rajhi University Case" Energies 16, no. 3: 1204. https://doi.org/10.3390/en16031204
APA StyleAlfaoyzan, F. A., & Almasri, R. A. (2023). Benchmarking of Energy Consumption in Higher Education Buildings in Saudi Arabia to Be Sustainable: Sulaiman Al-Rajhi University Case. Energies, 16(3), 1204. https://doi.org/10.3390/en16031204