Article

Effect of Combustion Conditions and Blending Ratio on Aero-Engine Emissions

1
Shanghai Aircraft Design and Research Institute, Shanghai 201210, China
2
Aeronautical Engineering Institute, Civil Aviation University of China, Tianjin 300300, China
3
Sino-European Institute of Aviation Engineering, Civil Aviation University of China, Tianjin 300300, China
*
Author to whom correspondence should be addressed.
Energies 2023, 16(20), 7060; https://doi.org/10.3390/en16207060
Submission received: 18 August 2023 / Revised: 25 September 2023 / Accepted: 2 October 2023 / Published: 12 October 2023
(This article belongs to the Section B: Energy and Environment)

Abstract

:
The combustion chamber operating pressure, air inlet temperature, and bio-fuel blending ratio are the key factors affecting the emissions of aero engines. Numerical simulations were used to investigate the emission patterns of CO, CO2, NO and carbon soot at the combustion chamber outlet at different temperatures, pressures and blending ratios. The results show that the emission patterns of CO, CO2, NO and carbon soot vary greatly. With increasing working pressure and inlet air temperature of the combustion chamber, the CO2 emissions initially increase rapidly. However, when the working pressure exceeds 0.7 MPa and the inlet air temperature exceeds 450 K, the growth rate of CO2 emissions slows down. On the other hand, CO emissions show a relatively steady increase, but when the working pressure exceeds 0.5 MPa and the inlet air temperature exceeds 550 K, the CO emissions increase rapidly. The CO emissions decrease uniformly with an increase in the blending ratio, whereas the CO2 emissions are not significantly affected by the blending ratio when the bioethanol/aviation fuel ratio is less than 30%. However, when the blending ratio exceeds 30%, the CO2 emissions gradually decrease with an increase in the blending ratio. With increasing pressure, the distribution of NO in the combustion chamber shifts backward gradually, and the NO generation is related to the working pressure in a power function. The NO generation increases rapidly with an increase in the inlet air temperature, but it tends to slow down when the temperature reaches 550 K. The NO generation increases exponentially with an increase in the blending ratio. As the inlet air temperature increases, the soot emissions increase exponentially. The soot is concentrated in the head of the combustion chamber, and the maximum generation gradually decreases. When the biofuel blending ratio is 20%, the soot emissions show a trend of slowing down and then rapidly decreasing. Overall, the soot generation decreases gradually with an increase in the biofuel blending ratio.

1. Introduction

With increasing attention to climate change and air quality, aeropropulsion combustion emissions have received great concern, and are subject to increasingly strict restrictions. Compared to direct atmospheric emissions from the ground, aviation emissions have a more direct and pronounced impact on global atmospheric changes [1]. Aero engines use jet fuel as the primary fuel. The main combustion pollutants are CO, CO2, NO and carbon soot. The volume fractions of these harmful substances are closely related to air inlet temperature, combustion chamber pressure, and bio-fuel blending ratio. Bio-fuels are the key method to address aviation’s environmental pollution. Many scholars have studied combustion pollutants from aviation fuels and influencing factors. Parfhasarathy [2] researched combustion characteristics of jet fuel/ethanol blends in a porous burner, finding higher NOx emission indices for ethanol blends versus jet fuel. Wang [3] experimentally investigated combustion of jet fuel/ethanol blends. It was considered that adding ethanol to jet fuel can reduce fuel combustion efficiency and maximum CO concentration during reaction. Alvaro [4] studied jet fuel/ethanol blend combustion in gas turbines. It is believed that the rate of combustion of ethanol blended with jet fuel is similar to that of jet fuel. The ethanol reduced carbon soot emissions. Zheng et al. [5] measured particulate emissions, finding higher aromatic content is the main cause of incomplete combustion and increased carbon soot. Lefebvre [6] considered NOx emissions to have a power function relationship with pressure and an exponential relationship with combustion temperature. Jiang et al. [7] found bio-ethanol fuels have lower carbon but higher oxygen. This improves combustion efficiency with lower pollutant emissions versus fossil fuels. Franco and Yamasaki [8,9] found combustion chamber structure and performance are affected by bio-fuel type and composition. The combustion chamber requires design and modification based on the fuel combustion characteristics. In summary, many scholars at home and abroad have studied the combustion and emission characteristics of bio-fuel blending, but the determination of combustion and emission characteristics is a key issue to be solved for the wide application of biofuels in aviation engines, and the combustion characteristics of bio-ethanol/aviation kerosene blended fuels as well as the emission characteristics under different working conditions have not been clarified.
Based on the above research, this study selects bio-ethanol fuel as aviation biofuel to investigate the emission patterns of pollutants at blending ratios of 0% (B0), 10% (B10), 20% (B20), 30% (B30), 40% (B40) and 50% (B50) of bio-ethanol/aviation kerosene. The study also takes into account the influence of pressure and temperature on pollutant emissions by setting the working pressure of the combustion chamber at 0.3 MPa, 0.5 MPa, 0.7 MPa and 1 MPa, and the inlet air temperature at 350 K, 450 K, 550 K and 650 K. The variation patterns of CO, CO2, NO and soot emissions at the outlet of the combustion chamber under the above conditions are studied, aiming to provide a theoretical basis for reducing carbon emissions and optimizing the combustion process.

2. Model Development

2.1. Fuel Substitution Model

Jet fuel consists of various hydrocarbon compounds (C9H16). To accurately understand the impact of important intermediates in the combustion chamber on pollutant generation mechanisms. The substitute fuels with similar physical and chemical properties to jet fuel are generally used for simulation analysis [10]. Domestic and foreign scholars have proposed various single or multi-component jet fuel numerical simulation substitute fuels. Wang et al. [11] used C12H24 as a jet fuel simulation substitute fuel. They conducted detailed numerical calculations on the combustion process and carbon soot generation in a single-tube combustor, with good agreement with experimental results. Xiao [12] simplified and reduced the detailed reaction mechanism of Dagaut in France. C10H22 was used to replace jet fuel to calculate the flow field distribution in a scramjet combustion chamber. The computed wall pressure matched well with experimental results. Li et al. [13] used C12H23 as a jet fuel numerical simulation substitute fuel. They conducted numerical calculations on a dual-mode multi-cavity scramjet engine combustion chamber, obtaining reasonable results. NASA’s Langley Center [14] proposed a 17-component, 30-step reaction simplified mechanism used in the national combustion calculation program. The kerosene substitute model was C12H23. In this study, jet fuel was represented by C12H23 as the substitute fuel, using single-step global reactions or few-step reaction mechanisms. This can obtain an accurate combustion chamber temperature field distribution and simplify the calculation process.
Bio-ethanol is widely used and can be produced from starch crops, waste straw, algae, oils etc. through fermentation. It has high concentration and few other components, so ethanol C2H5OH was directly used for numerical simulation in this study [15].

2.2. Combustion Chamber Model

In this study, the combustion chamber model proposed by Li et al. [16] is used, which combines a novel segmentation concept of capturing swirl and swirl combustion characteristics capable of simultaneously achieving high combustion efficiency, low pollutant emissions and combustion stability.
As shown in Figure 1, the model has two fuel inlets (10 mm), two air inlets (4 mm) and one outlet (60 mm). The air inlet and fuel inlet are set as mass inflow ports, the inlet air volume is 20 kg/s, the fuel supply volume is 0.1155 kg/s, and the fuel supply temperature is 303 K. It is assumed that the fuel enters into the combustion chamber after being atomised by the cyclone, and the droplets formed after atomisation have a particle size of 100 µm, a spray cone angle of 60°, and a mass flow rate of 0.05775 kg/s. The outlet temperature is set to 1800 K. The walls are non-adiabatic with a constant temperature of 1200 K. This study focuses on the analysis of the fuel inlet and fuel outlet at the same time. The walls are non-adiabatic and the temperature is constant at 1200 K. This study focuses on analysing the chemical reaction variations in the generation characteristics of the combustion products of aviation fuels rather than their flow-related characteristics, and a simplified two-dimensional model is used to visually analyse the temperature distribution of the combustion process as well as the emission products.
The model was discretized with an unstructured mesh. The grid independence was verified by observing the CO2 mass fraction and average temperature at the chamber outlet. As shown in Figure 2, when the grid number exceeded 50,000, the variation range of the CO2 mass fraction and average temperature at the outlet was very small. To better ensure simulation accuracy, 90,000 grid cells were used in this study.

2.3. Mathematical Models

A non-premixed combustion model was used, processed via a mixing-controlled model or chemical equilibrium, superior to finite-rate models. It is highly suitable for simulating complex combustion in aero engine chambers. Turbulence models include the standard k ε model, RNG k ε model, Realizable k ε model, and the most widely used standard k ε two-equation model. Due to the large vortices and jets in the chamber model, the standard k ε two-equation model was selected, assuming fully turbulent flow and ignoring molecular viscosity effects. Equations (1) and (2) are the equations for the turbulent kinetic energy k and dissipation rate ε in the standard k ε model. Here, G k and G b represent turbulent kinetic energy due to mean velocity gradients and buoyancy effects, respectively, and Y M represents the effect of fluctuating expansion on the total dissipation rate in compressible turbulence.
ρ D k D t = x i μ + μ t k k x i + G k + G b ρ ε Y M
ρ D ε D t = x i μ + μ t k ε x i + G l ε ε k G k + G 3 ε G b C 2 ε ρ ε 2 k
  • G k : Generation of turbulent kinetic energy due to mean velocity gradient;
  • G h : Turbulent kinetic energy generated by buoyancy;
  • Y M : Contribution of fluctuating expansion to the total dissipation rate in compressible turbulence;
  • C 1 ε , C 2 ϵ , C 3 ε : constants, which are 1.44 , 1.92 , 0 ;
  • k , s : Turbulent Prandtl number, 1.0, 1.3, respectively;
  • which:
    μ t = ρ C μ k 2 ε
  • C μ : Constant, taken as 0.09

3. Results and Discussion

3.1. Feasibility Verification

3.1.1. Temperature and CO, CO2 Distributions in the Combustion Chamber

CO and CO2 generation is mainly related to gas mixing conditions and temperature during fuel combustion. Figure 3 shows the temperature and CO and CO2 distributions for pure jet fuel combustion at 0.7 MPa in the combustion chamber.
As shown in Figure 3, the high temperature region in the chamber is away from the nozzles, with maximum temperature reaching 2400 K. CO is mainly distributed near the low temperature zone around the nozzles, while the CO2 distribution corresponds to the high temperature region, primarily away from the nozzles. This matches the temperature and emissions distributions in the literature [17,18], providing an initial verification of model validity.
Chemical reaction kinetics indicate CO is an intermediate product of hydrocarbon oxidation, produced during combustion of any carbonaceous fuel. CO presence in exhaust is often associated with incomplete combustion, such as interrupted CO to CO2 conversion due to incomplete combustion or oxygen deficiency in the primary zone, or CO2 high temperature dissociation under stoichiometric conditions, which also yields some CO [17,18]. Near the nozzles, non-uniform fuel and air mixing creates a low temperature zone, causing incomplete combustion and greater CO production. As combustion progresses, gas mixing gradually becomes uniform, raising combustion temperature and oxidizing CO to CO2, reducing CO emissions.

3.1.2. Influence of Combustion Chamber Pressure on NO Emissions

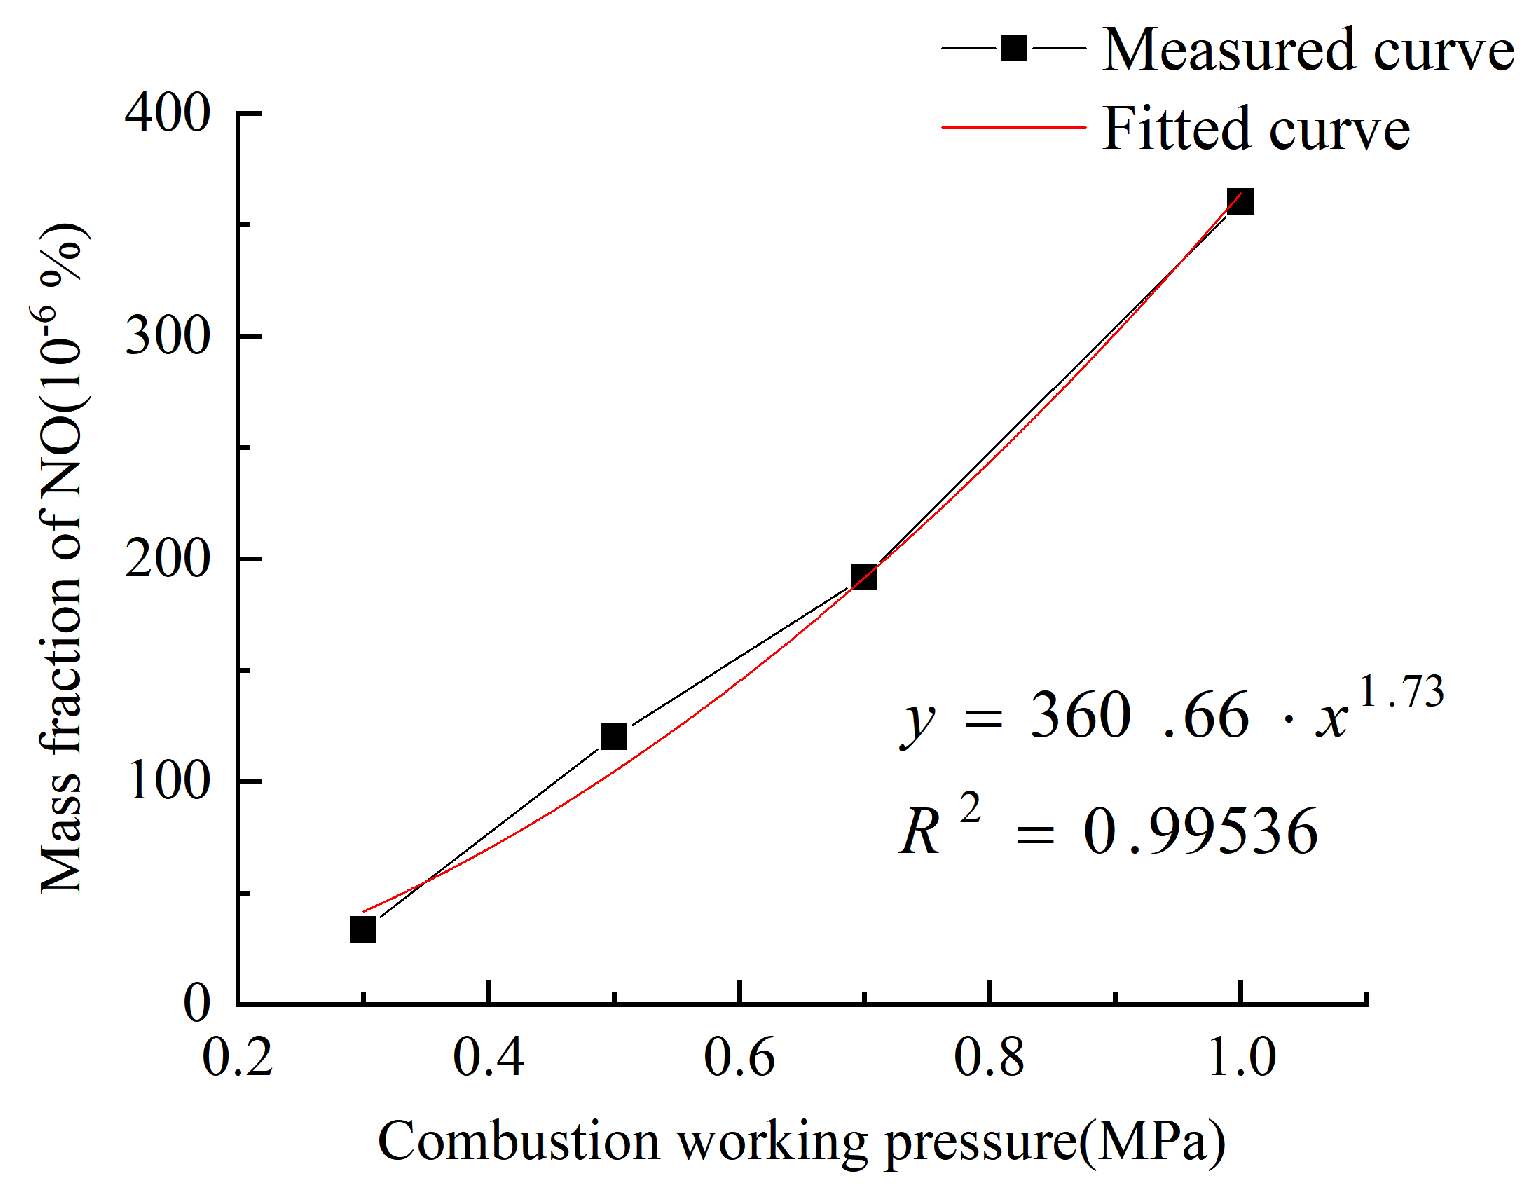
Figure 4 shows the variation in NO emissions at the combustion chamber outlet with combustion chamber pressure.
NO emissions exhibit a power function relationship with combustion chamber pressure, consistent with conclusions in [6], indicating the feasibility of simulation results under this model for simulating combustion chamber emission characteristics. As the working pressure of the combustion chamber increases, the NO emissions increase exponentially with the working pressure. The degree of fit between the fitted values and the measured values is 0.99536, indicating a good fit and accurately representing the relationship between NO emissions and the increase in working pressure of the combustion chamber. The increase in pressure inside the combustion chamber enhances the vaporization of gas molecules in the mixture of fuel and air. The higher uniformity of fuel and air mixture promotes combustion, improves thermal efficiency, and reduces fuel consumption. However, the increase in temperature inside the combustion chamber promotes the formation of nitrogen oxides, leading to an increase in the production of nitrogen oxides.

3.2. Influence of Combustion Conditions and Blending Ratio on COx Emissions

COx is one of the common types of pollutants in the combustion chamber of aircraft engines and is a major contributor to greenhouse gas emissions. CO is an intermediate product produced during the combustion of carbon-containing fuels, and all the carbon initially present in the fuel is converted to CO. The generation and destruction of CO are controlled by the chemical reaction kinetics mechanism, which is one of the fundamental reactions in the combustion process of hydrocarbon fuels. The formation mechanism can be described as follows: RH→R→RO2→RCHO→RCO→CO. As the combustion progresses and becomes more complete, CO is oxidized to CO2.

3.2.1. Influence of Combustion Chamber Pressure

Combustion chamber pressure has a great influence on CO and CO2 generation and emissions. CO and CO2 emissions under 0.3 MPa, 0.5 MPa, 0.7 MPa and 1 MPa were simulated, with results shown in Figure 5.
CO and CO2 emissions increase with combustion chamber pressure. Based on curve fitting, the change pattern of CO2 emission can be described by an exponential function. The fit is good. When the working pressure of the combustion chamber increases from 0.3 MPa to 0.5 MPa, the CO2 emission at the outlet of the combustion chamber rapidly increases. However, when the working pressure of the combustion chamber exceeds 0.5 MPa, the increase in CO2 emission slows down. On the other hand, the emission of CO follows a power function with respect to the working pressure of the combustion chamber. When the working pressure is less than 0.3 MPa, the increase in CO emission is relatively gradual. However, when the pressure exceeds 0.3 MPa, the CO emission at the outlet of the combustion chamber rapidly increases. This is because CO generation is mainly impacted by fuel pyrolysis and incomplete combustion. At lower pressures, the lower fuel pyrolysis rate enables some fuel molecules to fully oxidize to CO2, hence the higher CO2 generation rate initially. As pressure increases, faster fuel pyrolysis results in more intermediates including CO, gradually raising the CO generation rate. Also, With increasing pressure, rapid CO2 generation from fuel reactions consumes excessive oxygen, causing incomplete combustion generating CO in some fuel.

3.2.2. Influence of Air Inlet Temperature

The variation patterns of CO and CO2 emissions under different air inlet temperatures are shown in Figure 6. It can be observed that as the air inlet temperature increases, both CO and CO2 emissions exhibit exponential growth. This is because during the combustion process, both CO and CO2 are simultaneously generated. However, as the temperature continues to increase, the production of CO2 rapidly increases at temperatures below 450 K, and then gradually slows down at temperatures above 450 K. The production of CO increases slowly at temperatures below 550 K, but when the temperature exceeds 550 K, the emission of CO rapidly increases. Overall, the production rate of CO gradually increases. This is due to the high temperature inhibiting the conversion of CO to CO2, resulting in a decreasing rate of CO to CO2 conversion. Additionally, some CO2 may also undergo decomposition to produce CO, leading to an increasing rate of CO production and a decreasing rate of CO2 production. Fitting the two curves, it is found that the curve fitting for CO2 emissions is relatively good, with a coefficient of determination of 0.99955. On the other hand, the curve fitting for CO emissions has a lower coefficient of determination of 0.98950, indicating a relatively poorer fit compared to CO2.

3.2.3. Analysis of the Influence of Blending Ratio

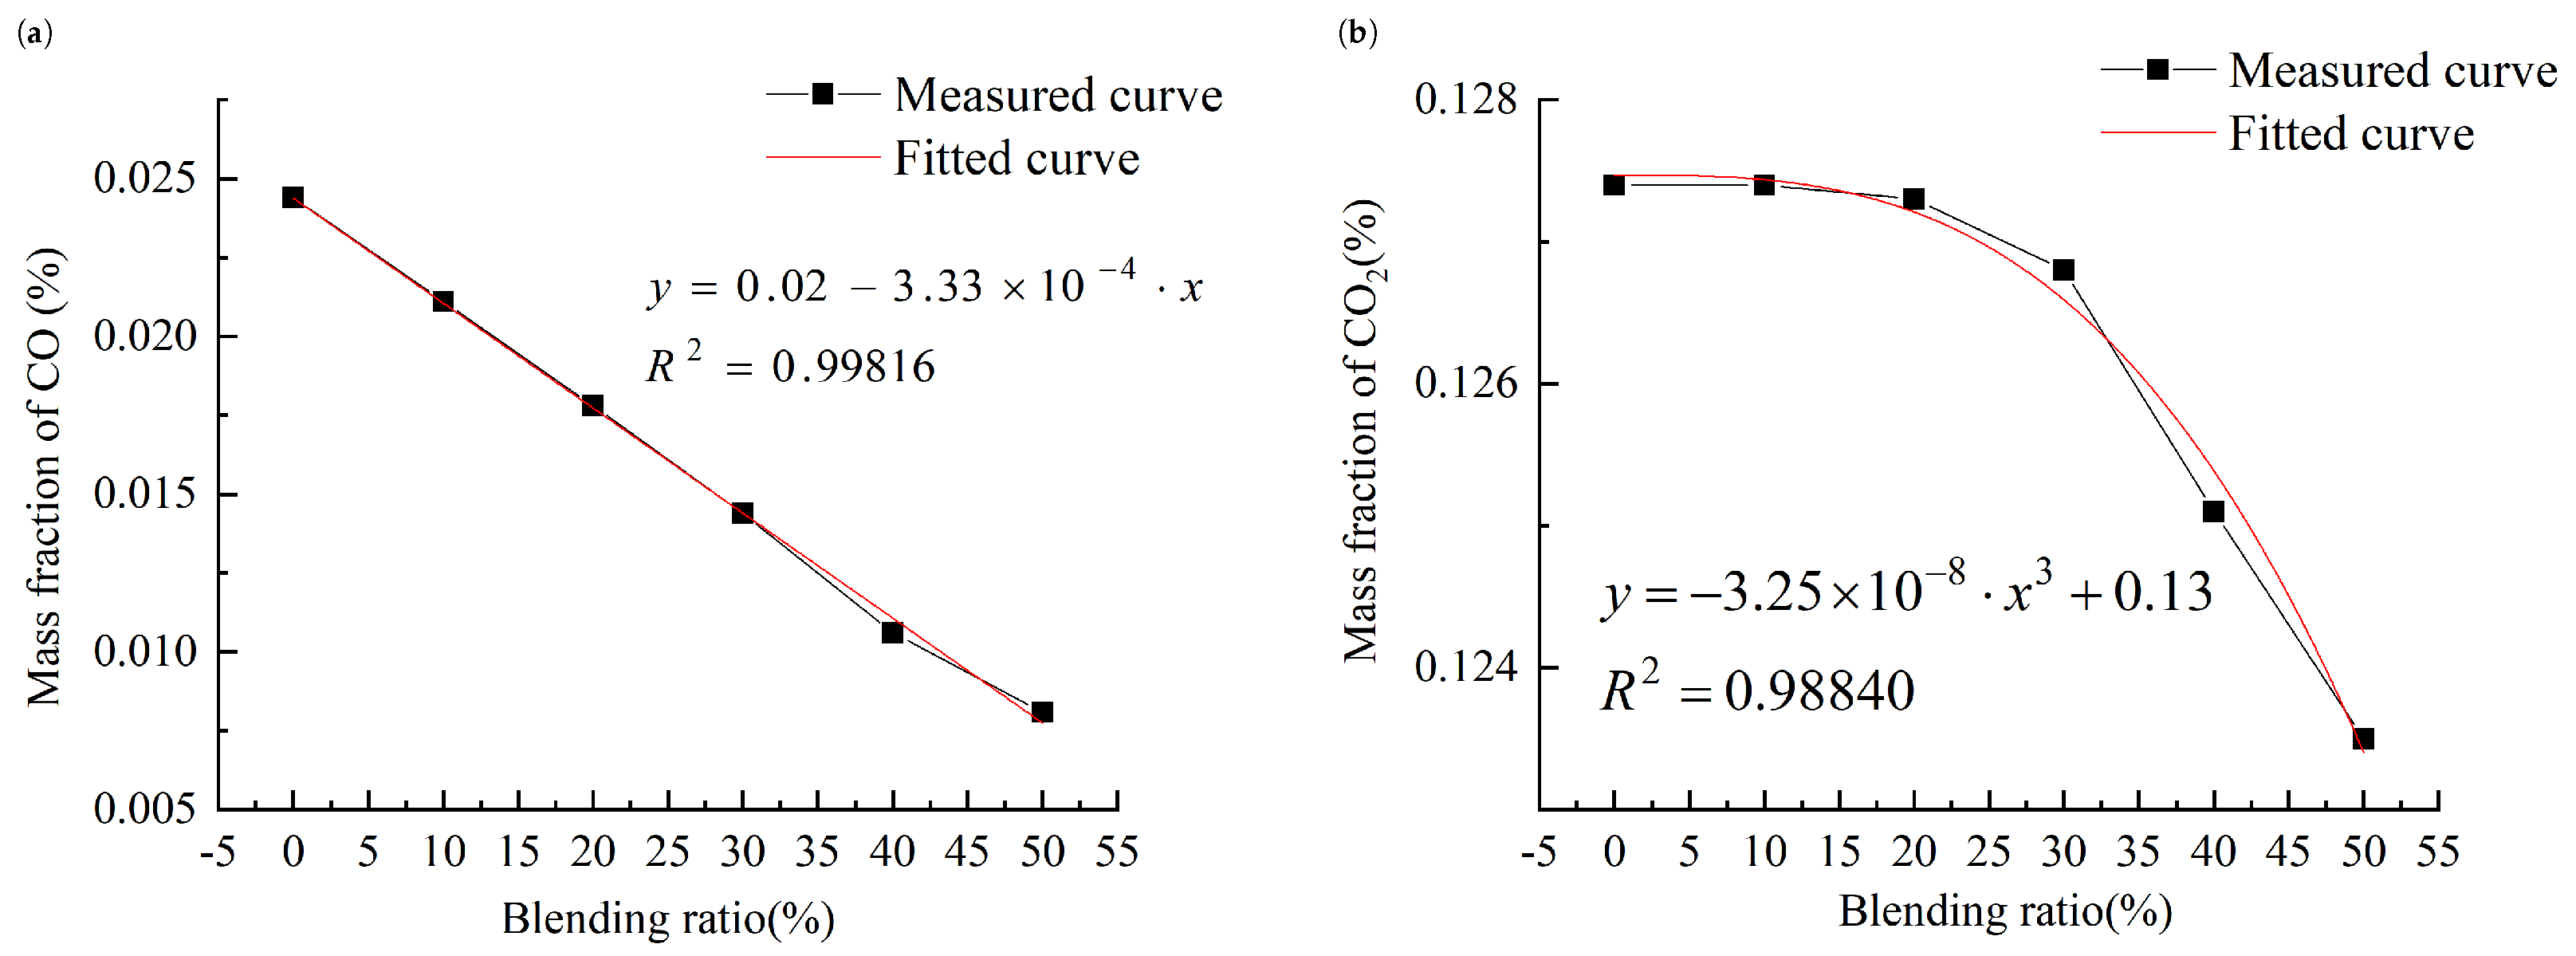
The emission of CO decreases linearly (Figure 7a) with the increasing blending ratio of 0%, 10%, 20%, 30%, 40% and 50% of bio-ethanol mixed with Jet-fuel. The blending ratio of 30% represents the critical point for the variation of CO2 emission. When the blending ratio is below 30%, the CO2 emission is minimally affected. However, when the blending ratio exceeds 30%, the CO2 emission gradually decreases and follows a power function relationship. This is because bio-fuels have a lower carbon content and higher oxygen content, effectively reducing the emissions of CO and CO2. Therefore, as the blending ratio increases, the emissions of CO and CO2 gradually decrease. The curve fitting reveals that the curve fit for CO emissions is higher than the curve fit for CO2 emissions.

3.3. Analysis of Effects of Combustion Conditions and Biofuel Blending Ratio on NO Emissions

NOx produced during the combustion of Jet-fuel is mainly NO, which is the primary factor in ozone layer depletion and a significant contributor to photochemical smog. The physical and chemical processes involved in NO formation are complex. It includes fuel atomization, multi-component fuel evaporation, turbulent mixing, convection and radiation heat transfer, as well as intricate chemical reaction mechanisms. Considering the actual combustion conditions, under high temperature conditions, the T-NO (thermal-NO) mechanism is the most significant pathway for the generation of NO. The main way to produce NO at high temperature is to oxidize nitrogen in the combustion air to produce NO at high temperature.
N 2 + O NO + N
N + O 2 NO + O
N + OH NO + H

3.3.1. Analysis of the Influence of Combustion Chamber Pressure

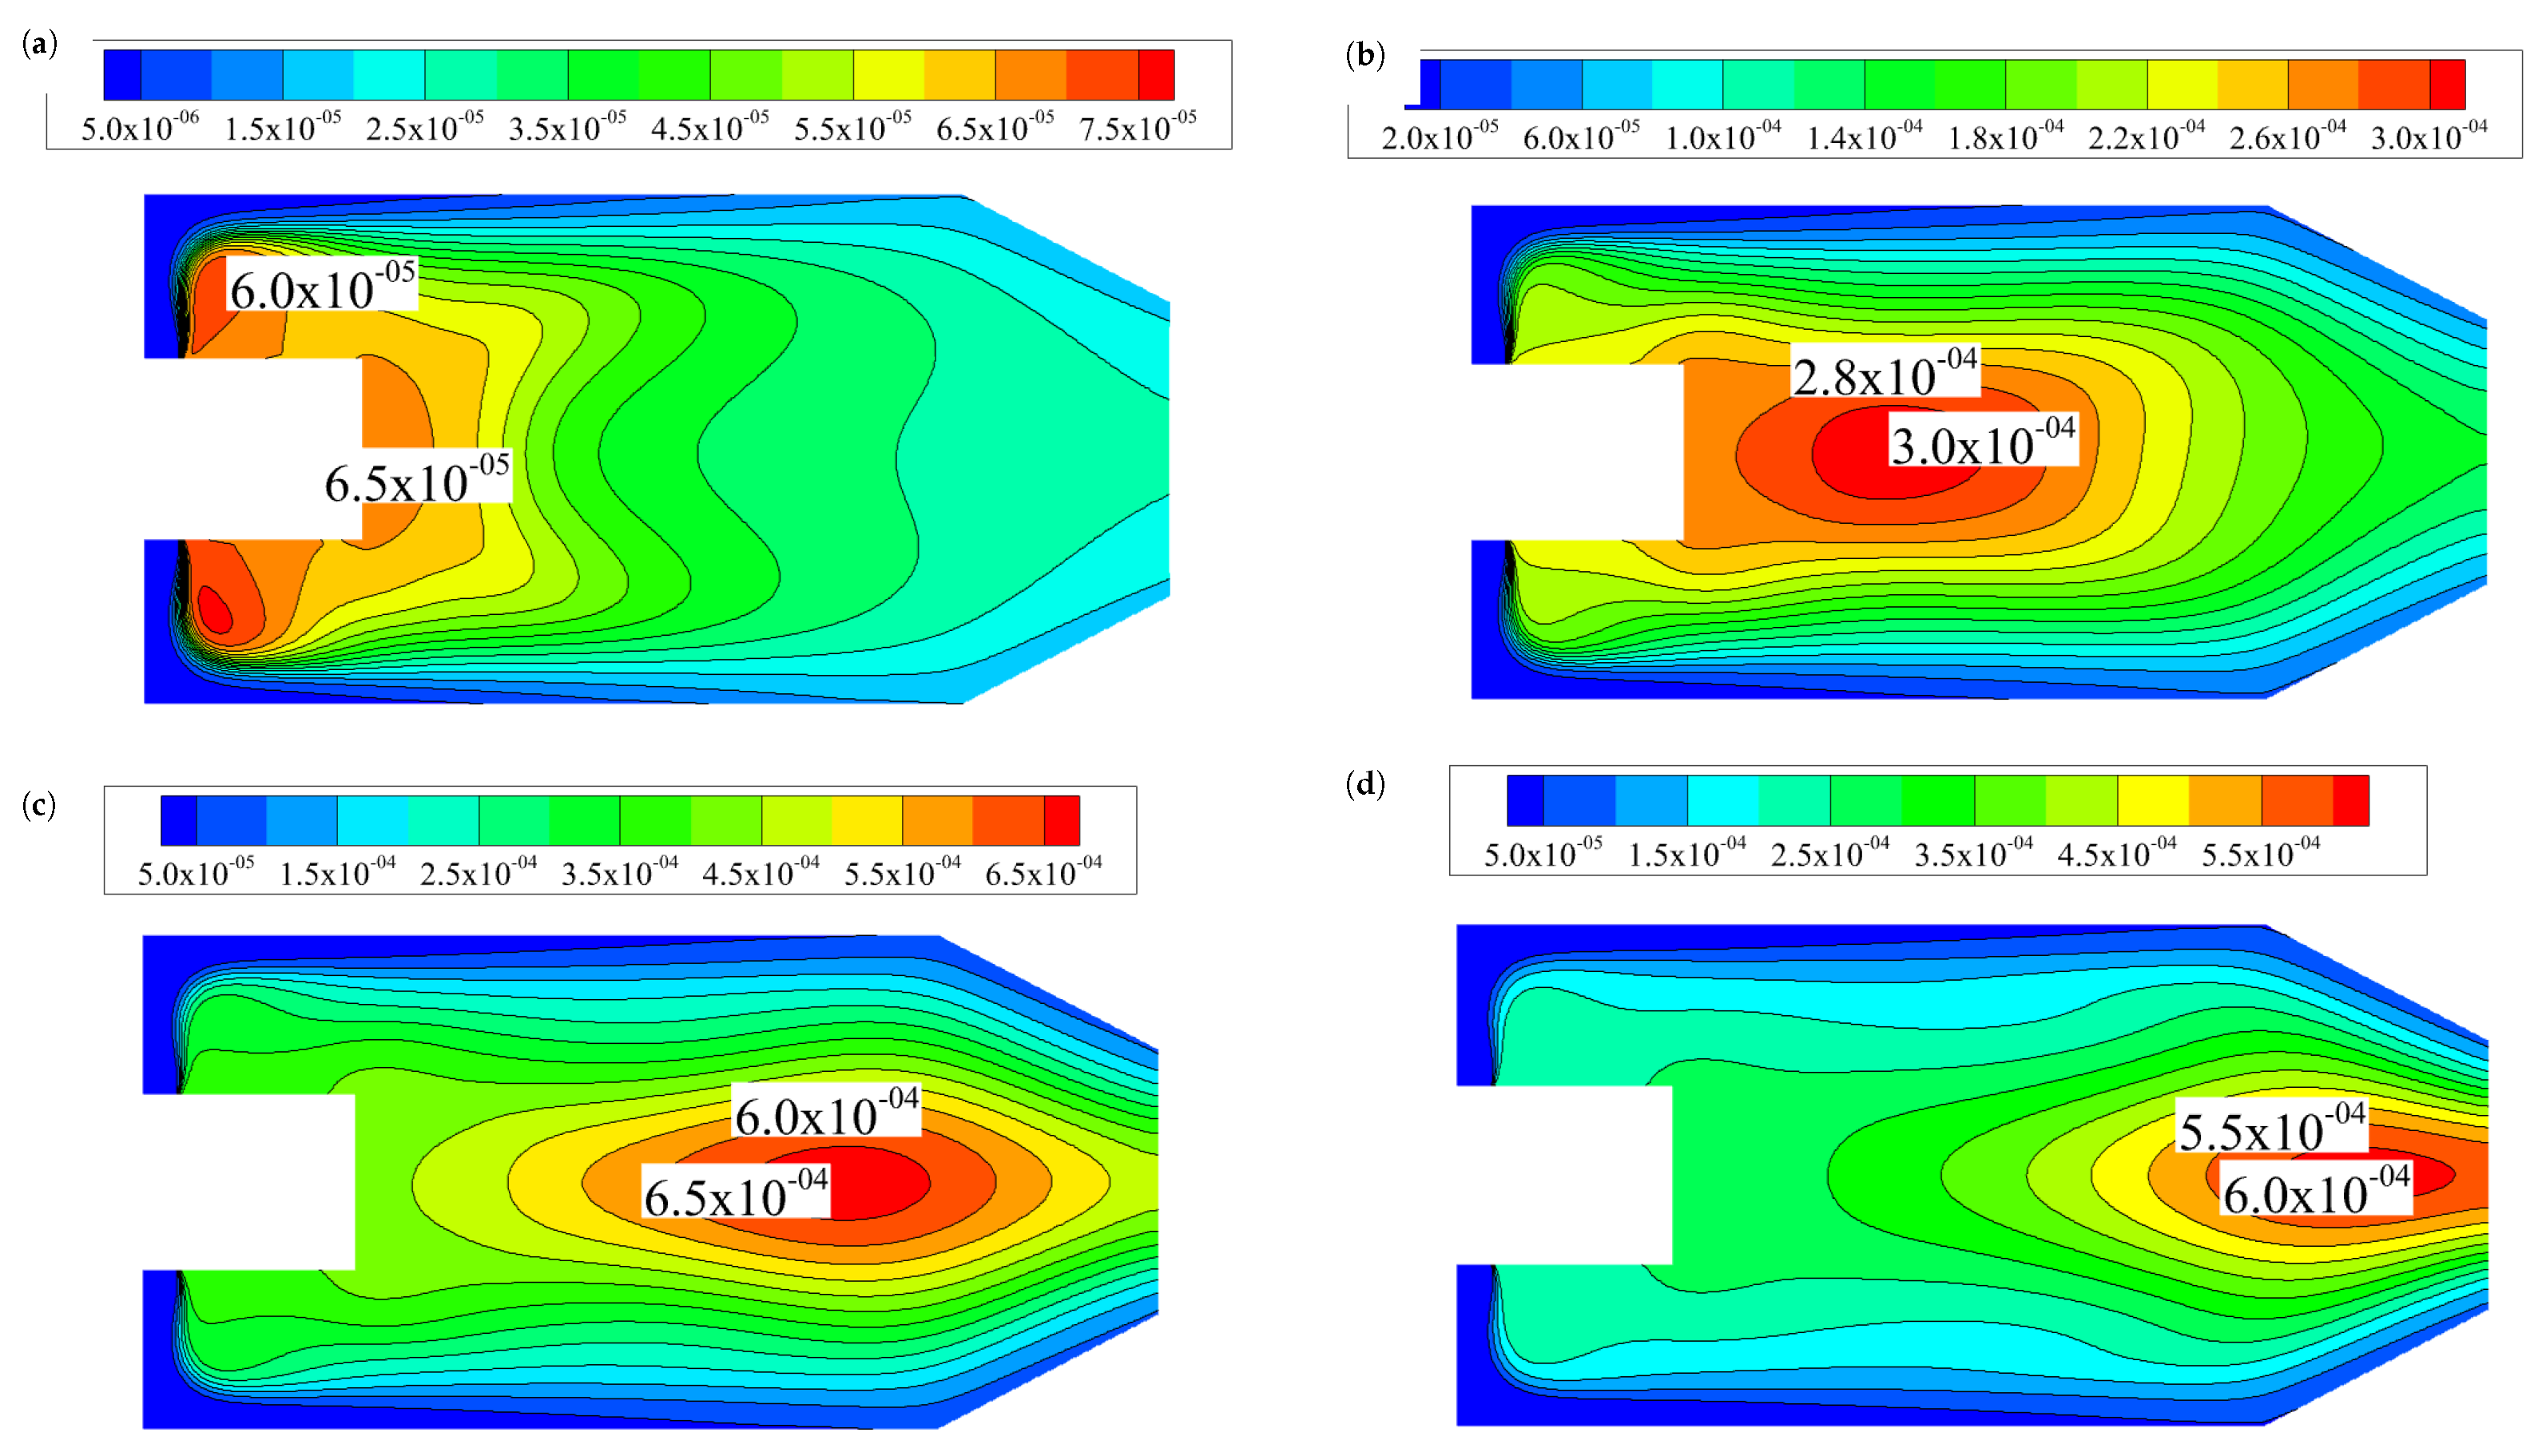
In the combustion process of the combustion chamber, nitrogen oxide mainly exists in the form of NO, which is easily oxidized to NO2 in the atmosphere. Figure 8 shows NO emission under different combustion chamber pressures, and Figure 9 shows the relationship between NO emission and working pressure of combustion chamber.
As shown in Figure 8 the distribution of NOx in the combustion chamber moves gradually from the front end to the back end of the combustion chamber as the operating pressure of the combustion chamber increases. From Figure 9, it can be observed that as the pressure increases, the amount of NO generated is in a power function relationship with the combustion chamber pressure. With the change of pressure, the average combustion temperature in aero engine changes. The high temperature environment is a favorable condition for the formation of NO, and plays a dominant role in the process of affecting the formation of NO [19]. As the pressure increases, the combustion efficiency and temperature also increase. Additionally, with higher pressure, the residence time increases at the same flow rate, providing more time for combustion reactions, resulting in increased NO emissions. Therefore, it is possible to reduce NO generation and emissions by lowering the combustion temperature in the combustion zone or reducing the residence time in the high-temperature region. The curve fitting has a good fit with a coefficient of determination of 0.99536.

3.3.2. Analysis of the Influence of Air Inlet Temperature

In the study of aircraft engine emissions characteristics, the generation of NO is also influenced by the inlet air temperature, as shown in Figure 10. As the inlet air temperature increases, the generation of NO increases with the inlet air temperature in a quadratic function relationship. This is because when the inlet air temperature rises, the temperature inside the combustion chamber also increases. The NO emission model is mainly thermal, and is greatly affected by temperature. At the same time, the oxygen concentration in the same volume also increases. The increase in high temperature and oxygen concentration promotes the reaction between oxygen and nitrogen, gradually increasing the generation of NO. The degree of fit between the fitted curve and the measured values is very small, and the fitting degree can reach 0.99726.

3.3.3. Analysis of the Impact of Bio-Fuel Blending Ratio

With the change of bio-fuel blending ratio, the spray quality of fuel will also change, thus affecting the generation and emission of NO. This paper also simulated the change of NO generation and average temperature in the combustion chamber under different blending ratio, and the results are shown in Figure 11.
As the blending ratio increases, the generation of NO increases exponentially. The emission rate of NO gradually increased with increasing the blending ratio, while the fitting curve showed a good fit to the measured values with a degree of fit of 0.99993. On the one hand, due to the increase of bioethanol mixing ratio, the atomizing quality of the nozzle becomes worse, and the Sott mean diameter (SMD) of atomized particles increases [19]. This incomplete fuel combustion leads to an increase in NO generation. Additionally, poorer atomization quality leads to a more uneven distribution of fuel in the combustion chamber. At the same time, local fuel concentration leads to the appearance of local high temperature zones, and thus higher emissions [20]. On the other hand, this nitrogen oxide belongs to thermally formed nitrogen oxides. It is generally determined by the combustion temperature, oxygen concentration and high temperature duration in the combustion chamber. The higher the temperature, the higher the oxygen concentration and the longer the duration, the higher the NO generation will be promoted. At higher temperatures, nitrogen converts to nitrogen oxides. With an increasing blending ratio, the temperature inside the combustion chamber increases linearly, which explains the higher NO mass fraction with a higher blending ratio. In the study of aero engine emission characteristics, it is necessary to comprehensively analyze the relationship between air inlet temperature and NO production, and determine the best operating temperature range to reduce NO emission.

3.4. Analysis of the Effects of Air Inlet Temperature and Biofuel Blending Ratio on Soot

The combustion chamber is divided into the main combustion zone, intermediate zone, and dilution zone. The main combustion zone is where carbon particles are formed, specifically the area near the fuel nozzle. The oil mist from the head has not yet mixed well with the air of the cyclone, and the high-temperature gas is carried by the swirl in the return area to the nozzle, forming a smoke pocket. This area has high temperature, rich fuel, and low oxygen, resulting in the generation of a large amount of carbon particles. Carbon smoke is not only one of the main harmful components of fuel particulate gas emissions, but also seriously threatens the ecological environment and endangers human health. At the same time, they can be directly adsorbed on the surface of the aircraft engine body. This will damage the fuel exhaust treatment system, shorten the service life of the equipment and seriously reduce the overall fuel utilization efficiency [21]. Therefore, it is necessary to study the emission characteristics of carbon particles. This is helpful to reduce their generation and the harm caused by their emissions in the combustion chamber. During the combustion process, fuel molecules first undergo cracking to form C2H2 and C3H3, which then undergo addition and cyclization to form MAHs (multi-aromatic hydrocarbons). These substances react with C2H2 through dehydrogenation to produce PAHs (polycyclic aromatic hydrocarbons). Subsequently, nucleation, condensation, and collision processes occur to generate carbon soot.

3.4.1. Analysis of the Influence of Air Inlet Temperature

The increase in inlet air temperature affects the gas flow and combustion process inside the combustion chamber, thereby influencing the generation and emission of carbon particles. As the inlet air temperature increases, the emission of carbon soot from the combustion chamber increases exponentially. The fitted curve has a small error compared to the measured values, with a fitting degree of 0.97402. Carbon soot is mainly generated at high temperatures. Under high temperature conditions, the carbon atoms generated from fuel cracking are more prone to aggregate and form carbon soot particles, which are then emitted from the combustion chamber, causing pollution to the atmospheric environment, as shown in Figure 12.

3.4.2. Analysis of the Effect of Bio-Fuel Blending Ratio

Figure 13 shows the distribution of carbon soot in the combustion chamber under different blends of bio-ethanol. The generation of carbon soot is mainly concentrated at the head of the combustion chamber, and the maximum generation of carbon soot inside the combustion chamber gradually decreases with the increase of the blending ratio of biofuels. As shown in Figure 14, it can be observed that the generation of carbon soot gradually decreases with the increasing blending ratio of bio-fuels. Through curve fitting, it is found that the generation of carbon soot has a power function relationship with the blending ratio of biofuels, with a fitting degree of 0.93079. This is because the aromatic hydrocarbon content in the fuel composition plays a significant role in carbon particle emissions. And the additives, hydrogen-carbon ratio, and volume fraction of aromatic hydrocarbons in the fuel have a significant impact on carbon particle emissions [22]. Controlling the content of aromatic hydrocarbons is important for reducing particle emissions generated during combustion. Another reason for the significant reduction in carbon particle emissions is that bio-ethanol itself has a high oxygen content and low viscosity. The higher oxygen content in the fuel effectively alleviates molecular oxygen deficiency cracking and the formation of carbon particles. The lower viscosity facilitates fuel injection atomization and evaporation, resulting in better fuel-air mixing [23], thereby reducing the generation of carbon particles.

4. Conclusions

  • As the working pressure of the combustion chamber increases, the distribution of NO in the combustion chamber is gradually shifted backwards, the emissions of NO are in an exponential relationship with the working pressure, with the growth rate gradually increasing. When the operating pressure of the combustion chamber is greater than 0.5 MPa, the emission of CO increases rapidly. The CO2 emissions increase exponentially with the combustion chamber operating pressure, and the growth rate decreases when the combustion chamber operating pressure is greater than 0.7 MPa.
  • As the inlet air temperature increases, the emission of CO gradually increases when the inlet air temperature is above 550 K. When the inlet air temperature is above 450 K, the growth rate of CO2 emission decreases. The generation of NO increases rapidly with the increase of inlet air temperature. However, when the temperature reaches 550 K, the emission rate of NO starts to decrease. At this point, the emission of carbon soot at the outlet approaches zero. When the inlet air temperature exceeds 550 K, the emission of carbon soot increases rapidly.
  • When the blending ratio of bio-fuel exceeds 30%, the emissions of CO2 gradually decrease with the increase in the blending ratio. And when the mixing ratio is below 30%, it is largely unaffected by the mixing ratio. With the increase in the blending ratio of bio-fuel, the emissions of CO and carbon particles show a decreasing trend. At the same time, the emissions of NO follow an exponential function with the blending ratio.
Currently, ASTM D7566 stipulates an upper limit of 50% blending ratio between aviation alternative fuels and fossil fuels. However, there are few studies at home and abroad on the full applicability of high blending ratios or even 100% aviation biofuels, so it is necessary to further study the emission performance of biofuels with high blending ratios that have better emission reduction benefits.

Author Contributions

Conceptualization, W.S., H.Z. and J.M.; Methodology and Software, Q.D., Y.C. and F.Z.; Software, Validation, Y.C.; Formal analysis, Q.D. and F.Z.; Writing—original draft, F.Z., C.X. and H.L.; Supervision, Y.C. All authors have read and agreed to the published version of the manuscript.

Funding

The research work was supported by COMAC Aircraft Innovation Valley Innovation Project (Research on the Applicability of High Blending Ratio Aviation Biofuels).

Data Availability Statement

Not applicable.

Conflicts of Interest

The authors declare no conflict of interest.

References

  1. Turgut, E.T.; Cavcar, M.; Usanmaz, O.; Yay, O.D.; Dogeroglu, T.; Armutlu, K. Investigating actual landing and takeoff operations for time-in-mode, fuel and emissions parameters on domestic routes in Turkey. Transp. Res. Part D Transp. Environ. 2017, 53, 249–262. [Google Scholar] [CrossRef]
  2. Parthasarathy, R.N.; Gollahalli, S.; Attaphong, C. Combustion Properties of Jet A/Ethanol Blends in a Porous Media Burner. In Proceedings of the 11th International Energy Conversion Engineering Conference, San Jose, CA, USA, 14–17 July 2013; p. 3677. [Google Scholar]
  3. Wang, X.; He, Y.; Zhou, T.; Chen, Q.; Ding, C.; Wang, J. Experimental study on fire behaviors of kerosene/additive blends. Fire Technol. 2018, 54, 1841–1869. [Google Scholar]
  4. Muelas, Á.; Remacha, P.; Ballester, J. Combustion characteristics of isolated free-falling droplets of Jet A blended with ethanol and butanol. In Proceedings of the Turbo Expo: Power for Land, Sea, and Air, Oslo, Norway, 11–15 June 2018; American Society of Mechanical Engineers: New York, NY, USA, 2018; Volume 51067, p. V04BT04A038. [Google Scholar]
  5. Zheng, L.; Ling, C.; Ubogu, E.A.; Cronly, J.; Ahmed, I.; Zhang, Y.; Khandelwal, B. Effects of alternative fuel properties on particulate matter produced in a gas turbine combustor. Energy Fuels 2018, 32, 9883–9897. [Google Scholar] [CrossRef]
  6. Lefebvre, A.H. Fuel effects on gas turbine combustion-liner temperature, pattern factor, and pollutant emissions. J. Aircr. 1984, 21, 887–898. [Google Scholar] [CrossRef]
  7. Jiang, C. Combustion Process Simulation and Analysis of BED Multi-Component Fuel. Master’s Thesis, Kunming University of Science and Technology, Kunming, China, 2014. [Google Scholar]
  8. Fantozzi, F.; Laranci, P.; Bianchi, M.; De Pascale, A.; Pinelli, M.; Cadorin, M. CFD simulation of a microturbine annular combustion chamber fuelled with methane and biomass pyrolysis syngas: Preliminary results. In Proceedings of the Turbo Expo: Power for Land, Sea, and Air, Orlando, FL, USA, 8–12 June 2009; Volume 48838, pp. 811–822. [Google Scholar]
  9. Franco, A.; Giannini, N. Perspectives for the use of biomass as fuel in combined cycle power plants. Int. J. Therm. Sci. 2005, 44, 163–177. [Google Scholar]
  10. Edwards, T. “Kerosene” Fuels for Aerospace Propulsion-Composition and Properties. In Proceedings of the 38th AIAA/ASME/SAE/ASEE Joint Propulsion Conference & Exhibit, Indianapolis, IN, USA, 7–10 July 2002; p. 3874. [Google Scholar]
  11. Wang, T.S. Thermophysics characterization of kerosene combustion. J. Thermophys. Heat Transf. 2001, 15, 140–147. [Google Scholar] [CrossRef]
  12. Xiao, B.G. Detailed and simplified chemical kinetic models for the combustion of RP-3 aviation kerosene. J. Aerosp. Power 2010, 34, 1948–1955. (In Chinese) [Google Scholar]
  13. Li, D.P. Research on the Working Process of the Combustion Chamber of Kerosene Dual-Mode Ramjet Engine. Ph.D. Thesis, National University of Defense Technology, Changsha, China, 2006. (In Chinese). [Google Scholar]
  14. Huang, S.H.; Xu, S.L.; Liu, X.Y. Numerical study of two-phase flow field in kerosene ramjet engine with afterburning (III) Multi-step chemical reaction characteristics of kerosene in afterburning flow field. J. Propuls. Technol. 2005, 26, 101–105. (In Chinese) [Google Scholar]
  15. Zhang, Y.H. Analysis of the Combustion Characteristics of Biofuels in the DGEN380 Engine. Ph.D. Thesis, Civil Aviation University of China, Tianjin, China, 2019. (In Chinese). [Google Scholar]
  16. Li, M.; Wang, Q.; Zhao, Y.; Dai, X.; Shang, W. Combustion and emission characteristics of a novel staged combustor for aero gas turbine engine. Aerosp. Sci. Technol. 2023, 134, 108169. [Google Scholar] [CrossRef]
  17. Shen, Y.G.; Nie, K.; Xu, J.S. Combustion and emission characteristics of aviation piston engines under different altitudes. J. Propuls. Technol. 2022, 43, 248–256. (In Chinese) [Google Scholar]
  18. Chen, X.X. Reaction Kinetics Research on the Combustion and Emissions Formation of Aviation Engines. Ph.D Thesis, Shenyang Aerospace University, Shenyang, China, 2013. (In Chinese). [Google Scholar]
  19. Wang, S.Y. Study on the Combustion Characteristics of Biofuels in a Certain Type of Engine. Ph.D. Thesis, Civil Aviation University of China, Tianjin, China, 2018. (In Chinese). [Google Scholar]
  20. He, P.; Deng, X.Y.; E, Y.J. Research on NOx emission test and prediction method of low emission combustion chamber. J. Propuls. Technol. 2019, 40, 2762–2770. (In Chinese) [Google Scholar]
  21. Zhao, J.X. Pollution emissions of civil engines and development trends of low pollution combustion technology. J. Aerosp. Power 2008, 23, 986–996. (In Chinese) [Google Scholar]
  22. Zheng, L.K.; Zhu, Y.C.; Zhou, Y.B. The influence of the type and content of aromatics on the emissions of aviation engine combustion. J. Aerosp. Power 2021, 36, 1244–1252. (In Chinese) [Google Scholar]
  23. Li, J.; Zhu, H.; Meng, N. Research on the emission characteristics of biodiesel-ethanol and biodiesel-methanol mixed fuels. Small Intern. Combust. Engine Veh. Technol. 2022, 51, 51–54. (In Chinese) [Google Scholar]
Figure 1. Diagram of spray source setting: 1. air inlet; 2. fuel inlet; 3. wall; 4. outlet.
Energies 16 07060 g001
Figure 2. Grid-independence verification: (a) Outlet CO2 mass fraction. (b) Average outlet temperature.
Energies 16 07060 g002
Figure 3. Temperature and mass fraction distribution of CO and CO2 in the combustion chamber: (a) Temperature distribution map (K). (b) CO distribution map (%). (c) CO2 distribution map (%).
Energies 16 07060 g003
Figure 4. Variation of NO emission with the working pressure of combustion chamber.
Energies 16 07060 g004
Figure 5. Variation of CO and CO2 emissions with the working pressure of combustion chamber: (a) CO2 variation graph. (b) CO variation graph.
Energies 16 07060 g005
Figure 6. CO and CO2 emission curves with air inlet temperature: (a) CO2 variation graph. (b) CO variation graph.
Energies 16 07060 g006
Figure 7. Variation curve of CO and CO2 emissions with blending ratio: (a) Graph of the change of CO. (b) Graph of the variation of CO2.
Energies 16 07060 g007
Figure 8. Mass fraction distribution of NO with the working pressure of combustion chamber/%: (a) 0.3 MPa. (b) 0.5 MPa. (c) 0.7 MPa. (d) 1 MPa.
Energies 16 07060 g008
Figure 9. Variation of NO emission with the working pressure of combustion chamber.
Energies 16 07060 g009
Figure 10. Variation of NO emissions with air inlet temperature.
Energies 16 07060 g010
Figure 11. Variation of NO emission and average combustion chamber temperature with blending ratio: (a) Graph of the variation of NO. (b) Graph of the variation of the average.
Energies 16 07060 g011
Figure 12. Carbon soot emissions as a function of air inlet temperature.
Energies 16 07060 g012
Figure 13. Mass fraction distribution of carbon fume with blending ratio (%): (a) B0. (b) B10. (c) B20. (d) B30. (e) B40. (f) B50.
Energies 16 07060 g013
Figure 14. Variation of carbon soot emissions with blending ratio.
Energies 16 07060 g014
Disclaimer/Publisher’s Note: The statements, opinions and data contained in all publications are solely those of the individual author(s) and contributor(s) and not of MDPI and/or the editor(s). MDPI and/or the editor(s) disclaim responsibility for any injury to people or property resulting from any ideas, methods, instructions or products referred to in the content.