Abstract
In the present study, an iodide/triiodide (I−/I3−) redox couple is used in hybrid electrochromic devices (ECDs), and the effects of the applied bias potential and bias time on device performance are studied. An applied bias potential of ~1 V is sufficient to achieve an initial contrast ratio of 8:1 in less than 5 min. Increasing both the bias potential and bias time results in an enhancement in loss reactions at the WO3/electrolyte interface, rather than improving optical performance. Moreover, long-term performance depends on the testing procedure (regularly cycling or after storage), while the formation of iodine (I2) decreases the initial transparency of the ECDs and affects their overall performance. However, its formation cannot be avoided, even without cycling the ECDs, and the restoration of the optical performance can take place only when the electrolyte is replaced with a fresh one. Finally, a new methodology is applied for calculating the loss current, and a suggestion is made to avoid a common mistake in calculating the coloration efficiency of these hybrid ECDs.
1. Introduction
Electrochromic (EC) smart windows are energy-saving devices that can change their optical properties with the application of an external bias potential. In this regard, they offer the dynamic control of light and heat passing through them. Their performance depends on a variety of parameters, ranging from material aspects to installation conditions, such as climate zones, control strategies, and the orientation of the building [1,2,3,4,5]. Thus, it has been estimated that their use can lead to a large building energy-saving value of up to ~170 kWh m−2 per year, while the energy needed for their operation is only 0.08 kWh m−2 per year [6,7]. Further advantages include occupant visual comfort, reduced glare, providing an uninterrupted view of the external environment, and a constant connection with nature, which is not always possible using other competing technologies, like building-integrated photovoltaics (BIPVs). Moreover, the use of EC smart windows can lead to higher productivity in the workplace and better job satisfaction, as stated by SAGE Electrochromics [8].
Of the different types of electrochromic devices (ECDs) that have been proposed [9], the hybrid type consists of two transparent conductive electrodes (e.g., fluorine-doped tin oxide (FTO)-coated glass or indium tin oxide (ITO)-coated glass), on which usually a WO3 EC layer and a highly transparent catalytic platinum film are deposited, respectively. Between them, a liquid or a solid redox electrolyte is introduced. Such an ECD with an iodide/triiodide (I−/I3−) redox couple in the electrolyte was first proposed by Georg et al. [10]. During coloration, the following Reactions (1) and (2) take place at the anode and at the cathode, respectively, and their direction is reversed during bleaching:
As a result, electrons injected into the WO3 film from the external circuit at the anode during coloration are balanced by electrons transferred from the cathode to the external circuit and provided via the oxidation of iodide ions to triiodide. Therefore, the role of a redox couple is to counterbalance a redox reaction at the EC layer (anode) during the coloration or bleaching of the ECD (Reaction 1), offering practically an unlimited charge capacity and diminishing the need for the deposition of an ion storage layer at the cathode [11]. Thus, the device fabrication process is simplified, coloration proceeds at a lower bias potential [12,13], and bleaching can proceed even under a short circuit, without the need to apply an opposite bias potential. Moreover, the catalytic layer minimizes the charge transfer resistance at the cathode, facilitating Reaction 2, even though its high transparency is crucial for achieving a highly transparent initial state of the ECD.
However, these “hybrid” or “redox” ECDs have the disadvantage of a permanent internal short circuit due to the direct contact of the EC layer with the redox electrolyte, leading to a so-called “loss current” (Iloss), restricting their optical performance. For example, when the I−/I3− redox couple is used, the “loss current” is due to Reaction 3, which is the reduction of I3− ions at the anode:
In other words, electrons that arrive at the anode during the coloration procedure can cause optical modulation (Reaction 1) or reduce the triiodide ions in the electrolyte (Reaction 3) at the EC layer/electrolyte interface, even though it is expected that this a slow process in the case where WO3 is used as the EC layer [10,14]. A high value of “loss current” increases the amount of energy consumed for the optical modulation of the ECD, restricts the coloration depth, and increases the coloration time, while the open circuit memory is also diminished. According to [14], an acceptable value of Iloss should be below 10 μA/cm2. Therefore, the total current passing through the ECD during coloration (Itotal) can be analyzed as the sum of the coloration current (Icol, Reaction 1) and the “loss current” (Iloss, Reaction 3). Of course, if the electrolyte is in direct contact with the FTO conductive substrate, for example, in the case of a porous EC layer, then the reduction of I3− ions can also take place at the FTO/electrolyte interface, leading to an extra loss mechanism (Iloss,FTO), which also contributes to the value of Itotal. As a result, Itotal can be expressed using Equation (1):
Another crucial parameter that affects their performance is the relative position of the electrochemical potential of the as-prepared WO3 layer and that of the redox electrolyte, which determines the direction of charge transfer at the WO3/electrolyte interface. If the electrochemical potential (vs NHE) of the as-prepared WO3 layer is higher (more positive) than that of the redox electrolyte, then electrons will move to the WO3 layer, inducing coloration without the need for a bias potential. This phenomenon is called “self-coloration”. However, during coloration, the electrochemical potential of LixWO3 moves below that of the redox electrolyte (more negative) [15]. Consequently, due to the interfacial loss reactions (Reaction 3), self-bleaching occurs. The higher the difference between the electrochemical potentials, the more intense the above mechanism is. Furthermore, coloration depth depends on the bias potential with respect to the redox potential of the electrolyte, where in general a higher redox potential (more positive) demands a higher value of cathodic potential for the coloration of the device but on the other hand improves charge storage. For that reason, in [16], the bias potential for coloration of the ECDs was chosen with respect to the redox potential of the different redox electrolytes used.
Moreover, the value of the charge transfer resistance at both electrodes is of great importance. A high charge transfer resistance at the EC layer/electrolyte interface and a low one at the Pt/electrolyte interface are desirable. For example, a high value of the charge transfer resistance at the platinized counter electrode may impede both coloration (depth, time) and bleaching [11,13,16], whereas a low one at the EC layer/electrolyte interface will lead to a high “loss current”, enhancing self-bleaching, and high power consumption [16]. Finally, absorption in the blue region from the redox couple, especially in the case of an I−/I3− one, leads to a yellowish tint of the devices in the bleached state.
Therefore, efforts have been made to optimize the performance of these hybrid devices, focusing on decreasing the loss reactions at the WO3/electrolyte interface and on the catalytic properties of the counter electrode. Apart from the I−/I3− redox couple, a variety of other redox couples have been used (Table S1), such as ferrocene/ferrocenium (Fc0/+) [9,12], potassium hexacyanoferrate(II)/(III) (KHCF(II)/(III)) [9], tetrathiafulvalene (TTF) [17], tetramethylthiourea/tetramethylformaminium disulfide (TMTU/TMFDS2+) [9,13,14,18,19], and recently thiolate/disulfide (T−/T2) [11], dissolved in a liquid or a solid electrolyte. For example, a thiolate/disulfide (T−/T2) redox couple was used in [11], showing a slow self-bleaching process, while a solid redox (TMTU/[TMFDS]2+) electrolyte was developed in [18], exhibiting suppressed loss reactions at the WO3/electrolyte interface. In [12], a correlation between device performance and Fc concentration in the electrolyte was found; above a certain Fc concentration, the self-bleaching process was enhanced. An optimized concentration in the case of a TTF redox couple, where the ECDs exhibited not only an improved optical performance, but also a reversible behavior, was reported in [17], while the effect of the I−/I3− ratio was examined in [20]. Moreover, a few barrier layers have been deposited at the WO3/electrolyte interface [14,21], whereas in [13] and in [22], a counter electrode based on a cobalt sulfide film and on an iridium oxide film, respectively, was examined in conjunction with a TMTU/TMFDS2+ redox couple instead of a platinized electrode.
However, there is a lack of systematic studies regarding the performance of these hybrid ECDs under prolonged testing under real operating conditions. Furthermore, their stability has been examined so far only by performing continuous coloration–bleaching cycles. For example, in [12], a ~20% contrast attenuation was observed after cycling an ECD having an Fc0/+ redox couple for 10 h, while in [13], more than 100,000 cycles were performed with less than 5% contrast attenuation for an ECD with a TMTU/TMFDS2+ redox couple and a CoS counter electrode. Moreover, in [23], 11,000 cycles were performed, and transformation of species in the electrolyte was observed, whereas in [11], the change in the optical properties of an I−/I3− redox electrolyte was reported after 50 consecutive cyclic voltammetry scans.
In this work, we have fabricated hybrid ECDs having an I-/I3- redox couple and tested them regularly or after storage for a total period of more than one year. Thus, useful conclusions were found about the stability of the redox electrolyte, regarding its optical and electrochemical properties, while its substitution with a fresh electrolyte led to the restoration of the device’s performance. Moreover, emphasis was given to examining how the loss reactions at the EC layer/electrolyte interface evolve with time, where the knowledge so far is limited.
2. Experimental Section
2.1. Fabrication of Hybrid Electrochromic Devices
Amorphous tungsten oxide films (WO3) with high optical transparency in the visible range were prepared by electron beam gun (e-gun) evaporation. Initially, high-purity WO3 powder (99.99%) and FTO glass substrates (15 Ohm/sq) were appropriately placed inside a vacuum chamber. Then, evaporation took place at about 10−5 mbar and at room temperature. In addition, the deposited film thickness (600–700 nm) was controlled using a quartz thickness controller [24]. The crystal structure, morphology, and stoichiometry of the as-prepared WO3 films were examined previously in [25] and in [26].
Platinum films were electrodeposited using an aqueous H2PtCl6 solution (0.002 M) and an Autolab PGSTAT 204 potentiostat. During a typical three-electrode electrodeposition procedure, a constant potential of −400 mV relative to an Ag/AgCl reference electrode was applied for 60 s. Deposition took place on the conductive side of an FTO glass substrate (15 Ohm/sq), while a Pt wire served as the counter electrode [27]. As a result, nearly spherical Pt nanoparticles, covering a fraction of the FTO glass substrate, were deposited, as shown in our previous work [27].
For assembling the ECD, the two electrodes (i.e., WO3/FTO and Pt/FTO) were arranged facing each other, slightly displaced to preserve space for electrical contacts. The devices were sealed peripherally using a low-temperature thermoplastic sealant (Surlyn, 50 μm) at 120 °C for 10 min under pressure, which acted also as a spacer. Then, the space between the two electrodes was filled with a liquid redox electrolyte composed of 0.5 M lithium iodide (LiI) and 0.005 M iodine (I2) in acetonitrile (ACN). More specifically, the electrolyte was inserted from one of the two small holes pre-drilled in the counter electrode. The other hole served for air leaking during filling with the electrolyte. Finally, the holes were sealed using Surlyn (supplied by Greatcell Solar Materials, Queanbeyan, Australia) and small pieces of glass.
2.2. Characterization of Redox Electrochromic Devices
The coloration of the ECDs was performed using an electrical circuit comprising mini silicon solar cells (BPW34) as the power source, an LED lamp for illumination, a 0.5 kOhm resistor, and of course the ECD, all connected in series. To achieve the desired applied bias potential (VPV), up to 4 mini silicon solar cells were connected in series, and the current passing through the ECD during coloration was calculated from the potential difference across the 0.5 kOhm resistor.
Similarly, bleaching of the ECDs was performed by connecting their terminals with a 1 kOhm resistor, where again the resulting bleaching current was calculated from the potential difference across the 1 kOhm resistor. All the electrical signs were recorded using a datalogger, connected to a PC.
The typical testing procedure comprised 3 steps, as described in Table 1, except otherwise mentioned. At the end of each step, the transmittance spectrum was recorded.

Table 1.
Steps of a typical coloration–bleaching cycle.
In general, the transmittance T(λ) spectra of the ECDs were recorded using a Perkin Elmer Lambda 650 UV/VIS Spectrometer, at normal incidence, while calculation of the different optical performance indicators was carried out as described in our previous work [24]. Cyclic voltammetry of complete ECDs was performed using the above potentiostat with a scan rate of 50 mV/s.
The incident photon to current efficiency (IPCE) spectrum of a BPW34 mini silicon solar cell was obtained using a QE-PV-Si quantum efficiency/IPCE measurement kit produced by Oriel. An Oriel 94011A solar simulator, equipped with an AM1.5G filter, in conjunction with a Keithley 2601 source measure unit was used for recording the characteristic I-V curves of the BPW34 mini silicon solar cells.
3. Results
3.1. Effect of the Applied Bias Potential
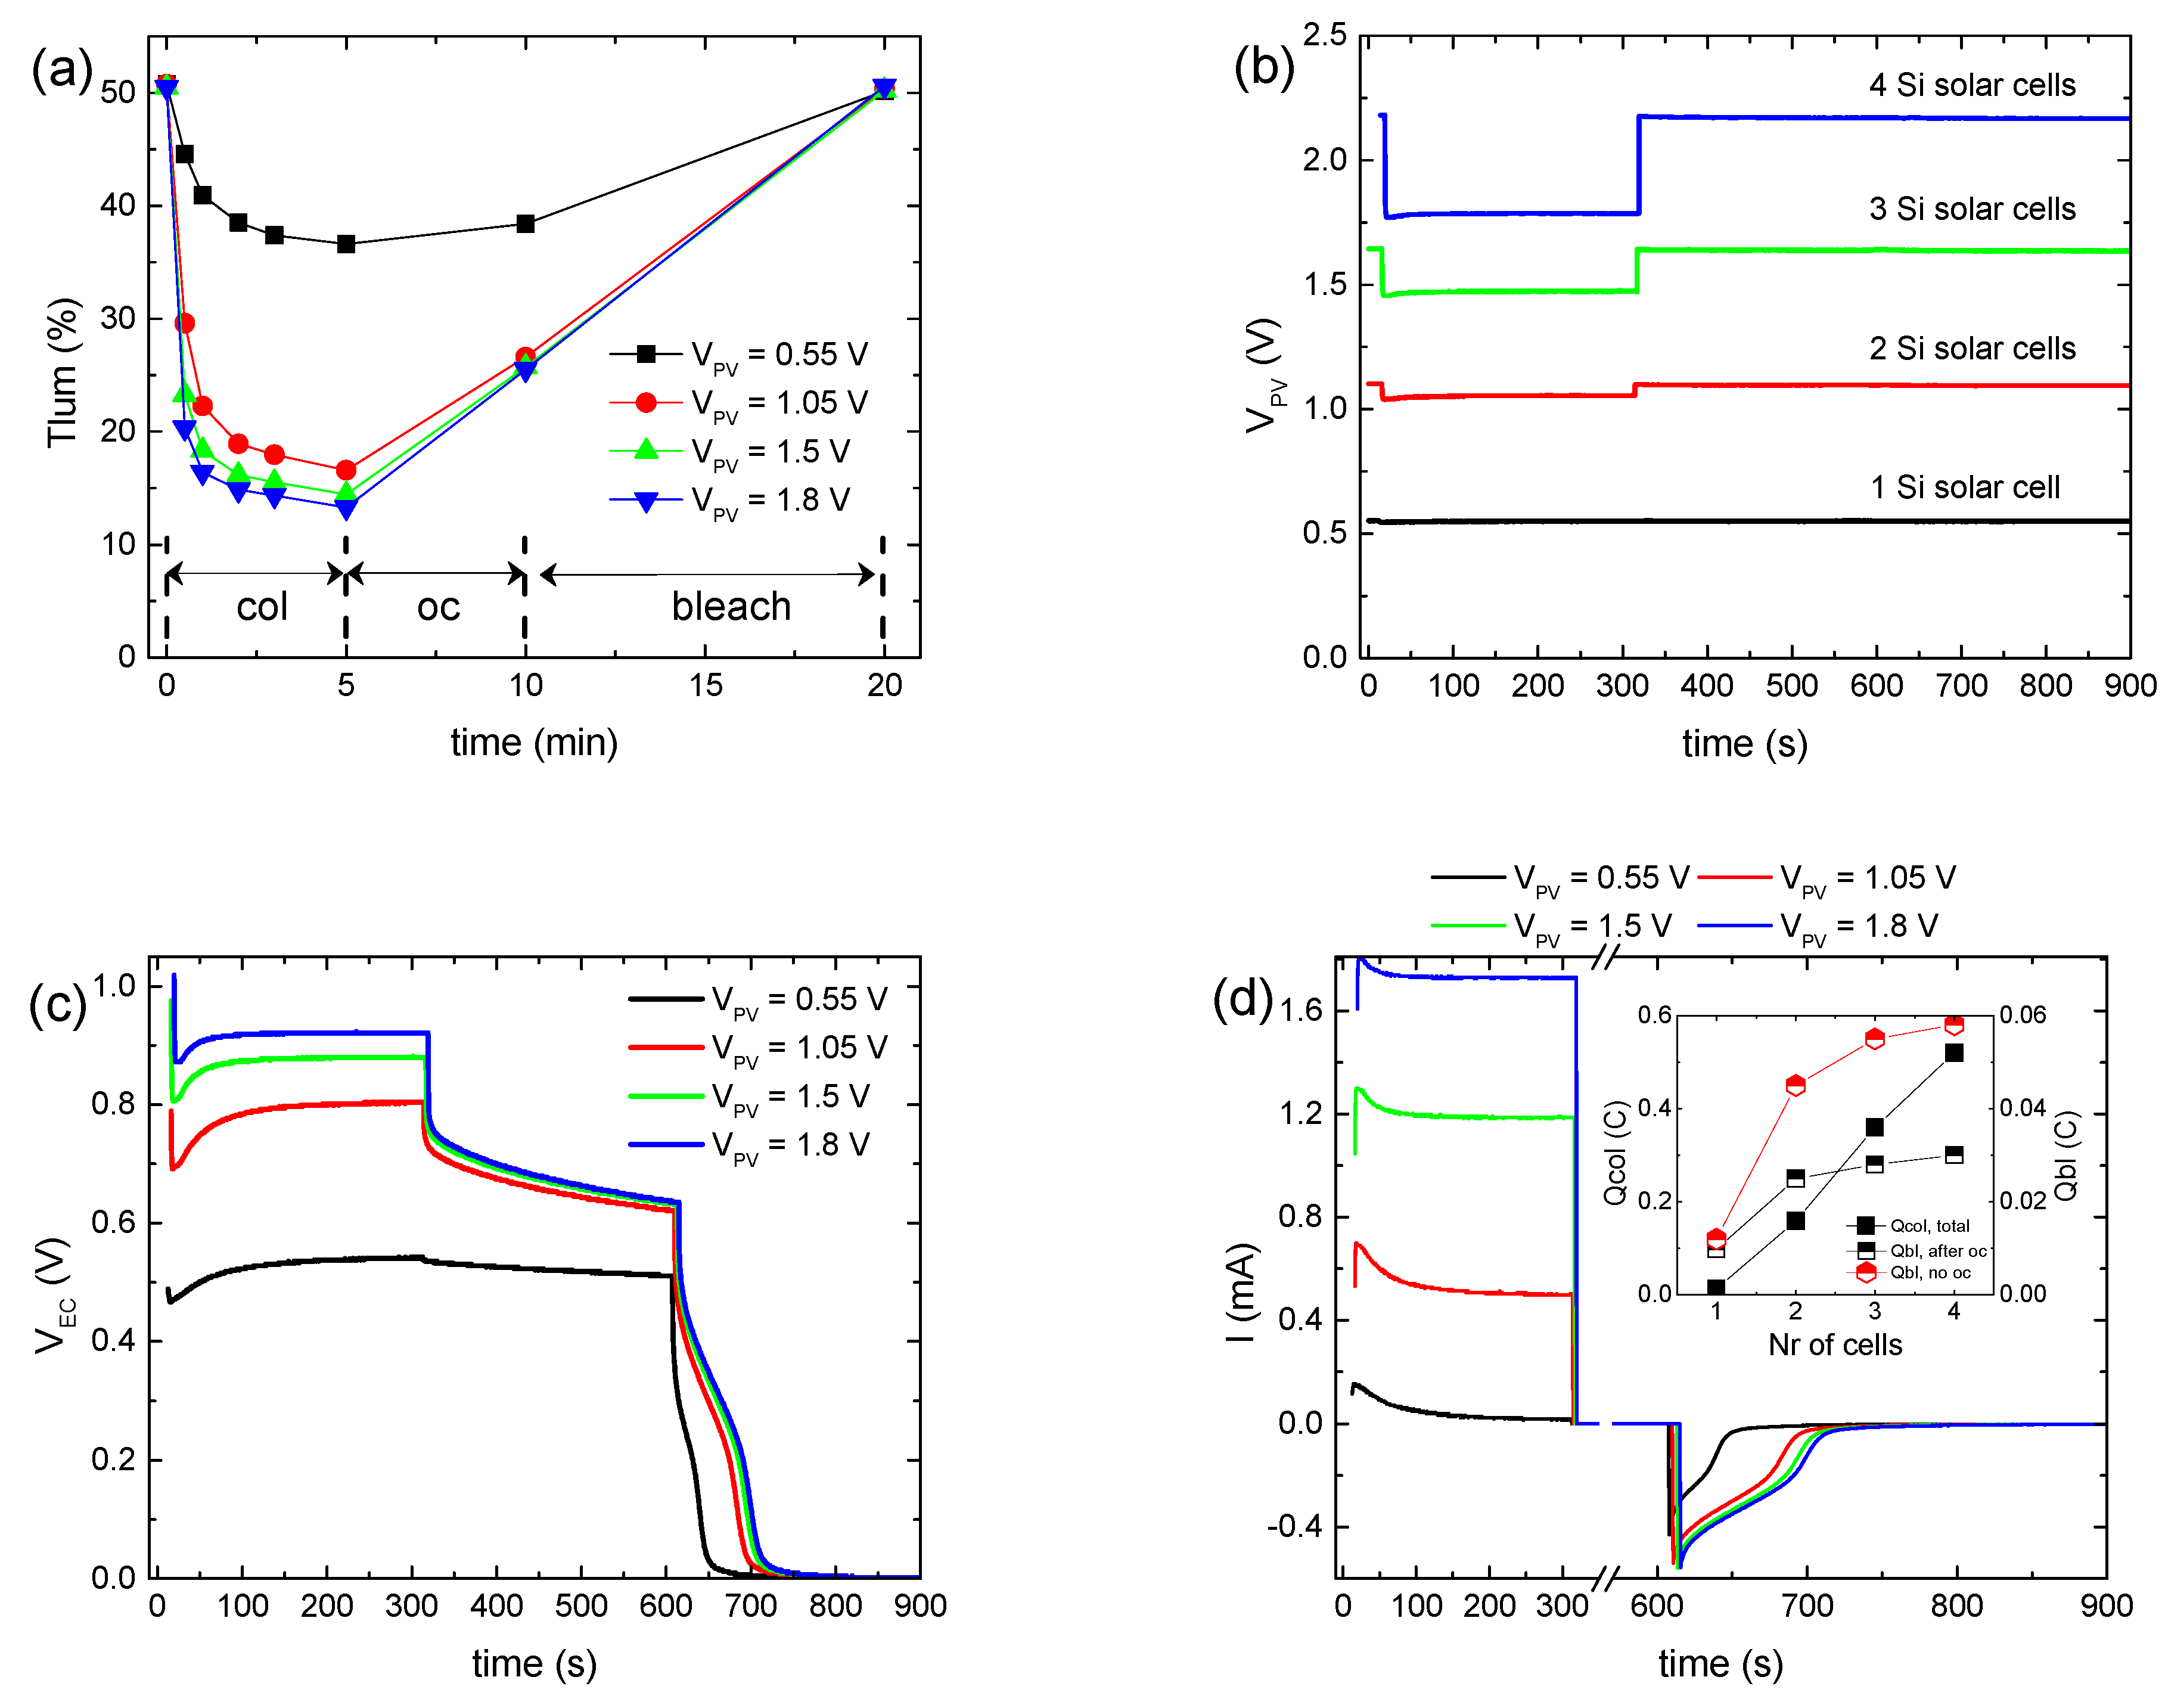
Figure 1a shows the variation in the luminous transmittance (Tlum) during a testing procedure of a hybrid ECD for the different values of the applied bias potential (VPV), while the corresponding full transmittance spectra in the visible and near-IR regions appear in Figure S1. To vary VPV, up to four BPW34 mini silicon solar cells were connected in series. A typical IPCE spectrum and characteristic I–V curves of BPW34 mini silicon solar cells connected in series appear in Figure S2, and their characteristic photovoltaic parameters appear in Table S2.
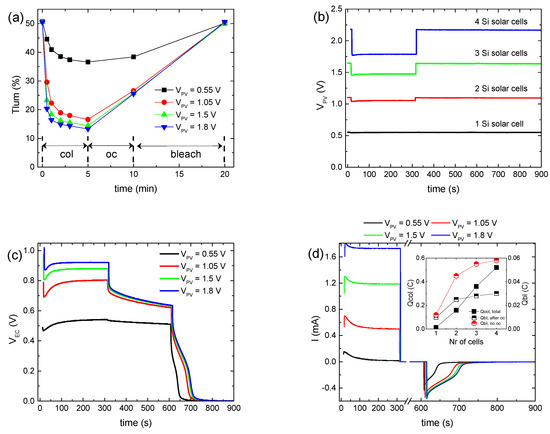
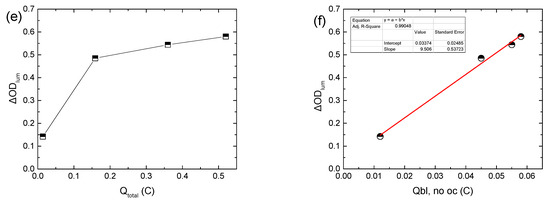
Figure 1.
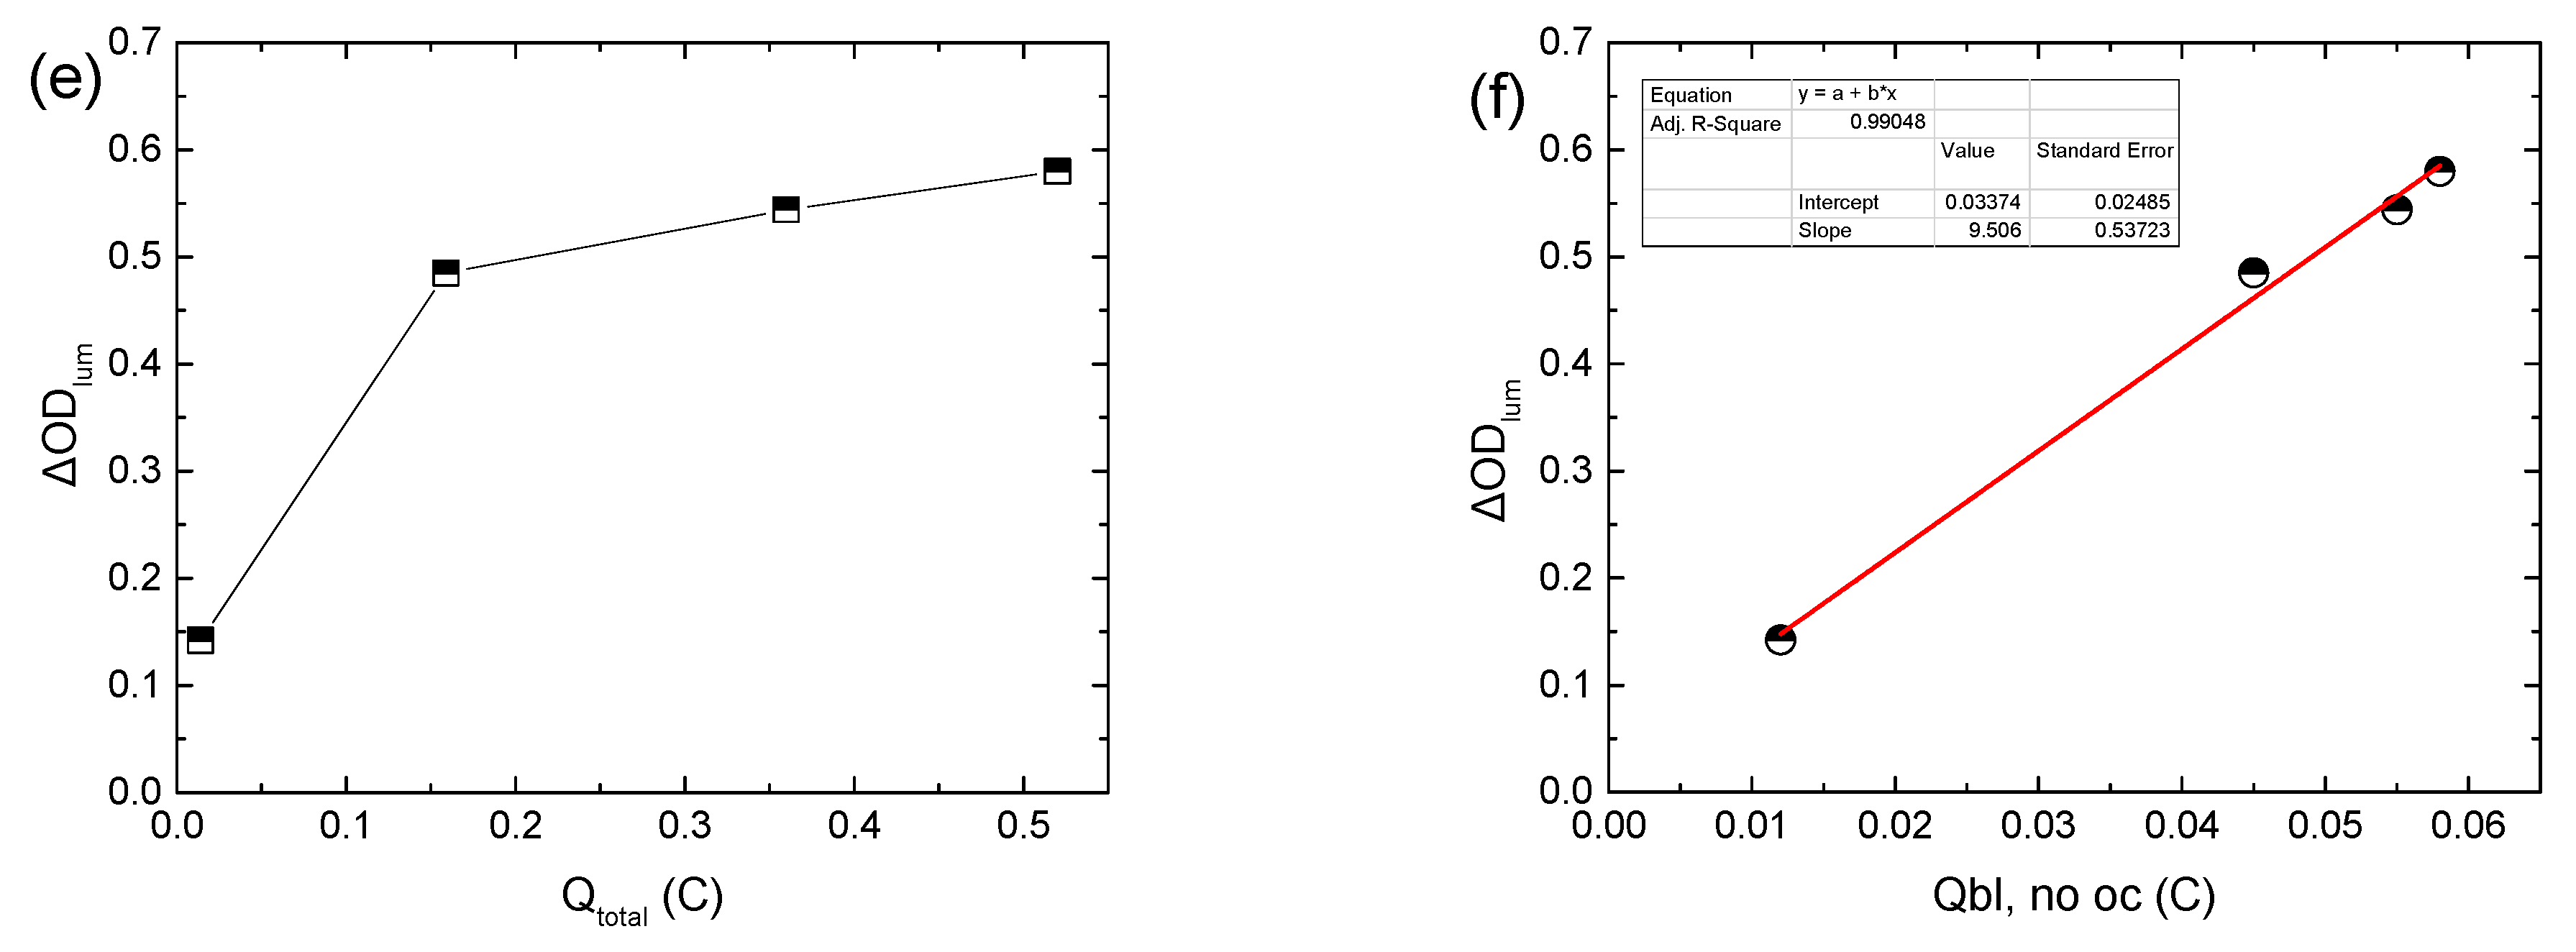
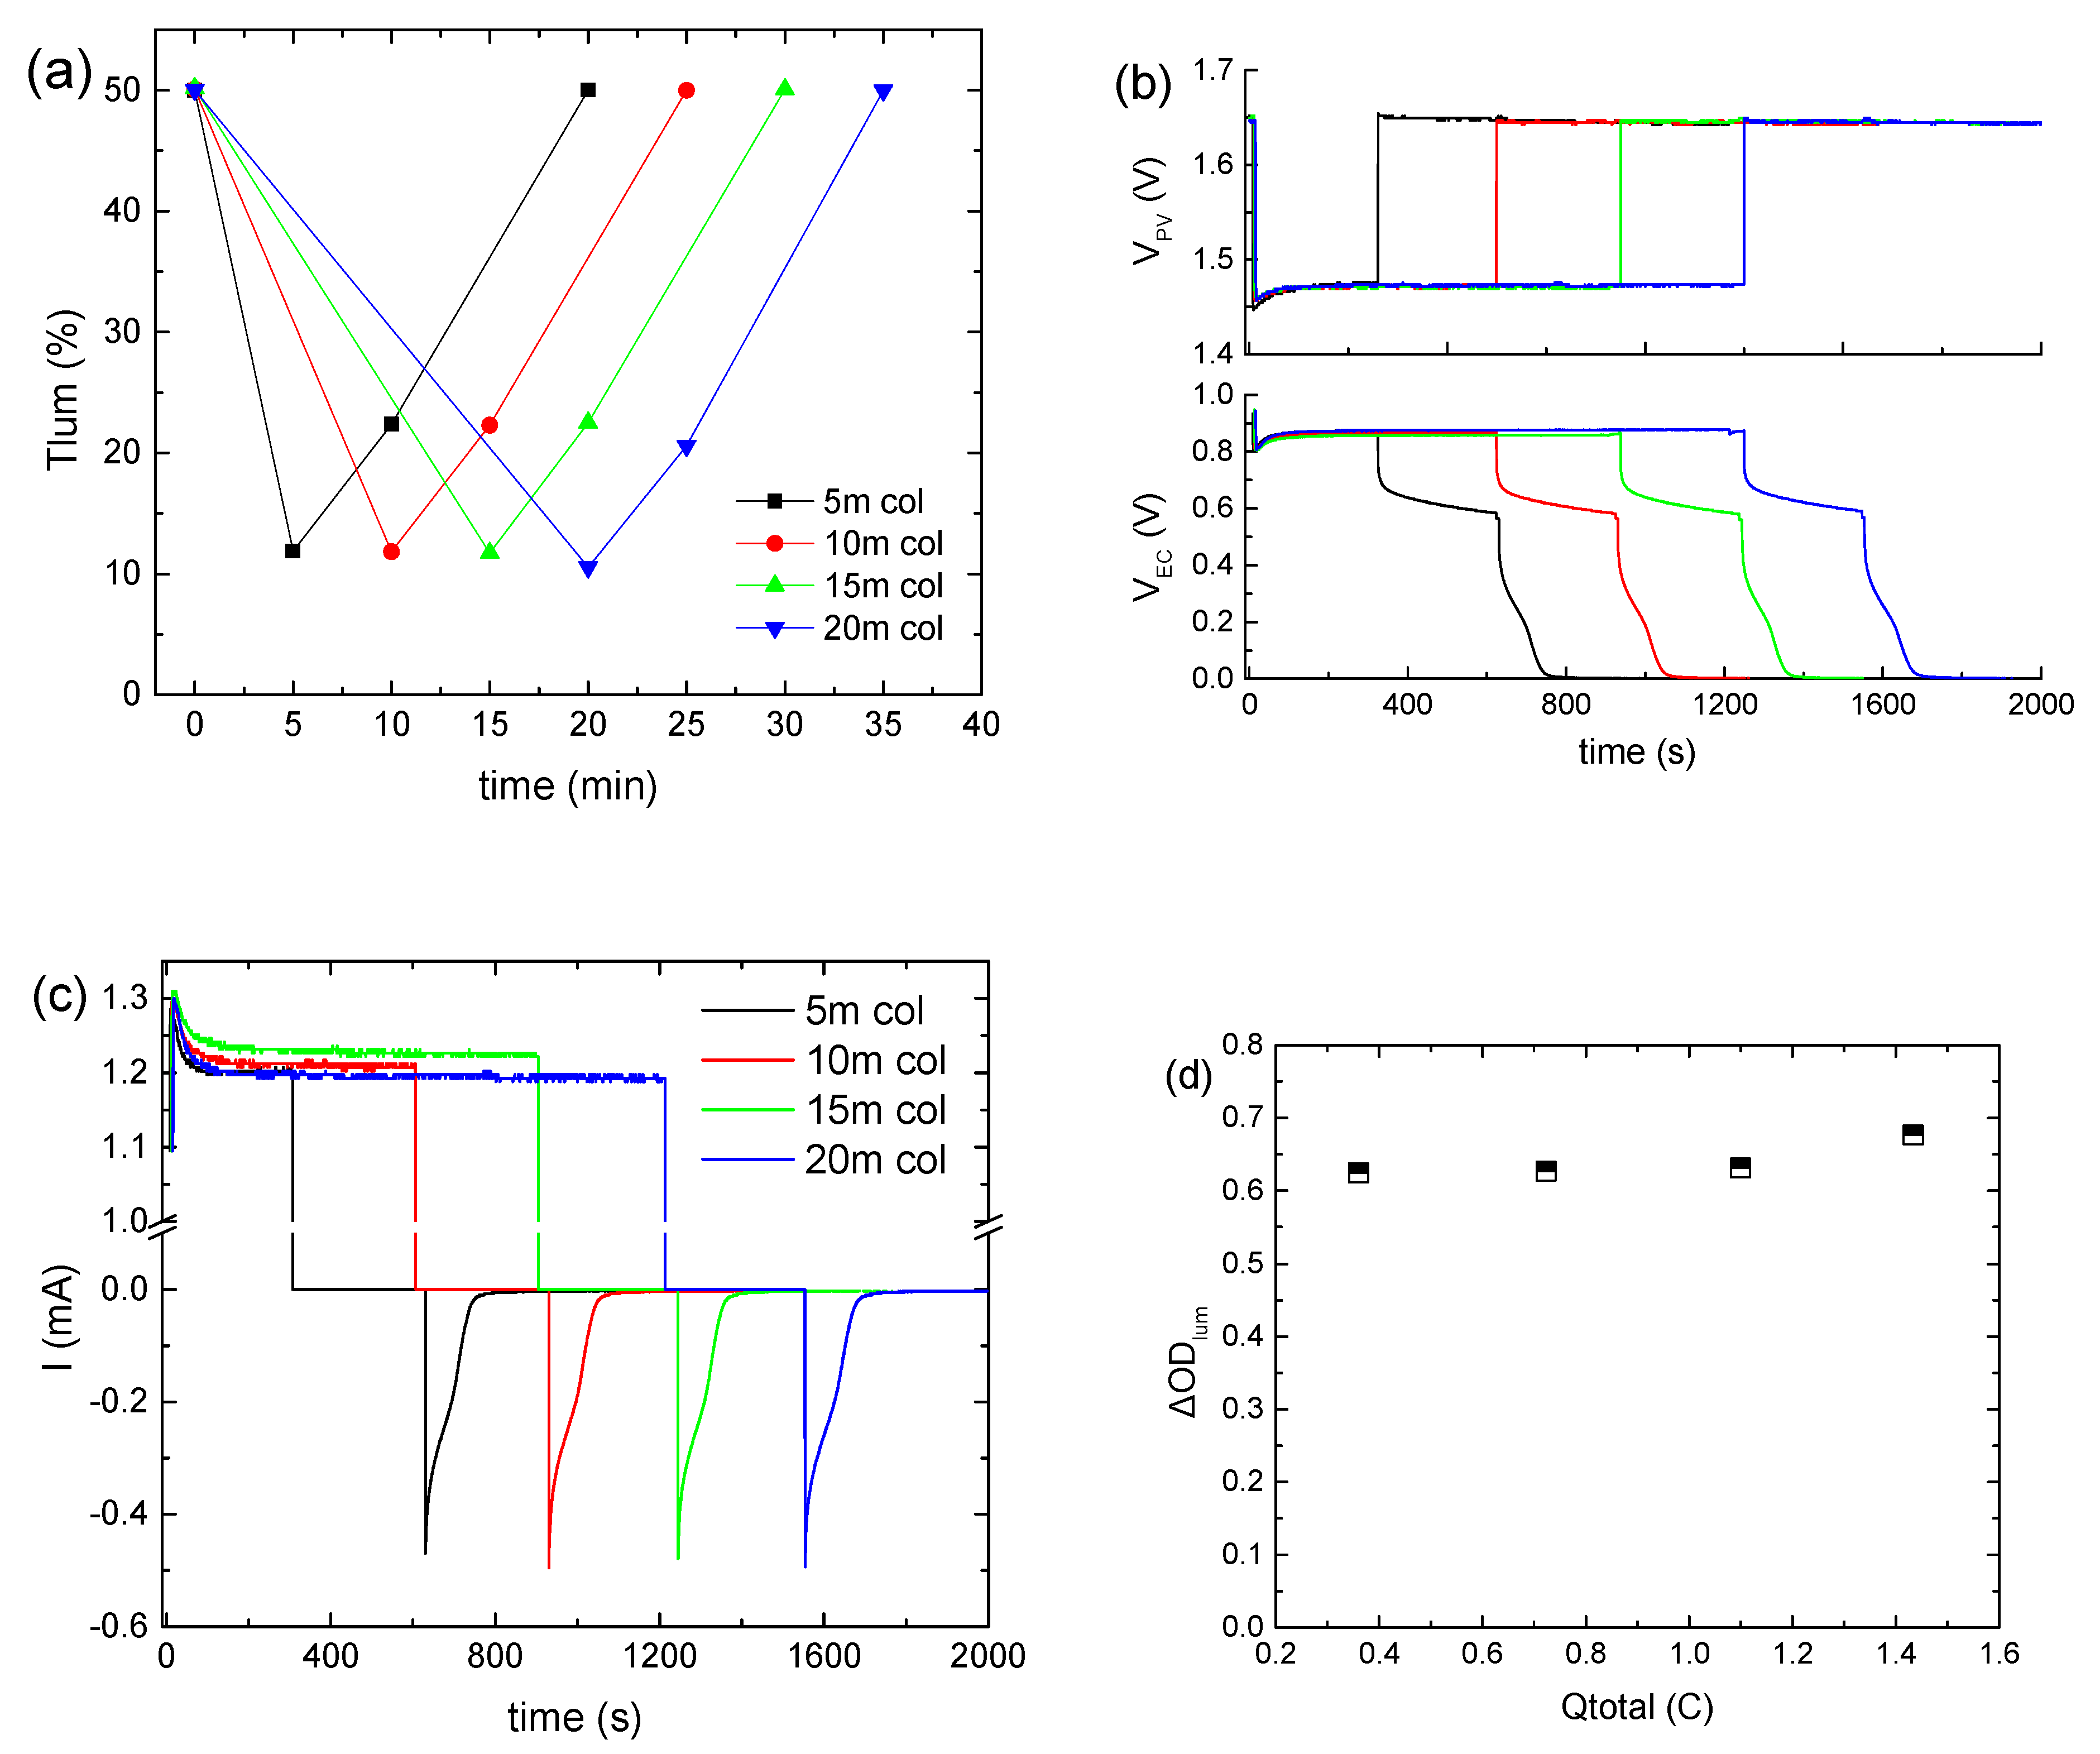
Variation in the luminous transmittance (Tlum) (a), the potential at the terminals of the BPW34 mini-Si solar cells (VPV) (b), the potential at the terminals of the ECD (VEC) (c), the total current density (Itotal) passing through the ECD during a coloration–bleaching cycle (d), the luminous optical density modulation with respect to the total charge (e), and the luminous optical density modulation with respect to the charge released during bleaching, skipping the open circuit step in the testing procedure for calculating the coloration efficiency (f), for the different values of the applied bias potential.
We observe that with VPV increasing from 0.55 to 1.05 V (Figure 1b), the coloration depth increased significantly from 36.6 to 16.6% (Figure 1a), while the coloration time decreased slightly from less than 3 min to 1–2 min. Note that the coloration time was defined as the time needed for the ECD to attain 90% of its maximum optical modulation (ΔT).
Subsequently, a minor improvement was observed in the coloration depth for VPV ~1.5 V, while it remained nearly constant when VPV increased further (~1.8 V) (Figure 1a,b), even though the coloration time for VPV ~1.8 V decreased even further to less than 1 min. At the same time, the voltage at the ECD terminals (VEC) exhibited a sub-linear increment with VPV (Figure 1c). In particular, its value at the end of the coloration step tends to an upper bound value of nearly 1 V (Figure S3a). Meanwhile, the total current passing through the ECD during coloration (Itotal) increased linearly with VPV (Figure 1d and Figure S3b).
Even though ΔODlum increased linearly with VEC, as expected [10,14] (Figure S3c), its variation with the total charge during coloration (Qtotal) was sub-linear (Figure 1e). Due to the fact that both ΔODlum and VEC tend to an upper bound value when VPV is increased above ~1 V, we can assume that initially, Icol will also show the same behavior with VPV. Finally, for a certain VPV, Itotal attains a maximum value, after an initial increment, and then a lower steady-state one (Figure 1d), as observed also in [12]. The time needed for the steady state is approximately the same as the coloration time. Therefore, after Itotal has reached its steady-state value, we can assume that Itotal ≈ Iloss [28], and thus, the major part of the increment in Itotal with VPV can be attributed to the increment in Iloss, showing enhanced interfacial losses with an increase in VPV [14]. As a result, Iloss increased from 7.65 to 194, 464, and 676 μA/cm2 as VPV increased from 0.55 to 1.05, 1.5, and 1.8 V, respectively. In other words, when the ECD reaches its final colored (charged) state, then all the current passing through the ECD is due to the interfacial loss reactions (Reaction 3) and Icol tends to zero. If this mechanism is not possible, for example, due to the presence of a barrier layer, then the total current should fall to zero, resembling the behavior of a battery during charging.
Under open circuit conditions, partial bleaching of the ECD (Figure 1a) and a significant voltage drop at the ECD terminals (Figure 1c) were observed, due to the loss reactions at the EC layer/electrolyte interface (Reaction 3). Moreover, the initial voltage drop was more pronounced as VPV increased, due to the higher difference between the electrochemical potential of LixWO3 and the redox potential of the electrolyte. This is due to the lower value (more negative) of the electrochemical potential of LixWO3 vs NHE since its value becomes more negative as the optical density of the EC layer increases [14]. However, after 5 min under open circuit conditions, both Tlum and VEC converge when VPV ≥ 1.05 V. Finally, after the ECD terminals were connected with a 1 kOhm resistor, the ECD was bleached (discharged) (Figure 1c), returning in all cases to its initial optical state (Figure 1a). As a result, an opposite bleaching current (Figure 1d) was measured, from which the charge released during bleaching (Qbl, after oc) was calculated.
As expected, the values of Qbl, after oc when VPV ≥ 1.05 V are nearly the same (Figure 1d, inset). Moreover, a large difference was observed between the values of Qtotal and Qbl, after oc for the same VPV value (Figure 1d, inset) for two reasons: firstly, as explained above, Qtotal includes also the charge responsible for triiodide reduction (Reaction 3) at the EC layer/electrolyte interface (Qloss), and secondly, part of the stored charge in the WO3 film is lost during the open circuit step, as explained above. By skipping the open circuit step in the testing procedure (Figure S4a–c), a more accurate estimation of the overall stored charge in the WO3 film (Qbl, no oc) was possible (Figure 1d, inset). As a result, ΔODlum now varies linearly with Qbl, no oc (Figure 1f), and from the linear regression analysis, the coloration efficiency could be calculated, being 24.3 cm2 C−1, considering that the area of the ECD was 1.6 × 1.6 cm2. In this manner, a better estimation of the coloration efficiency is possible, since when using Qtotal, as is common in the relevant literature [11,12,13], an underestimation takes place.
Finally, since the ECD returns to its initial optical state after bleaching, we can assume that Qcol ≈ Qbl, no oc. Therefore, Qloss can be calculated indirectly from Equation (2):
and as appears in Figure S4d, Qloss improved significantly with VPV, as assumed above. It is characteristic that the Qloss/Qtotal ratio varies from 0.14 to 0.72, 0.85, and 0.89 when VPV increases from 0.55 to 1.05, 1.5, and 1.8, respectively. Alternatively, Iloss (or equally Qloss) can be calculated by the difference between Itotal and the coloration or optical current (Iopt), as proposed by Bogati et al. in [14,16]. However, a previously known and constant coloration efficiency is a prerequisite.
3.2. Effect of Bias Time
Subsequently, the applied bias potential (VPV) was kept constant at ~1.5 V, using three series-connected BPW34 mini silicon solar cells, and the bias time was varied from 5 to 20 min. As shown in Figure 2a, when the bias time is prolonged above 5 min, a minor improvement in the coloration depth results. The same also holds for the VEC values (Figure 2b). At the same time, Itotal exhibited a steady-state value of around 1.2 mA (Figure 2c), irrespective of the bias time. If this current is provided continuously by an external source, a constant VEC and a uniform coloration will be maintained. As a result, Qtotal increased from 0.36 to 1.4 C, while ΔODlum was practically constant (Figure 2d). Therefore, since the optical modulation of the ECD is the same in all cases, we can assume that Qcol is also the same for the different bias times, and therefore the increment in Qtotal is attributed solely to the contribution of Qloss. Finally, the Tlum and VEC values at the end of the open circuit step (Figure 2a,b) and the values of Qbl, after oc (Figure S5), as calculated from Figure 2c, were the same, irrespectively of the bias time, whereas in all cases the ECD returned to its initial optical state.
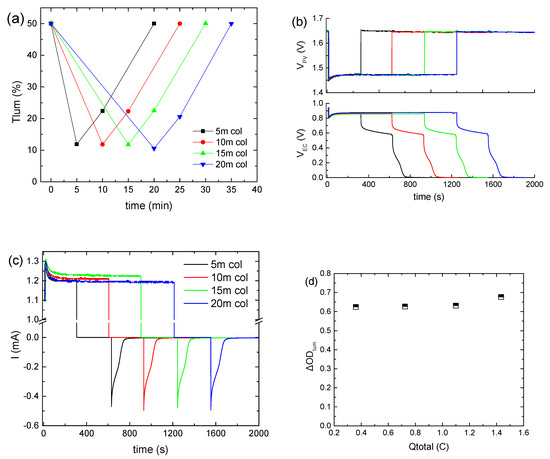
Figure 2.
Variation in the luminous transmittance (Tlum) (a), the potential at the terminals of the BPW34 mini-Si solar cells (VPV) (b) and the potential at the terminals of the ECD (VEC) (b), the total current density (Itotal) passing through the ECD during a coloration–bleaching cycle (c), and the luminous optical density modulation with respect to the total charge (d) for the different values of the bias time.
3.3. Stability of the Hybrid ECD
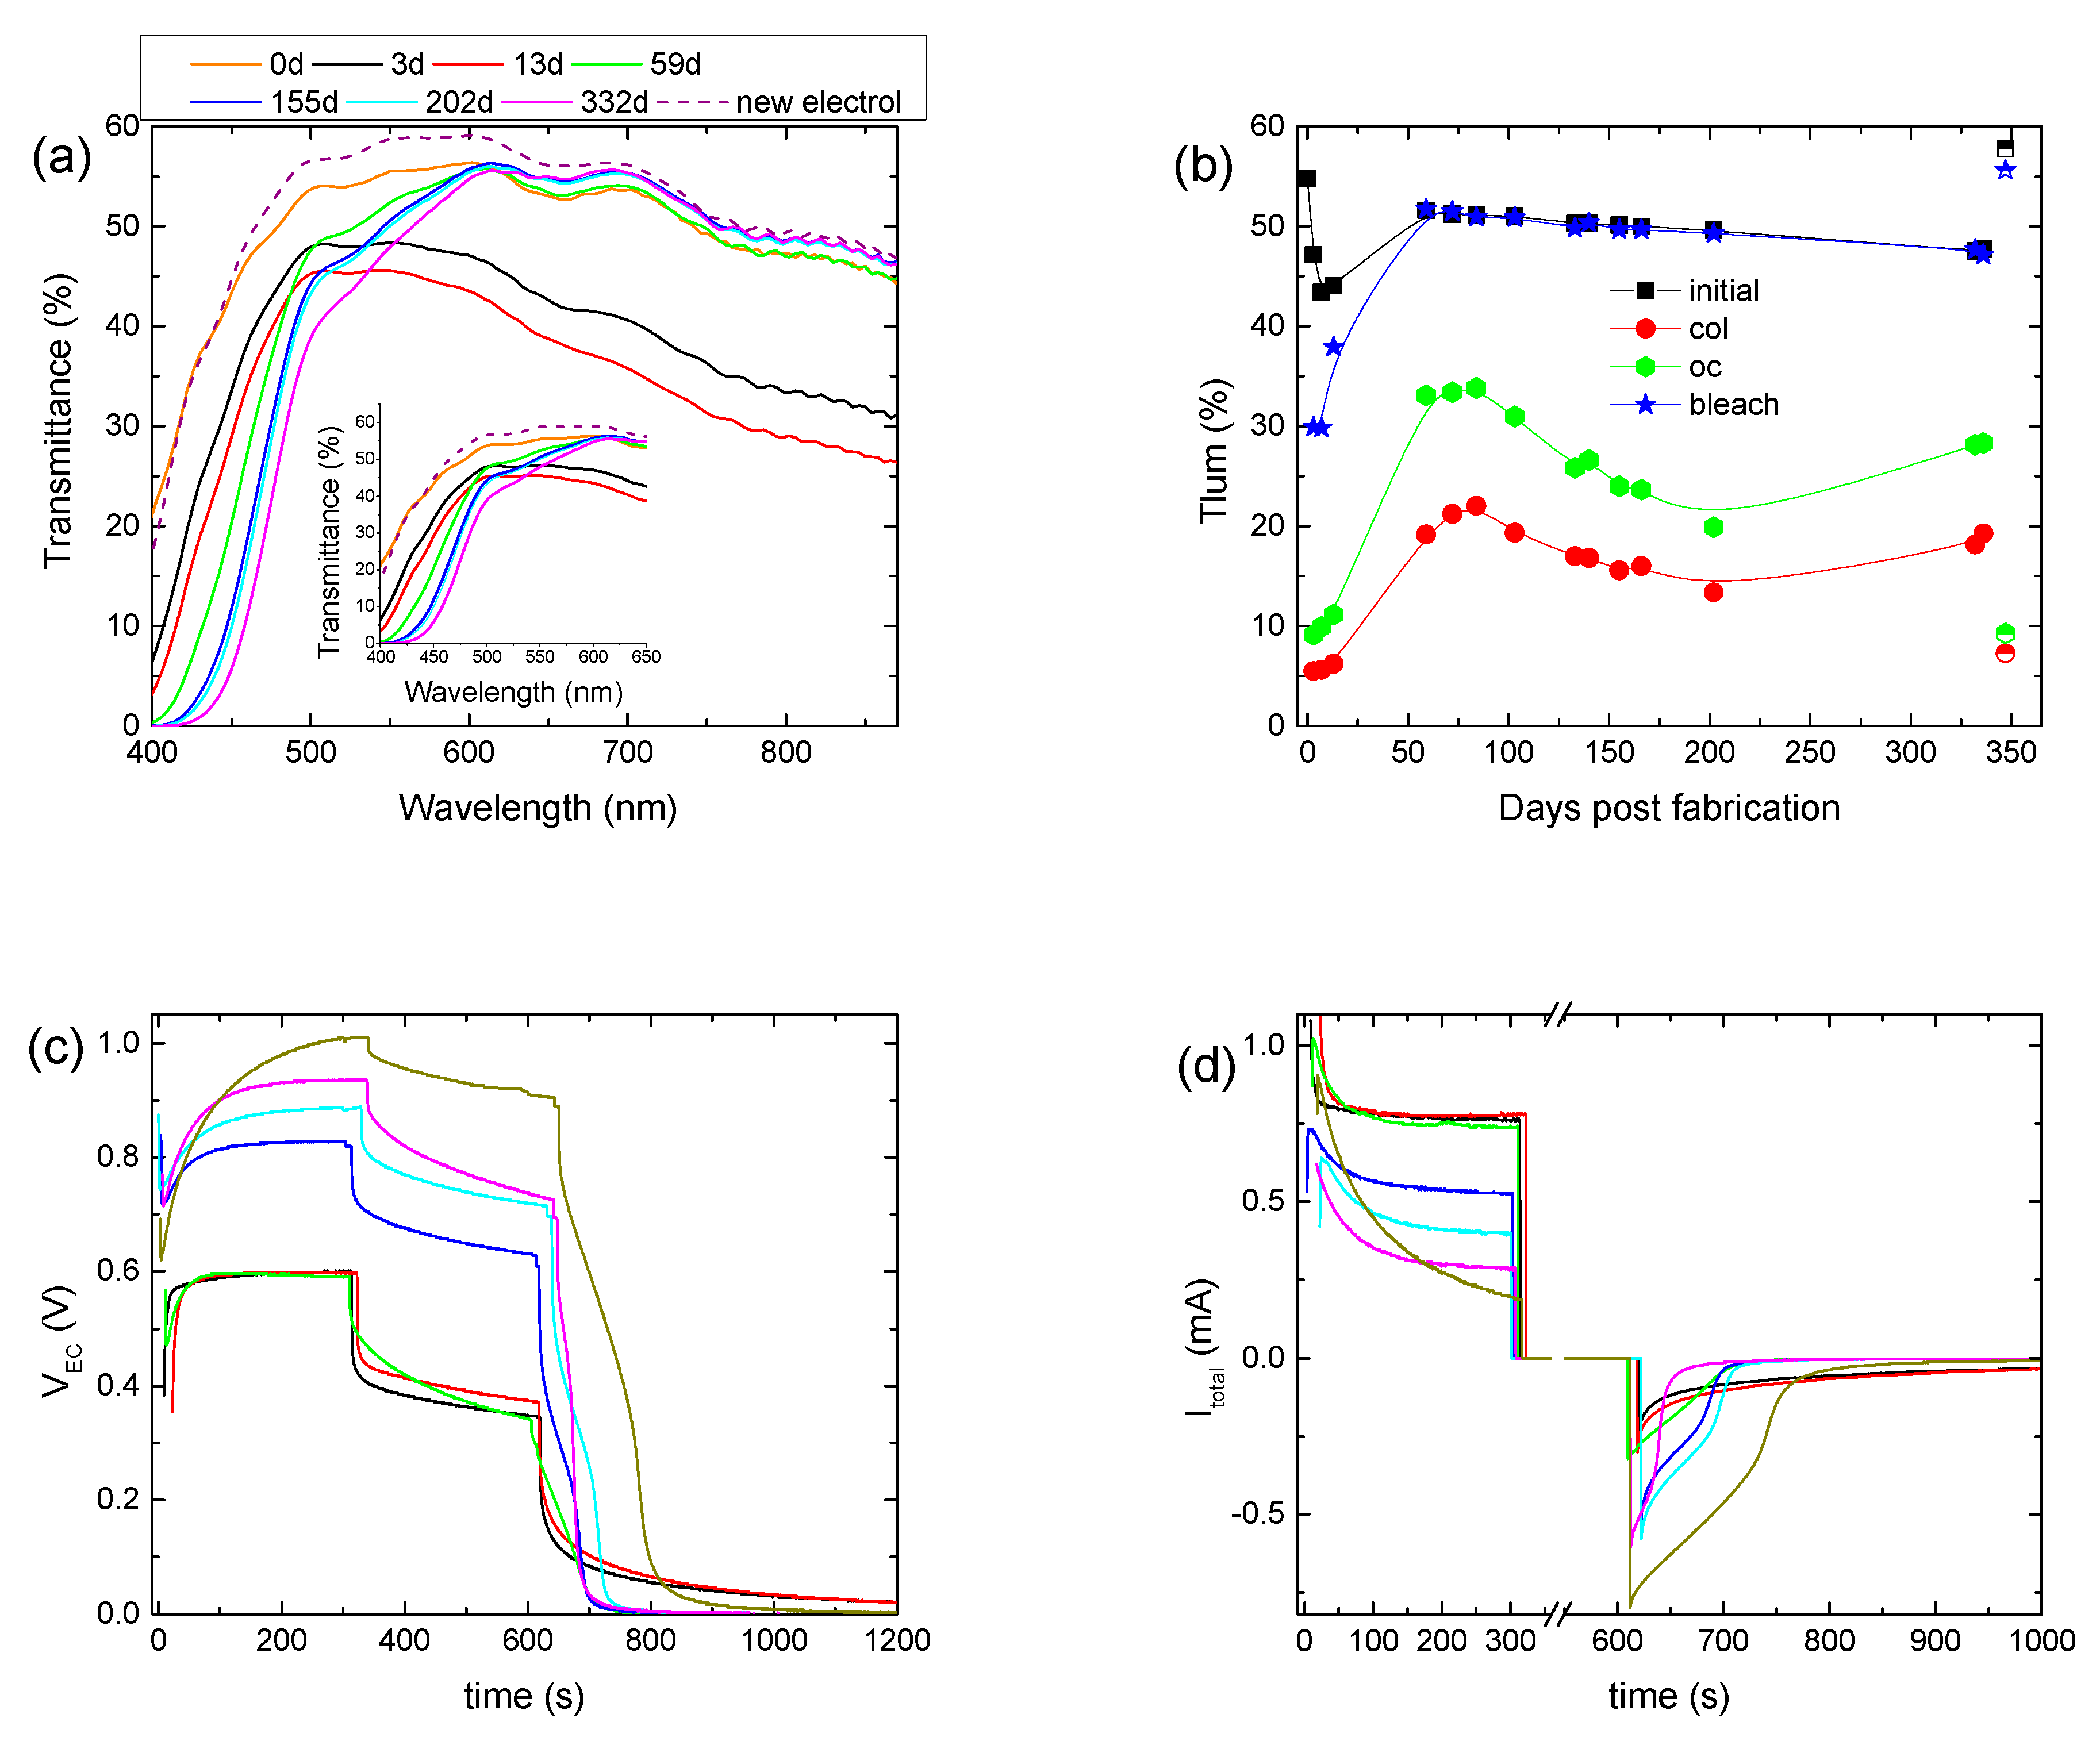
The stability of the hybrid ECD was also examined by performing a prolonged aging test for at least one year. Initially, the hybrid ECD remained under open circuit conditions in the dark for 3 days to examine if self-coloration takes place. Indeed, an overall reduction in the transmittance was observed (Figure 3a), with the luminous transmittance in the colored state (Tlum, col) decreasing from 55 to 47.2% (Figure 3b). This fact shows that the electrochemical potential (vs NHE) of the as-prepared WO3 layer is higher (more positive) than that of the redox electrolyte. As a result, the transfer of electrons from the redox electrolyte to the WO3 film is possible, inducing self-coloration [14].
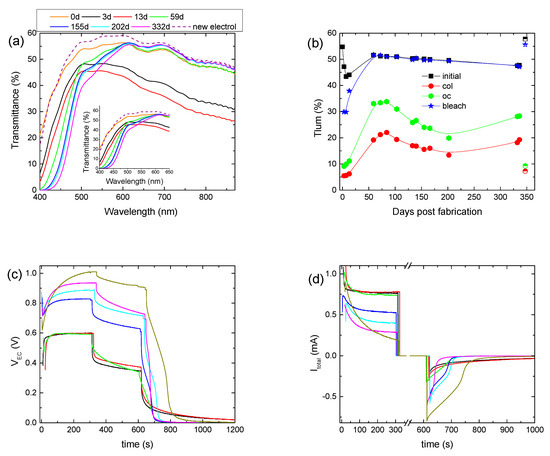
Figure 3.
Transmittance spectra of a hybrid ECD for different days post-fabrication (a); variation in the luminous transmittance at different stages (b), the potential at the terminals of the ECD (VEC) (c), and the total current (Itotal) passing through the ECD (d) for different days post-fabrication.
Then, for the following 10 days, we observed an intense coloration, where the device exhibited a Tlum, col of 5–6% and a contrast ratio above 7:1 (Figure 3b, Table 2). Moreover, the electrical properties of the ECD did not show any significant changes (Figure 3c,d). Optical and electrical losses during the open circuit step were also observed, as expected (Figure 3c,d). Finally, it is worth mentioning that the ECD could not return to its initial optical state and the values of both VEC and Itotal were not equal to zero at the end of the bleaching step (Figure 3c,d), showing a remaining coloration of the ECD.
Table 2.
Characteristic optical performance indicators, total charge, and charge released during bleaching for different days post-fabrication of the ECD.
Afterwards, the ECD was stored under open circuit conditions for nearly 45 days, and for the following 150 days, the ECD was tested regularly. As appears in Figure 3a, a significant change in the transmittance spectra occurred. More specifically, a gradual reduction in the transmittance of the ECD up to 600 nm was observed, as compared with the transmittance measured immediately after assembling the device (day 0), possibly due to the formation of free iodine (I2). Similarly, a reduction in the transmittance in the case of an I−/I3− redox electrolyte in the 400–700 nm region after 50 consecutive voltammetry scans was observed in [11]. As the authors stated, the absorption in the blue region resulted initially from the production of I3− ions, having an absorption maximum at 360 nm, and then from their further oxidation to iodine, which shows a strong absorption for λ > 430 nm [18].
During this period, Tlum, col varied within the range of 22–13%, showing a trend of improving the coloration depth and the ΔODlum, as the device was cycled (Figure 3b) (Table 2). Moreover, during coloration, VEC increased considerably. More specifically, its value at the end of the coloration step increased from 0.6 V to nearly 0.9 V (Figure 3c and Figure S6a), while at the same time, only a minor increment in the VPV value occurred, from 0.98 V to 1.1 V (Figure S6b), depicting a small change in the operating point of the mini-Si solar cells. Therefore, the increment in the VEC value was not due to the increment in the VPV value.
A decrement in Itotal could explain the VEC increment, since the voltage drop at the terminals of the 0.5 kOhm resistor would decrease, leaving a larger part of VPV to be applied at the terminals of the ECD. Indeed, both the maximum value of Itotal and its steady-state value at the end of the coloration step, which correlates well with Iloss, decreased (Figure 3d). For example, the steady-state value of Itotal was 0.73 mA after 59 days and decreased to 0.4 mA after 200 days. As a result, Qtotal showed a clear trend for reduction (Figure S6c) (Table 2), and the improvement in the optical performance can be attributed to the reduced losses and the training effect of the WO3 film due to the continuous operation.
Moreover, the increment percentage of Tlum during the open circuit step varied from 73% (day 55) to 50% (day 200), and the voltage drop percentage varied from 45% (59th day) to nearly 20% (200th day) (Figure S6a), both showing reduced optical and electrical losses. As a result, Qbl, after oc showed an increment from 17.8 mC (59th day) to 28.8 mC (200th day) (Figure S6b) (Table 2). Finally, the device could return to its initial optical state, and both VEC and Itotal were equal to zero after nearly 100 s of bleaching (Figure 3c,d), showing a complete bleaching (discharge) of the ECD.
A second and longer storage period under open circuit conditions followed for 130 days. After that, the initial transmittance of the ECD decreased further (Figure 3a) for λ < 600 nm, Tlum, col increased to 18.2% (Figure 3b), and in general, the optical performance deteriorated (Table 2). A further drop in Itotal or equally in Qtotal was also observed (Figure 3d and Figure S6c). During the open circuit step, the increment percentage of Tlum and the voltage drop percentage were 55% and 26%, respectively (Figure 3b and Figure S6a) (Table 2), and the value of Qbl, after oc was 16.7 mC, less than that before the storage period. It seems that, as after the first storage period, the performance of the ECD was affected negatively by storage under open circuit conditions. Nevertheless, the performance drop was not so intense after the second storage period. The exact influence of storage under open circuit conditions is not clear and needs to be further examined.
Nevertheless, by comparing days, before and after the second storage period, where the ECD exhibited the same optical density modulation (ΔODlum) (i.e., for days 100 and 330), reduced values of ΔTlum, ΔVEC, and Qtotal and an improved value of Qbl, after oc were observed (Table 2). That is another indication regarding the reduction in losses at the EC layer/electrolyte interface, after a prolonged testing period.
We believe that one of the reasons behind the reduction in losses, after a prolonged testing period, is the instability of the redox electrolyte. More specifically, the reduction in the initial transmittance of the ECD for λ < 600 nm (Figure 3a), as discussed above, indicates the formation of free iodine [11,18,20]. Initially, the concentration of free I2 is very low, since iodine is almost transformed to triiodide according to Reaction 4 [29]:
After prolonged testing, the direction of Reaction 4 is reversed, leading to the consumption of I3− ions and the formation of free I2. Another possibility is the oxidation of triiodide ions to iodine according to Reaction 5 [11]:
Reaction 5 takes place at more positive potentials than Reaction 2; therefore, it can be avoided by properly selecting the applied bias potential [10]. The presence of I2 can also negatively affect the conductivity of the electrolyte [20]. Therefore, due to the reduced availability of I3− ions, the losses at the WO3/electrolyte interface are reduced. At the same time, a slight variation in the redox potential of the electrolyte to lower values is expected [29].
To verify our above assumptions regarding the role of the electrolyte, the electrolyte was replaced with a fresh one. First, we observed that the transmittance of the ECD returned to its initial state (day 0) (Figure 3a,b) and the device exhibited optical performance (optical density modulation, coloration depth, contrast ratio) similar to that during its first cycle (3rd day). However, a significantly reduced value of Itotal was measured during coloration, leading to a reduced value of Qtotal (Figure 3c and Figure S6c). Moreover, reduced optical and electrical losses during the open circuit step (Table 2) were also observed. All the above resulted in a Qbl, after oc value 2.5 times larger than that in the first cycle (3rd day) (Table 2). Finally, the device could return to its initial optical state after bleaching. Therefore, we can assume that under prolonged testing, changes occur in not only the concentration of the electrolyte but also the properties of the EC layer/electrolyte interface. An increment in the charge transfer resistance at the WO3/electrolyte interface, due to possible adsorption of electrolyte species, could explain the above results well.
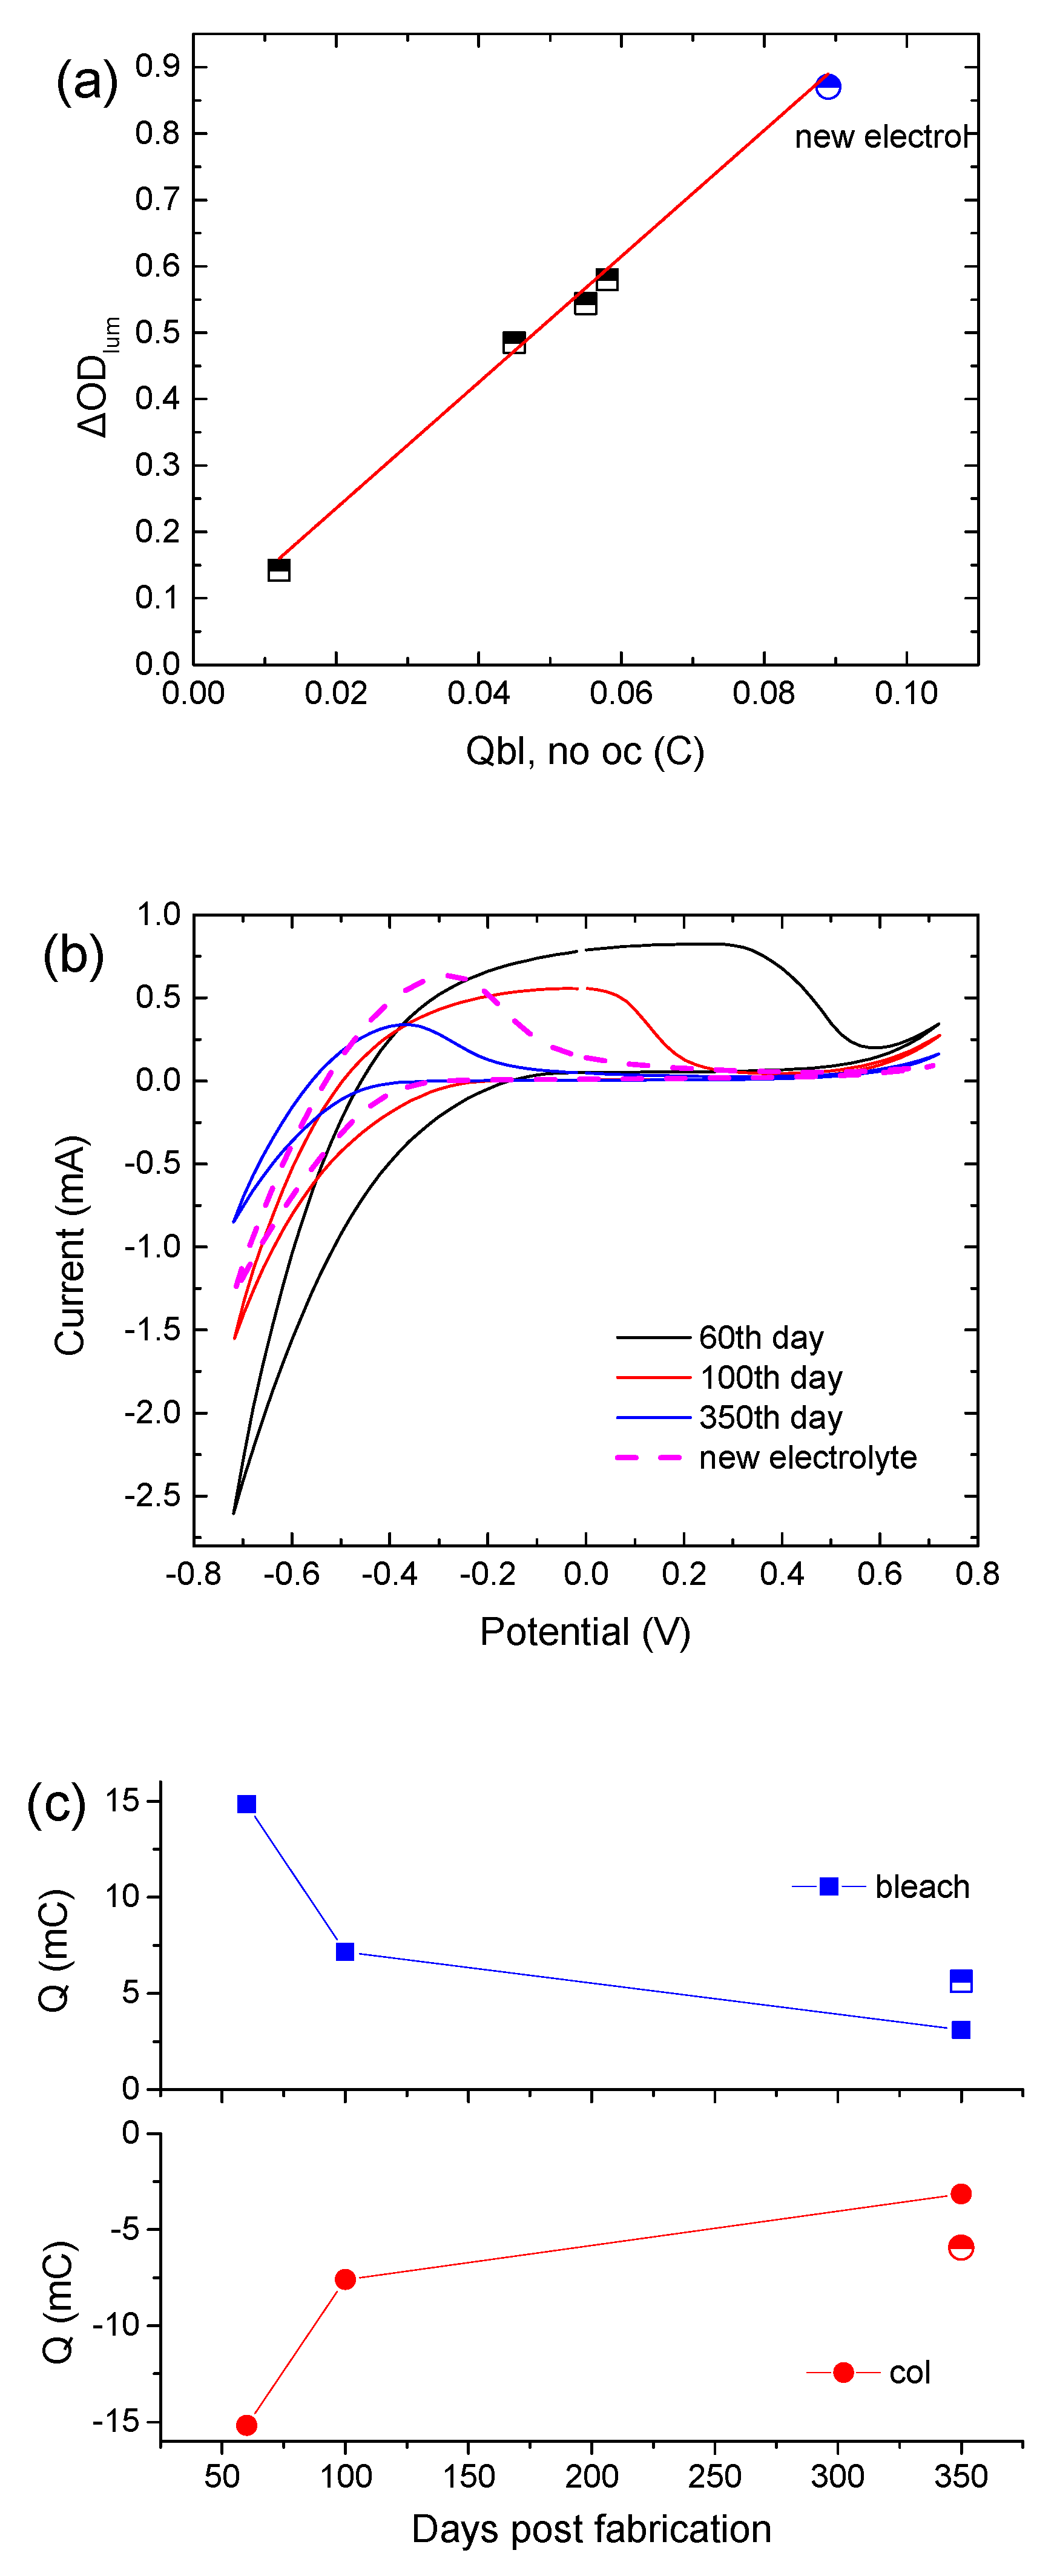
It is interesting to note that the CE is not affected by the replacement of the electrolyte with a fresh one, since the slope in the ΔODlum vs. Qbl, no oc graph remains the same (Figure 4a). Moreover, Figure 4b shows cyclic voltammograms of the above ECD for different days post-fabrication. Their shape is typical in the case where an amorphous WO3 film is used as the EC layer [18]. Moreover, WO3 is a well-known cathodic electrochromic material, meaning that it is colored during the cathodic scan. During the cathodic scan, a negative shift of the voltage value where coloration begins (the point where current changes sign from positive to negative) was observed, showing that a higher applied bias potential was necessary for coloration. The voltammogram area during the cathodic pulse decreases considerably, revealing an overall decrement in charge density exchanged during coloration (Figure 4c). Replacement of the electrolyte causes a slight positive shift of the voltage value where coloration begins, and an increment in Qcol by almost 80% (Figure 4c). Also, the ratio of Qcol/Qbl is equal to 1, showing a reversible coloration–bleaching procedure. Finally, the potential value, where the current tends to zero during the anodic pulse, was found to decrease, showing that the deintercalation of Li+ ions was made easier due to the training of the WO3 film.
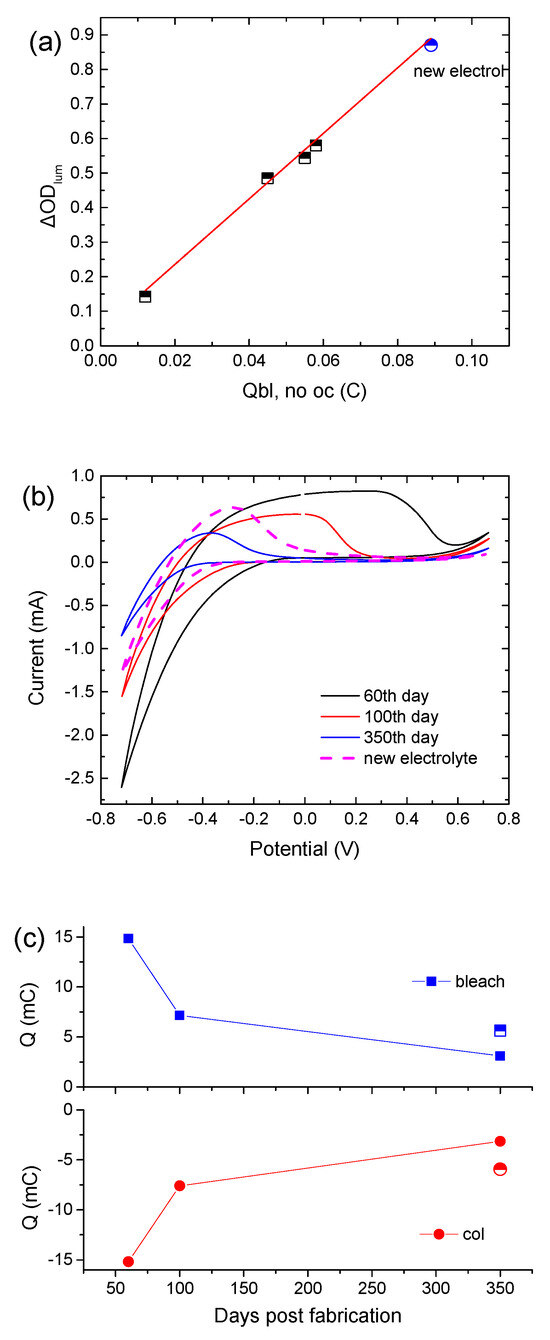
Figure 4.
(a) Variation in the luminous optical density modulation with respect to the charge released during bleaching, skipping the open circuit step in the testing procedure for calculating the coloration efficiency, (b) typical cyclic voltammograms of a hybrid ECD different days post-fabrication, and (c) calculated charges from the cyclic voltammograms.
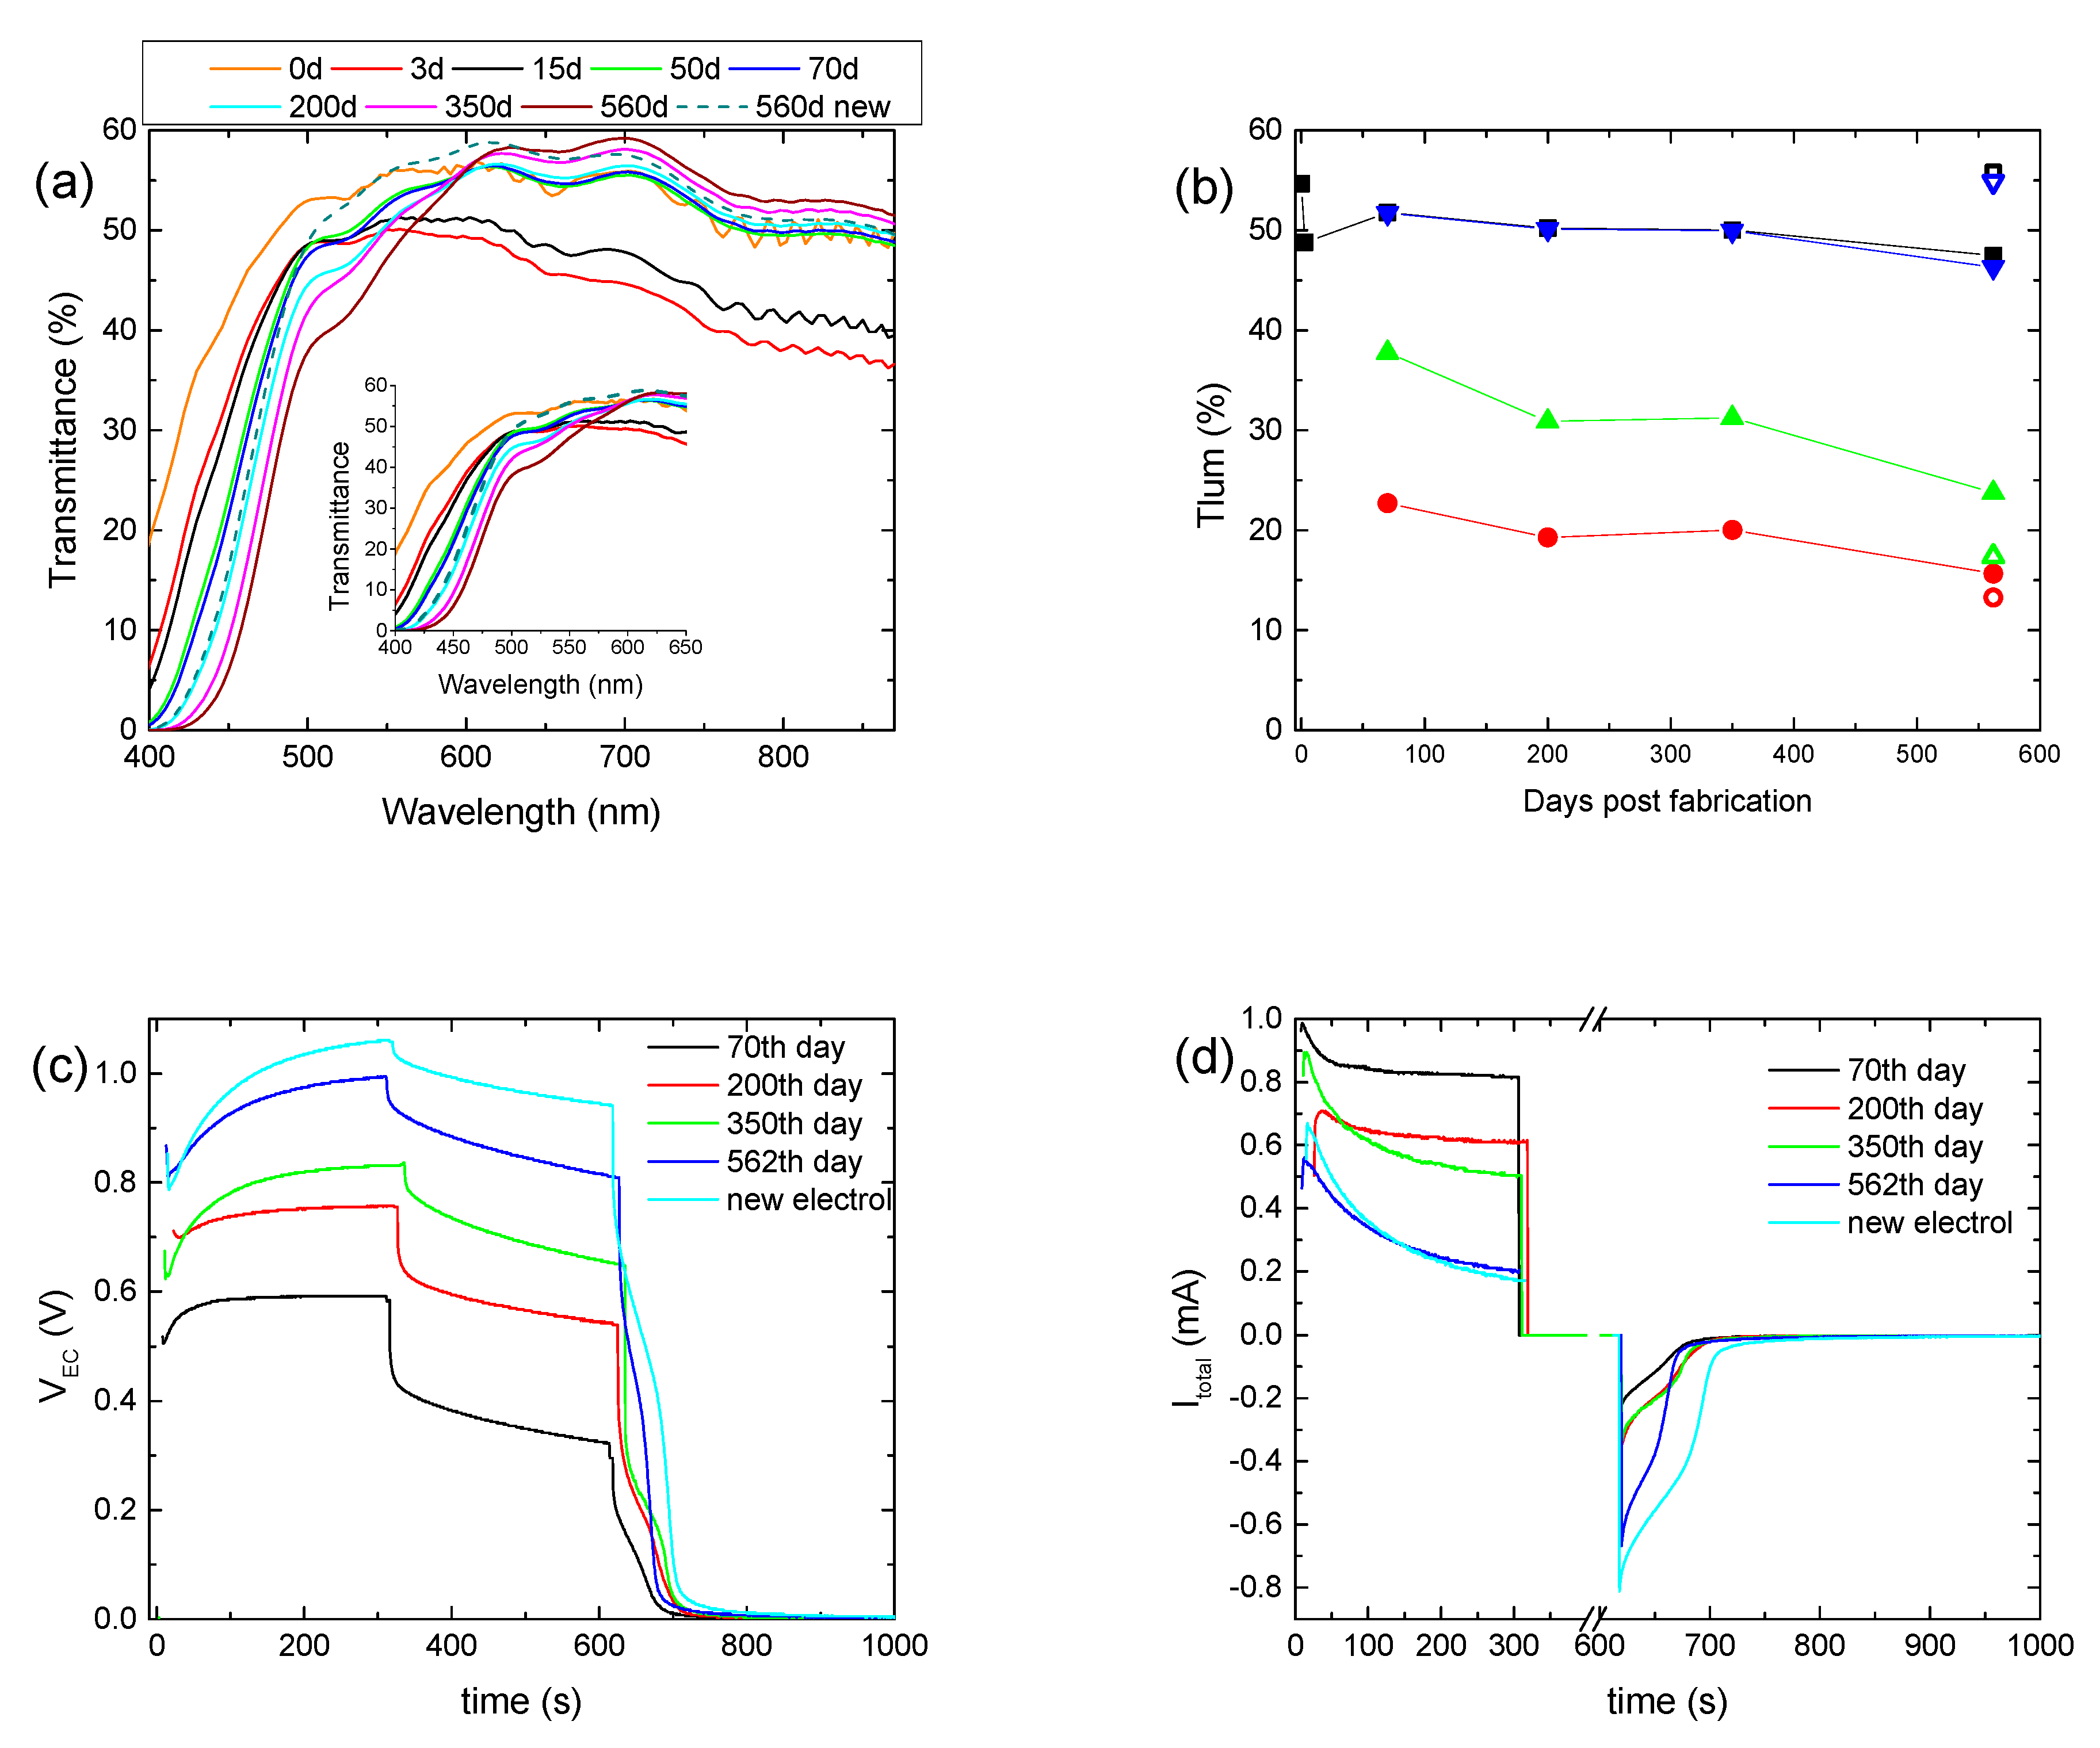
To examine further the effect of the prolonged testing on the overall performance of a hybrid ECD, the first coloration–bleaching cycle was performed 70 days after its fabrication, followed by only four more coloration–bleaching cycles, for a total period of nearly 18 months. In the meantime, only the transmittance was measured, and the ECD remained under open circuit conditions. Initially, due to self-coloration, an overall decrement in the transmittance was observed, while after 50 days, the transmittance of the ECD for wavelengths above 600 nm returned to its initial value (day 0), showing that self-coloration was no longer possible (Figure 5a). Nevertheless, the transmittance of the ECD at short wavelengths reduced continuously, due to the absorption of the electrolyte, even before the first coloration–bleaching cycle was performed. For example, the transmittance at 500 nm was reduced from its initial value of 53.1% to 47.8% and then to 38.4% after 70 days and 560 days, respectively. Therefore, the formation of free I2 can take place even without the application of a bias potential, due to Reaction 4.
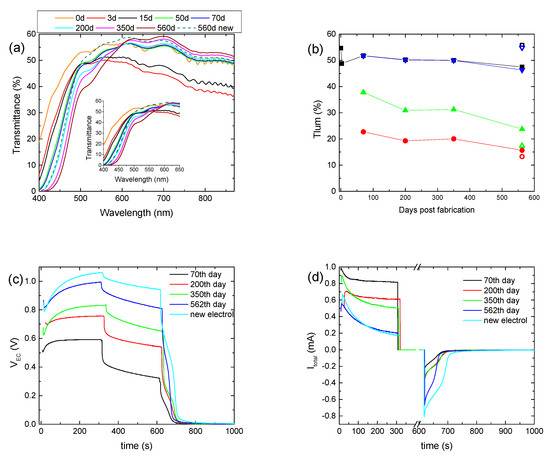
Figure 5.
Transmittance spectra of a hybrid ECD, where its first coloration–bleaching cycle was performed 70 days after its fabrication, for different days post-fabrication (a); variation in the luminous transmittance at different stages (b), the potential at the terminals of the ECD (VEC), (c) and the total current (Itotal) passing through the ECD (d) for different days post-fabrication.
During the first operation cycle, an intense coloration and optical irreversibility were not observed, as before. In general, the optical performance of the device was comparable to that of the previously aged ECD, showing a small improvement after 560 days (Figure 5b and Figure S7, Table 3). Again, an increment in VEC values during coloration occurred; i.e., the VEC value at the end of the coloration step increased from 0.59 V to 0.99 V (Figure 5c and Figure S6a), whereas both the maximum value of Itotal and its value after 5 min of coloration decreased (Figure 5d), with a small exception for Itotal, max of 350 days. Accordingly, Qtotal showed a clear trend for reduction (Figure S7b and Table 3). Optical and electrical losses during the open circuit step also showed a trend for reduction (Figure 5b,c and Figure S7b). All the above resulted in an improved value of Qbl, after oc, being 3 times larger after 560 days, compared with its value after the first coloration–bleaching cycle (70th day) (Figure S7b and Table 3). Finally, the substitution of the electrolyte with a fresh one remarkably improves the performance of the ECD, where optical and electrical losses were minimized. Note that the fresh electrolyte used here was the EL-HPE high-performance electrolyte, supplied by GreatSellSolar materials.
Table 3.
Characteristic optical performance indicators, total charge, and charge released during bleaching for different days post-fabrication of an ECD, where its first coloration–bleaching cycle was performed 70 days after its fabrication.
Finally, Figure 6 shows images of hybrid ECDs, immediately after assembling and after one year, where the more intense yellowish tint is obvious.
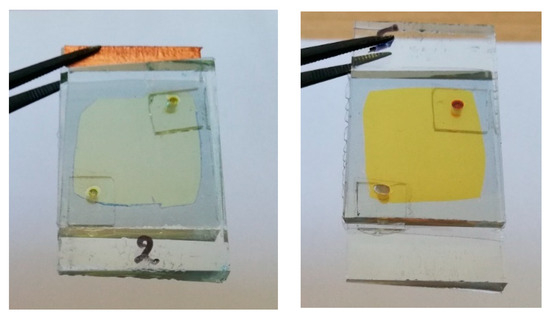
Figure 6.
A hybrid ECD with an I−/I3− redox electrolyte immediately after its fabrication (left) and after one year (right). Only three coloration–bleaching cycles have been performed in this case.
In summary, the above-described mechanisms that are responsible for the performance variation of hybrid ECDs, and especially the instability of the redox electrolyte, take place irrespective of whether the device is cycled or not. Therefore, this is a significant limitation imposed using an iodide/triiodide redox electrolyte.
4. Conclusions
In the present study, we have examined the effect of the applied bias potential and the duration of the bias on the performance of a hybrid EC device having an iodide/triiodide redox couple. We found that an applied bias potential of ~1 V was enough to achieve a contrast ratio of nearly 8:1 and a coloration time of a few minutes. Further increasing the applied bias potential up to 1.8 V resulted mainly in the enhancement of the loss reactions at the WO3/electrolyte interface, rather than in the improvement in the optical performance (coloration depth and time) of the ECD. These loss reactions take place also during the coloration of the ECD and must be considered to correctly estimate the coloration efficiency. Therefore, for an optically reversible device, it is better to use the charge deintercalated from the WO3 film during bleaching (Qbl, no oc), rather than using the charge measured during coloration (Qtotal), due to the significant contribution of Qloss in the value of Qtotal, which can be up to 90% depending on the applied bias potential value. Optical modulation cannot be improved further by prolonging the bias time up to 20 min, even though a significant value of loss current (~1.2 mA) passes through the ECD, which must be maintained to keep a uniform coloration. Nevertheless, after nearly two months of testing under real operating conditions, the contrast ratio declined from 3:1 to 2:1, even though a reduction in losses at the WO3/electrolyte interface was observed, and remained nearly constant for the next ten months. The above findings were attributed mainly to the instability of the electrolyte (i.e., formation of free I2) and the possible increment in the charge transfer resistance at the WO3/electrolyte interface. The replacement of the electrolyte was the only way to restore the performance of the ECDs, since a similar behavior was observed even without cycling the device. This is a significant limitation when an I−/I3− redox couple is used, affecting the performance not only of hybrid ECDs but also of photoelectrochromic devices. The use of a fresh electrolyte resulted in optically reversible devices even from the first day of their operation.
Supplementary Materials
The following supporting information can be downloaded at: https://www.mdpi.com/article/10.3390/en16207084/s1, Table S1: Comparative table with hybrid ECDs having different redox electrolytes; Figure S1: Transmittance spectra of a hybrid ECD during a coloration–bleaching cycle for the different values of the applied bias potential (VPV), which was increased using series-connected mini silicon solar cells: (a) 1 mini silicon solar cell, (b) 2 mini silicon solar cells, (c) 3 mini silicon solar cells, and (d) 4 mini silicon solar cells; Figure S2: (a) Typical I-V curves of up to 4 series-connected BPW34 mini-Si solar cells and (b) a typical IPCE spectrum; Table S2: Characteristic photovoltaic properties of series-connected BPW34 mini silicon solar cells; Figure S3: (a) Variation in the voltage at the ECD terminals (VEC) with respect to the applied bias potential (VPV), (b) linear increment in Itotal passing through the ECD with the applied bias potential (VPV), (c) linear increment in the luminous optical density modulation with the voltage at the ECD terminals (VEC); Figure S4: Variation in the applied bias potential VPV (a), the potential at the terminals of the ECD (VEC) (b), and the total current density (Itotal) passing through the ECD (c) during a coloration–bleaching cycle; (d) variation in Qloss with the applied bias potential (VPV); Figure S5: Variation in the total charge (Qtotal) and the charge released from the WO3 layer during bleaching (Qbl, after oc) with the bias time, after an open circuit step; Figure S6: (a) Variation in the potential at the terminals of the ECD (VEC) at the end of each step during a coloration–bleaching cycle with days post-fabrication, (b) variation in the applied bias potential (VPV) for specific days post-fabrication during coloration of the ECD, (c) variation in ΔODlum, Qtotal, and Qbl, after oc with days post-fabrication (open symbols are used in the case of the fresh electrolyte); Figure S7: (a) Variation in the potential at the terminals of the ECD (VEC) at the end of each step during a coloration–bleaching cycle with days post-fabrication; (b) variation in ΔODlum, Qtotal, and Qbl, after oc with days post-fabrication (open symbols are used in the case of the fresh electrolyte).
Author Contributions
Conceptualization, G.S.; formal analysis, G.S.; writing—original draft, G.S.; visualization, G.S.; funding acquisition, G.S.; investigation, G.S. and S.T.; resources, G.L.; writing—review and editing, G.S. and G.L. All authors have read and agreed to the published version of the manuscript.
Funding
This research was funded by the University of Patras, funding program “MEDICUS”, grant number 82557.
Data Availability Statement
The data presented in this study are available on request from the corresponding author. The data are not publicly available due to their large volume.
Conflicts of Interest
The authors declare no conflict of interest.
References
- Papaefthimiou, S. Chromogenic technologies: Towards the realization of smart electrochromic glazing for energy-saving applications in buildings. Adv. Build. Energy Res. 2010, 4, 77–126. [Google Scholar] [CrossRef]
- Granqvist, C.; Arvizu, M.; Pehlivan, I.B.; Qu, H.-Y.; Wen, R.-T.; Niklasson, G. Electrochromic materials and devices for energy efficiency and human comfort in buildings: A critical review. Electrochim. Acta 2018, 259, 1170–1182. [Google Scholar] [CrossRef]
- Cannavale, A.; Ayr, U.; Fiorito, F.; Martellotta, F. Smart Electrochromic Windows to Enhance Building Energy Efficiency and Visual Comfort. Energies 2020, 13, 1449. [Google Scholar] [CrossRef]
- Park, B.R.; Hong, J.; Choi, E.J.; Choi, Y.J.; Lee, C.; Moon, J.W. Improvement in Energy Performance of Building Envelope Incorporating Electrochromic Windows (ECWs). Energies 2019, 12, 1181. [Google Scholar] [CrossRef]
- Lahmar, I.; Cannavale, A.; Martellotta, F.; Zemmouri, N. The Impact of Building Orientation and Window-to-Wall Ratio on the Performance of Electrochromic Glazing in Hot Arid Climates: A Parametric Assessment. Buildings 2022, 12, 724. [Google Scholar] [CrossRef]
- Tong, Z.; Tian, Y.; Zhang, H.; Li, X.; Ji, J.; Qu, H.; Li, N.; Zhao, J.; Li, Y. Recent advances in multifunctional electrochromic energy storage devices and photoelectrochromic devices. Sci. China Chem. 2016, 60, 13–37. [Google Scholar] [CrossRef]
- Granqvist, C.G. Electrochromics for smart windows: Oxide-based thin films and devices. Thin Solid Films 2014, 564, 1–38. [Google Scholar] [CrossRef]
- SageGlass|Electrochromic Glass|Smart Windows, (n.d.). Available online: https://www.sageglass.com/ (accessed on 31 August 2023).
- Niklaus, L.; Schott, M.; Posset, U.; Giffin, G.A. Redox Electrolytes for Hybrid Type II Electrochromic Devices with Fe−MEPE or Ni1−xO as Electrode Materials. ChemElectroChem 2020, 7, 3274–3283. [Google Scholar] [CrossRef]
- Georg, A.; Georg, A. Electrochromic device with a redox electrolyte. Sol. Energy Mater. Sol. Cells 2009, 93, 1329–1337. [Google Scholar] [CrossRef]
- Giannuzzi, R.; Prontera, C.T.; Primiceri, V.; Capodilupo, A.L.; Pugliese, M.; Mariano, F.; Maggiore, A.; Gigli, G.; Maiorano, V. Hybrid electrochromic device with transparent electrolyte. Sol. Energy Mater. Sol. Cells 2023, 257, 112346. [Google Scholar] [CrossRef]
- Bae, J.; Kim, H.; Moon, H.C.; Kim, S.H. Low-voltage, simple WO3-based electrochromic devices by directly incorporating an anodic species into the electrolyte. J. Mater. Chem. C 2016, 4, 10887–10892. [Google Scholar] [CrossRef]
- Wang, Z.; Shen, K.; Xie, H.; Xue, B.; Zheng, J.; Xu, C. Robust non-complementary electrochromic device based on WO3 film and CoS catalytic counter electrode with TMTU/TMFDS2+ redox couple. Chem. Eng. J. 2021, 426, 131314. [Google Scholar] [CrossRef]
- Bogati, S.; Georg, A.; Graf, W. Sputtered Si3N4 and SiO2 electron barrier layer between a redox electrolyte and the WO3 film in electrochromic devices. Sol. Energy Mater. Sol. Cells 2017, 159, 395–404. [Google Scholar] [CrossRef]
- Hauch, A.; Georg, A.; Krašovec, U.O.; Orel, B. Comparison of Photoelectrochromic Devices with Different Layer Configurations. J. Electrochem. Soc. 2002, 149, H159–H163. [Google Scholar] [CrossRef]
- Bogati, S.; Georg, A.; Jerg, C.; Graf, W. Tetramethylthiourea (TMTU) as an alternative redox mediator for electrochromic devices. Sol. Energy Mater. Sol. Cells 2016, 157, 454–461. [Google Scholar] [CrossRef]
- Kim, Y.M.; Li, X.; Kim, K.-W.; Kim, S.H.; Moon, H.C. Tetrathiafulvalene: Effective organic anodic materials for WO3-based electrochromic devices. RSC Adv. 2019, 9, 19450–19456. [Google Scholar] [CrossRef] [PubMed]
- Hočevar, M.; Krašovec, U.O. Solid electrolyte containing a colorless redox couple for electrochromic device. Sol. Energy Mater. Sol. Cells 2019, 196, 9–15. [Google Scholar] [CrossRef]
- Ke, Y.; Wang, Z.; Xie, H.; Khalifa, M.A.; Zheng, J.; Xu, C. Long-Term Stable Complementary Electrochromic Device Based on WO3 Working Electrode and NiO-Pt Counter Electrode. Membranes 2023, 13, 601. [Google Scholar] [CrossRef]
- Wang, S.; Wang, Y.; Wang, T.; Han, Z.; Cho, C.; Kim, E. Charge-Balancing Redox Mediators for High Color Contrast Electrochromism on Polyoxometalates. Adv. Mater. Technol. 2020, 5, 326. [Google Scholar] [CrossRef]
- Huang, Q.; Dong, G.; Xiao, Y.; Diao, X. Electrochemical Studies of Silicon Nitride Electron Blocking Layer for All-Solid-State Inorganic Electrochromic Device. Electrochim. Acta 2017, 252, 331–337. [Google Scholar] [CrossRef]
- Bogati, S.; Basnet, R.; Georg, A. Iridium oxide catalyst for hybrid electrochromic device based on tetramethylthiourea (TMTU) redox electrolyte. Sol. Energy Mater. Sol. Cells 2018, 189, 206–213. [Google Scholar] [CrossRef]
- Čolović, M.; Hajzeri, M.; Tramšek, M.; Orel, B.; Surca, A.K. In situ Raman and UV–visible study of hybrid electrochromic devices with bis end-capped designed trialkoxysilyl-functionalized ionic liquid based electrolytes. Sol. Energy Mater. Sol. Cells 2020, 220, 110863. [Google Scholar] [CrossRef]
- Syrrokostas, G.; Dokouzis, A.; Yannopoulos, S.N.; Leftheriotis, G. Novel photoelectrochromic devices incorporating carbon-based perovskite solar cells. Nano Energy 2020, 77, 105243. [Google Scholar] [CrossRef]
- Syrrokostas, G.; Leftheriotis, G.; Yianoulis, P. Performance and stability of “partly covered” photoelectrochromic devices for energy saving and power production. Solid State Ionics 2015, 277, 11–22. [Google Scholar] [CrossRef]
- Leftheriotis, G.; Papaefthimiou, S.; Yianoulis, P.; Siokou, A. Effect of the tungsten oxidation states in the thermal coloration and bleaching of amorphous WO3 films. Thin Solid Films 2001, 384, 298–306. [Google Scholar] [CrossRef]
- Syrrokostas, G.; Bhorkar, K.; Sygellou, L.; Dracopoulos, V.; Leftheriotis, G.; Yannopoulos, S. PtSe2 outperforms Pt as a counter electrode in dye sensitized solar cells. Mater. Chem. Phys. 2023, 305, 127994. [Google Scholar] [CrossRef]
- Bogati, S.; Georg, A.; Graf, W. Photoelectrochromic devices based on sputtered WO3 and TiO2 films. Sol. Energy Mater. Sol. Cells 2017, 163, 170–177. [Google Scholar] [CrossRef]
- Boschloo, G.; Hagfeldt, A. Characteristics of the Iodide/Triiodide Redox Mediator in Dye-Sensitized Solar Cells. Accounts Chem. Res. 2009, 42, 1819–1826. [Google Scholar] [CrossRef] [PubMed]

Disclaimer/Publisher’s Note: The statements, opinions and data contained in all publications are solely those of the individual author(s) and contributor(s) and not of MDPI and/or the editor(s). MDPI and/or the editor(s) disclaim responsibility for any injury to people or property resulting from any ideas, methods, instructions or products referred to in the content. |
© 2023 by the authors. Licensee MDPI, Basel, Switzerland. This article is an open access article distributed under the terms and conditions of the Creative Commons Attribution (CC BY) license (https://creativecommons.org/licenses/by/4.0/).