Article

Study on Thermal Performance of Electric Heating System with Salt Hydrate-PCM Storage

1
School of Civil & Environmental Engineering and Geography Science, Ningbo University, Ningbo 315211, China
2
Fraunhofer Institute for Environmental, Safety and Energy Technology UMSICHT, 46047 Oberhausen, Germany
3
Healthy & Intelligent Kitchen Engineering Research Center of Zhejiang Province, Ningbo 315211, China
4
Faculty of Maritime and Transportation, Ningbo University, Ningbo 315211, China
*
Author to whom correspondence should be addressed.
Energies 2023, 16(20), 7108; https://doi.org/10.3390/en16207108
Submission received: 11 September 2023 / Revised: 4 October 2023 / Accepted: 12 October 2023 / Published: 16 October 2023

Abstract

:
An electric radiator combined with salt hydrate-phase change material (PCM) storage was developed to replace the existing scattered coal burning systems for clean heating applications. It was designed to have an average heat output of 400 W and a thermal storage efficiency of 65.6% for reducing the electricity peak load. The thermal performance was investigated experimentally and numerically by using various radiator configurations and electric heating powers, as well as three PCMs with a melting point of 58 °C (PCMI 58), 78 °C (PCMI 78) and 90 °C (PCMI 90). It was found that the radiator combined with PCMI 78 had an average heat output of 412 W, and the PCMI 78 could be completely charged within 8 off-peak hours at an electric heating power of 1270 W, in the case of the radiator external dimension L × B × H of 796 × 106 × 656 mm and the L/B ratio of 7.5. The experiment results indicated that the average room temperature could be maintained at 20.0 °C at an outdoor temperature of 5.2 °C when applying the electric radiator developed.

1. Introduction

Emissions from coal-fired heating is a leading cause of winter haze in northern China [1]. In 2021, the total building heating area in northern China amounted to 152 billion m2, and 73.5% of the energy consumption was covered by coal burning [2]. Approximately 4 billion tons of standard coal were consumed per year—and in 2016, 50% of them were from scattered coal [3]. This figure was reduced by 35.4% through scattered coal replacement programs by the end of 2021 [4]. Most existing scattered coal burning systems do not have any measures to remove smoke dust, SO2, NOx and PM2.5, resulting in PM2.5 emissions 20.9 times higher than those of coal-fired power generation [5]. These systems have been replaced by natural gas, electricity or clean coal distribution centers since 2013. Specifically, coal-to-electricity for household heating has been one of the major measures of the scattered coal replacement programs, which accounted for 38% of the total retrofitting households of about 25 million between 2017 and 2020 [4]. However, the growth of electric heating systems has resulted in a rising electricity peak demand, and consequently made a strong impact on the existent power grid. In order to shift the peak load and improve energy utilization efficiency, electric heating systems, combined with a Phase Change Material (PCM) storage, have been developed to balance the electricity supply and demand.
There are two methods to integrate a PCM storage with electric heating systems. The first method is to incorporate PCM into under-floor electric heating systems. Lin et al. [6,7] developed shape-stabilized paraffin plates with a melting temperature of 52 °C and applied them in an electric floor heating system. It was found that more than half of the total electric heat energy was shifted from the peak period to the off-peak period. Barzin et al. [8] demonstrated that the application of the underfloor heating system in combination with PCM wallboard enables very efficient energy usage. Total energy and electrical cost savings equaled to 18.8% and 28.7%, respectively. Devaux et al. [9] reported the benefits of PCM when incorporated into walls, ceilings and underfloor heating systems. Successful evening peak load shifting with an effective control of the underfloor heating system was performed over a ten day period, which allowed for s cost saving of 42% and an energy saving of 32%. Faraj et al. [10] experimentally investigated and physically analyzed the thermal performance of an underfloor electrical heating system, combined with coconut oil as PCM during winter. The results indicated that a shift in electricity consumption from peak to off-peak position was achieved and the running costs were reduced by 58.9% when compared with the reference test without PCM.
The second method is to incorporate PCM into radiators or air heat exchangers. Compared to under-floor heating systems with PCM, electric radiators based on PCM storage have the advantage in lower manufacture cost, easier installation and more flexibility. Ma et al. [6,11] integrated a phase change accumulator with a melting temperature of 79~80 °C into an electric radiator. Four electric heating tubes were used to heat PCM directly and the heat transfer was enhanced by using inner fins in the device. Chen et al. [12] developed a mathematical model of the thermal efficiency of electric radiators with PCM. The correlation between the thermal efficiency and heat loads was obtained by considering the heat loss from the radiator surface. Liu et al. [13] developed an electric radiator incorporated with a PCM, which had a high melting temperature of 576 °C, and experimentally studied its thermal performance. The results indicated that the thermal storage efficiency was 68% and the PCM temperature was maintained stable at 576 °C during the phase transition process. Conversely, Long [14] experimentally and numerically studied the heat transfer characteristics of a commercial electric radiator in combination with Mg-Fe bricks as a sensible heat storage material. The results showed that the maximum outlet air temperature of the heating device reached 136 °C, which distinctly exceed the safety value specified in the Chinese national standard. Wang et al. [15] proved that the use of multi-PCMs intensifies the charging process in comparison with the use of a single PCM. Sardari et al. integrated metal foam/PCM composites into space heating systems. They found that a reduction of almost 45% in the solidification time and a 73% enhancement in the heat retrieval rate were achieved using composite copper foam PCM compared with only using PCM [15,16]. In another study [17], they examined different aspect ratios of the heat exchanger to provide a uniform output temperature during a 16 h discharge. They also developed a compact composite aluminum foam/PCM unit that can be added to the back of current radiators. The simulation results showed that the unit could provide a constant temperature on the unit surface for almost 11 h [17,18].
The above-mentioned literature indicated that the integration of PCM into electric heating systems enables a reduction of peak loads and electricity cost compared to the systems without storage or with a sensible heat storage. However, the main challenges for efficient utilization of PCM-based systems are the long melting/solidification time, as well as inefficient releasing/gaining heat due to a low thermal conductivity of PCMs [19,20]. The most previous studies focused on the system thermal performance through simulation or experiments, but not on the evaluation of the influence factors, which would contribute to the optimization of the system design and operation conditions, as well as the improvement of system performance. Therefore, this paper aims to develop an electric radiator combined with a salt hydrate-PCM storage by investigating the influence of the radiator configuration, PCM thermal properties and electric heating power on the thermal performance. Finally, a room test was conducted to experimentally determine the heating effect of the radiator.

2. Materials and Methods

2.1. Experimental Methods and Procedures
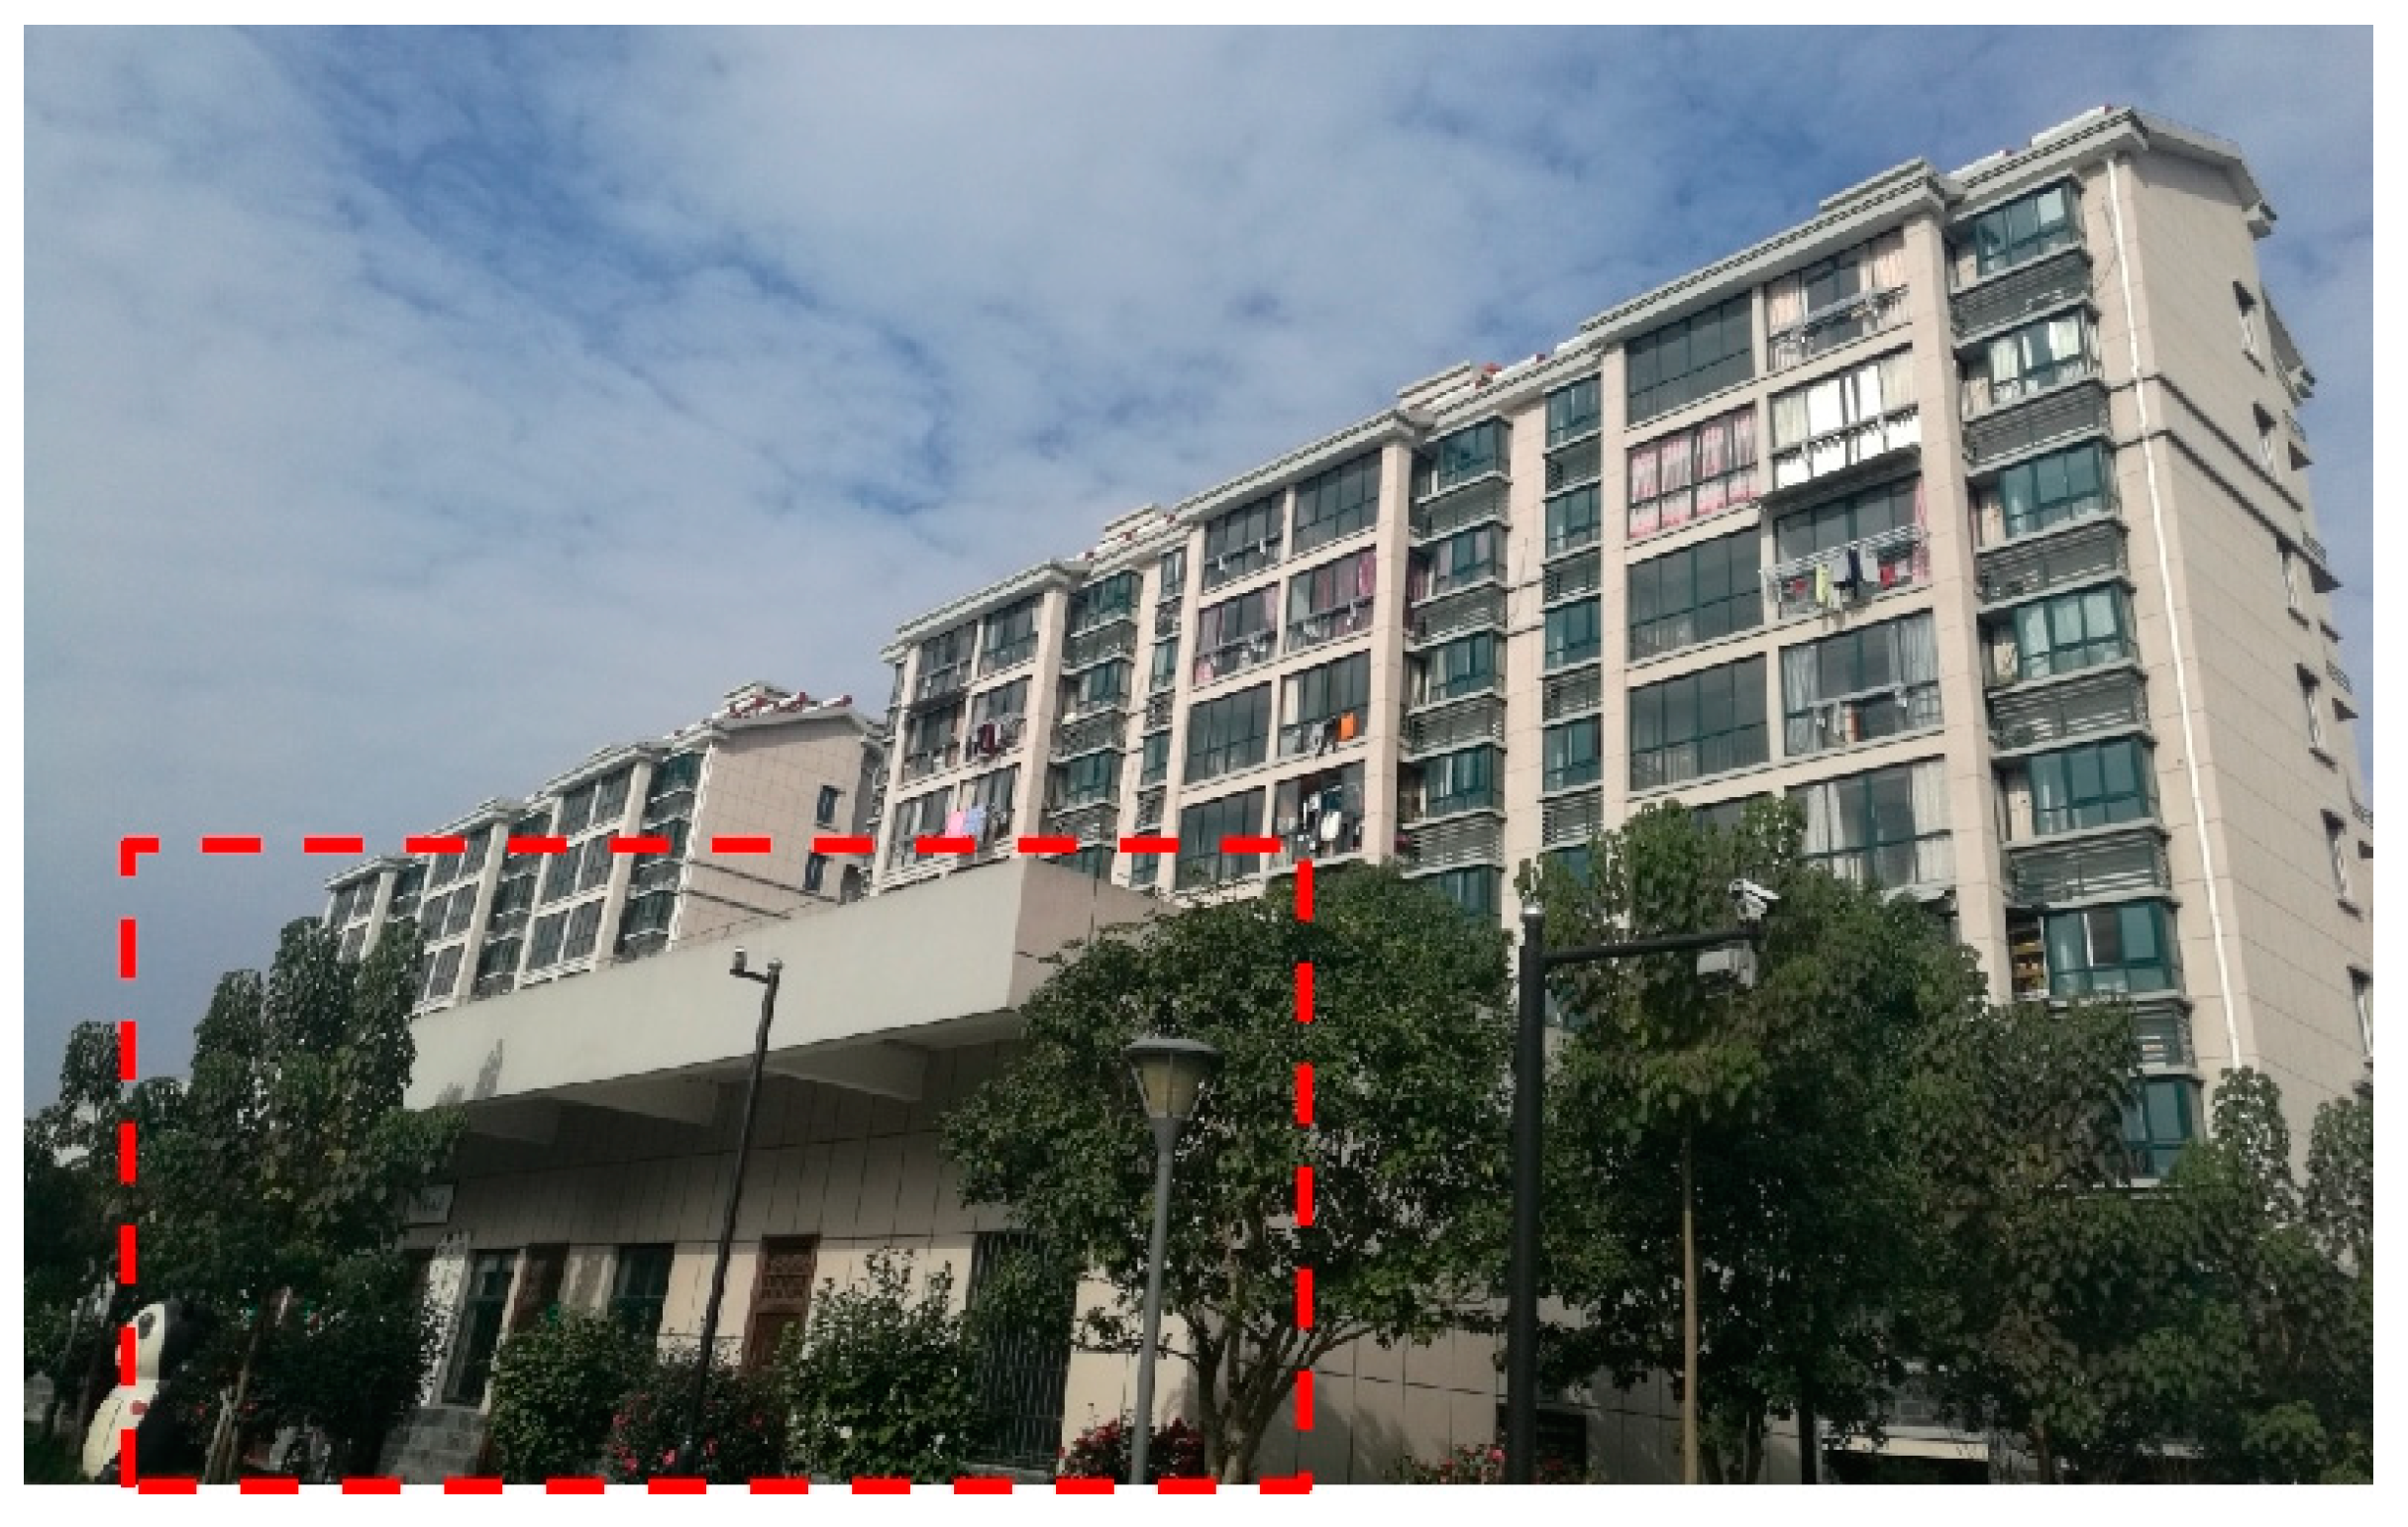
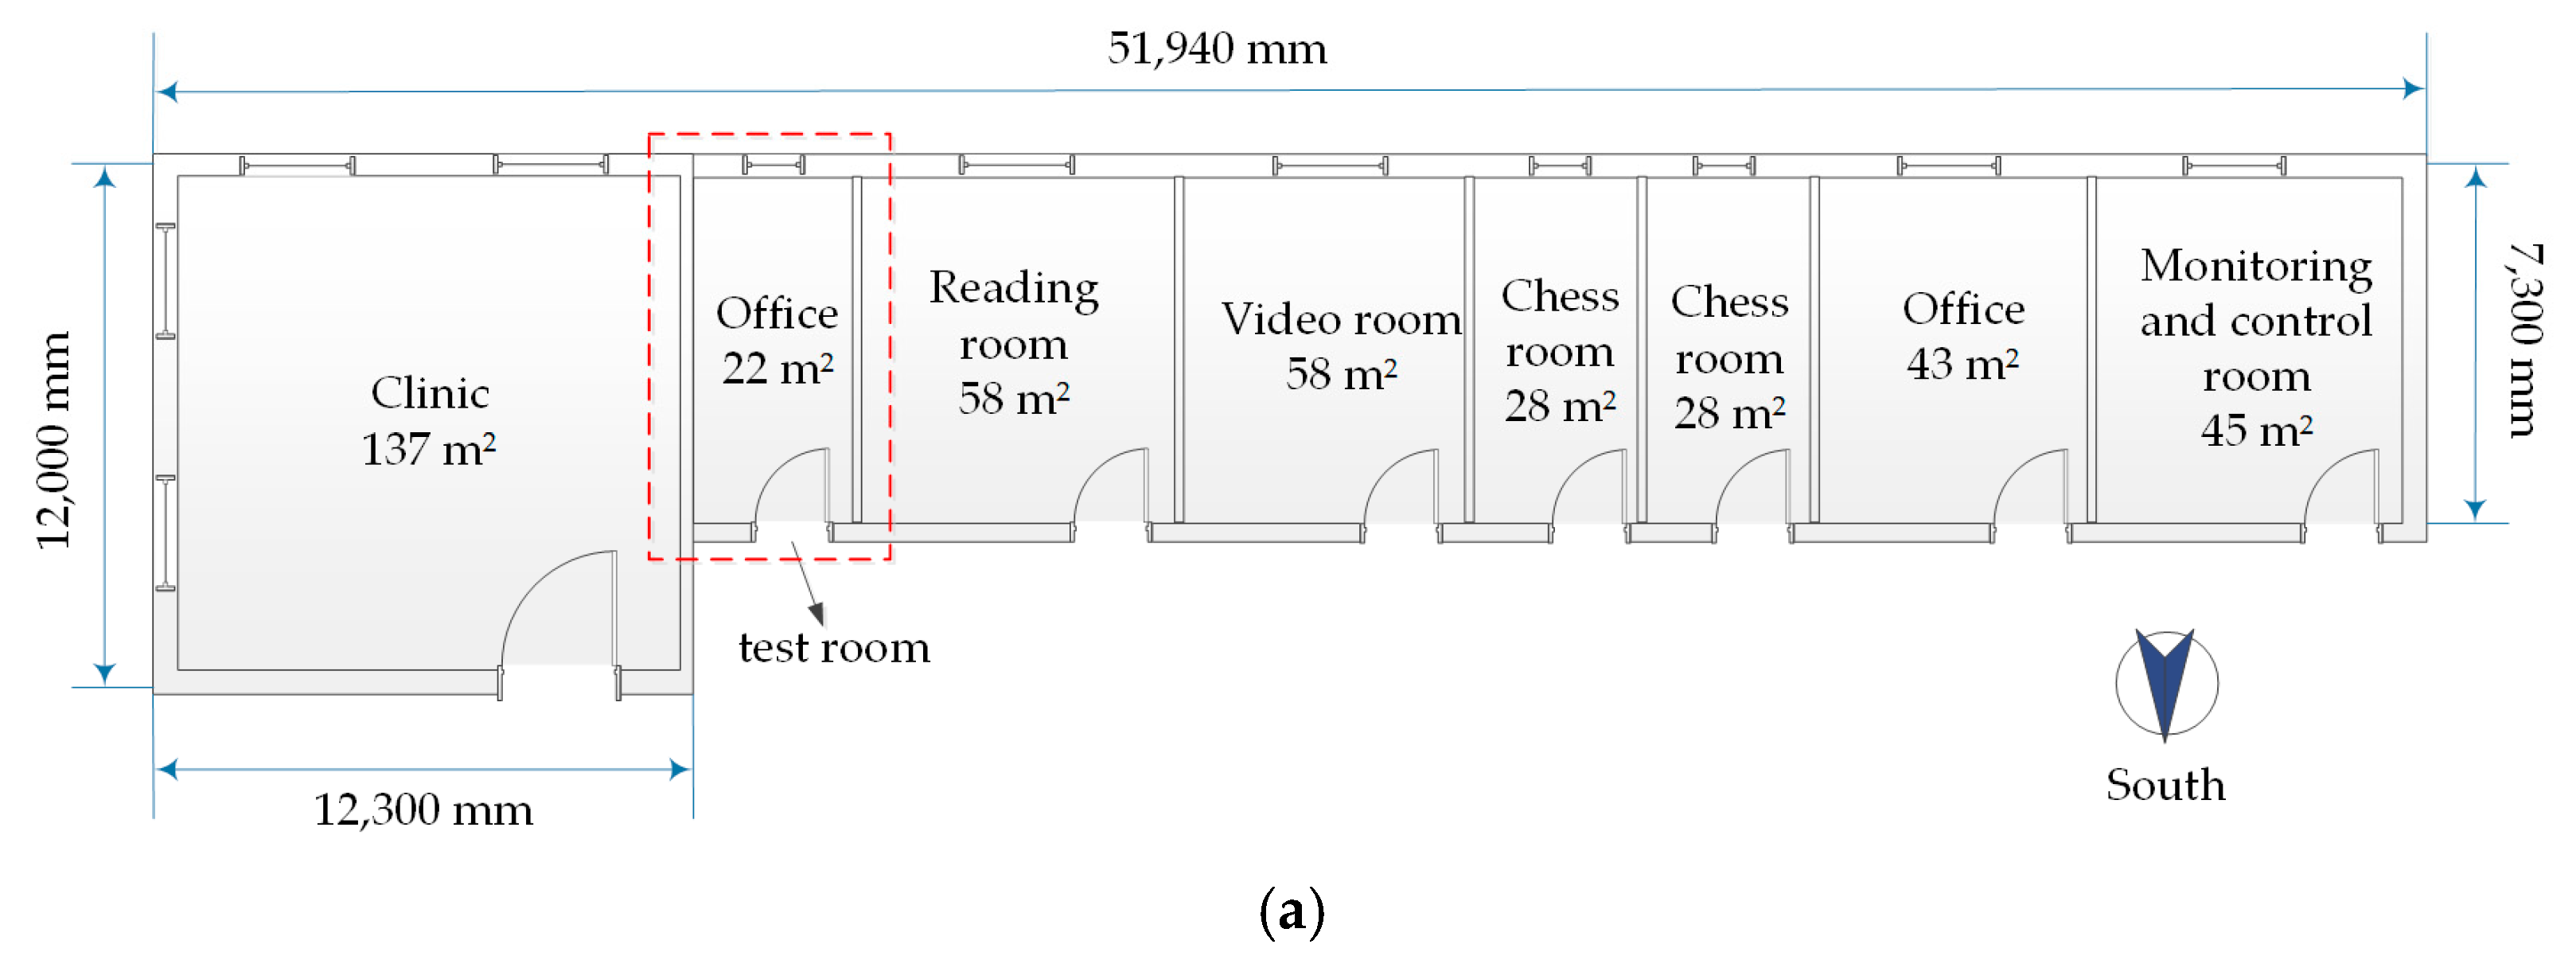
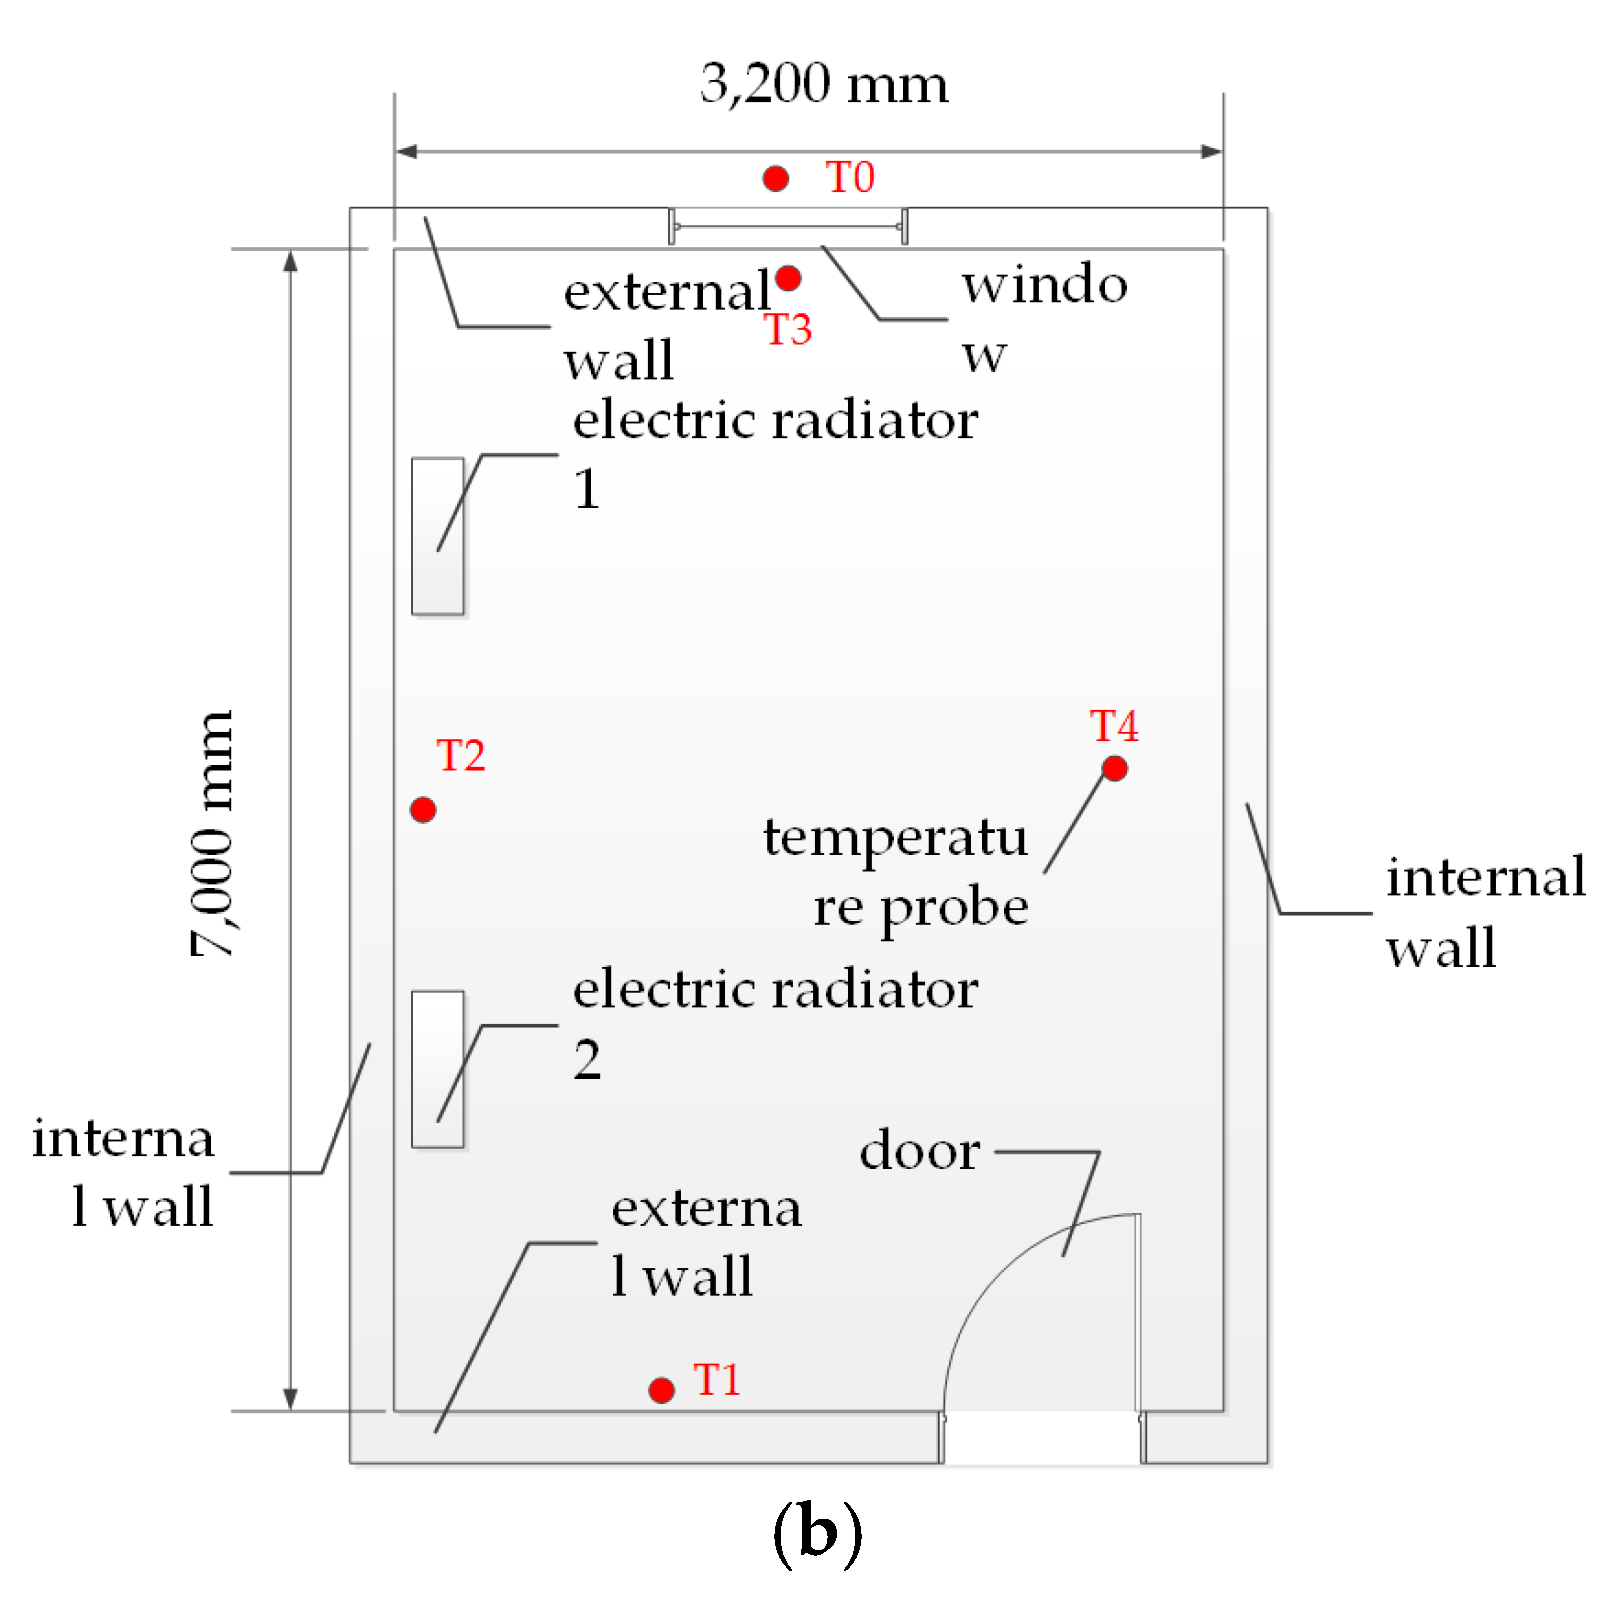
2.1.1. Room Test

The test room is located in an activity center of a residential community, as shown in Figure 1, in the city of Ningbo, China. The single-story building is oriented along the north–south axis and it is divided into eight rooms, as illustrated in Figure 2a. All rooms are heated during the winter and the office room was used for the radiator heating experiments. The room, with a usable floor area of 22 m2 and an interior height of 2.8 m, having two external walls and a window, was used for the test because its area and utilization time met the test requirements. The building was designed according to the category B buildings of “Design standard for energy efficiency of public buildings” [21], and the thermophysical parameters of this room are given in Table 1. As presented in Figure 2b, four K-type thermocouples (T1–T4) were placed in different locations inside the test room to record the indoor air temperature and one (T0) placed outside the room to measure the outdoor air temperature. The relative error of the thermocouples is ±2% of the measured value. The electricity consumption of the radiators was recorded by an ammeter.
According to the “Chinese design code for heating ventilation and air conditioning of civil buildings” (GB50736-2012) [22], the total heating load of the test room qt is obtained by using Equation (1):
q t = q e n v + q a i r = ( 1 + n ) q e n v
where qenv and qair are the heat consumption through the building envelope and air infiltration, respectively; n is a coefficient, which is 0.1 for the south-facing buildings in Ningbo according to the “Appendix G—Orientation correction factor n for cold air infiltration” of the Chinese design code GB50736-2012; and qenv can be calculated with the Equation (2) [22]:
q e n v = i = 1 n α i F i K i ( T i n T o u t )
where Fi and Ki are the area and total heat transfer coefficient of the surface i of the building envelop, respectively; α i is the correction coefficient, which is 1.0 for external walls, roof and ground; Tin is the designed indoor air temperature, which should be between 16 and 22 °C, and was set to 20 °C in this paper; and Tout is the outdoor air temperature, which was set to the average outdoor temperature of 5 °C in Ningbo during the coldest month, February. The heat transfer through the interior walls with the adjacent heated rooms was neglected. According to the calculation with Equations (1) and (2), the total heating load qt of the test room was determined to 40 W/m2.

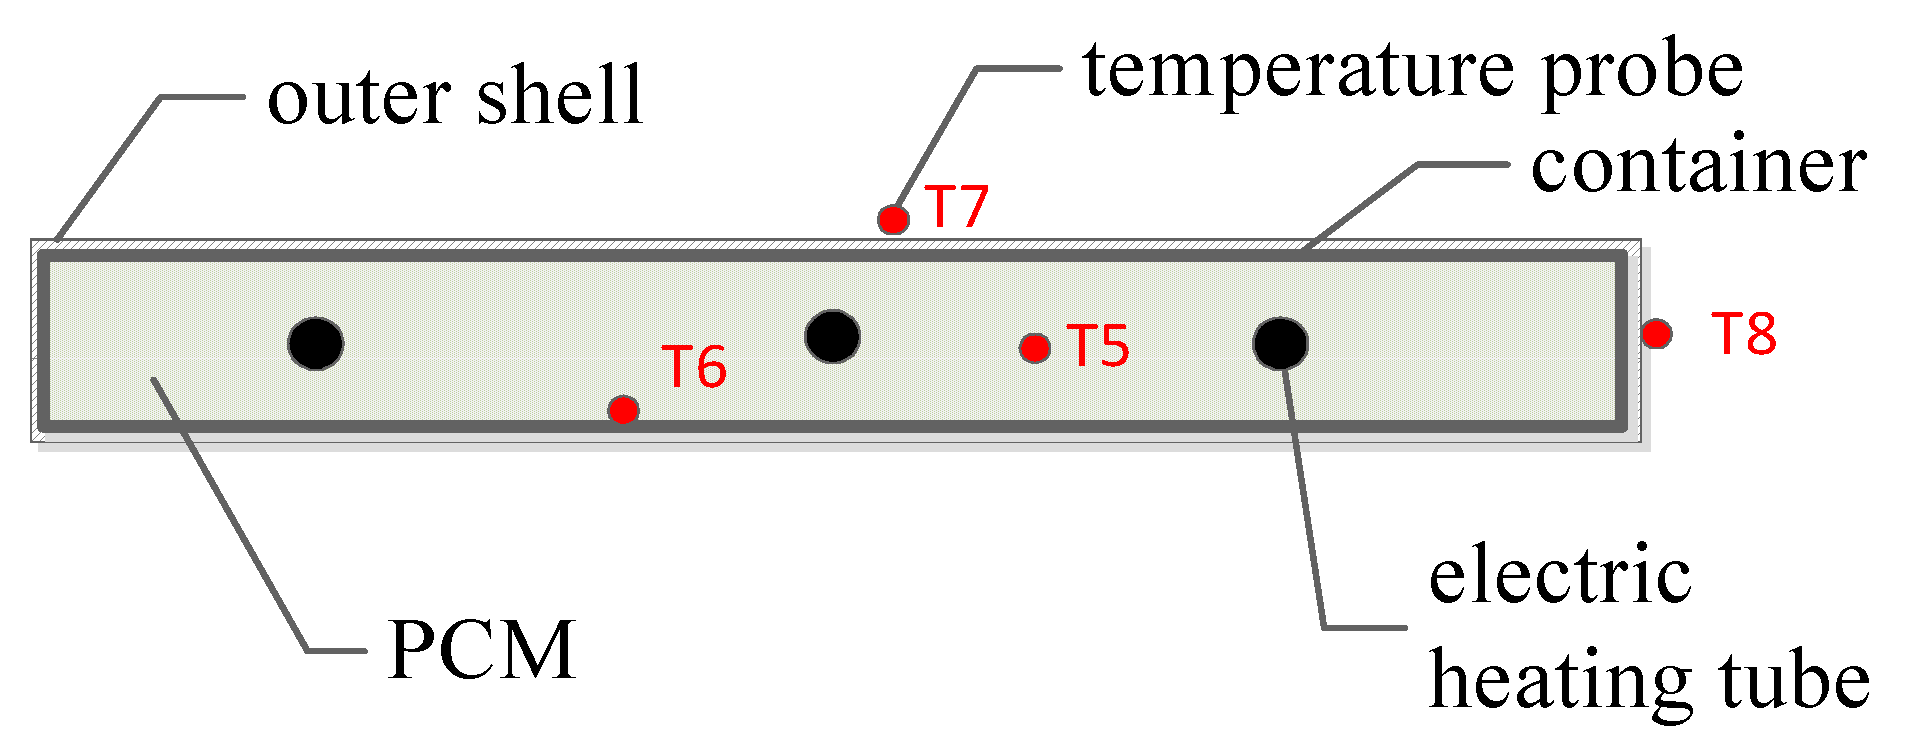
2.1.2. Electric Radiator Combined with PCM Storage

The electric radiator is composed of an outer steel shell with grids, a ceramic container filled with PCM and three electric heating tubes, as presented in Figure 3. The temperature inside the PCM (T5), on the surface of the container (T6), as well as on the front and side surface of the shell (T7) and (T8), were recorded with K-type thermocouples, as illustrated in Figure 4. The relative error of the thermocouples is ±2% of the measured value. The temperature values experimentally obtained were compared with the simulation results to verify the numerical model.
In order to take advantage of the peak-valley electricity price difference, the radiator was charged from 22:00 to 6:00 for 8 h during the off-peak time and discharged from 6:00 to 22:00 for 16 h during the on-peak time. Under ideal conditions, the heat amount Qs stored in the electric radiator would be completely released, covering 100% of the heat consumption Qon during the on-peak time, which is written as:
Q s = Q o n = q t F t o n
where qt is the 40 W/m2 total heating load of the test room, ton is the on-peak time of 16 h, F indicates the heating floor area and was set to 10 m2. The heat stored in the radiator was calculated to be 23,040 kJ with the designed heat output of 400 W.
The thermal storage efficiency η of the electric radiator is defined as the ratio between the stored heat amount Qs and the total electrical heat input Qe by the heating tubes:
η = Q s Q e = Q s P t o f f
where toff is the off-peak time of 8 h. Therefore, the heating power P of the electric heating tubes can be obtained by using the following equation:
P = q t F t o n η t o f f
Since the electric radiator was designed to be charged for 8 h and provide heating for 24 h, the ideal thermal storage efficiency is 66.7%, which corresponds to an electric heating power of 1200 W. In practical applications, the heat stored in the radiator could not be completely released for heating; hence, the heating power would be higher than 1200 W.

2.1.3. Selection of Salt Hydrates

The PCM used for electric radiators should have a melting temperature between 55 °C and 100 °C. Paraffin, fatty acids and salt hydrates could be suitable for this application. However, paraffins and fatty acids are usually more expensive than salt hydrates. The low cost and easy availability of salt hydrates make them commercially attractive for heat storage applications. Furthermore, salt hydrates have a sharp melting point to maximize the efficiency of a heat storage system and a high heat of fusion to decrease the required size of the storage system [23]. Therefore, three commercial salt hydrates were selected for the study, namely PCMI 58, PCMI 78 and PCMI 90, provided by Lidy Energy Technology Co., Ltd. (Ningbo, China) [24]. Table 2 presents their specific heat, thermal conductivity and density, as well as their melting temperature and enthalpy, which were determined with a three-layer calorimeter developed by the company w&a wärme-und anwendungstechnische Prüfungen in Germany [25], as illustrated in Figure 5.
The heat stored in the electric radiator Qs consists of that stored in the shell Qshell, in the vessel Qvessel and in the PCM QPCM:
Q s = Q s h e l l + Q v e s s e l + Q P C M
Therefore, the mass of the PCM can be obtained by using Equation (7):
m P C M = Q P C M H = Q s Q s h e l l Q v e s s e l H = q t F t o n m s h e l l c s h e l l Δ T s h e l l m v e s s e l c v e s s e l Δ T v e s s e l H
where H is the total enthalpy of the PCM, mshell, cshell and ΔTshell are the mass, specific heat and temperature change of the shell, respectively, mvessel, cvessel and ΔTvessel are the mass, specific heat and temperature change of the vessel, respectively. Calculated with PCMI 78 as PCM, the mass was determined to be 96 kg for the electrical radiator.

2.2. Numerical Method and Model Validation

2.2.1. Governing Equations and Boundary Conditions

In the numerical simulation, the following assumptions were considered:
  • the PCM is homogeneous and isotropic;
  • the phase change temperature of the PCM is constant, ignoring the volume change during the charging/discharging process and the phenomenon of subcooling;
  • the melted PCM is an incompressible fluid;
  • the thermophysical properties of the PCM in the solid phase and in the liquid phase are constant, and they are independent of the temperature.
Based on the assumptions, a fixed-grid enthalpy-porosity method was used for modeling the solidification/melting process [26,27,28]. For the domain of the PCM, the energy equation is written as:
t ( ρ H ) + ( ρ v H ) = ( λ T ) + S
where ρ , H and λ are the density, total enthalpy and effective thermal conductivity of the PCM, respectively; T is the temperature; v is the fluid velocity; and S is a source term. The total enthalpy H of the PCM is computed as the sum of the sensible enthalpy h and the latent enthalpy Δ H :
H = h + Δ H
h = h r e f + T r e f T c p d T
where href and Tref are the reference enthalpy and reference temperature, respectively; cp is the specific heat of the PCM at constant pressure; and the latent enthalpy Δ H can now be written in terms of the latent heat of the material L:
Δ H = χ L
The latent heat content can vary between zero (for a solid) and L (for a liquid). The liquid fraction χ of the PCM is defined as:
χ = 0   if   T < T f χ = 0   if   T > T m χ = T T s T m T s   if   T f < T < T m
where Tf and Tm are the freezing and melting temperature of the PCM, respectively.
The PCM is regarded as a porous medium during the solid–liquid phase transition. The porosity in each cell is set equal to the liquid fraction in that cell. In fully solidified regions, the porosity is equal to zero, which extinguishes the velocities in these regions. The momentum sink S in Equation (8), due to the reduced porosity in the mushy zone, takes the following form:
S = ( 1 χ ) 2 ( χ 3 + 0.001 ) C m u s h ( v v p )
where 0.001 is used as a small number to prevent division by zero, Cmush is the mushy zone constant, and v p is the solid velocity due to the pulling of solidified material out of the domain (also referred to as the pull velocity).
For the domain of the electric radiator, heat is transferred to the indoor air by convection and radiation through the shell surfaces, and the heat output power qr has the general form of:
q r = i = 1 6 F i K i ( T w i T a i r )
where Fi and Ki are the area and total heat transfer coefficient of the shell surface i of the radiator, respectively; and Twi and Tair are the temperature of the shell surface i and indoor air, respectively. The total heat transfer coefficient Ki is the sum of the convective coefficient Kic and radiation coefficient Kir:
K i = K i r + K i c
The radiation coefficient Kir can be calculated by the following equation:
K i r = ε σ 0 ( T w i 4 T a i r 4 ) T w i T a i r
where ε denotes the emissivity of the shell surfaces and was set to be 0.92 for painted surfaces [29], σ 0 is the Stefan–Boltzmann constant and has a value of 5.76 × 10⁻⁸ W/(m2·K4).
The convective coefficient Kic has the form of Equation (17) for the front, side and back outer surfaces [29]:
K i c , 1 = 1.42 ( Δ T l ) 1 / 4
For the bottom surface [29]:
K i c , 2 = 0.66 ( Δ T l ) 1 / 4
For the top surface [29]:
K i c , 2 = 1.32 ( Δ T l ) 1 / 4
where Δ T is the temperature difference between the radiator shell and ambient air, l is the characteristic size of a rectangular flat plate and can be obtained with the long side L and short side B:
l = 1 1 L + 1 B
FLUENT 2021 R2 was used as the simulation software. The transient solver was applied to simulate the thermal performance of the electric radiator during the charging and discharging process. The laminar flow model was chosen for the liquid PCM, because there are very slow flows induced by natural convection. The indoor air temperature and the initial temperature of the radiator were set to be 293 K and 300 K, respectively. The convergence criteria for flow and energy were set to 10−6 and 10−9, respectively. Figure 6 displays the entire computational mesh, showing meshes on the shell and vessel with a size of 10 mm, as well as those on the PCM with 4 mm. It includes 836,542 cells with the dense mesh on PCM to capture the effect of phase transition.
Different cell sizes were also studied for the grid independence analysis and the results are presented in Table 3. The same melting and freezing time were obtained with 836,542 and 1,932,417 elements for the number of cells. Therefore, 836,542 elements were selected for the grid size.
Two time-steps of 900 s and 1800 s for the grid size of 836,542 cells were studied. No significant variation was found during the charging and discharging process. Therefore, 1800 s was selected for the time step size.

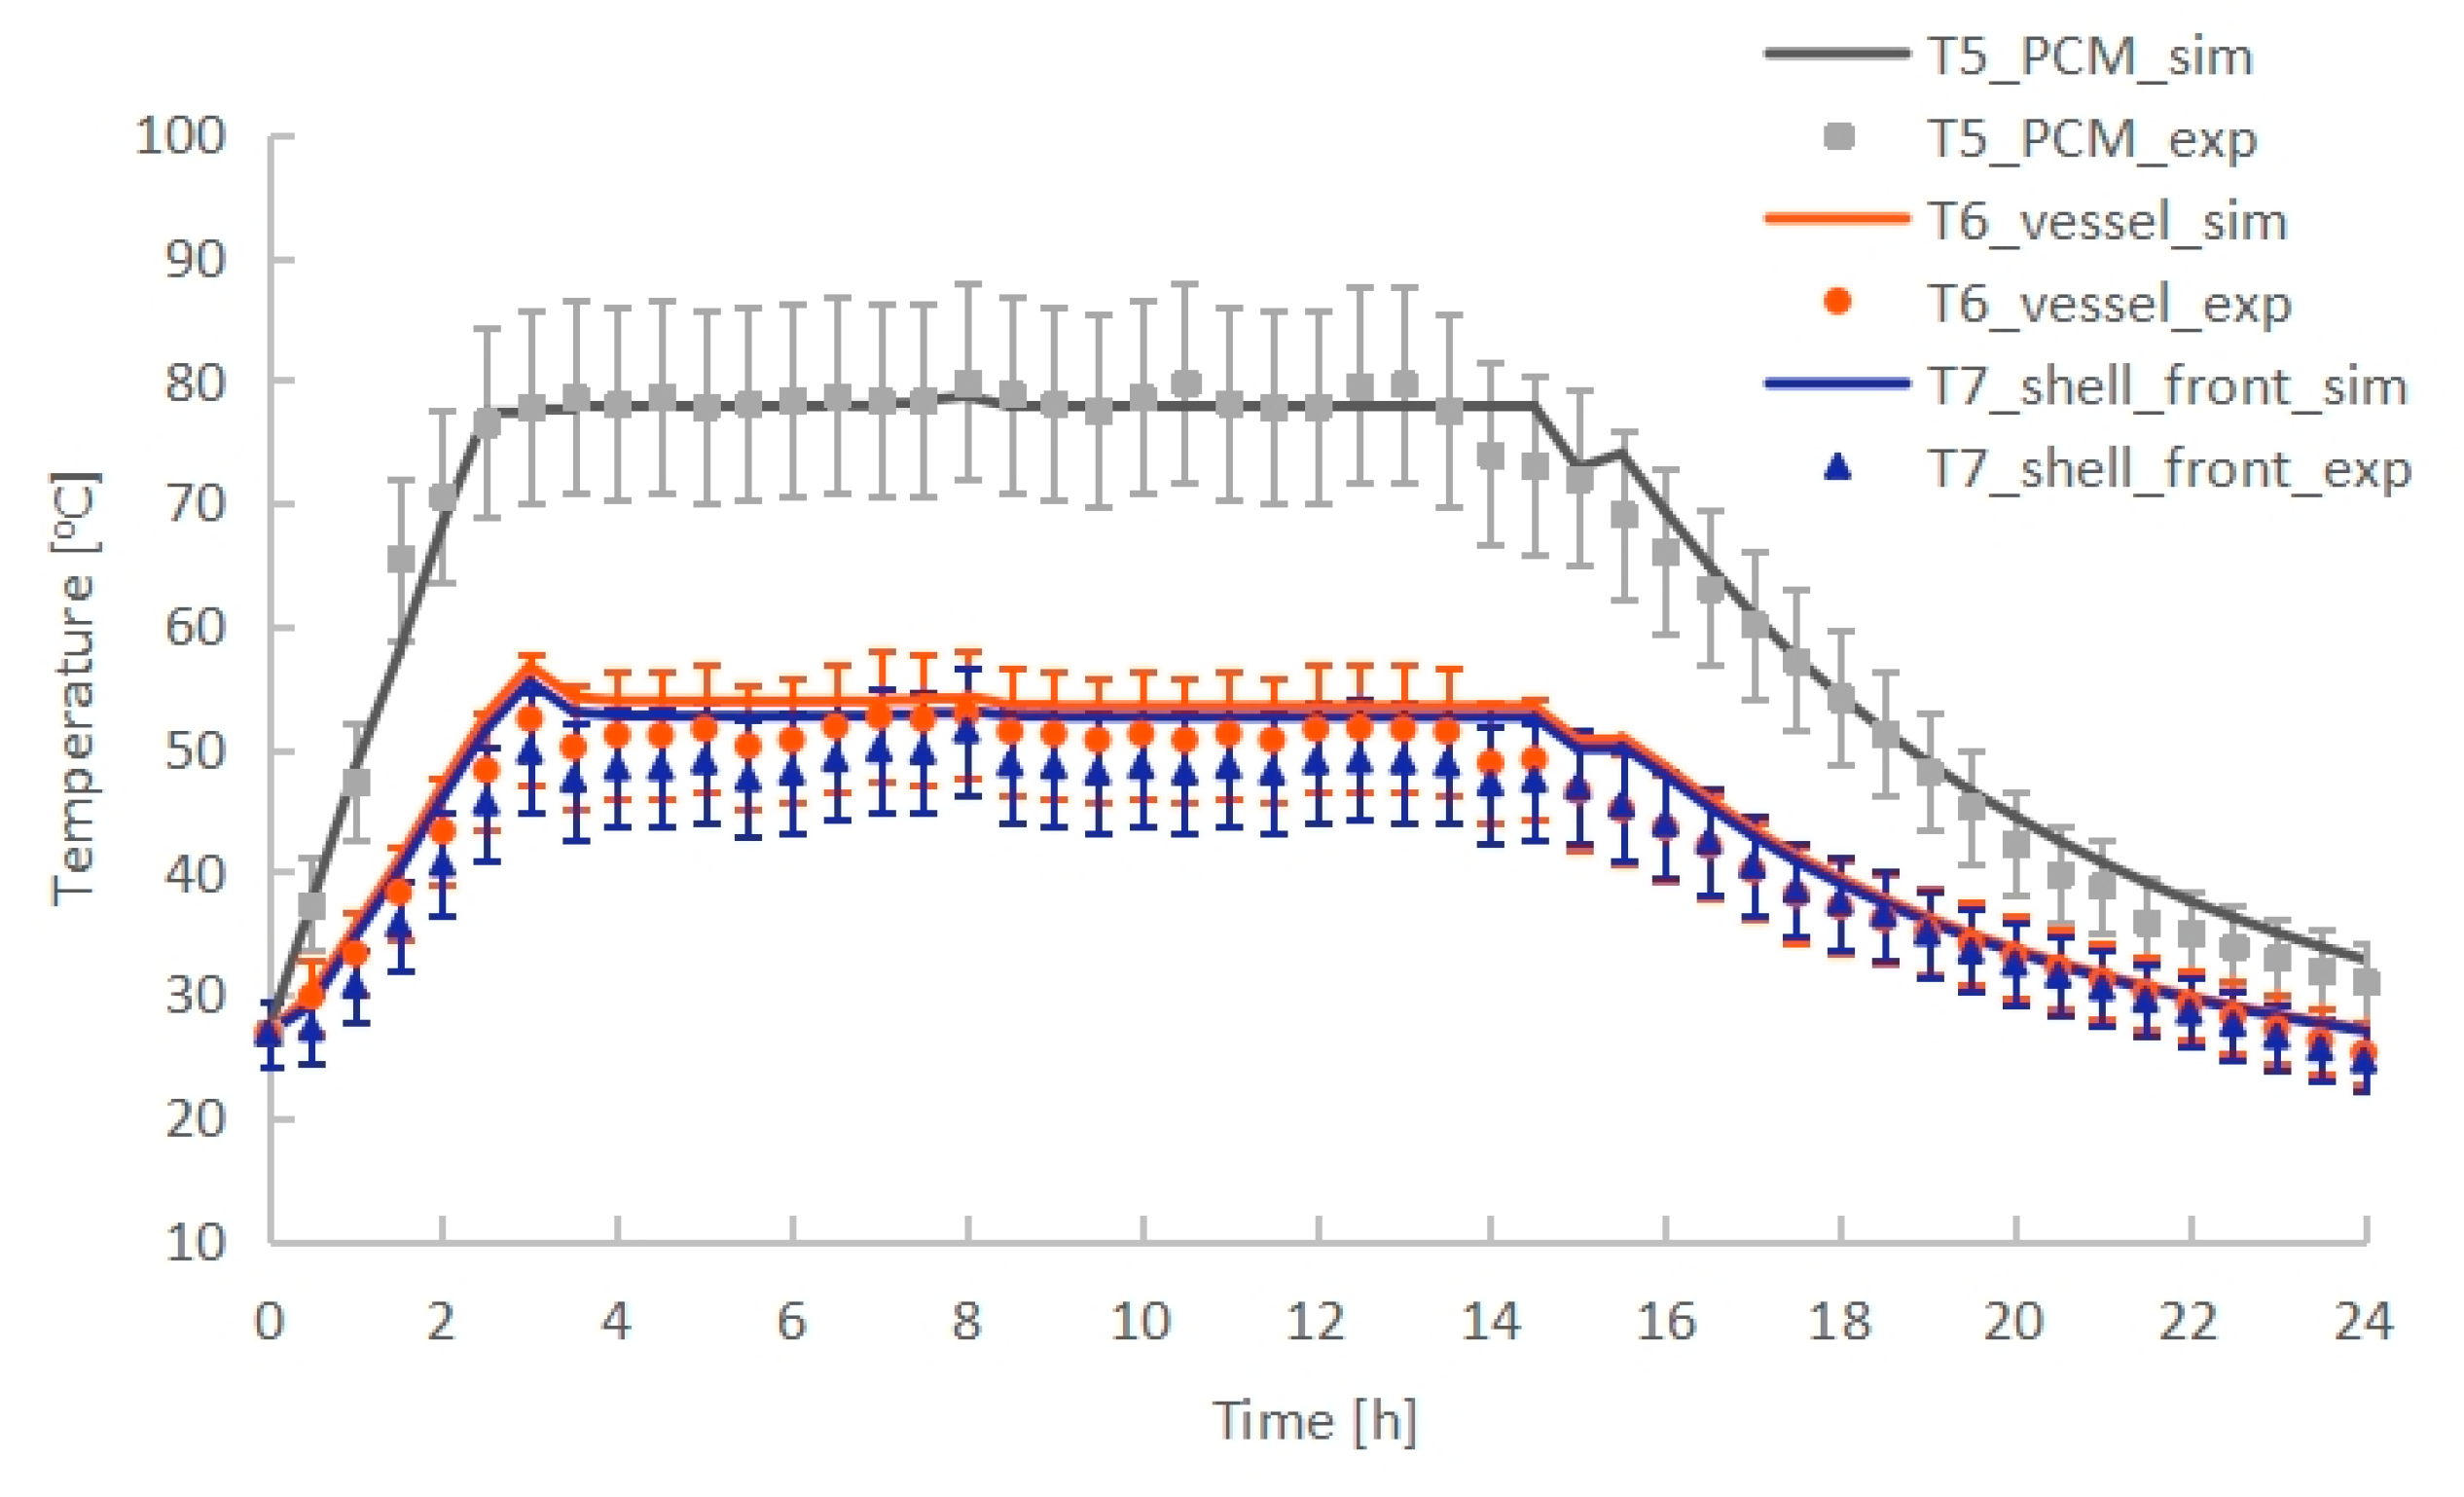
2.2.2. Model Validation

To verify the numerical model of the electric radiator, the simulation results were compared with the experimental values obtained with the set-up shown in Figure 3. The salt hydrate used was PCMI 78. Figure 7 shows the numerical prediction and experimental temperature of the PCM (T5), vessel (T6) and shell front surface (T7), respectively. The numerical results were mostly within the ±10% relative error of the experimental values.
Two indices which have a wide application in model validation were introduced to evaluate the models’ accuracy. They are the mean bias error (MBE) and the coefficient of root-mean-square error (Cv(RMSE)). MBE and Cv(RMSE) can be calculated by Equations (21) and (22), as follows [30]:
M B E ( % ) = i = 1 N ( C i , m e a s u r e d C i , s i m u l a t e d ) i = 1 N ( C i , m e a s u r e d )
C v ( R M S E ) ( % ) = ( i = 1 N ( C m e a s u r e d C s i m u l a t e d ) 2 / N ) C ¯ m e a s u r e d
where Ci,measured and Ci,simulated are the measured and simulated data for the instance i, respectively; N is the number of data points; and C ¯ m e a s u r e d is the average value of all measured data.
A positive value of MBE indicates that the simulation result is higher than the experimental data and vice versa, while the Cv(RMSE) is a measurement of how close the simulated value is to the experimental output. As indicated in ASHRAE Guideline 14, if the MEB and Cv(RMSE) of a simulation model are lower than 10% and 30% when using hourly data, respectively, it is deemed to be acceptable in accuracy [30]. Table 4 shows that both indices are within the regulated values of ASHRAE standard. Therefore, the numerical model is valid and could be used for further simulation.

3. Results

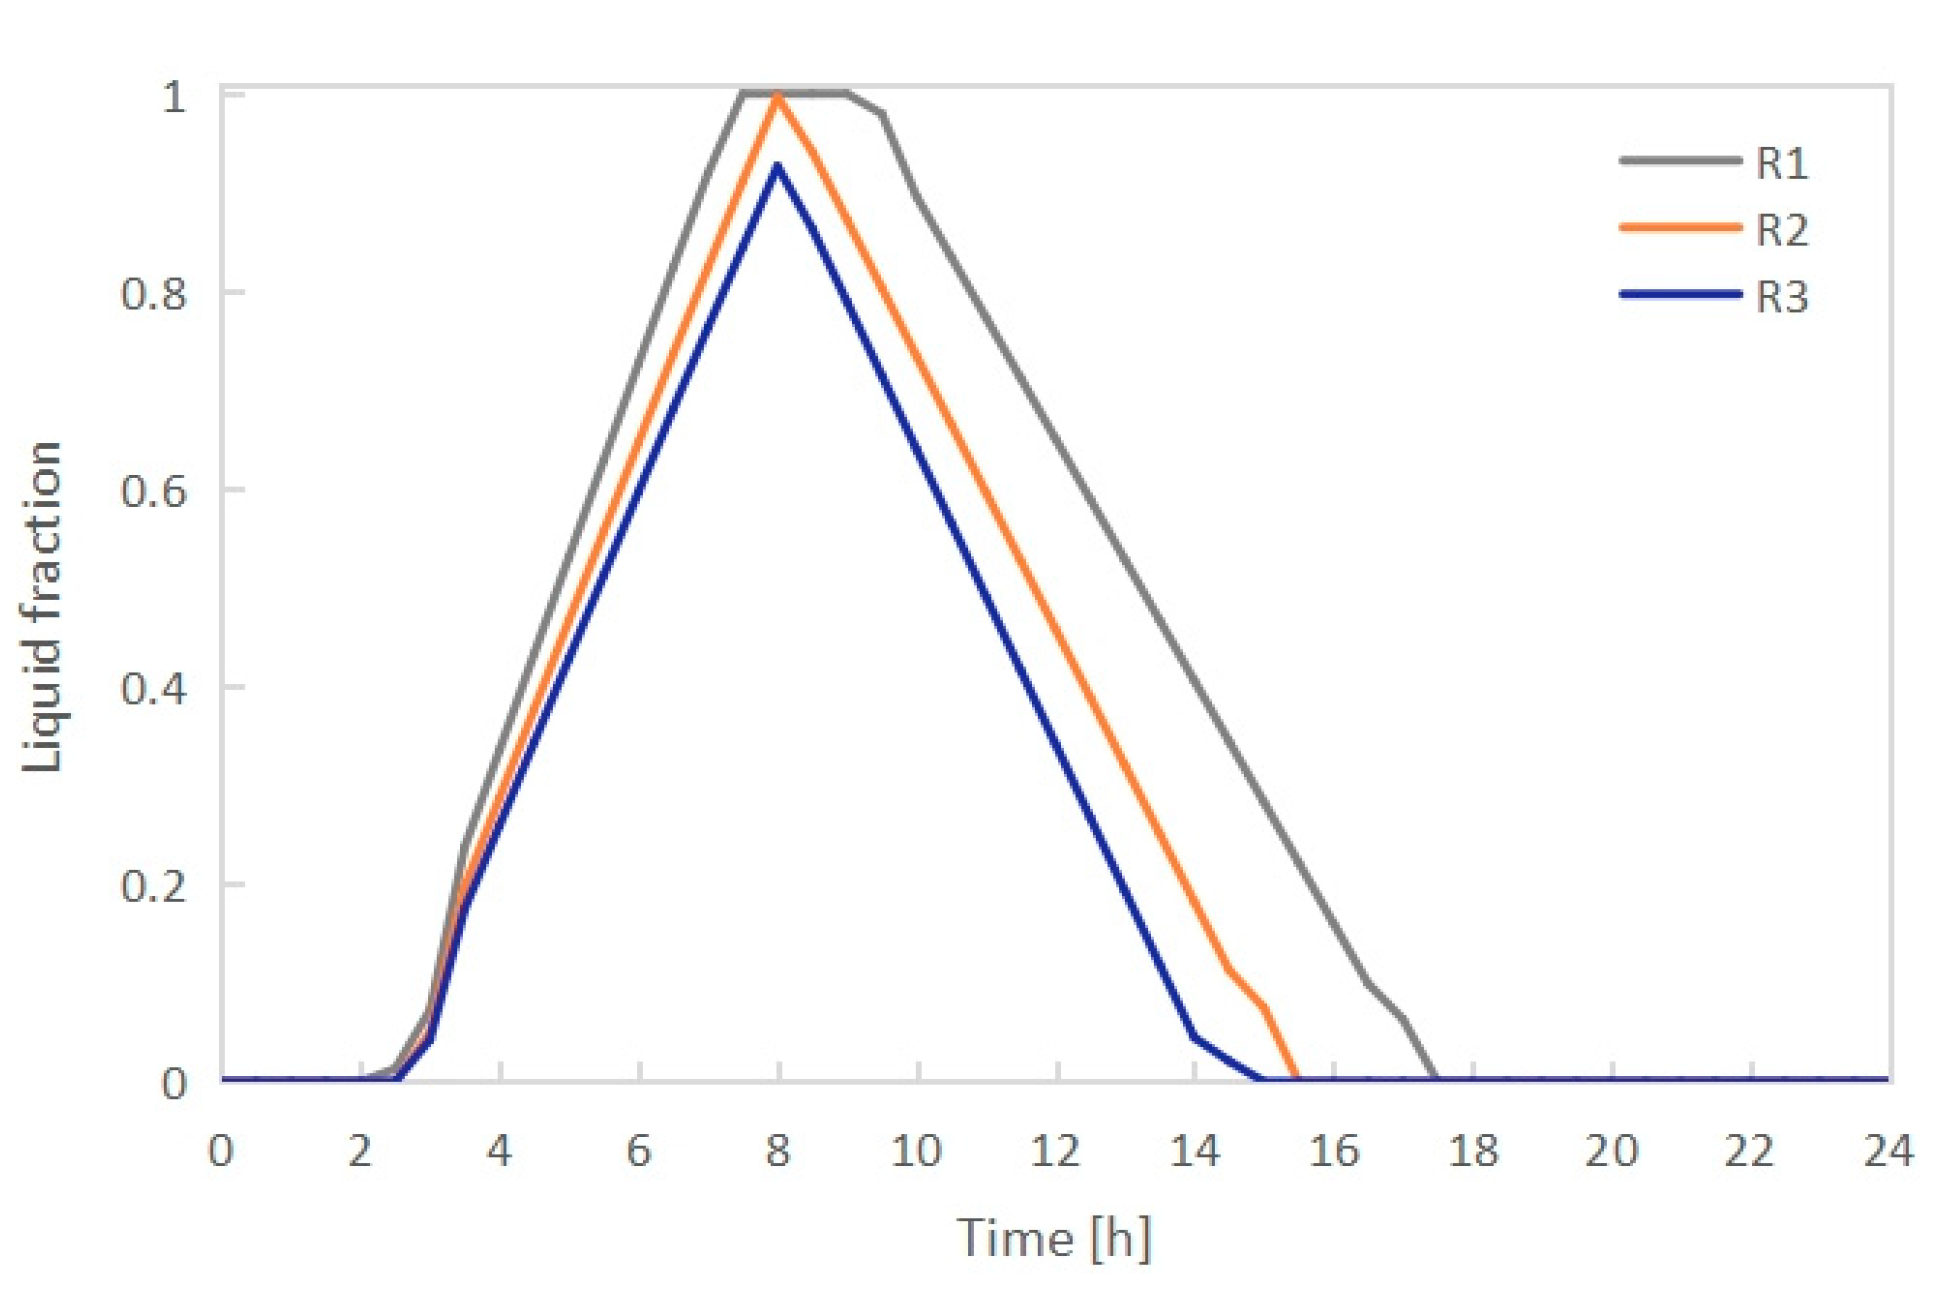
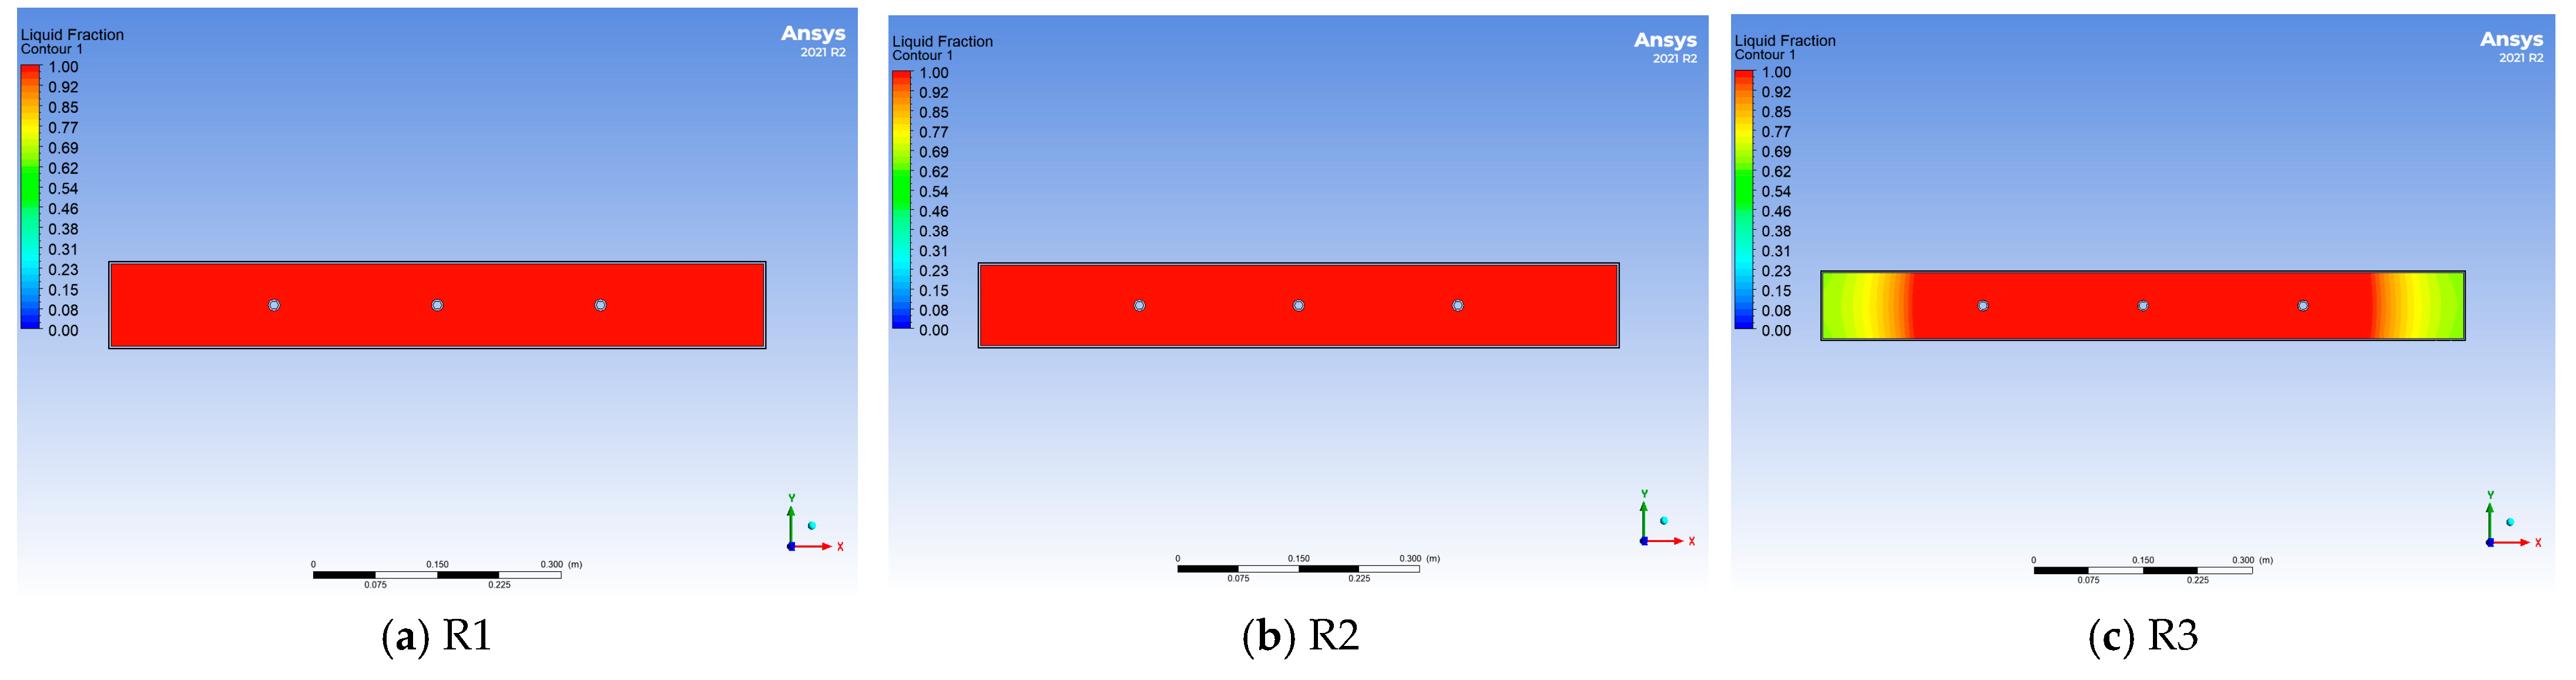
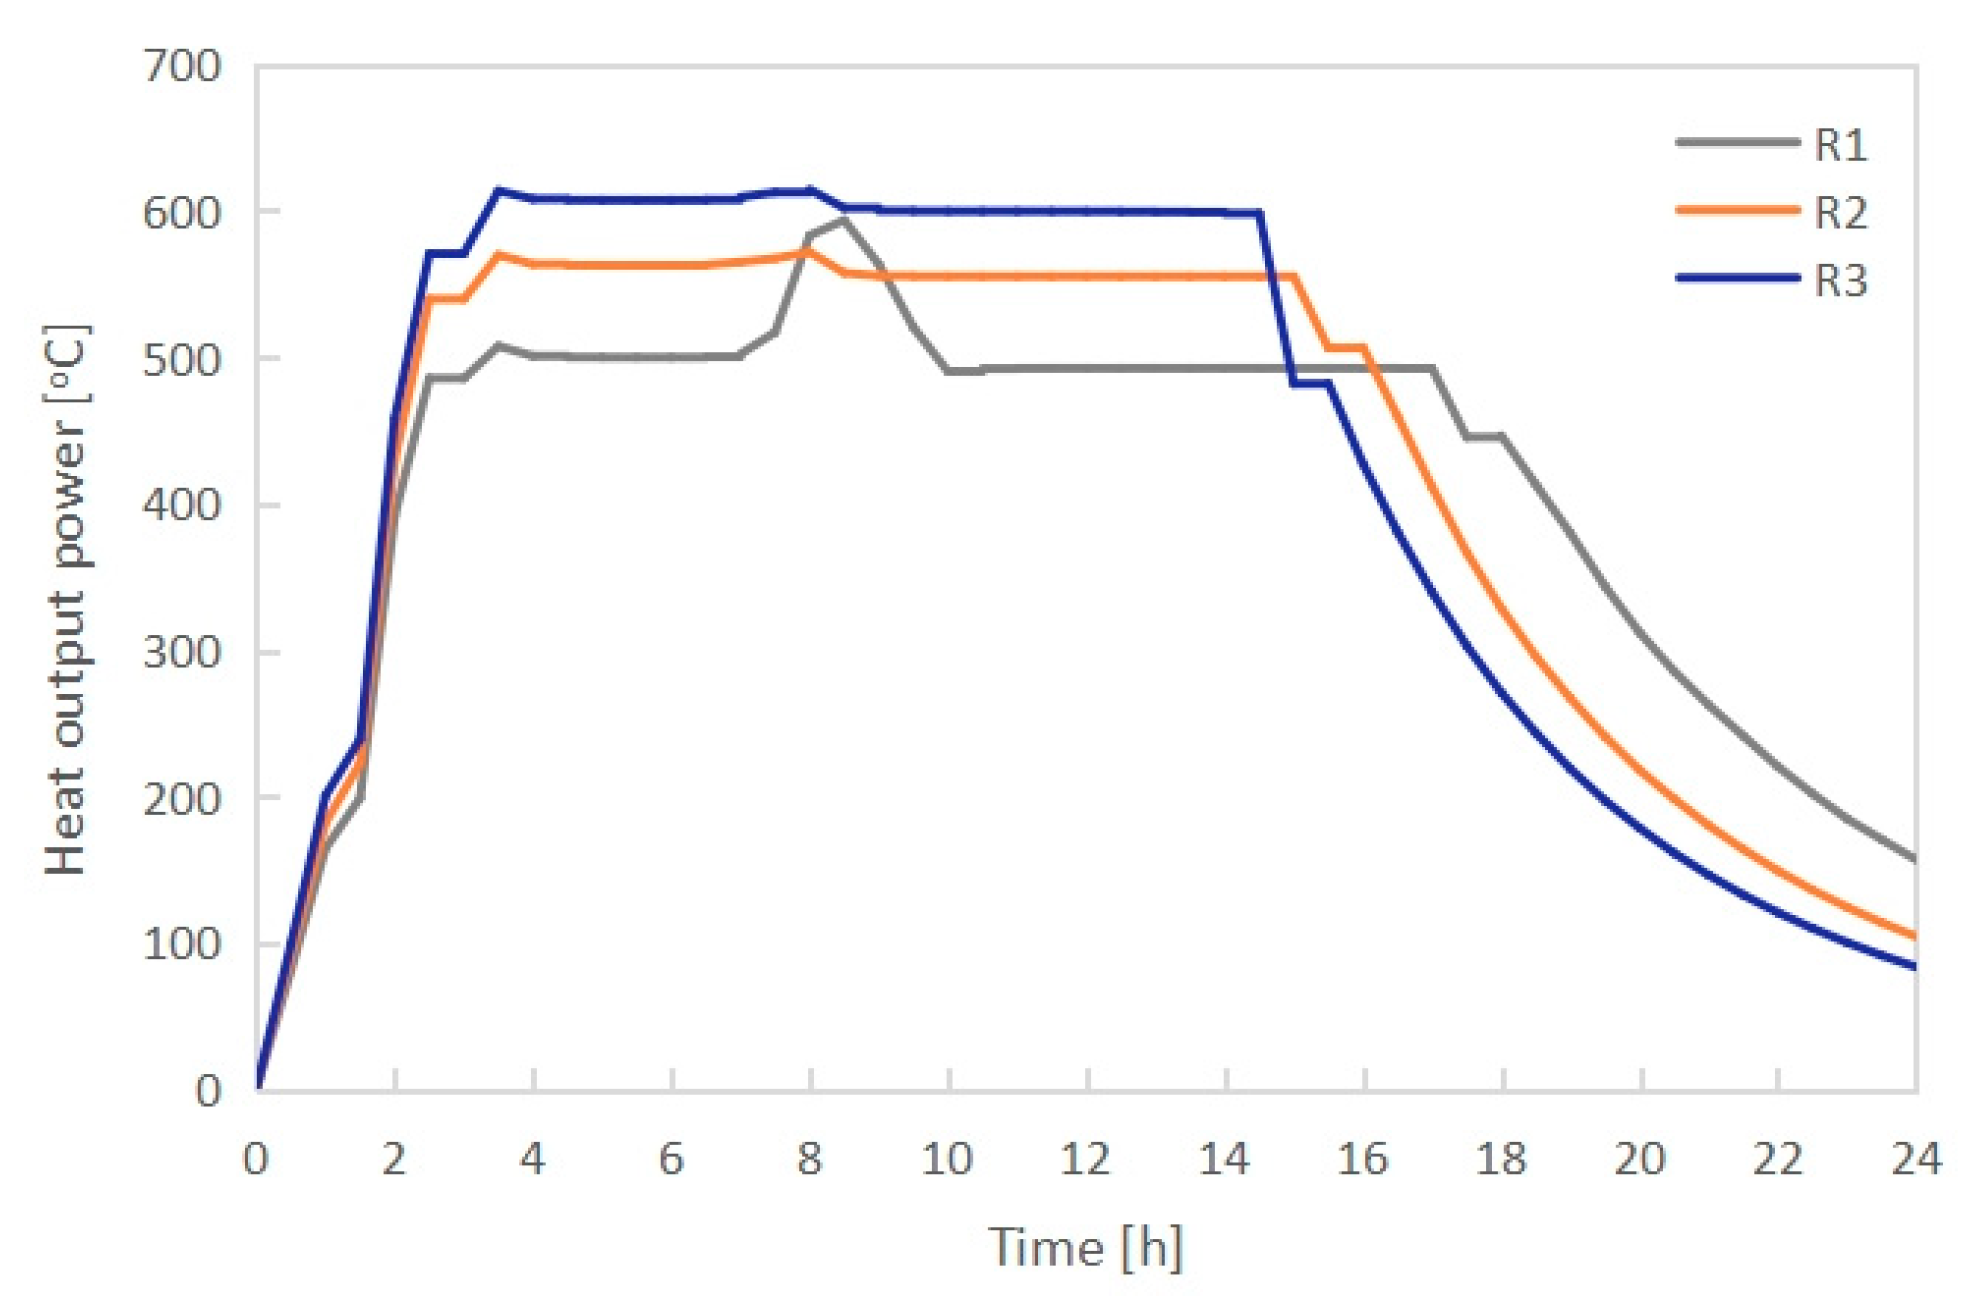
3.1. Effect of Radiator Configuration

The mass of PCMI 78 used in the electric radiator was determined to be 96 kg, according to the above-mentioned calculation. For a given volume of PCM, the radiator configuration has an important influence on its thermal performance. In this section, the effect of the length–width ratio (L/B) of the radiator cross-section was studied when keeping the height unchanged. Table 5 shows the three different radiator configurations R1, R2 and R3, with an increasing L/B ratio and a decreasing characteristic size l for determining the convective coefficient of the shell outer walls, according to Equation (20).
Figure 8 shows the definition of the heating, melting, freezing and cooling time of the PCM during the charging and discharging process, which were used for the comparison of the thermal performance under different conditions. The temperature and the liquid fraction of PCMI 78 incorporated into the radiators R1, R2 and R3 during the charging and discharging process are illustrated in Figure 9 and Figure 10. It was found that the melting time increased with growing L/B ratio because the PCM temperature rose to reach the melting point more slowly, as the distance from the electric heating tubes increased. During the charging process, PCMI 78 in the R1 radiator was completely melted after 7.5 h of heating and the temperature rose quickly to 87.4 °C; PCMI 78 in the R2 radiator was totally melted after 8.0 h of heating and the temperature was kept at 78.7 °C; while only 92.7% of PCMI 78 in the R3 radiator was melted after 8.0 h of heating because the material near the end of the long sides still underwent the phase transition from solid to liquid, as shown in Figure 11. Therefore, PCMI 78 had a reduced freezing time in the R3 radiator than in the others.
Figure 12 presents the heat output power of the electric radiators R1, R2 and R3 during the charging and discharging process. The heat output increased with the rising temperature of PCMI 78, then maintained stable during the phase transition process and finally dropped rapidly after freezing. The average heat output of the electric radiator rose slightly with increasing L/B ratio, namely with the decreasing characteristic size l. The reason was that the convective coefficient Kic of the radiator shell increases as the characteristic size l gets smaller, according to Equations (17)–(19), which leads to the growth in the heat transfer rate between the radiator and indoor air. Therefore, the average heat output was 409 W, 412 W and 418 W for the R1, R2 and R3 configuration, respectively. Since the designed heat output of the radiator is 400 W, the R2 radiator—with its external dimensions of 796 × 106 × 656 mm and an L/B ratio of 7.5—presented the best thermal performance in consideration of both the PCM melting/freezing behaviors and heat output.

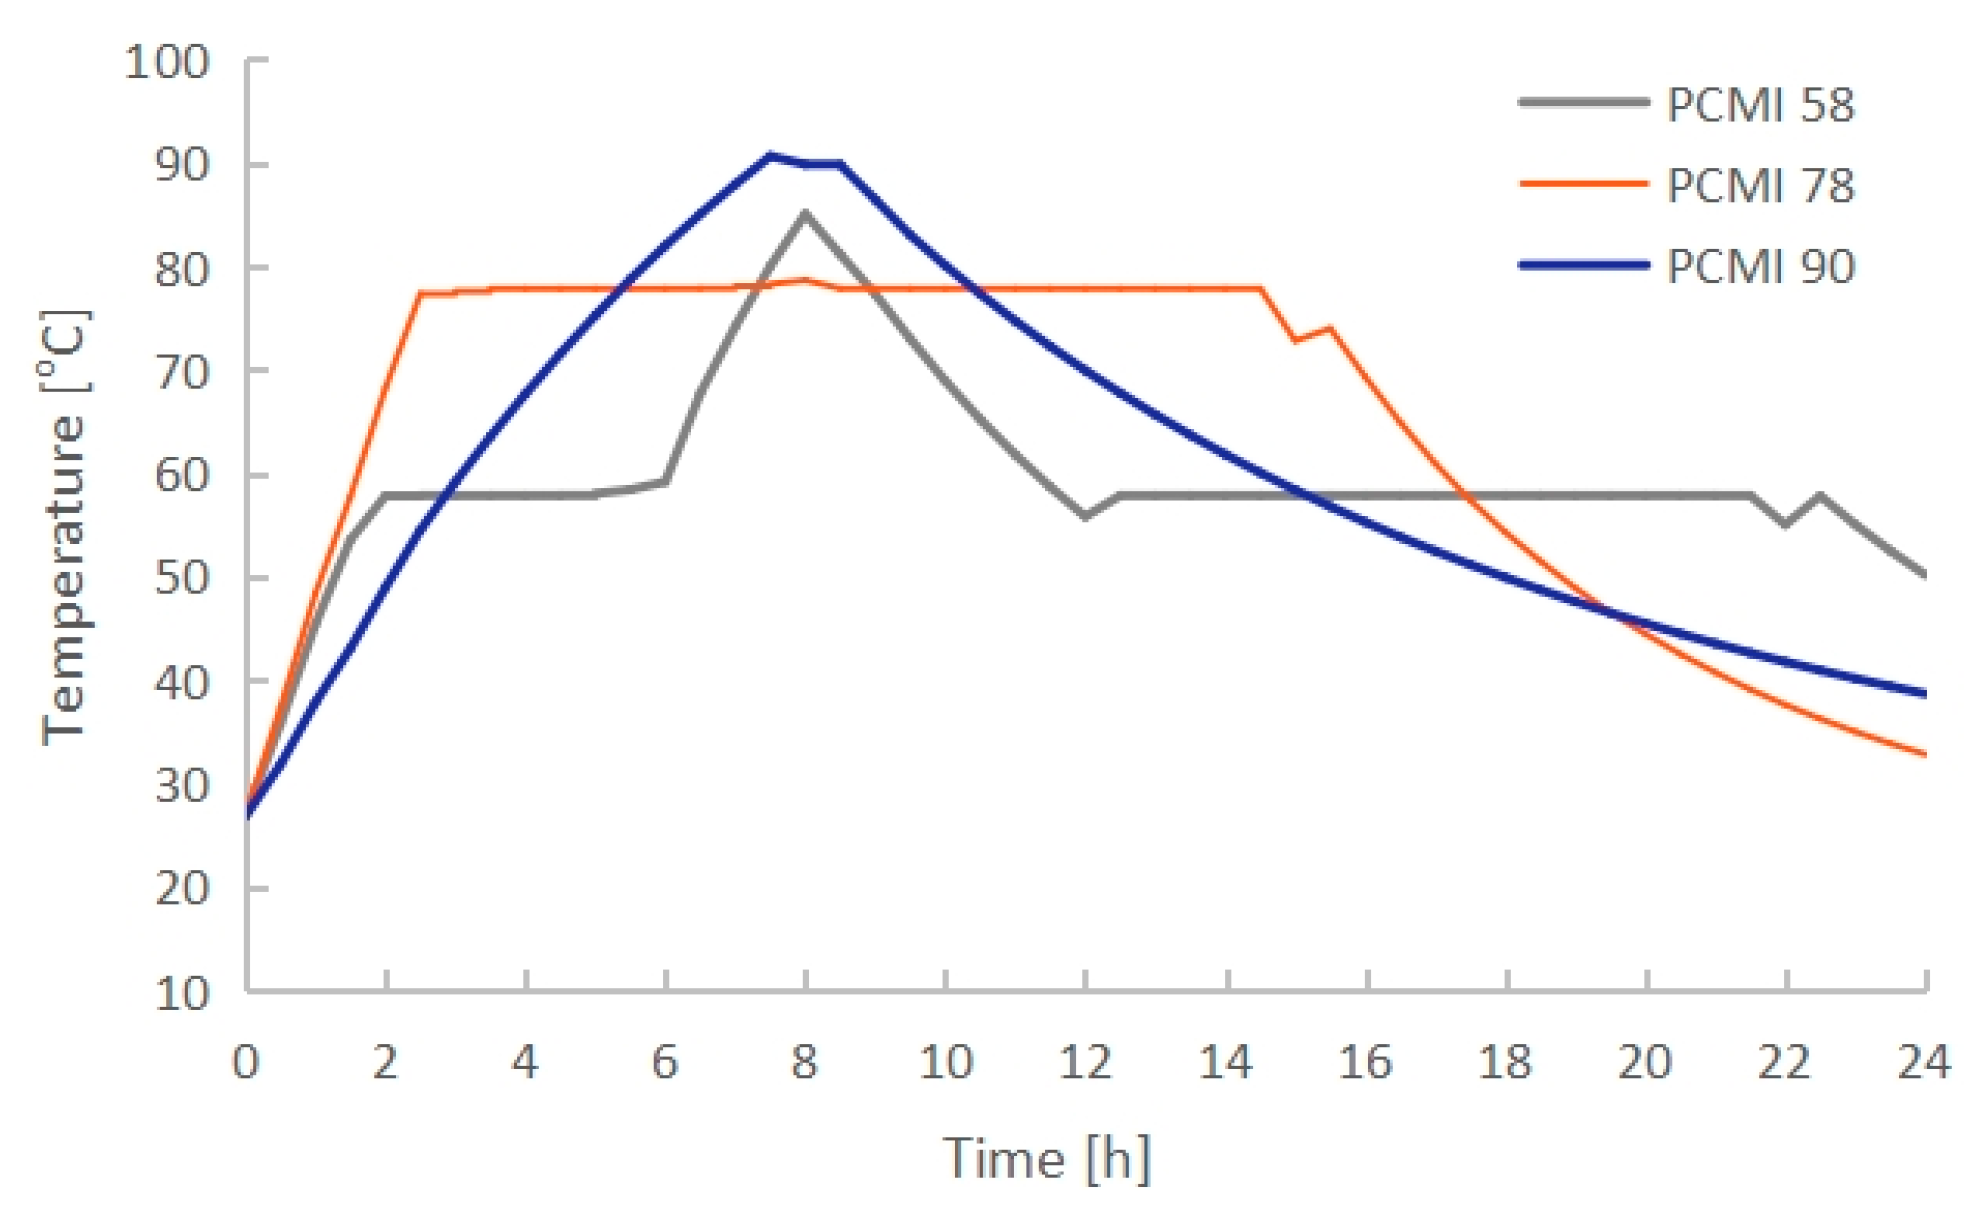
3.2. Effect of PCM Thermal Properties

The effect of the PCM thermal properties on the heat transfer performance was investigated with an electric heating power of 1270 W. The temperature field in the center section after 8 h of charging and after 16 h of discharging are shown in Figure 13. Figure 14 and Figure 15 present the temperature and the liquid fraction of PCMI 58, PCMI 78 and PCMI 90 over time, respectively. During the charging process, PCMI 58 was completely melted after 6 h of heating, and then its temperature quickly increased to 85 °C; PCMI 78 was completely melted after 8 h of heating, and its temperature was kept at the melting point of 78 °C; while the temperature of PCMI 90 reached the melting point of 90 °C after 7 h of heating, and only 11.6% was melted. The heating and melting time increased with the rising PCM melting temperature because a higher melting point was reached more slowly. During the discharging process, PCMI 58 was completely solidified after 23.5 h due to the poor heat transfer rate during the phase transition, which resulted from the low convective coefficient due to the small temperature difference ΔT between the radiator shell and ambient air, according to Equations (17)–(19). This led to a large amount of heat stored in the PCM not being released; PCMI 78 was completely solidified after 15 h and its temperature quickly decreased to 33 °C after 24 h; while it took only 1 h to freeze PCMI 90 and then its temperature dropped to 38.7 °C.
The heat output of the electric radiator, combined with PCMI 58, PCMI 78 and PCMI 90 during the charging and discharging process, is illustrated in Figure 16. The curves of the heat output versus the time are similar to those of the PCM temperature in Figure 14. The average heat output of the radiator with PCMI 58, PCMI 78 and PCMI 90 were 355 W, 412 W and 366 W, respectively. The radiator with PCMI 78 performed the highest output because the PCM underwent a complete melting and freezing cycle within the designed charging and discharging time and its temperature dropped nearly to the initial temperature after 24 h. Therefore, PCMI 78 is suitable for applying to the electric radiator to meet the heating power requirement of 400 W for a 10 m2 floor area.

3.3. Effect of Electric Heating Power

The thermal performance of the electric radiator combined with PCMI 78 was investigated with an electric heating power of 1150 W, 1270 W and 1400 W, respectively. As presented in Figure 17 and Figure 18, PCMI 78 was completely melted after exactly 8 h of heating with a power of 1270 W, while only 75.3% of the material was melted with 1150 W. Conversely, the material was completely melted after 7 h of heating and its temperature grew rapidly to 93.4 °C with 1400 W. The heating and melting time decreased with growing electric heating power, because the melting point was reached more quickly at a higher power. Correspondingly, the freezing and cooling time increased with rising liquid fraction and PCM temperature, which resulted from a higher electric heating power.
Figure 19 presents the heat output of the electric radiator during the charging and discharging process with a heating power of 1150 W, 1270 W and 1400 W. The heat output increased with the increasing heating power due to the rising liquid fraction and PCM temperature. The heat output power was kept stable and independent from the heating power during the melting and freezing process, because the radiator temperature was nearly constant, resulting in a steady heat transfer rate between the radiator and ambient through convection and radiation. The thermal storage efficiency η of an electric radiator can be calculated as follows:
η = Q s Q e = Q e Q t Q e = 1 Q t P t o f f = 1 q o f f t o f f P t o f f = 1 q o f f P
where Qs and Qe are the heat stored in the radiator and the total heat input by the electric heating tubes, respectively; Qe and qoff are the heat output and heat output power of the radiator during the off-peak time (also the charging time); and toff is the off-peak time of 8 h, P is the heating power of the electric heating tubes.
Table 6 summarizes the thermal performance parameters of the electric radiator with a heating power of 1150 W, 1270 W and 1400 W. Both the heat output and thermal storage efficiency grew with the increasing electric heating power. It should be noted that higher heating power results in a growing energy consumption. Therefore, the heating power of 1270 W was used in the room test, because the average heat output in 24 h arrived 412 W, which could cover the heating demand of a 10 m2 floor area with a total heating load of 400 W.

3.4. Room Test Results

During the test process, two electric radiators, combined with PCMI 78, were used to heat the room. They were charged from 22:00 to 6:00 for 8 h and discharged from 6:00 to 22:00 for 16 h every day. Figure 20 presents, as an example, the measured outdoor air temperature T0 and the indoor air temperatures T1, T2, T3 and T4 at different positions shown in Figure 2b from 6–8 February 2023. There was no distinct difference between T1, T2, T3 and T4, indicating that the temperature inside the room was uniform. However, the indoor air temperature was largely dependent upon the outdoor temperature, because the test room has two external walls, and the outdoor temperature becomes the main factor of the temperature fluctuation inside the room. During the three test days, the average indoor air temperature was 20.0 °C, with a maximum of 23.5 °C the position T2 and a minimum of 18.2 °C at position T3, corresponding to the average outdoor temperature of 5.2 °C. The results indicate that the designed heating requirement could be met by using the electric radiator, combined with PCMI 78.

4. Discussion and Conclusions

Based on the requirement of clean heating applications, an electric radiator combined with a salt hydrate-PCM storage was developed to reduce the electricity peak load. It was designed to have an average heat output of 400 W and a thermal storage efficiency of 65.6%. The main challenge was the long melting/solidification time, as well as an inefficient releasing/gaining heat, due to a low thermal conductivity of PCMs. In order to efficiently charge the PCM within 8 off-peak hours and completely discharge within 16 on-peak hours, the key factors affecting the radiator thermal performance were numerically and experimentally investigated in this paper. The main results were obtained as follows:
  • The PCM melting time increased with growing length-width ratio (L/B) of the radiator when keeping the height H unchanged. PCMI 78 with a high L/B ratio of 9.3 could not be completely melted during the charging process. Conversely, the average heat output of the electric radiator rose with increasing L/B ratio. In consideration of both the PCM melting/freezing behaviors and the radiator heat output, the radiator having the external dimension L × B × H of 796 × 106 × 656 mm and the L/B ratio of 7.5 presented the best thermal performance.
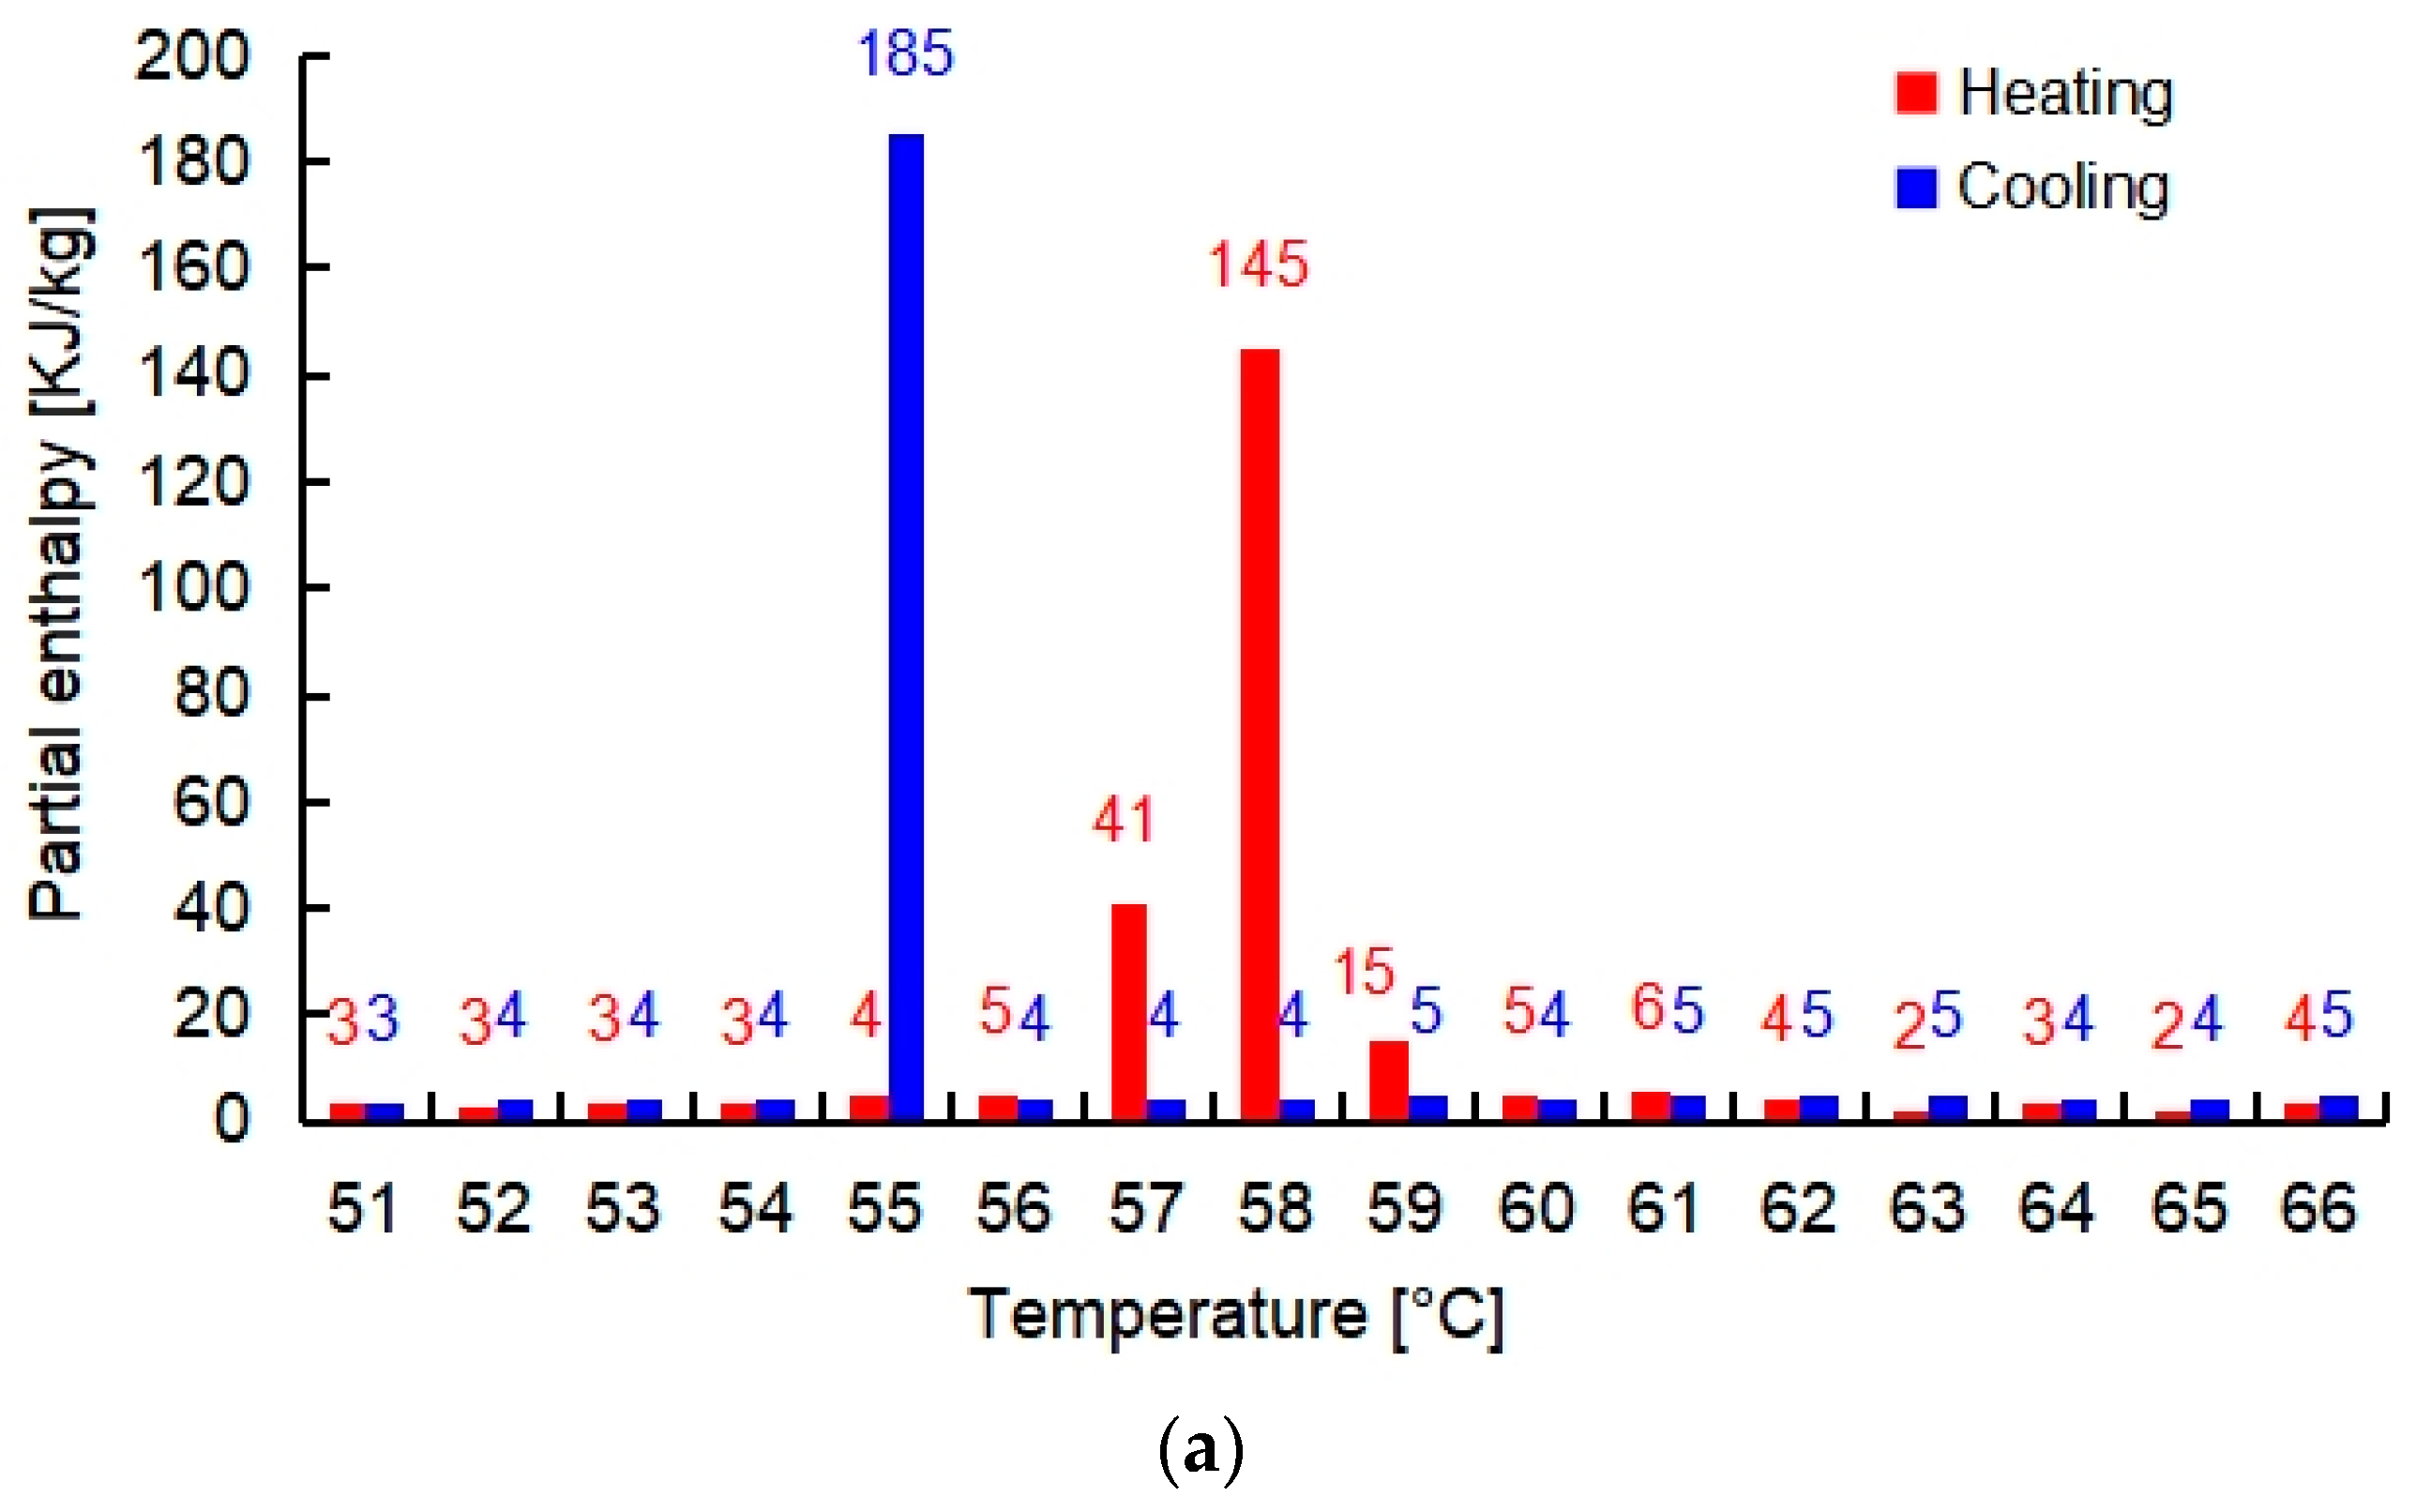
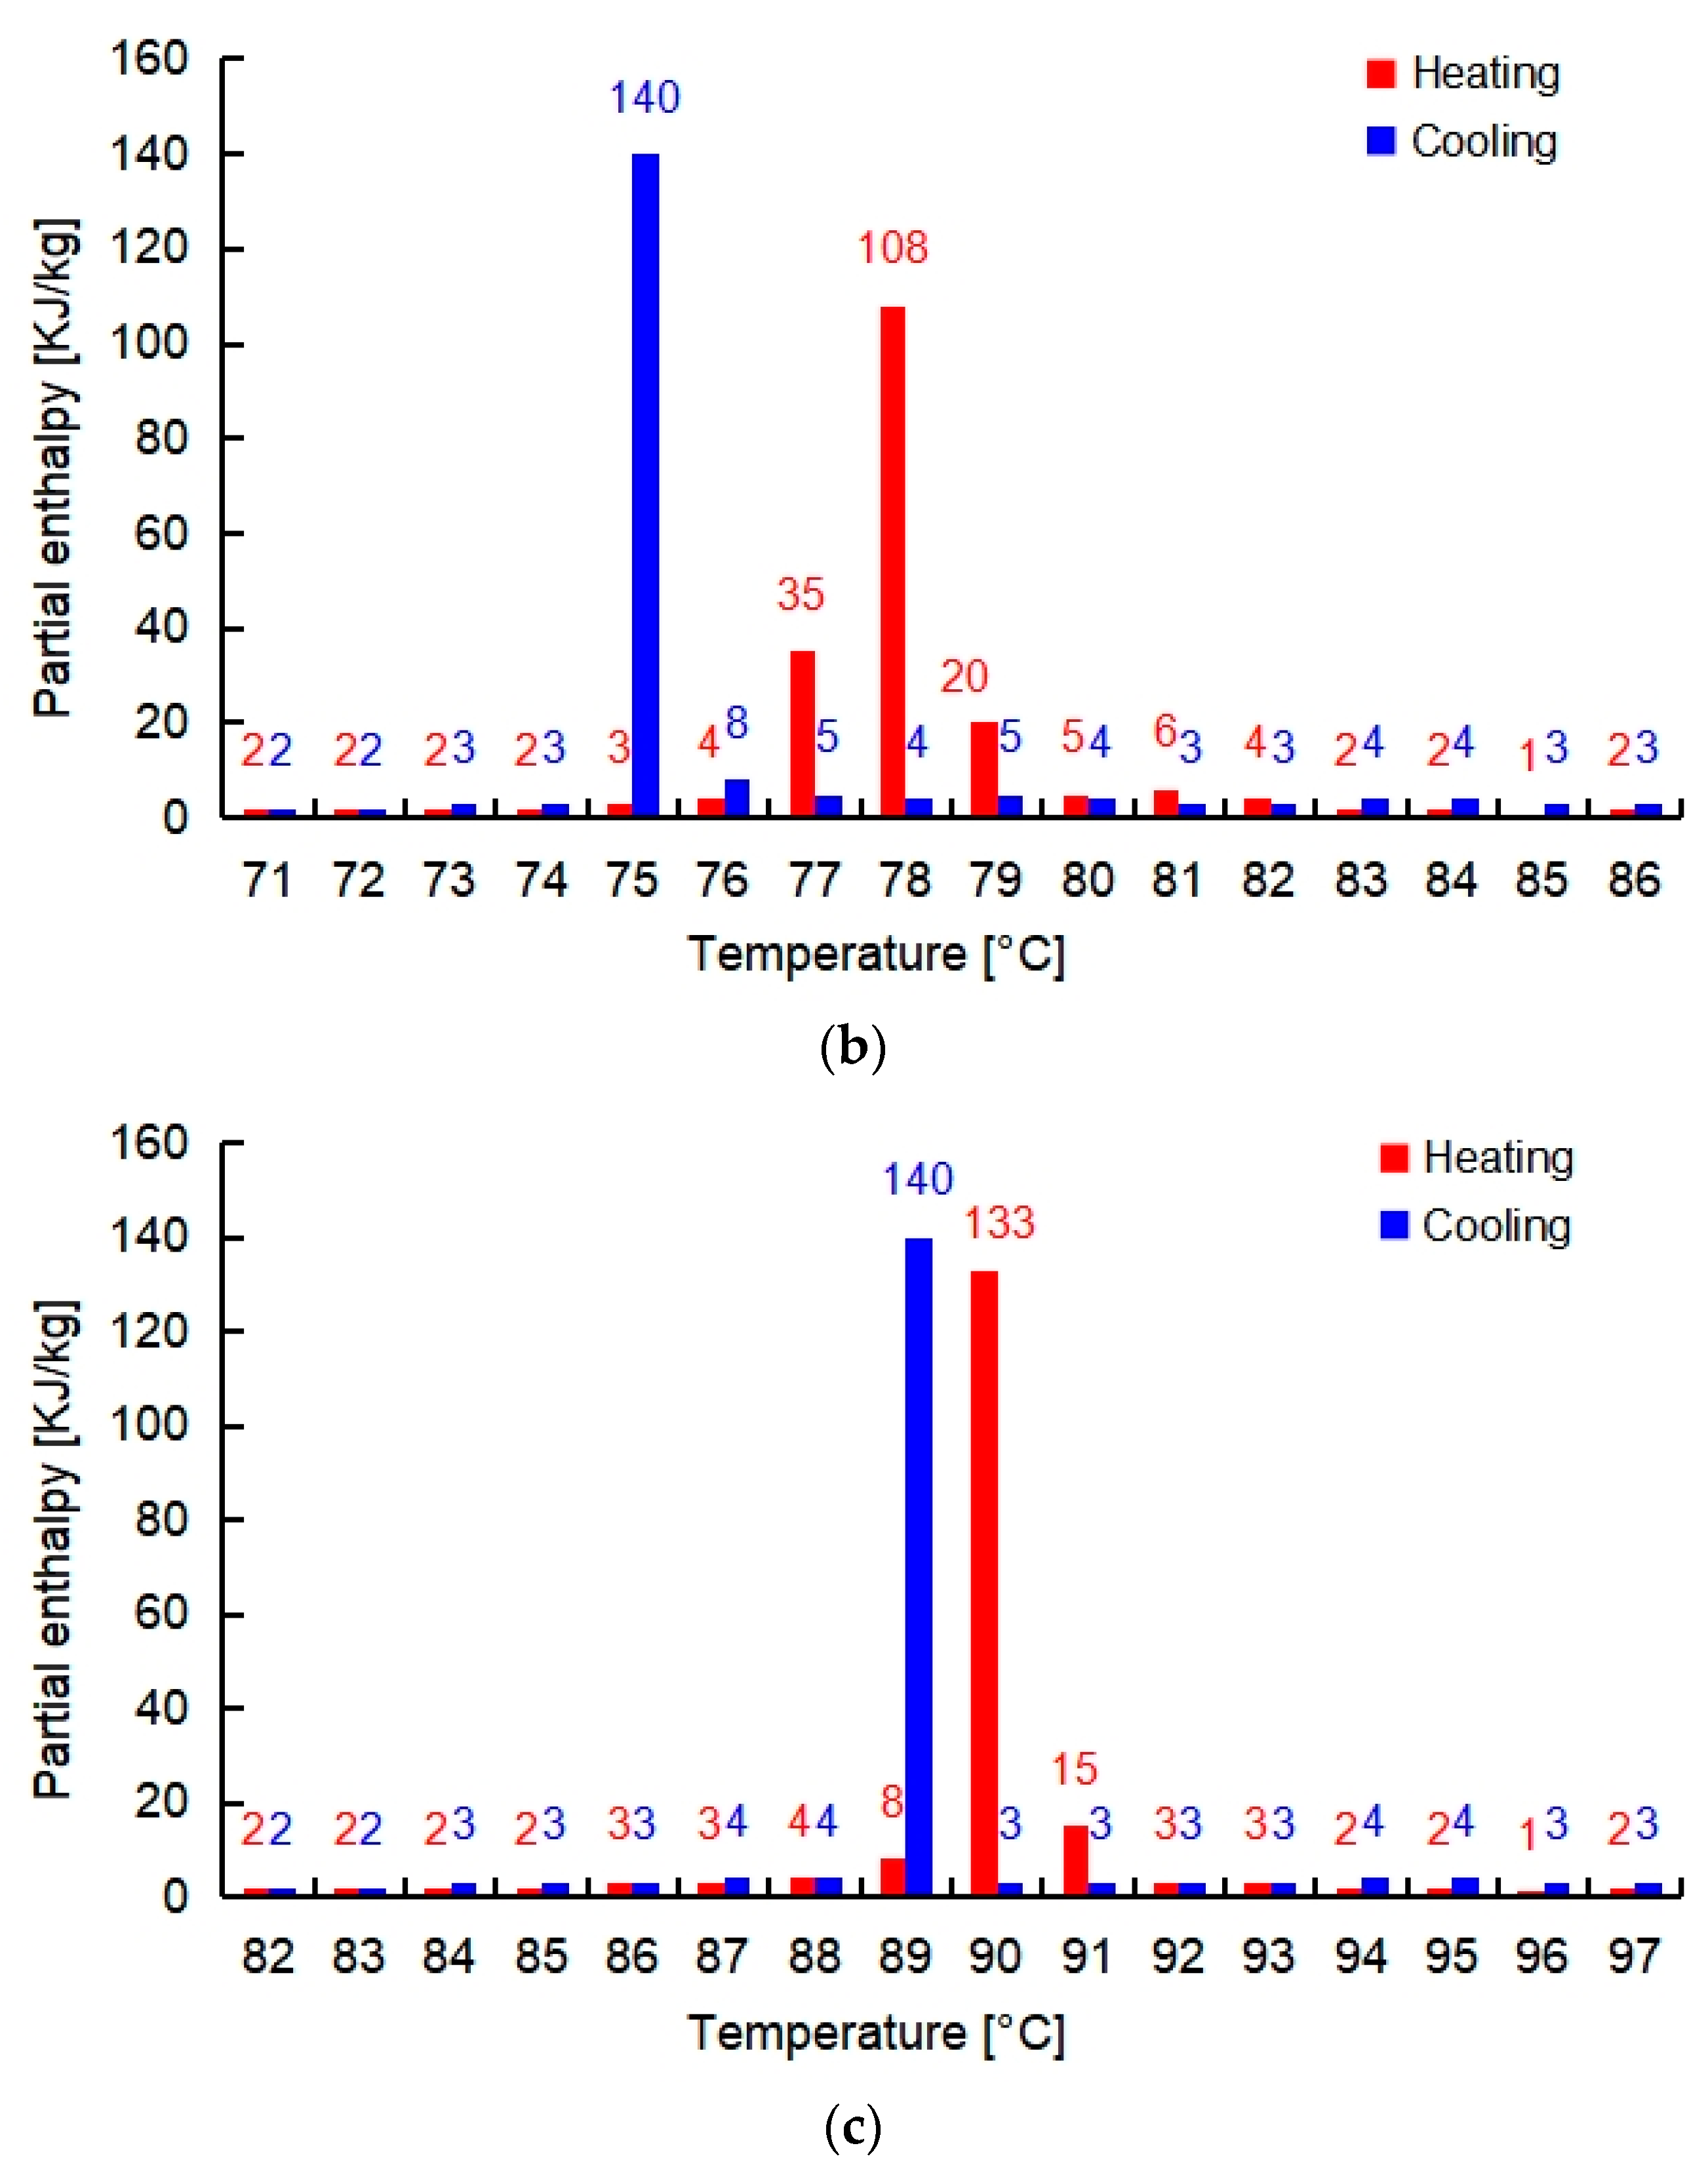
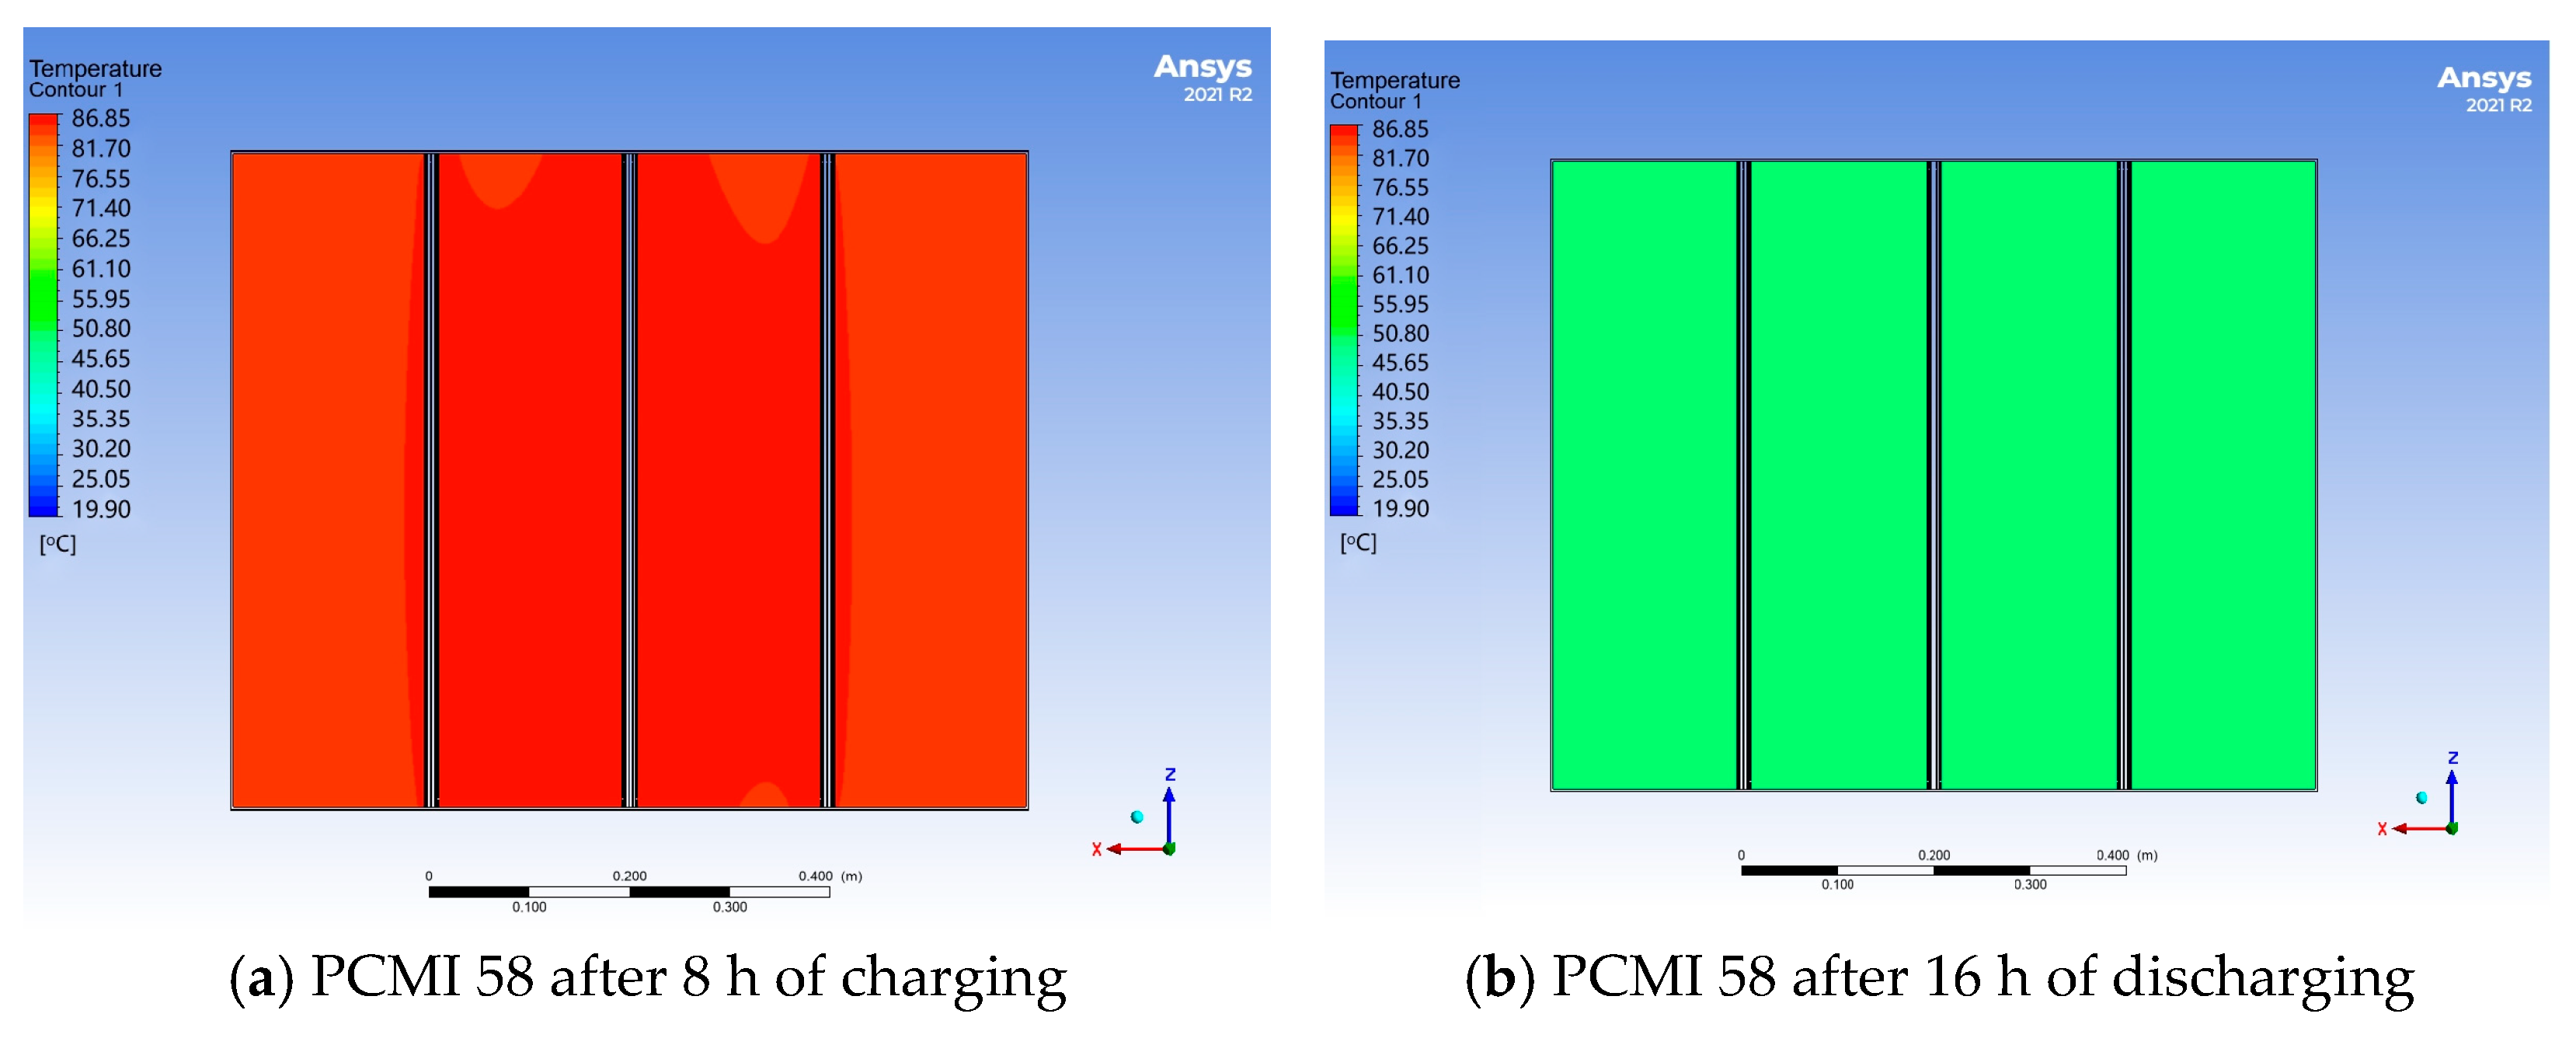
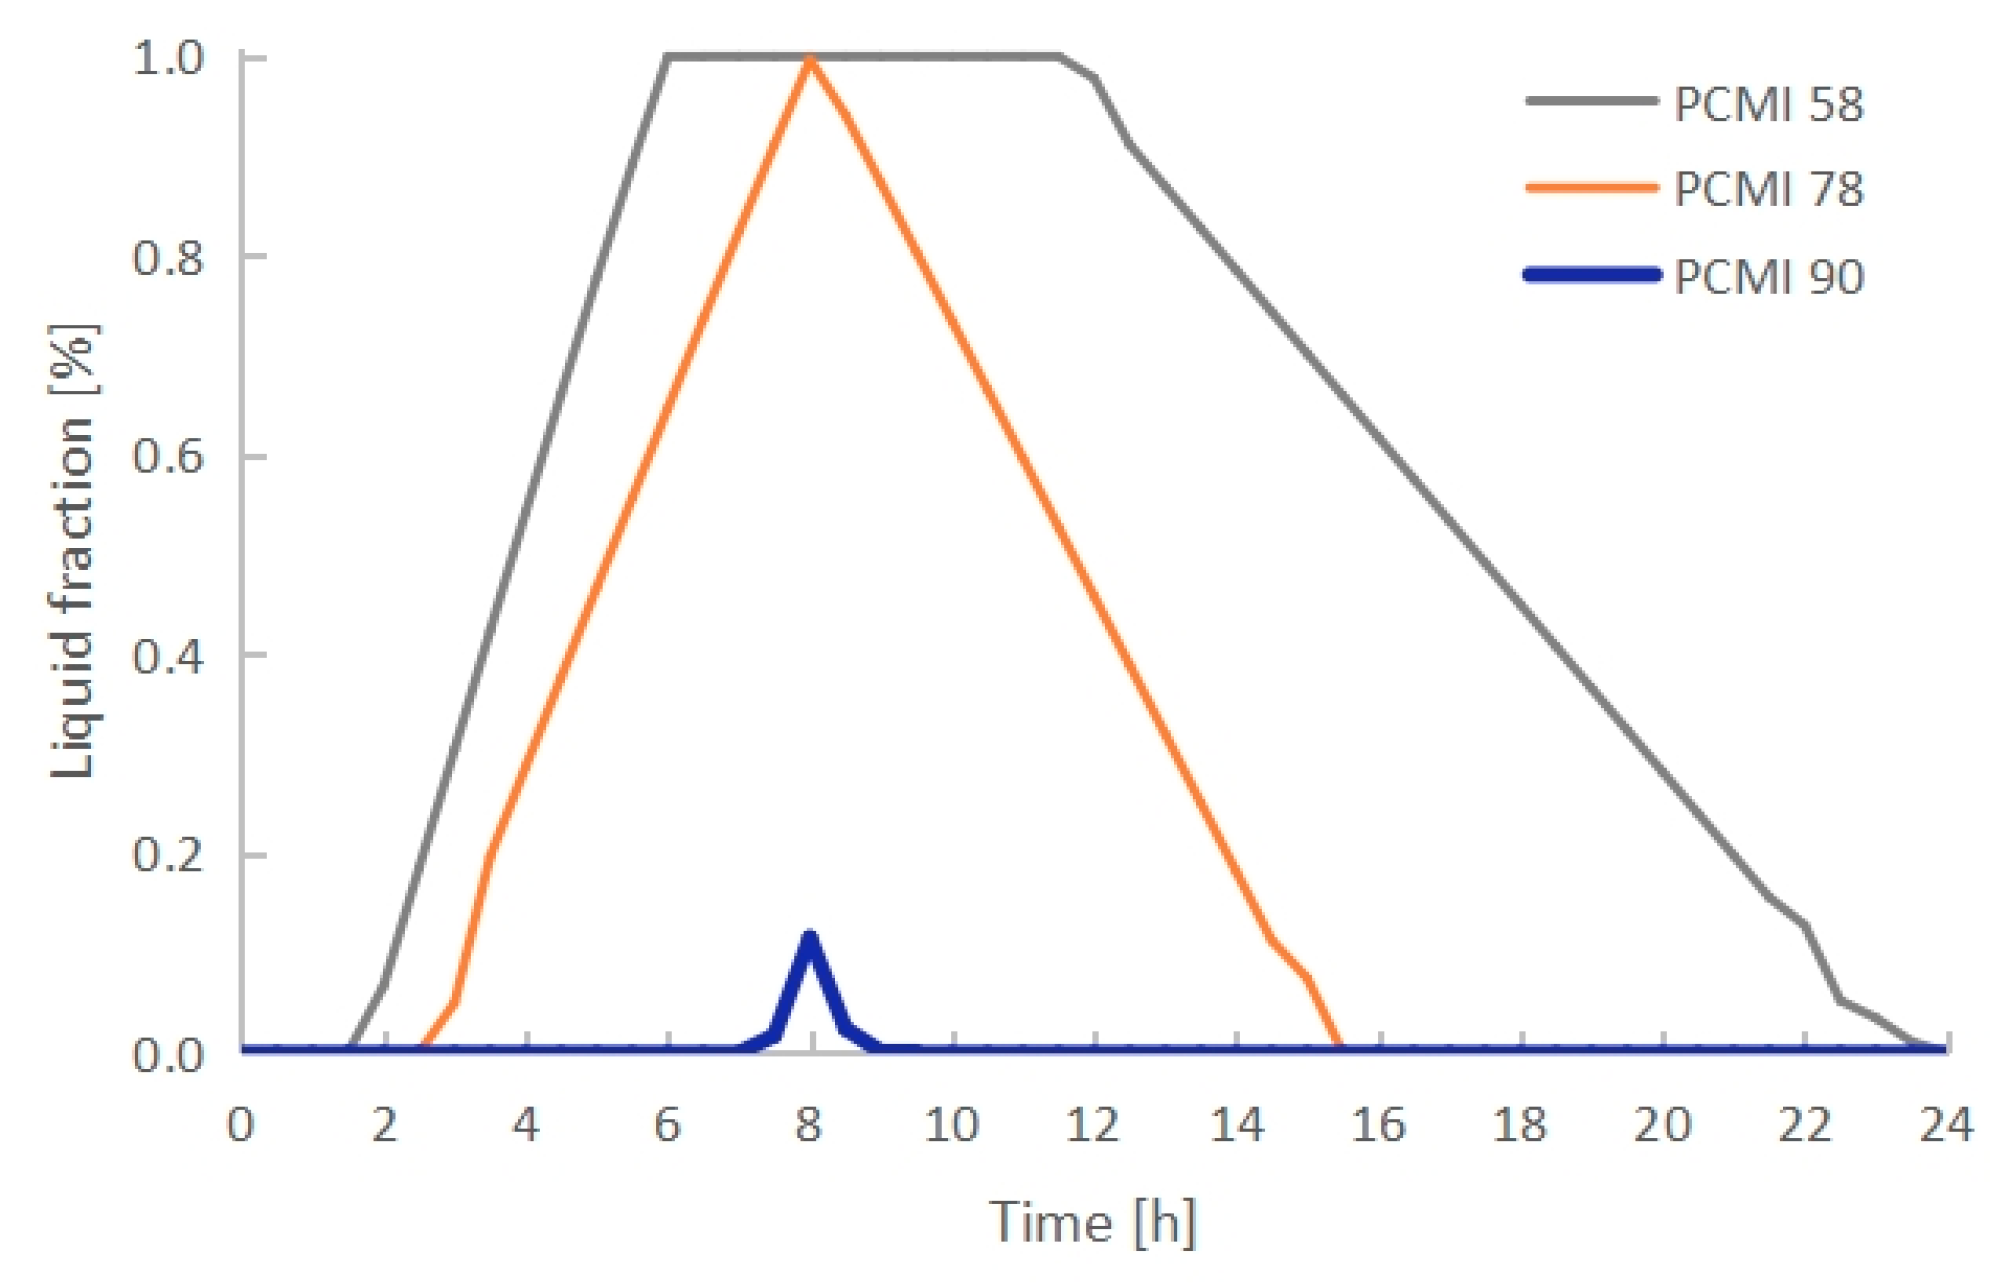
  • The PCM melting time increased with the rising melting temperature. PCMI 58 and PCMI 78 were completely melted after 8 h of heating, while only 11.6% of PCMI 90 was melted. However, a large amount of heat stored in PCMI 58 could not be released after a charging/discharging cycle, due to the small temperature difference between the radiator surfaces and ambient air. The average heat output of the radiator with PCMI 58, PCMI 78 and PCMI 90 were 355 W, 412 W and 366 W, respectively. Therefore, PCMI 78 is suitable for applying in the electric radiator.
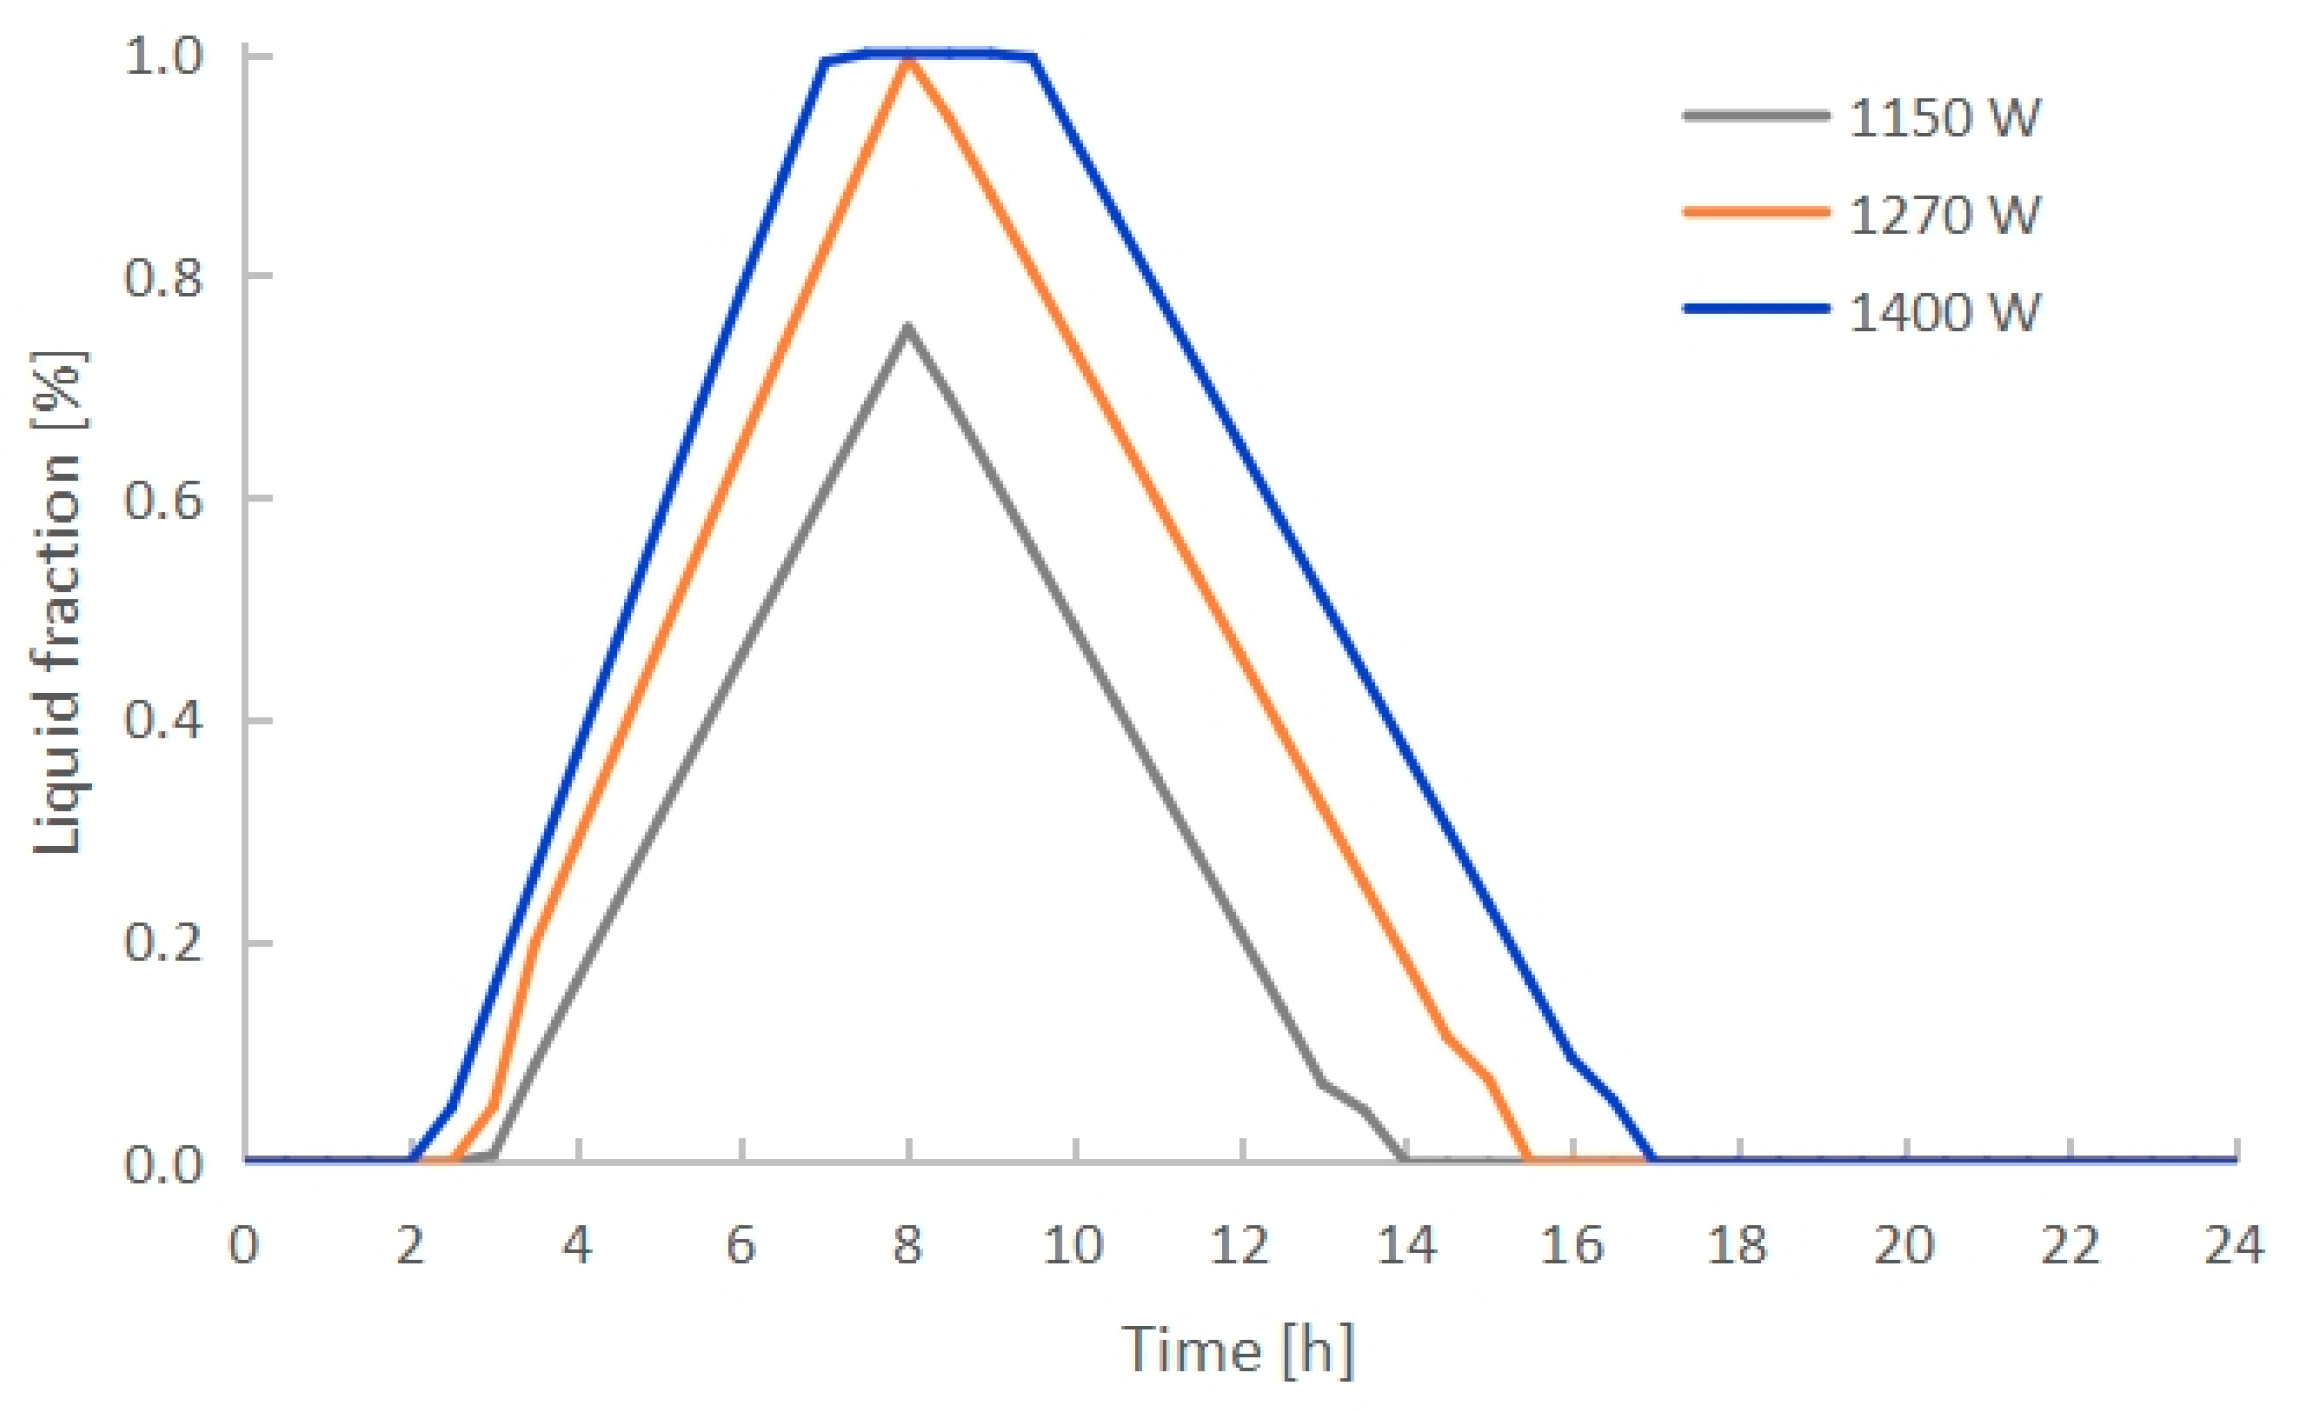
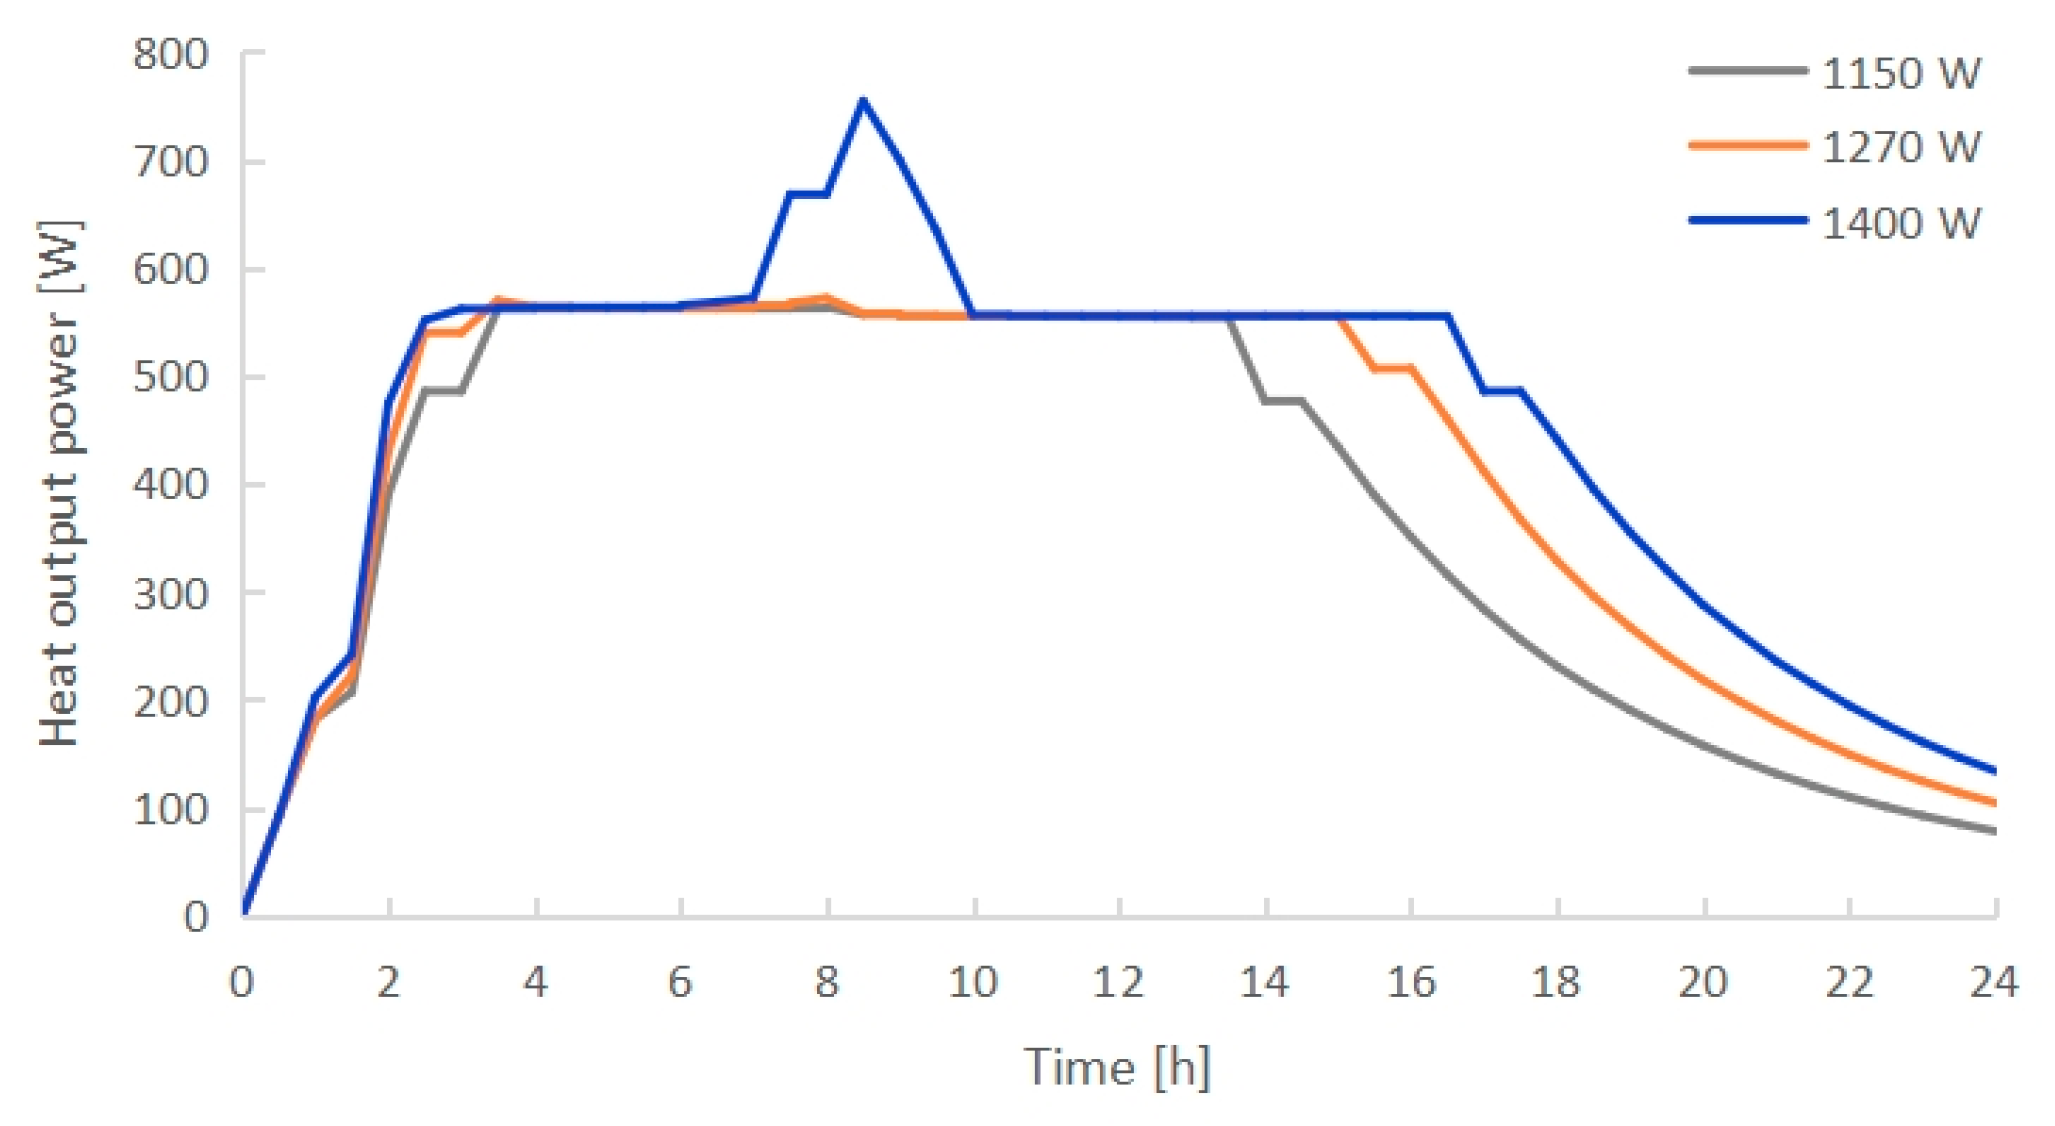
  • The PCM melting time decreased with increasing electric heating power. PCMI 78 was completely melted after exactly 8 h of heating with 1270 W, while only 75.3% of the material was melted with 1150 W, and it was overheated with 1400 W. Conversely, both the heat output and thermal storage efficiency grew with the increasing electric heating power. The average heat output in 24 h arrived 412 W with 1270 W, which could cover the heating demand of a 10 m2 floor area with a total heating load of 400 W.
  • The room test results indicated the designed heating requirement could be met by using the electric radiator combined with PCMI 78. During the three test days in February 2023 with an average outdoor temperature of 5.2 °C, the indoor air temperature was kept at 20.0 °C, with a maximum of 23.5 °C and a minimum of 18.2 °C.
Although the electric radiator combined with PCMI 78 was proved to achieve the designed thermal performance, there are still two major problems to be solved before it could be used in practical applications. The first is the stability of the salt hydrate. Segregation occurs in most salt hydrates after certain melting/freezing cycles, which would reduce the heat capacity available for thermal energy storages. When the radiator has an operation time of 10 years, the PCM should maintain stable after 1200 thermal cycles by considering that the heating period in north China is 120 days per year and the PCM undergoes a melting/freezing cycle per day. Therefore, the stability of PCMI 78 will be examined after 1200 melting/freezing cycles in the next step, and, if necessary, some additives would be added into PCMI 78 to prevent the segregation. The second problem is to realize a complete heat storage and release in the PCM within a 24 h cycle at different outdoor temperatures. A monitoring and controlling system will be developed to automatically control the switch-on and -off process of the electric heating in further works.

Author Contributions

Methodology and writing—original draft preparation, L.H.; software and validation: U.P.; investigation: L.Z.; project administration, R.Z.; data curation, D.Z. All authors have read and agreed to the published version of the manuscript.

Funding

This research was funded by the Natural Science Foundation of Zhejiang Province, grant number LGJ20E060001 and the Natural Science Foundation of Ningbo, grant number 2019A610060.

Data Availability Statement

The data analyzed during the current study are available from the corresponding author on reasonable request.

Conflicts of Interest

The authors declare no conflict of interest.

Nomenclature

cpspecific heat at constant pressure, kJ/kg·K
Cvalue measured or simulated, -
Farea, m2
hsensible enthalpy, kJ/kg
Htotal enthalpy, kJ/kg
Δ H latent enthalpy, kJ/kg
Ktotal heat transfer coefficient, W/m2·K
llength, m
Llatent heat, kJ/kg
mmass, kg
ncoefficient, -
Pelectrical
qheat power, W
Qheat, kJ
Ssource term, -
ttime, h
Ttemperature, K
v velocity, m/s
α correction coefficient, -
ε emissivity, -
η thermal storage efficiency, -
λ effective thermal conductivity, W/m·K
ρ density, kg/m3
σ 0 Stefan-Boltzmann constant
χ liquid fraction, %
Subscripts
airair
eelectrical
envenvelope
ffreezing
iinstance
inindoor
mmelting
mushmushy zone
offoff-peak time
onon-peak time
outoutdoor
refreference
sstored heat
ttotal
Acronyms
Cv(RMSE)the coefficient of root-mean-square error
PCMphase change material
MBEmean bias error

References

  1. Jiang, Y.; Tang, X.Y.; Ni, W.D.; Yue, G.; Wang, J.; Hu, S. The relevance between PM2.5 in Beijing and winter heating systems and control measures. Chin. Energy 2014, 36, 7–13,28. [Google Scholar]
  2. Zhang, J.G. Promotion of low-carbon heat supply under the background of carbon emissions peak and carbon neutrality. Energy Ind. 2021, 9, 32–37. [Google Scholar]
  3. Administration of the People’s Republic of China. Statement on Winter Clean Heating Planning in Northern Regions (2017–2021); Administration of the People’s Republic of China: Beijing, China, 20 December 2017. Available online: http://www.gov.cn/xinwen/2017-12/20/5248855/files/7ed7d7cda8984ae39a4e9620a4660c7f.pdf (accessed on 10 September 2023).
  4. Climate Change and Energy Transition Program. China Dispersed Coal Management Report 2022; Institute of Energy, Peking University: Beijing, China, 20 September 2022; Available online: https://www.ccetp.cn/newsinfo/4371839.html (accessed on 10 September 2023).
  5. Xu, G.; Wang, C.L.; Xu, C.; Bai, P. Evaluation of air pollutant emissions from scattered coal burning and electric heating in Beijing-Tianjin-Heibei region. Res. Environ. Sci. 2016, 29, 1735–1742. [Google Scholar]
  6. Lin, K.; Zhang, Y.; Xu, X.; Di, H.; Yang, R.; Qin, P. Modeling and simulation of under-floor electric heating system with shape-stablized PCM plates. Build. Environ. 2004, 39, 1427–1434. [Google Scholar] [CrossRef]
  7. Lin, K.; Zhang, Y.; Xu, X.; Di, H.; Yang, R.; Qin, P. Experimental study of under-floor electric heating system with shape-stablized PCM plates. Build. Environ. 2005, 37, 215–220. [Google Scholar] [CrossRef]
  8. Barzin, R.; Chen, J.J.J.; Young, B.R.; Farid, M.M. Application of PCM underfloor heating in combination with PCM wallboards for space heating using price based control system. Appl. Energy 2015, 148, 39–48. [Google Scholar] [CrossRef]
  9. Devaux, P.; Farid, M.M. Benefits of PCM underfloor heating with PCM wallboards for space heating in winter. Appl. Energy 2017, 191, 593–602. [Google Scholar] [CrossRef]
  10. Faraj, K.; Faraj, J.; Hachem, F.; Bazzi, H.; Khaled, M.; Castelain, C. Analysis of underfloor electrical heating system integrated with coconut oil-PCM plates. Appl. Therm. Eng. 2019, 158, 113778. [Google Scholar] [CrossRef]
  11. Ma, G.Y.; Wang, Z.H.; Yan, R.; Cao, H. Making and capability testing of electric heater with phase change accumulator. J. Fushun Pet. Inst. 2003, 23, 50–53. [Google Scholar]
  12. Chen, G.S.; Zhang, R.Y.; Ke, X.F. Thermal efficiency modelling and experimental research for electric heating units with phase change materials. HVAC 2006, 36, 23–26. [Google Scholar]
  13. Liu, J.; Liu, S.; Wang, X.; Zahng, Y.; Di, H. Research and development of a high-temperature phase change storage electric heater and test of its thermal performance. Build. Sci. 2007, 23, 58–61, 86. [Google Scholar]
  14. Long, K. Experimental and Simulation Study on Heat Transfer Characteristics of Solid Regenerative Electric Heating Device. Master’s Thesis, Harbin Institute of Technology, Harbin, China, 2021. [Google Scholar]
  15. Wang, P.; Wang, X.; Huang, Y.; Li, C.; Peng, Z.; Ding, Y. Thermal energy charging behaviour of a heat exchange device with a zigzag plate configuration containing multi-phase-change-materials (m-PCMs). Appl. Energy 2015, 142, 328–336. [Google Scholar] [CrossRef]
  16. Sardari, P.T.; Giddings, D.; Grant, D.; Gillott, M.; Walker, G.S. Discharge of a composite metal foam/phase change material to air heat exchanger for a domestic thermal storage unit. Renew. Energy 2020, 148, 987–1001. [Google Scholar] [CrossRef]
  17. Sardari, P.T.; Babaei-Mahani, R.; Giddings, D.; Yasseri, S.; Moghimi, M.A.; Bahai, H. Energy recovery from domestic radiators using a compact composite metal Foam/PCM latent heat storage. J. Clean. Prod. 2020, 257, 120504. [Google Scholar] [CrossRef]
  18. Sardari, P.T.; Grant, D.; Giddings, D.; Walker, G.S.; Gillott, M. Composite metal foam/PCM energy store design for dwelling space air heating. Energy Convers. Manag. 2019, 201, 112151. [Google Scholar] [CrossRef]
  19. Sheikholeslami, M. Numerical modeling of nano enhanced PCM solidification in an enclosure with metallic fin. J. Mol. Liq. 2018, 259, 424–438. [Google Scholar] [CrossRef]
  20. Pereira da Cunha, J.; Eames, P. Thermal energy storage for low and medium temperature applications using phase change materials e a review. Appl. Energy 2016, 177, 227–238. [Google Scholar] [CrossRef]
  21. DB33/1038-2007; Design Standard for Energy Efficiency of Public Buildings in Zhejing Provice. Zhejiang Provincial Department of Construction: Hangzhou, China, 2007.
  22. GB50736-2012; Chinese Design Code for Heating Ventilation and Air Conditioning of Civil Buildings. Ministry of Housing and Urban-Rural Construction of the People’s Republic of China: Beijing, China, 2012.
  23. Sharma, S.D.; Kitano, H.; Sagara, K. Phase change materials for low temperature solar thermal applications. Res. Rep. Fac. Eng. Mie Univ. 2004, 29, 31–64. [Google Scholar]
  24. Lidy Energy Technology Co., Ltd. Available online: http://www.lidy.net.cn/en/col.jsp?id=112 (accessed on 10 September 2023).
  25. W&a Wärme- und Anwendungstechnische Prüfungen. Available online: http://www.xn--wrmeprfung-q5a70a.de/projekte_messsystem_kalorimeter.html (accessed on 10 September 2023).
  26. Voller, V.R. Modeling solidification processes, technical report. In Proceedings of the Mathematical Modeling of Metals Processing Operations Conference; American Metallurgical Society: Palm Desert, CA, USA, 1987. [Google Scholar]
  27. Voller, V.R.; Brent, A.D.; Reid, K.J. A computational modeling framework for the analysis of metallurgical solidification process and phenomena, technical report. In Proceedings of the Conference for Solidification Processing, Ranmoor House, Sheffield, UK, 21–24 September 1987. [Google Scholar]
  28. Voller, V.R.; Prakash, C. A Fixed-Grid numerical modeling methodology for convection-diffusion mushy region phase-change problems. Int. J. Heat Mass Transf. 1987, 30, 1709–1720. [Google Scholar] [CrossRef]
  29. Wang, B.X. Engineering Heat and Mass Transfer; Science Publishing House: Beijing, China, 2015; Volume 2, p. 378. [Google Scholar]
  30. ASHRAE. ASHRAE Guideline 14–2014: Measurement of Energy Demand and Savings; American Society of Heating, Refrigerating and Air Conditioning Engineers: Atlanta, GA, USA, 2014. [Google Scholar]
Figure 1. Photo of the activity center of a residential community in red circle in the city Ningbo, China.
Energies 16 07108 g001
Figure 2. Schematic of the building with the test room in red circle (a) and the test room with the placement of the thermocouples (b).
Energies 16 07108 g002aEnergies 16 07108 g002b
Figure 3. General schematic (1—shell, 2—vessel, 3—PCM, 4—electric heating tubes, 5—grids, 6—base) (a) and external appearance (b) of the electric radiator combined with PCM storage.
Energies 16 07108 g003
Figure 4. Placement of the thermocouples in the electric radiator.
Energies 16 07108 g004
Figure 5. Melting/freezing temperatures and partial enthalpy of PCMI 58 (a), PCMI 78 (b) and PCMI 90 (c).
Energies 16 07108 g005aEnergies 16 07108 g005b
Figure 6. Geometry of the meshes on the shell and vessel (a), as well as PCM (b).
Energies 16 07108 g006
Figure 7. Comparison of the numerical prediction and experimental temperature of PCM (T5), vessel (T6) and shell front surface (T7) with error bar of ±10%.
Energies 16 07108 g007
Figure 8. The definition of the heating, melting, freezing and cooling time of the PCM during the charging and discharging process.
Energies 16 07108 g008
Figure 9. The temperature of PCMI 78 incorporated into the radiators R1, R2 and R3 during the charging and discharging process.
Energies 16 07108 g009
Figure 10. The liquid fraction of PCMI 78 incorporated into the radiators R1, R2 and R3 during the charging and discharging process.
Energies 16 07108 g010
Figure 11. The liquid fraction cloud image of PCMI 78 incorporated into the radiators R1, R2 and R3 during the charging process.
Energies 16 07108 g011
Figure 12. The heat output of the electric radiators R1, R2 and R3 during the charging and discharging process.
Energies 16 07108 g012
Figure 13. The temperature field cloud image of the electric radiator with PCMI 58, PCMI 78 and PCMI 90 after 8 h of charging and after 16 h of discharging.
Energies 16 07108 g013aEnergies 16 07108 g013b
Figure 14. The temperature of PCMI 58, PCMI 78 and PCMI 90 during the charging and discharging process.
Energies 16 07108 g014
Figure 15. The liquid fraction of PCMI 58, PCMI 78 and PCMI 90 during the charging and discharging process.
Energies 16 07108 g015
Figure 16. The heat output of the electric radiator with PCMI 58, PCMI 78 and PCMI 90 during the charging and discharging process.
Energies 16 07108 g016
Figure 17. The temperature of PCMI 78 during the charging and discharging process with an electric heating power of 1150 W, 1270 W and 1400 W.
Energies 16 07108 g017
Figure 18. The liquid fraction of PCMI 78 during the charging and discharging process with an electric heating power of 1150 W, 1270 W and 1400 W.
Energies 16 07108 g018
Figure 19. The heat output power of the electric radiator during the charging and discharging process with an electric heating power of 1150 W, 1270 W and 1400 W, respectively.
Energies 16 07108 g019
Figure 20. The outdoor air temperature T0 and the indoor air temperatures T1–T4 measured from 6–8 February 2023.
Energies 16 07108 g020
Table 1. The thermophysical parameters of the test room [21].
ParameterValue
Total heat transfer coefficient K (W/m2·K)roof0.70
external walls1.38
door3.00
window2.53
Dimension B × H (mm)door800 × 2100
window1200 × 1600
Type of windowframePVC-U
glassdouble clear (5/9/5)
g-value window (-) 0.8
Air change (1/h) 1.0
Table 2. Technical data of the three salt hydrates.
Salt
Hydrate
Specific Heat
Solid
(kJ/kg·K) [24]
Thermal Conductivity Solid (W/m·K) [24]Density
Solid
(kg/m3)
[24]
Melting Point
(°C)
Total Enthalpy
in 15 K
(kJ/kg)
PCMI 582.400.61140058250
PCMI 781.460.70189078200
PCMI 903.80Not available163090187
Table 3. Effect of elements number on the melting and freezing time.
Number of ElementsMelting Time (h)Freezing Time (h)
297,422
(mesh size on the shell &vessel: 10 mm, on the PCM: 6 mm)
8.56.5
836,542
(mesh size on the shell &vessel: 10 mm, on the PCM: 4 mm)
8.07.0
1,932,417
(mesh size on the shell &vessel: 10 mm, on the PCM: 3 mm)
8.07.0
Table 4. MEB and Cv(RMSE) of the temperature of PCM (T5), vessel (T6) and shell front surface (T7) measured and simulated.
MEB (%)Cv (RMSE) (%)
PCM temperature (T5) −0.713.30
Vessel temperature (T6)−5.476.38
Shell front temperature (T7)−7.638.61
Table 5. Different configurations of the electric radiators R1, R2 and R3.
R 1R 2R 3
L × B × H (mm)664 × 126 × 656796 × 106 × 656887 × 96 × 656
L/B5.37.59.3
l (mm)105.993.586.6
Table 6. The thermal performance of the electric radiator with a heating power of 1150 W, 1270 W and 1400 W, respectively.
Electric Heating Power1150 W1270 W1400 W
PCM heating time before melting (h)2.52.52.0
PCM melting time (h)5.55.55.0
PCM heating time after melting (h)0.00.01.0
PCM cooling time before freezing (h)0.00.01.5
PCM freezing time (h)5.57.07.0
PCM cooling time after freezing (h)10.59.07.5
Average heat output power (W) during the charging process375412469
Average heat output power (W) during the discharging process422450432
Average heat output power (W) in 24 h 334392451
Thermal storage efficiency (%)63.265.666.5
Disclaimer/Publisher’s Note: The statements, opinions and data contained in all publications are solely those of the individual author(s) and contributor(s) and not of MDPI and/or the editor(s). MDPI and/or the editor(s) disclaim responsibility for any injury to people or property resulting from any ideas, methods, instructions or products referred to in the content.

