Abstract
This study evaluates a hybrid heating system in a single-family building in northeastern Poland, which has a temperate continental climate. The analysis covers two heating seasons in 2021/2022 and 2022/2023. The hybrid heating system includes an air heat pump HPA–08 CS Plus with a heating power of 8.2 kW (AHP), a condensing gas boiler VC146/5–5 with a power of 14 kW (GB–Condens.), and a solid fuel boiler with a power of 11 kW for central heating. Additionally, hot water is heated by a Basic 270 (DHW’s AHP) air–water heat pump with a power of 2 kW, utilizing a tank with a capacity of 270 dm3 equipped with two heating coils. The building’s average electricity consumption is around 5400 kWh/year. A 4.96 kWp photovoltaic installation is installed on the building’s roof at a 40° angle towards the south to supplement the hybrid system. The study aims to assess whether the PV installation can adequately cover the energy needs of the hybrid heat source for heating and hot water. Furthermore, the study calculates the emission of pollutants (CO2, SOx, NOx, CO, and PM10) into the atmosphere. The total annual electricity production from PV installations was 5444.9 kWh in 2021/2022 and 5684.8 kWh in 2022/2023. The excess electricity was stored in the PGE power grid as per the Prosumer settlement rules. The installed PV installation is sufficient to power the following devices annually: AHP, DHW’s AHP, and GB–Condens. However, the daily electricity production from the PV installation is not enough to cover the energy needs of the heat pump for heating during the cold months in Poland (I–III, XI–XII). It can meet the power needs of a PC all year round and can also be stored during the summer months, for example, in energy warehouses or by directly storing it in the PGE power grid. The use of the PV installation resulted in an average reduction in pollutant emissions into the atmosphere: CO2—94.1%, SOx—91.8%, NOx—95.6%, CO—9.7%, and PM10—32.1%.
1. Introduction
Climate change is a major challenge for the global community. European countries aim to achieve net zero emissions by 2050 [1,2]. Buildings, which account for up to 36% of final energy consumption, can contribute to achieving this goal [3,4]. Environmental problems, especially global warming, have become one of the most serious problems threatening all living things on Earth. Global warming has been increasing since the Industrial Revolution [5]. The most important cause of anthropogenic global warming is unprecedented concentrations of greenhouse gases in the atmosphere, mainly due to the burning of fossil fuels such as oil, gas, and coal, as published in the IPCC report [6]. Therefore, regulating the concentration of greenhouse gases (e.g., carbon dioxide, methane, and nitrous oxide) in the atmosphere is key to solving global warming problems. Despite the increasing demand for energy efficiency, the full potential of energy efficiency remains limitless; many buildings in the EU consume more energy than expected. Collecting data and developing models to predict occupant behavior is the next step in sustainable design [7,8,9,10,11]. Hybrid heating systems based on the use of an air or ground heat pump (HP), photovoltaic panels, and an additional peak heat source (e.g., gas boiler) are becoming more and more popular [12,13,14,15,16,17,18]. The supplemental element of the hybrid system is also air-type HP dedicated to DHW heating. DHW tanks with double heating coils also allow the use of flat or vacuum water solar collectors, thanks to which additional energy savings are achieved. This is of great importance in countries such as Poland, where electricity is produced from coal. Such activities also significantly reduce CO2 and dust emissions into the atmosphere [19,20,21,22]. Mathematical modeling and computer simulations help decide which solutions can be implemented based on specific weather and environmental conditions [23,24,25,26,27,28]. Channel et al. [29] provide an overview of the functional integration of hybrid renewable energy systems (HRESs) in multi-energy buildings, highlighting the many issues and potentials associated with the application of HRESs in the field of renewable energy and the residential construction area. Building-integrated HRESs with at least two RESs (i.e., solar–wind, solar–geothermal, or solar–biomass) are considered. Vialetto et al. [30] demonstrated heat recovery for an air source heat pump system with the main aim of improving energy conversion efficiency for a residential building. The authors’ results confirm that the efficiency of the AHP is increased during the cold season in climates with high relative humidity and for users with high power demands. Martin-Escudero et al. [31] considered the possibility of collaborating on a system consisting of photovoltaic panels integrated with a double-layer facade and an AHP, a heat source for central heating, and domestic hot water. The study sought to evaluate the capabilities of a system comprising a photovoltaic (PV) double-skin facade (PV-DSF) in conjunction with an air source heat pump (ASHP) system. The primary objective of this system was to furnish heating and domestic hot water (DHW) through renewable energy. The authors developed a mathematical model to assess the energy capabilities of the proposed system. This model utilizes hourly outdoor temperature and solar radiation as input parameters to estimate the system’s heat and power production. Calculations were conducted on an existing apartment block in Spain to gauge the energy profitability of the proposed system. The authors contend that the ASHP system can fulfill almost the entire demand for thermal energy. Additionally, the authors observed that PV-DSF panels can satisfy most of the electricity requirements for the ASHP system and PV-DSF fans. From an economic perspective, the authors compared this installation with a conventional natural gas boiler room and obtained promising results. The investment cost was recouped within 6.4 years, thereby demonstrating the economic viability of this system. The proposed system entails a forced air stream, heated by photovoltaic panels, flowing through the ventilated cavity of the facade, and, subsequently, directed through the ventilation system to the heat pump evaporator. Space heating requirements were determined through Building Energy Simulation. The principal aim of the solution proposed by the authors was to develop and introduce to the market a technology that enables effective and intelligent energy utilization in construction. The system offers several notable advantages, including promoting high-efficiency heat pumps, utilizing renewable energy, and electrifying the building’s thermal energy demand. Rocatello et al. highlighted in their article [27] the differences in the performance of hybrid systems depending on the conditions of their use and the importance of choosing the most appropriate control strategy for each case. To estimate the amount of heat consumed in buildings, analyses often attempt to find an empirical correlation between weather conditions and heat demand. Among the basic meteorological parameters, outdoor air temperature is the most important factor in calculating heat demand, which is the basis for designing the building’s heat supply system and heat source [32,33,34,35,36,37,38].
Air pollution is one of the most critical environmental problems affecting our health and good well-being [39]. This is associated with increased mortality from cardiovascular and respiratory diseases, including lung cancer and chronic obstructive pulmonary disease (COPD), with reduced life expectancy [40]. In 2019, an estimated 307,000 premature deaths in Europe were caused by long-term exposure to fine particles 10 μm or less (PM10) and coarse particles 2.5 μm or less in diameter (PM2.5). In addition, approximately 40,000 premature deaths are attributed to long-term exposure to nitrogen dioxide (NO2) [41]. Despite improvements in air quality in Europe, air pollution is one of the greatest environmental threats to health and continues to be a significant health problem for Europeans [40]. Although Europe’s average annual concentrations of primary pollutants (e.g., NO2, SO2, etc.) are on a downward trend, the European limit values for PM10, PM2.5, and NO2 are still exceeded in certain areas, especially in urban areas. In 2019, urban populations in the EU were exposed to PM2.5, PM10, and NO2 concentrations that exceeded EU standards by 4%, 15%, and 4%, respectively [42]. It is generally accepted that people in developing countries may be exposed to various harmful gases from the burning of spent fossil fuels from the production, transportation, and generation of electricity due to limited access to clean energy sources [43]. According to the World Bank Group, 36 of the 50 most polluted cities in the European Union are in Poland [44]. Furthermore, Polish cities are among the metropolitan areas with the highest PM estimated mortality burden [45]. Although annual outdoor particulate concentrations in Poland’s most polluted cities have steadily decreased, current values still do not meet World Health Organization (WHO) guidelines [46,47]. Huizong et al. [48] comprehensively and critically assessed the emission factors. They analyzed 270 scientific articles, inclusions, and extracts for data analysis. They tested and compiled emission factors (EFs) for common air pollutants, including CO, PM2.5, SO2, NOx, and polycyclic aromatic hydrocarbons (PAHs). In Poland, the primary sources of air pollution are emissions from fuel burning, mainly from the energy sector and households, and emissions from transport. Poland’s air protection policy has been largely passive, with the reduction in air pollution from industry and energy responding to EU requirements for these sectors. However, there are no regulations for home equipment, such as solid fuel stoves, boilers, and fireplaces. Local governments may ban the use of solid fuels for central heating in dusty areas. Moreover, there are no significant legal solutions in the transport sector to restrict old vehicles that contribute to harmful air pollution [49]. Due to Poland’s climate, the majority of the energy sold to homes (more than 65% in 2018) is used for heating in winter [50]. The implementation of advanced thermal modernization contributes to substantial reductions in greenhouse gas emissions [51] and, combined with the use of advanced control systems in heating systems [52], leads to possible can-do use of renewable energy sources for building heating [53]. However, caution should be exercised if key operating parameters of the system are not well defined (such as the thermal conductivity of the ground) [54]. It leads to worse plant operating conditions, longer electric motor operating hours, and increased pollutant emissions, especially in a country like Poland that burns coal to generate electricity. As seen in Europe, armed conflicts and wars between states can slow or stop the decarbonization process altogether, e.g., the “Fit for 55” package. In light of the war in Ukraine, it has been changed to avoid time burning natural gas en route to renewable energy sources.
The research presented in this article concerns heat supply in the Polish construction sector. The research results can be used to optimize heating system strategies by using renewable energy sources, which allows for improving the heating system control process and implementing an effective and rational fuel management strategy.
2. Materials and Methods
2.1. Description of the Analyzed Single-Family Building and Its Energy Needs
An existing single-family building in Bialystok, in the northeastern part of Poland, in a temperate continental climate, was selected for analysis. According to ASHRAE standards, this area is located in thermal climate zone 6A [55]. The house is a detached building built using traditional technology (made of brick) in 1973. It has two floors above ground, a heated attic, and a full basement. The roof is gable with an inclination of 40° towards the south and north. The building height is 10.83 m, and the building dimensions are width and length: 9.20 × 8.65 m. The primary data of the building are presented in Table 1.

Table 1.
Basic building data.
In 2016, the building underwent extensive thermal modernization. The external walls, basement walls, and roof were insulated, all old windows were replaced with triple-glazed, low-emission windows filled with argon, and the entrance door to the building was replaced. Table 2 lists the values of heat transfer coefficients U [W/m2K] of building partitions before and after thermal modernization, along with the type and thickness of the insulating material used when insulating a single-family building.
Table 2.
Summary of the values of heat transfer coefficients U [W/m2K] of building partitions before and after thermal modernization, along with the type and thickness of the insulating material used.
The central heating installation, DHW installation, and heat source were also modernized. The central heating installation was replaced entirely with a new pump-type one with convection plate heaters, the size of which was adapted to the lower temperature of the heating medium. Lower heating fluid parameters of 40/30 °C are maintained in the building during heating using an air heat pump AHP (up to the outside air temperature −1 °C). In the case of heating the building with a gas boiler or a solid fuel (wood) boiler, the parameters of the heating fluid are higher and amount to 60/40 °C. The AHP operates in an alternative bivalent system with additional heat sources, i.e., a gas boiler and a solid fuel boiler. The hybrid space heating system is supported by a photovoltaic installation with a power of 4.96 kWp.
The operation of the hybrid heat source was analyzed from September 2021 to September 2023. It covers two heating seasons in 2021/2022 and 2022/2023. The work analyzed whether the photovoltaic installation used is sufficient to cover the energy needs of a hybrid heat source operating for heating and DHW. The standard heating season (heating degree days, HDDs), at a measured internal temperature in the building of +22 °C, is 4559.4 degree days [°C·d].
The number of degree days of the heating season allows for the characterization of a given day in terms of energy and determination of the energy consumption for heating the building. It also allows for comparisons between heating seasons. The number of degree days can also be used to reference the standard long-term heating season, which considers average outdoor temperatures and the standard number of heating days in a given month and year. In Bialystok, the calculated number of days of the heating season is 232 days.
The number of days of the standard heating season and the heating season in 2021/2022 and 2022/2023 was calculated from the Equation (1):
where:
—number of degree days of the heating season, [°C∙d];
—measured average indoor air temperature in the building, = +22 °C;
—outdoor air temperature on the i-th day throughout the year, [°C];
—base temperature starting the heating season in the analyzed single-family building, = +15 °C.
In order to exclude seasonal fluctuations in external temperature changes in the 2021/2022 and 2022/2023 heating seasons, the degree day energy index ε was determined in accordance with Equation (2). It allows conversion of the measured value of thermal energy in a building in a given year into standard seasonal conditions, taking into account average outdoor temperatures for many years (1991–2020) provided by the Institute of Meteorology and Water Management—National Research Institute (IMGW—PIB) for the city of Bialystok [55].
where:
—number of degree days calculated in standard year, [°C∙d], 4559.4 °C·d;
—the number of degree days in a given i-th year, [°C∙d].
Table 3 shows the number of degree days characterizing the heating season in a given year, calculated in accordance with Formula (1) (the number of HDDs). The 2022/2023 heating season was shorter than 2021/2022. It was characterized by higher external air temperatures, and its number of degree days was 4116.9 °C∙d. Table 3 also includes the calculated degree day energy index ε, which allows for conversion of the actual thermal energy consumption for a standard heating season.
Table 3.
Characteristics of the heating season based on the number of degree days.
Figure 1 presents a summary of the monthly number of degree days in the standard heating season, the number of degree days in 2021/2022 and 2022/2023, and monthly outdoor air temperatures.
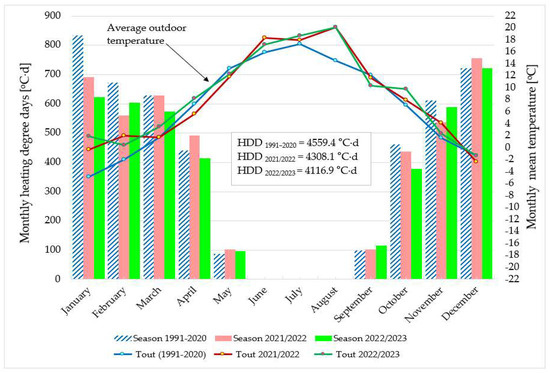
Figure 1.
A monthly number describing degree days of the standard heating season (1991–2020) and the 2021/2022 and 2022/2023 seasons, along with outdoor temperatures in these periods.
Total monthly heat losses resulting from heat exchange through external partitions (external walls, roof, basement ceiling, windows, and doors) and gravity ventilation, taking into account heat gains (internal and solar), are presented in Table 4. The table also presents the number of HDDs for each month of the standard heating season in [°C·d] calculated according to Formula (1) along with the demand for thermal energy in [kWh].
Table 4.
Characteristics of the heating season based on the number of HDDs and a summary of total monthly losses and gains in the analyzed single-family building.
The calculated design thermal load of the building is 11 kW. The thermal energy demand in the building for heating purposes is 23,759 kWh.
After the modernization of the installation, DHW is prepared using an individual internal AHP located in the basement of the building. The energy demand for DHW is 2725 kWh.
2.2. Description of the Hybrid Heating System in the Building Supported by the Operation of a Photovoltaic Installation
In the analyzed building, in a hybrid system, for heating purposes, there is an AHP type HPA-0 8 CS Plus, a gas condensing boiler type VC146/5-5 with a power of 14 kW, and, alternatively, a solid fuel boiler with a power of 11 kW. Any fuel, e.g., wood, can be burned in a solid fuel boiler with manual feed. During the heating season, the choice of fuel and boiler type is determined by a prior economic analysis, which considers the fuel price in a given period. Both gas and solid fuel boilers are used by users at outdoor air temperatures below −1 °C. For heating purposes, the AHP operates in an alternative bivalent system. The bivalent operating point of the heat pump is −1 °C. When the outside temperature drops below −1 °C, the AHP is turned off, and an additional heating source activates. In this case, it is a condensing gas boiler or a solid fuel boiler. In the 2021/2022 and 2022/2023 heating seasons, only the wood-burning boiler operated (30%); the AHP met the rest of the energy needs. The average operational efficiency of the AHP was SCOP = 4.37.
Figure 2 shows a view of the installed external AHP unit type HPA-0 8 CS Plus and the internal hydraulic module in a single-family building.
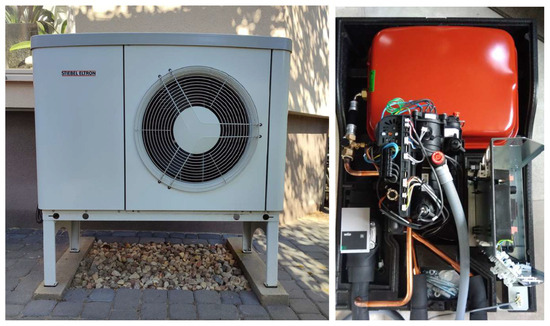
Figure 2.
The outdoor unit (left) and the interior of the internal hydraulic module (right) of an AHP installed in a single-family building for heating purposes (photos by the authors).
Figure 3 shows the operating temperature range of the AHP (from +15 °C to −1 °C) and additional heat sources. Figure 3 also shows the number of hours of a given temperature per year [56,57] in the temperature range from −22 °C to +30 °C. According to the diagram, the AHP operating time for the −1 °C bivalent point is 3870 h/year, including 1637 h/year at full load. However, the operating time at the bivalent point at 0 °C would be shorter and would amount to 3523 h/year, including 1442 h/year at full load. In Bialystok, the most hours during the year are at +1 °C, which is 495.9 h/year.
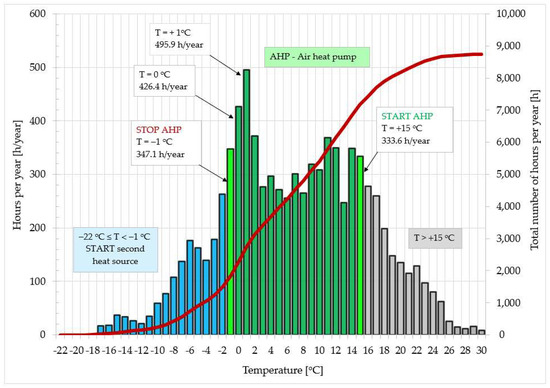
Figure 3.
Temperature range of the hybrid heating system for heating the building and the number of hours of a given temperature for the city of Bialystok (based on [56,57]).
Figure 4 shows the technological diagram of a hybrid system operating for central heating and DHW purposes in a single-family building supported by a photovoltaic installation with a capacity of 4.96 kWp.
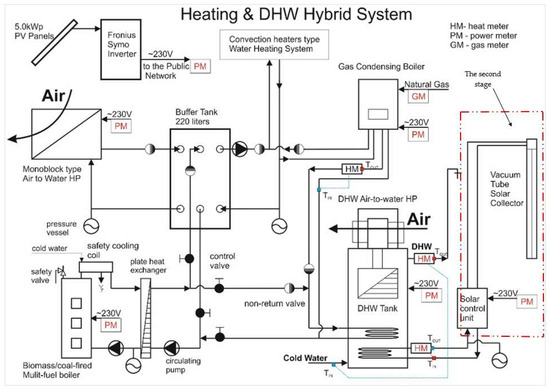
Figure 4.
Technological diagram of a hybrid system operating for central heating and DHW purposes in a single-family building supported by a photovoltaic installation with a capacity of 4.96 kWp.
Table 5 presents the essential technical data of the AHP used for space heating in a single-family building.
Table 5.
Technical parameters of AHP for space heating [57].
To achieve the optimal length of the AHP work cycle and the resulting better annual work rate, one buffer tank with a capacity of 220 dm3 was installed. It ensures hydraulic separation in the AHP and heating circuits and more uniform operation of devices when their heating power is not identical to the building’s instantaneous heat demand. The buffer tank also maintains the necessary minimum flow for AHP.
Figure 5 shows the change in the value of the energy efficiency coefficient COP of the installed AHP with a variable supply temperature of the heating medium (upper heat source) from +35 °C to +60 °C and a change in external temperature from −10 °C to +11 °C.
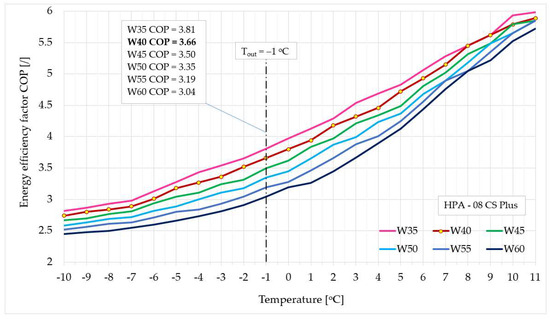
Figure 5.
Energy efficiency coefficient COP of AHP installed in a single-family building as a function of the temperature of the upper heat source (prepared based on [57]).
Depending on the temperature of the heating medium, the AHP’s COP value varies in the range from COPW60 = 2.45 to COPW35 = 5.98 at external temperatures from −10 °C to +11 °C, as shown in Figure 5. In the analyzed single-family building, the AHP operates in an alternative bivalent system, where the additional heat source is a gas condensing boiler or, alternatively, a solid fuel boiler. The parameters of the central heating system when heating the building with an AHP are 40/30 °C, and when changing to a second heat source, they are 80/60 °C. At an outdoor temperature of −1 °C, the energy efficiency of the AHP is, on average, COP = 3.66. The average seasonal SCOP for the tested AHP in the operating range from −1 °C to +15 °C is 4.31.
Table 6 provides the values of functions describing the change in the energy efficiency coefficient of the tested AHP depending on the change in the central heating installation’s supply temperature. The installation supply temperature range is from +35 °C to +60 °C (W35 ÷ W60). Hence, the heat pump’s average seasonal energy efficiency index for the bivalent points of −1 °C and −7 °C ranges from 3.22 to 4.37 (Table 6).
Table 6.
Function values describing the energy efficiency of AHP’s COP (type HPA-08 CS plus) at variable supply temperatures from +35 °C to +60 °C as a function of external air temperature.
According to the technological diagram shown in Figure 4, DHW heating is carried out using an individual air–water heat pump (DHW’s AHP), which works exclusively for DHW purposes. A tank with a capacity of 270 dm3 is integrated with the pump. An additional source for this AHP is a built-in electric heater. Installing AHP for DHW purposes did not require complicated installation or expensive drilling. The DHW’s AHP was installed inside the building, in the basement. Its installation required only a hydraulic and electrical system and air ducts. The DHW’s AHP is equipped with an anti-Legionella function, an Eco function for economic optimization of its operation, and an antifreeze function. The analyzed building does not use the antifreeze function because the heat pump draws air from the room. The internal temperature in the basement is +18 °C in winter and +20 °C in summer. The energy efficiency class of the installed DHW’s AHP is A+. The tank with a capacity of 270 dm3 is equipped with two heating coils. Currently, only one coil is connected to a gas condensing boiler, which only performs the anti-Legionella function, i.e., it heats the water in the tank to +70 °C once a week. Alternatively, the coil can be connected to a solid fuel boiler. The second coil (in the second stage of work) will be connected to the vacuum solar collector, and the measurement results for this system will be published in the following work. The DHW heating system also allows for partial cooling or dehumidification of the room in which it operates. This function is beneficial in the summer when the “used” air during hot weather can be used to cool the building.
The current measurements include changes in temperatures and humidity in the rooms affected by the tested AHP. Additionally, COP coefficients for the DHW’s AHP, the amount of heat supplied by the gas boiler, and the amount of heat provided to the DHW system are determined. Table 7 presents the primary technical data of the DHW’s AHP used for a 4-person family in a single-family building.
Table 7.
Technical parameters of the DHW’s AHP [58].
The hybrid system has been supplemented with an additional power source in the form of a 4.96 kWp photovoltaic installation (PV), which significantly reduces the operating costs of the DHW’s AHP and increases its efficiency. The DHW’s AHP has been adjusted to work without turning on the electric heater, which has a power of 2000 W.
2.3. Description of the Photovoltaic Installation (PV) Supplying Electricity to the Building
The photovoltaic installation (PV) consists of 16 PV panels with a power of 310 Wp each. The PV modules are placed according to the roof slope angle α = 40° towards the south. Under standard operating conditions (STCs), each of the 16 modules generates 310 Wp of power. Hence, the total power of the installed modules is 4.96 kWp. The total gross area of the installed photovoltaic panels is 26.2 m2, and a single PV panel has dimensions of 0.99 × 1.65 m. The efficiency given by the manufacturer is 19% [59]. LR6-60PE-310M PV modules are characterized by a slight power production deviation guaranteed by the manufacturer at the level of 2% and a positive power tolerance in the range of 0% to 4%. In addition, the manufacturer guarantees a 25-year linear degradation of panel efficiency of 0.55% and an increased static/dynamic load factor of 5.4/2.4 kN/m2. The modules are covered by a 10-year manufacturer’s warranty. The technical parameters of the installed PV modules are presented in Table 8.
Table 8.
Technical specification of PV modules type LR6-60PE-310M [59].
A view of the installed PV installation on the roof of a single-family building at an angle of 40° from the south side is shown in Figure 6.
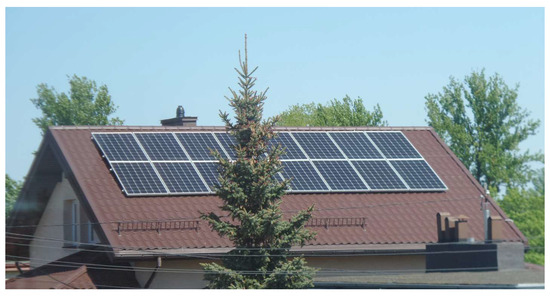
Figure 6.
View of a PV installation located on the south side at an angle of 40° on the roof of a single-family building (photo by the authors).
Under standard conditions, the amount of electricity produced in a given month by the considered PV installation with a capacity of 4.96 kWp is shown in Figure 7. The calculations assumed the monthly amount of solar radiation energy that falls on 26.2 m2 of the surface of PV modules with a southerly orientation towards the world and an angle inclination of 40° for the meteorological station in Bialystok in [kWh/m2∙month] [56]. Hence, the simulated annual amount of electricity the PV installation produces is 4852 kWh/year. The simulated amount of electricity produced in the article was compared with the values measured in 2021–2023 (until September). The relative annual energy yield is 975.6 kWh/kWp. The highest electricity yield is in June, 141.1 kWh/kWp, and the lowest in December, 18.4 kWh/kWp. The amount of monthly electricity obtained ranges from 91 kWh (January) to 700 kWh (June). In the context of Poland, an analysis of Figure 1 and Figure 7 reveals that in order to utilize electricity generated from PV installations for building heating, it is imperative to accumulate it during the summer months for subsequent use during the heating season.
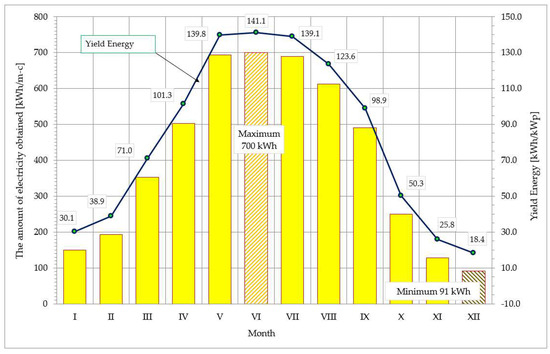
Figure 7.
Simulation of electricity production by a PV installation, along with its monthly yield [kWh/kWp].
The PV panels were connected with dedicated DC cables into circuit systems connected to the inverter. The Fronius Symo 4.5-3-S PV inverter that was used enables the conversion of energy supplied from PV panels (maximum voltage level 1000 V DC) in the form of direct current (DC) to the form of alternating current (AC) and adapting its parameters to the standards of the power grid to which it is connected. It protects against exceeding the permissible frequency levels of the power grid and allowable grid voltage levels. If the network frequency parameters or the network voltage level exceeds the set ranges (in this case, 253 V), the inverter turns off. In the event of a voltage failure in the power grid—for safety reasons—the inverter also turns off, which prevents island operation. The Symo 4.5-3-S inverter has two independent MPPT trackers, enabling it to follow the operating point in the maximum power of the attached string, which changes with the ambient temperature, solar radiation intensity level, and shading. The European inverter efficiency is 97% [60]. The technical parameters of the installed inverter are presented in Table 9.
Table 9.
Technical data of the Symo PV inverter type 4.5-3-S [60].
Measuring data are available thanks to built-in Wi-Fi connections and an integrated web server.
2.4. Methodology for Calculating the Amount of Pollutants Emitted into the Atmosphere during Fuel Combustion
Based on the energy consumption of the hybrid heat source: i.e., the AHP, condensing gas boiler, and solid fuel (wood) boiler for heating purposes and DHW in the period from September 2021 to September 2023, the amount of pollutant emissions emitted into the atmosphere (CO2, SOx, NOx, CO, and PM10) was calculated. The pollutant emission balance was prepared in two variants:
- Case 1—the photovoltaic installation does not support the heat source;
- Case 2—the heat source is supported by a photovoltaic installation with a capacity of 4.96 kWp.
The amount of a given pollutant was calculated according to Formulas (3) and (4):
where:
—the amount of the i-th pollutant emission without and including the photovoltaic installation 4.96 kWp, [kg/year];
—energy consumption during the heating season by a hybrid heat source: AHP, gas condensing boiler, solid fuel boiler (wood), [MWh/year];
—production of electricity from a photovoltaic installation with a capacity of 4.96 kWp, [MWh/year];
—emission index of the i-th pollutant related to the consumption of electricity (end-user) by the heat pump, [kg/MWh];
—emission index of the i-th pollutant related to the consumption of natural gas by a gas condensing boiler, [kg/MWh];
—emission index of the i-th pollutant related to the consumption of wood burning by a solid fuel boiler, [kg/MWh].
The calculation of emissions of CO2, SOx, NOx, CO, and PM10 pollutants into the atmosphere was made based on Formulas (3) and (4), adopting the emission factors of the i-th pollutant following applicable guidelines based on [61,62,63]. Current emission rates are presented in Table 10.
Table 10.
Pollutant emission factors for electricity, natural gas, and solid fuel (wood) according to [61,62,63].
The ecological effects obtained as a result of using a photovoltaic installation in a building were determined from Formula (5):
where:
—ecological effects obtained after using a photovoltaic installation in a single-family building [%].
Electricity savings resulting from using a photovoltaic installation are equal to the amount of electricity produced by this installation, which was entirely consumed by the receiving electrical installation.
3. Results and Discussion
During the tests, the operation of a hybrid heat source supported by a PV installation with a power of 4.96 kWp was assessed. The analysis of the heat source operation for building heating and DHW heating covers the period from September 2021 to September 2023, i.e., two heating seasons, 2021/2022 and 2022/2023. The operation of the hybrid installation is shown in Figure 4 and described in point 2.2.
During the analysis, it was checked whether the installed PV installation is sufficient to cover the demand for electricity in the building, especially for the needs of heating devices. The emission of pollutants into the atmosphere (CO2, SOx, NOx, CO, and PM10) was calculated in two variants: operation of the hybrid system without photovoltaic installation and including photovoltaic installation.
Electricity in the building is used for heating, DHW heating, lighting, operation of computers, household appliances (fridge, freezer, washer–dryer, electric cooker, coffee machine), operation of the gas boiler, and operation of automatic control devices in the boiler room and circulation pumps of heating and DHW. The total annual electricity consumption in the building for all needs based on measurement with a two-way electric meter was in 2021—5725 kWh/year, in 2022—5200 kWh, and in 2023 (until September 30)—3624 kWh. The average electricity consumption in the building was approximately 5400 kWh.
A PV installation with a capacity of 4.96 kWp was designed to reduce the electricity consumption taken from the power grid and thus reduce pollutants’ emissions into the atmosphere. The photovoltaic installation is primarily intended to provide the necessary amount of electricity to power two AHPs, one for central heating purposes and the second for DHW ones.
3.1. Results of Electricity Production from PV Installation
Table 11 presents the measured total amount of electricity produced by the PV installation mounted on the roof of the building (Figure 6) in the years 2021–2023 (until September 30) and compares it with simulation calculations, taking into account the average intensity of solar radiation in Bialystok over many years [55].
Table 11.
Results of electricity production from a PV installation with a capacity of 4.96 kWp compared to calculations in the statistical years 1991–2020 based on simulations.
The photovoltaic installation produced 4855 kWh in 2021, 5281 kWh in 2022, and 4845 kWh in 2023 (until September 30).
The heating season lasted 232 days in 2021 and covered the periods from 1 January to 5 May and from 21 September to 31 December. The results of the daily electricity production of the PV installation during the heating season and beyond in 2021–2023 (until September 30) are presented in Figure 8, Figure 9 and Figure 10.
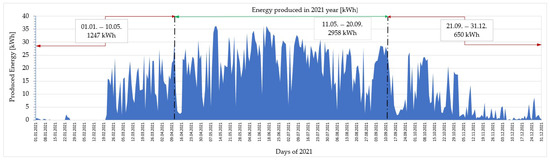
Figure 8.
Results of the daily electricity production of the PV installation during the heating season (1 January–5 May; 21 September–31 December) and outside it (11 May–20 September) in 2021.
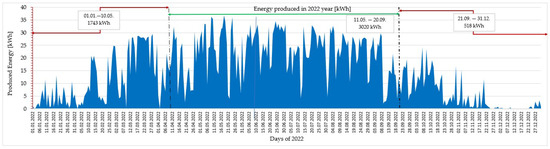
Figure 9.
Results of the daily electricity production of the PV installation during the heating season (1 January–5 May; 21 September–31 December) and outside it (11 May–20 September) in 2022.
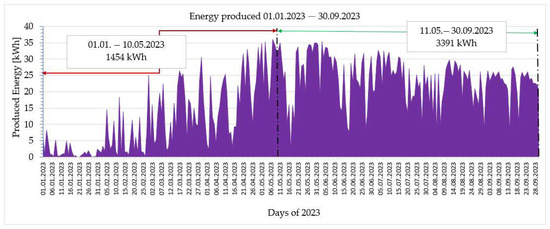
Figure 10.
Daily electricity production results from the PV installation operation from January to September 2023.
Taking into account the production of electricity only during the heating season in Poland, the amounts were 1897 kWh (2021), 2261 kWh (2022), and 1454 kWh (2023 until September 30). These account for 39% to 43% of the total annual electricity production from PV installations. The highest production was from April to September (Figure 8, Figure 9 and Figure 10).
Figure 8, Figure 9 and Figure 10 show that the daily amount of electricity produced by a PV installation is insufficient to cover the heat pump’s energy needs for heating purposes in the cold months in Poland (I, II, III, XI, XII). It is clear that energy should be stored in the summer months, e.g., in energy warehouses or by “storing” it directly in the power grid.
In the analyzed building, the unused amount of electricity produced in the summer months was stored in the power grid. According to Poland’s current “Prosumer” settlement rules, 80% of the electricity introduced into the grid can be collected from it. This can be especially beneficial during the autumn and winter months when the lowest solar radiation intensity occurs, allowing the collected electricity to be used for building heating purposes. For example, in June 2021, with the electricity production from the PV installation amounting to 836.5 kWh, 670 kWh was fed back into the grid, constituting 81% of the energy produced. Average daily production in June was approximately 29 kWh/d. The electricity produced in the PV installation is used in the summer to heat the DHW using air-to-water HP and other energy needs of the building. However, the amount of energy needed in the summer months is much smaller than the production from PV and requires storage. Figure 11 shows an example of daily electricity production by a PV installation in June 2021.
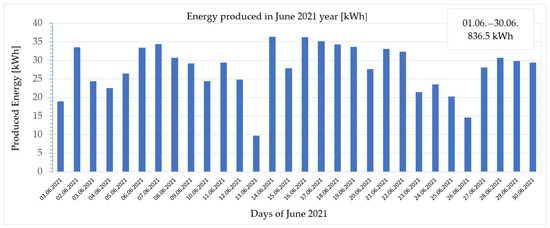
Figure 11.
Results of monthly electricity production of the PV installation in June 2021.
In Poland, the production of electricity from a PV installation depends on its angle relative to the horizon and direction towards the world. By simulating the production of electricity by a PV installation by changing its angle from 0 to 90 degrees, the highest relative annual efficiency was achieved at an angle of 41 degrees. It should be noted that the PV installation in the building is installed at an angle of 40°.
The best simulation angle for PV panels in Poland is shown in Figure 12.
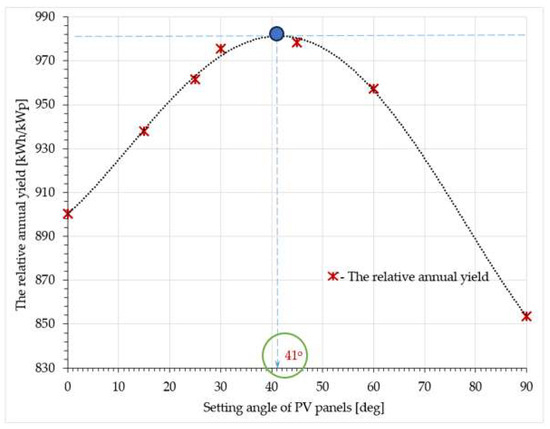
Figure 12.
Optimal angle of PV panels with relative annual efficiency from a PV installation.
3.2. Electricity Consumption by a Hybrid Heat Source
After measuring the AHP operating for space heating purposes, the electricity consumption of the AHP was measured from September 2021 to September 2023, covering two heating seasons, 2021/2022 and 2022/2023. Based on AHP measurements, it consumed 3804.34 kWh of electricity in the 2021/2022 heating season and 3480.31 kWh in the 2022/2023 one. The measured electricity consumption of the AHP for heating purposes only from September 2021 to September 2023 is shown in Figure 13.
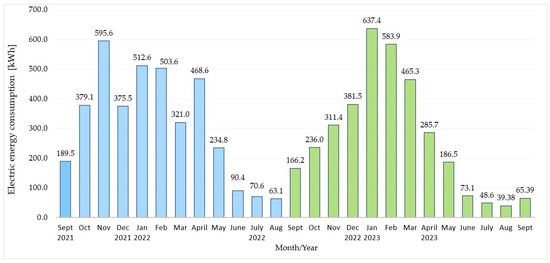
Figure 13.
Measured electricity consumption of AHP for heating purposes from September 2021 to September 2023.
The AHP was also turned on outside the heating season in June, July, and August in 2022 and 2023 when the night temperature dropped below +17 °C and it was rainy, while the inside of the building was humid. The perceived temperature was low, which caused no thermal comfort for home users. Electricity consumption in 2022 (April–July) was 224.1 kWh, and in 2023, it was 172.8 kWh. The varied consumption of electricity by the AHP resulted from the fact that the analyzed heating seasons differed in the calculated number of degree days and external temperatures (Figure 1), which impacted energy consumption.
It should be noted that the AHP operates only up to an external temperature of −1 °C; in Bialystok, lower temperatures occur for a maximum of 62 days a year, i.e., a maximum of 2 months of the heating season. A typical heating season in Bialystok lasts 232 days, i.e., approximately 7.5 months a year, with the number of degree days of the heating season being 4559.4 °C·d (Table 3). At temperatures below −1 °C, a gas boiler (if there are no users in the house) operates automatically, or a solid fuel boiler with constant user service (Figure 3 and Figure 4). Only the solid fuel boiler burning wood operated in the 2021/2022 and 2022/2023 heating seasons. However, the gas boiler (GB–Condens.) was automatically turned on only once a week, heating the water in the tank to a temperature of +70 °C to disinfect it against Legionella bacteria.
In the analyzed hybrid system, the DHW’s AHP works all year round solely to prepare the DHW for a family of four. The total electricity consumption for heating DHW, including disinfection of the DHW tank, in the 2021/2022 season was 926.94 kWh, and in 2022/2023, it was 1174.32 kWh. Table 12 shows the annual measured electricity consumption of the DHW’s AHP and GB–Condens., which disinfect the DHW tank. The average monthly electricity consumption of the gas boiler is approximately 29 kWh, and that of the DHW’s AHP is approximately 55 kWh. The gas boiler (GB–Condens.) is in standby mode all year round; the given average electricity consumption includes the auxiliary energy of the boiler and heating once a week DHW.
Table 12.
Annual electricity consumption of DHW’s AHP and GB–Condens.
Table 13 and Figure 14 present the share of PV installations covering the energy needs of the following devices: AHP, DHW’s AHP, and GB–Condens. in the period from September 2021 to September 2023, as well as the amount of electricity produced by the PV installation.
Table 13.
The share of PV installation in covering the energy needs of the following devices: AHP, DHW’s AHP, and GB–Condens. in the period from September 2021 to September 2023.
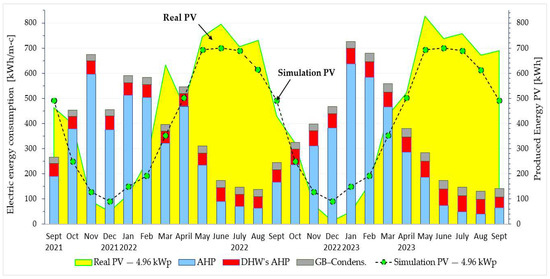
Figure 14.
Total electricity consumption by two air HPs and a gas boiler, along with real and simulated electricity production by a photovoltaic installation with a capacity of 4.96 kWp. Designations: AHP—air heat pump for heating; DHW’s AHP—air pump for DHW purposes; GB–Condens.—condensing gas boiler; PV–4.96 kWp—actual electricity production by the PV installation; PV–Standard—simulated electricity production (1990–2020).
Based on Table 13 and Figure 14, it is evident that a PV installation in Poland, designed solely for the building’s own needs, without energy storage, cannot meet the required electricity for heating during the heating season. The total annual production from a 4.96 kWp PV installation was 5444.9 kWh in the 2021/2022 season and 5684.8 kWh in 2022/2023. The installed PV installation is sufficient to meet the electricity needs of the AHP, DHW’s AHP, and GB–Condens., which are used for heating and DHW preparation in the building.
Figure 14 shows the actual production from a 4.96 kWp PV installation and the energy needs of heating devices in the building during the analysis period. The overproduction of electricity is visible in the spring and summer, i.e., outside Poland’s heating season. Hence, it is clear that the accumulation of electricity is required.
3.3. Results of Emissions and Reduction in Pollutants into the Atmosphere
Table 14 shows the calculated amount of pollutants for two heating seasons, 2021/2022 and 2022/2023, during the operation of a hybrid heat source for heating and DHW purposes for a four-person family in the analyzed single-family building. The presented balance for the period from September 2021 to September 2023 was prepared in two variants: without taking into account the PV installation (case 1) and taking into account the electricity production by a PV installation with a capacity of 4.96 kWp (case 2).
Table 14.
Results of emissions of CO2, SOx, NOx, CO, and PM10 pollutants into the atmosphere in the heating season 2021/2022 and 2022/2023 in two variants without a PV installation (case 1) and with a PV installation (case 2).
As a result of using a 4.89 kWp PV installation in the building, an average reduction in air pollutant emissions was achieved at the level of CO2—94.1%, SOx—91.8%, NOx—95.6%, CO—9.7%, and PM10—32.1%, as shown in Table 15.
Table 15.
Reduction in emissions of CO2, SOx, NOx, CO, and PM10 pollutants into the atmosphere in the heating season 2021/2022 and 2022/2023 after using a PV installation.
4. Conclusions and Future Perspectives
Based on the conducted research analyzing a hybrid power-heating system in a single-family building along with ecological aspects of its operation, several possible conclusions can be drawn:
- Efficiency and cost-effectiveness: The hybrid power-heating system is more efficient and cost-effective than traditional systems. Integrating renewable energy sources, such as solar panels or geothermal heat pumps, reduces reliance on fossil fuels and lowers energy expenses in the long run.
- Benefits for the environment: The study of ecological aspects allows us to highlight the hybrid system’s positive environmental impact. It shows that using renewable energy sources reduces greenhouse gas emissions, promotes sustainable practices, and contributes to mitigating climate change.
- Energy independence and resilience: The analysis shows that the hybrid heating system increases the energy independence of single-family buildings. Integrating different energy sources makes the building less dependent on the grid and more resilient to power outages or fluctuations in energy prices.
- Adaptability and scalability: The results suggest that the hybrid system is adaptable and scalable for different types of single-family buildings. This can provide insights into the system’s flexibility to meet fluctuating energy demands and the potential for broader deployment in residential contexts.
- Policy and regulatory implications: The analysis helps identify policy and regulatory implications for promoting hybrid electric heating systems. This highlights the need to support policies, incentives, and legislation that encourage the adoption of such programs, contributing to a sustainable energy transition on a broader level.
- In the context of utilizing electricity generated by PV installations for building heating in Poland, storing the electricity produced during the summer for use during the heating season is necessary. Notably, the electricity generated during the heating season is insufficient, accounting for only 39% to 43% of the total annual electricity production from the PV installation in the analyzed scenario.
- The analysis results show that installing PV systems can significantly reduce atmospheric pollution.
In the next stage of work, after the end of the next heating season, simulation calculations will be performed using the available energy flow simulation software (e.g., OpenStudio, Energy+, Trnsys, Energy Office, Design Builder).
Author Contributions
Conceptualization, G.W. and J.P.-W.; data curation, G.W., J.P.-W. and A.W.; investigation, G.W., J.P.-W. and A.W.; methodology, G.W. and J.P.-W.; project administration, G.W., J.P.-W., E.O., K.G. and A.W.; supervision, J.P.-W.; writing—original draft, G.W. and J.P.-W.; writing—reviewing and editing, G.W., J.P.-W., E.O., K.G. and A.W. All authors have read and agreed to the published version of the manuscript.
Funding
The research was carried out as part of the work No. WZ/WBiIS/6/2023 and WZ/WBiIS/7/2023 at the Bialystok University of Technology.
Data Availability Statement
The data presented in this study are available on request from the corresponding author.
Acknowledgments
Meteorological data are available thanks to the kindness of the Institute of Meteorology and Water Management—National Research Institute (IMGW-PIB).
Conflicts of Interest
The authors declare no conflicts of interest.
References
- European Parliament. European Parliament Resolution of 15 January 2020 on the European Green Deal 2019, 2956 (RSP). Available online: https://www.europarl.europa.eu/doceo/document/TA-9-2020-0005_EN.html (accessed on 3 March 2024).
- European Parliament. European Parliament Resolution of 14 March 2019 on Climate Change-A European Strategic Long-Term Vision for a Prosperous, Modern, Competitive and Climate Neutral Economy in Accordance with the Paris Agreement 2019, 2582 (RSP). Available online: https://www.europarl.europa.eu/doceo/document/TA-8-2019-0217_EN.html (accessed on 5 March 2024).
- International Energy Agency (IEA). Global Status Report for Buildings and Construction 2019; IEA: Paris, France, 2019; Available online: https://www.iea.org/reports/global-status-report-for-buildings-and-construction-2019 (accessed on 15 March 2024).
- United Nations Environment Programme. 2020 Global Status Report for Buildings and Construction: Towards a Zero-Emission, Efficient and Resilient Buildings and Construction Sector; United Nations Environment Programme: Nairobi, Kenya, 2020; Available online: https://globalabc.org/news/launched-2020-global-status-report-buildings-and-construction (accessed on 21 March 2024).
- Liu, M.; Vecchi, G.A.; Smith, J.A.; Knutson, T.R. Causes of large projected increases in hurricane precipitation rates with global warming. NPJ Clim. Atmos. Sci. 2019, 2, 38. [Google Scholar] [CrossRef]
- IPCC. 2021: Summary for Policymakers. In Climate Change 2021: The Physical Science Basis. Contribution of Working Group I to the Sixth Assessment Report of the Intergovernmental Panel on Climate Change; Masson-Delmotte, V., Zhai, P., Pirani, A., Connors, S.L., Péan, C., Berger, S., Caud, N., Chen, Y., Goldfarb, L., Gomis, M.I., et al., Eds.; Cambridge University Press: Cambridge, UK, 2023. [Google Scholar]
- Piotrowska-Woroniak, J.; Cieśliński, K.; Woroniak, G.; Bielskus, J. The Impact of Thermo-Modernization and Forecast Regulation on the Reduction of Thermal Energy Consumption and Reduction of Pollutant Emissions into the Atmosphere on the Example of Prefabricated Buildings. Energies 2022, 15, 2758. [Google Scholar] [CrossRef]
- Nazari, M.A.; Rungamornrat, J.; Prokop, L.; Blazek, V.; Misak, S.; Al-Bahrani, M.; Ahmadi, M.H. An updated review on integration of solar photovoltaic modules and heat pumps towards decarbonization of buildings. Energy Sustain. Dev. 2023, 72, 230–242. [Google Scholar] [CrossRef]
- Usman, M.; Jonas, D.; Frey, G. A methodology for multi-criteria assessment of renewable integrated energy supply options and alternative HVAC systems in a household. Energy Build. 2022, 273, 112397. [Google Scholar] [CrossRef]
- Morewood, J. Building energy performance monitoring through the lens of data quality: A review. Energy Build. 2023, 279, 112701. [Google Scholar] [CrossRef]
- Jahanafroozi, N.; Shokrpour, S.; Nejati, F.; Benjeddou, O.; Khordehbinan, M.W.; Marani, A.; Nehdi, M.L. New Heuristic Methods for Sustainable Energy Performance Analysis of HVAC Systems. Sustainability 2022, 14, 14446. [Google Scholar] [CrossRef]
- Krarouch, M.; Allouhi, A.; Hamdi, H.; Outzourhit, A. Energy, exergy, environment and techno-economic analysis of hybrid solar-biomass systems for space heating and hot water supply: Case study of a Hammam building. Renew. Energy 2024, 222, 119941. [Google Scholar] [CrossRef]
- Neubert, D.; Glück, C.; Schnitzius, J.; Marko, A.; Wapler, J.; Bongs, C.; Felsmann, C. Analysis of the Operation Characteristics of a Hybrid Heat Pump in an Existing Multifamily House Based on Field Test Data and Simulation. Energies 2022, 15, 5611. [Google Scholar] [CrossRef]
- Ren, X.Y.; Li, L.L.; Ji, B.X.; Liu, J.Q. Design and analysis of solar hybrid combined cooling, heating and power system: A bi-level optimization model. Energy 2024, 292, 130362. [Google Scholar] [CrossRef]
- Da, J.; Li, M.; Li, G.; Wang, Y.; Zhang, Y. Simulation and experiment of a photovoltaic—air source heat pump system with thermal energy storage for heating and domestic hot water supply. Build. Simul. 2023, 16, 1897–1913. [Google Scholar] [CrossRef]
- Chhugani, B.; Pärisch, P.; Helmling, S.; Giovannetti, F. Comparison of PVT—heat pump systems with reference systems for the energy supply of a single-family house. Sol. Energy Adv. 2023, 3, 100031. [Google Scholar] [CrossRef]
- Beccali, M.; Bonomolo, M.; Martorana, F.; Catrini, P.; Buscemi, A. Electrical hybrid heat pumps assisted by natural gas boilers: A review. Appl. Energy 2022, 322, 119466. [Google Scholar] [CrossRef]
- Herrando, M.; Coca-Ortegón, A.; Guedea, I.; Fueyo, N. Experimental validation of a solar system based on hybrid photovoltaic-thermal collectors and a reversible heat pump for the energy provision in non-residential buildings. Renew. Sustain. Energy Rev. 2023, 178, 113233. [Google Scholar] [CrossRef]
- Buday, T.; Buday-Bódi, E. Reduction in CO2 Emissions with Bivalent Heat Pump Systems. Energies 2023, 16, 3209. [Google Scholar] [CrossRef]
- Tangwe, S.; Mukumba, P.; Makaka, G. An Installed Hybrid Direct Expansion Solar Assisted Heat Pump Water Heater to Monitor and Modeled the Energy Factor of a University Students’ Accommodation. Energies 2023, 16, 1159. [Google Scholar] [CrossRef]
- Stokowiec, K.; Wciślik, S.; Kotrys-Działak, D. Innovative Modernization of Building Heating Systems: The Economy and Ecology of a Hybrid District-Heating Substation. Inventions 2023, 8, 43. [Google Scholar] [CrossRef]
- Chwieduk, B.; Chwieduk, D. Analysis of operation and energy performance of a heat pump driven by a PV system for space heating of a single family house in polish conditions. Renew. Energy 2021, 165 Pt 2, 117–126. [Google Scholar] [CrossRef]
- Herrería-Alonso, S.; Suárez-González, A.; Rodríguez-Pérez, M.; Rodríguez-Rubio, R.F.; López-García, C. A Solar Altitude Angle Model for Efficient Solar Energy Predictions. Sensors 2020, 20, 1391. [Google Scholar] [CrossRef]
- Mayer, M.J.; Gróf, G. Extensive comparison of physical models for photovoltaic power forecasting. Appl. Energy 2021, 283, 116239. [Google Scholar] [CrossRef]
- Rijvers, L.; Rindt, C.; de Keizer, C. Numerical Analysis of a Residential Energy System That Integrates Hybrid Solar Modules (PVT) with a Heat Pump. Energies 2022, 15, 96. [Google Scholar] [CrossRef]
- Zukowski, M.; Woroniak, G. Estimation of energy savings resulting from the cooperation of an air to water heat pump with a solar air heater. Sol. Energy 2023, 250, 182–193. [Google Scholar] [CrossRef]
- Roccatello, E.; Prada, A.; Baggio, P.; Baratieri, M. Analysis of the Influence of Control Strategy and Heating Loads on the Performance of Hybrid Heat Pump Systems for Residential Buildings. Energies 2022, 15, 732. [Google Scholar] [CrossRef]
- Singla, P.; Duhan, M.; Saroha, S. A comprehensive review and analysis of solar forecasting techniques. Front. Energy 2022, 16, 187. [Google Scholar] [CrossRef]
- Canale, L.; Di Fazio, A.R.; Russo, M.; Frattolillo, A.; Dell’Isola, M. An Overview on Functional Integration of Hybrid Renewable Energy Systems in Multi-Energy Buildings. Energies 2021, 14, 1078. [Google Scholar] [CrossRef]
- Vialetto, G.; Noro, M.; Rokini, M. Studying a hybrid system based on solid oxide fuel cell combined with an air source heat pump and with a novel heat recovery. J. Electrochem. Energy Convers. Storage 2019, 16, 021005. [Google Scholar] [CrossRef]
- Martin-Escudero, K.; Salazar-Herran, E.; Campos-Celador, A.; Diarce-Belloso, G.; Gomez-Arriaran, I. Solar energy system for heating and domestic hot water supply by means of a heat pump coupled to a photovoltaic ventilated façade. Sol. Energy 2019, 183, 453–462. [Google Scholar] [CrossRef]
- Piotrowska-Woroniak, J.; Woroniak, G.; Zaluska, W. Energy production from PV and carbon reduction in great lakes region of Masuria Poland: A case study of water park in Elk. Renew. Energy 2015, 83, 1315–1325. [Google Scholar] [CrossRef]
- Thieblemont, H.; Haghighat, F.; Ooka, R.; Moreau, A. Predictive control strategies based on weather forecast in buildings with energy storage system: A review of the state-of-the art. Energy Build. 2017, 153, 485–500. [Google Scholar] [CrossRef]
- Hou, J.; Li, H.; Nord, N.; Huang, G. Model predictive control under weather forecast uncertainty for HVAC systems in university buildings. Energy Build. 2022, 257, 111793. [Google Scholar] [CrossRef]
- Adegbenro, A.; Short, M.; Angione, C. An Integrated Approach to Adaptive Control and Supervisory Optimisation of HVAC Control Systems for Demand Response Applications. Energies 2021, 14, 2078. [Google Scholar] [CrossRef]
- Nasouri, M.; Delgarm, N. Numerical Modeming, Energy–Exergy Analyses, and Multi-objective Programming of the Solar-assisted Heat Pump System Using Genetic Algorithm Coupled with the Multi-criteria Decision Analysis. Arab. J. Sci. Eng. 2023, 48, 3537–3557. [Google Scholar] [CrossRef]
- Famiglietti, J.; Toppi, T.; Bonalumi, D.; Motta, M. Heat pumps for space heating and domestic hot water production in residential buildings, an environmental comparison in a present and future scenario. Energy Convers. Manag. 2023, 276, 116527. [Google Scholar] [CrossRef]
- Naumann, G.; Schropp, E.; Gaderer, M. Life Cycle Assessment of an Air-Source Heat Pump and a Condensing Gas Boiler Using an Attributional and a Consequential Approach. Procedia CIRP 2022, 105, 351–356. [Google Scholar] [CrossRef]
- Nazar, W.; Niedoszytko, M. Air Pollution in Poland: A 2022 Narrative Review with Focus on Respiratory Diseases. Int. J. Environ. Res. Public Health 2022, 19, 895. [Google Scholar] [CrossRef] [PubMed]
- Cohen, A.J.; Brauer, M.; Burnett, R.; Anderson, H.R.; Frostad, J.; Estep, K.; Balakrishnan, K.; Brunekreef, B.; Dandona, L.; Dandona, R.; et al. Estimates and 25-year trends of the global burden of disease attributable to ambient air pollution: An analysis of data from the Global Burden of Diseases Study 2015. Lancet 2017, 389, 1907–1918. [Google Scholar] [CrossRef] [PubMed]
- European Environment Agency. Health Impacts of Air Pollution in Europe. 2021. Available online: https://www.eea.europa.eu/publications/air-quality-in-europe-2021/health-impacts-of-air-pollution (accessed on 24 March 2024).
- European Environment Agency. Air Quality in Europe 2021 Report; EEA Report No 15/2021; European Environment Agency, Publications Office of the European Union: Luxembourg, 2021. [Google Scholar]
- Rasoulinezhad, E.; Taghizadeh-Hesary, F.; Taghizadeh-Hesary, F. How Is Mortality Affected by Fossil Fuel Consumption, CO2 Emissions and Economic Factors in CIS Region? Energies 2020, 13, 2255. [Google Scholar] [CrossRef]
- World Bank Group. In the Spotlight. Air Quality in Poland, What Are the Issues and What Can be Done? 2019. Available online: https://documents1.worldbank.org/curated/en/426051575639438457/pdf/Air-Quality-in-Poland-What-are-the-Issues-and-What-can-be-Done.pdf (accessed on 26 May 2024).
- Khomenko, S.; Cirach, M.; Pereira-Barboza, E.; Mueller, N.; Barrera-Gómez, J.; Rojas-Rueda, D.; de Hoogh, K.; Hoek, G.; Nieuwenhuijsen, M. Premature mortality due to air pollution in European cities: A health impact assessment. Lancet Planet. Health 2021, 5, e121–e134. [Google Scholar] [CrossRef]
- Nazar, W.; Plata-Nazar, K. Changes in Air Pollution-Related Behaviour Measured by Google Trends Search Volume Index in Response to Reported Air Quality in Poland. Int. J. Environ. Res. Public Health 2021, 18, 11709. [Google Scholar] [CrossRef]
- Traczyk, P.; Gruszecka-Kosowska, A. The Condition of Air Pollution in Kraków, Poland, in 2005–2020, with Health Risk Assessment. Int. J. Environ. Res. Public Health 2020, 17, 6063. [Google Scholar] [CrossRef]
- Shen, H.; Luo, Z.; Xiong, R.; Liu, X.; Zhang, L.; Li, Y.; Du, W.; Chen, Y.; Cheng, H.; Shen, G.; et al. A critical review of pollutant emission factors from fuel combustion in home stoves. Environ. Int. 2021, 157, 106841. [Google Scholar] [CrossRef]
- Kolasa-Więcek, A.; Suszanowicz, D.; Pilarska, A.A.; Pilarski, K. Modelling the Interaction between Air Pollutant Emissions and Their Key Sources in Poland. Energies 2021, 14, 6891. [Google Scholar] [CrossRef]
- GUS. Energy Efficiency in Poland in Years 2008–2018; Statistical Analyses: Warsaw, Poland, 2020; 61p. Available online: www.stat.gov.pl (accessed on 4 April 2024).
- Woroniak, G.; Piotrowska-Woroniak, J. Effects of pollution reduction and energy consumption reduction in small churches in Drohiczyn community. Energy Build. 2014, 72, 51–61. [Google Scholar] [CrossRef]
- Piotrowska-Woroniak, J.; Szul, T. Application of a Model Based on Rough Set Theory (RST) to Estimate the Energy Efficiency of Public Buildings. Energies 2022, 15, 8793. [Google Scholar] [CrossRef]
- Szul, T.; Lis, S.; Tomasik, M. Assessment of energy and economic efficiency of a heating system based on heat pumps cooperating with photovoltaic micro installations. Electrotech. Rev. 2020, 96, 94–97. [Google Scholar] [CrossRef]
- Piotrowska-Woroniak, J. Assessment of Ground Regeneration around Borehole Heat Exchangers between Heating Seasons in Cold Climates: A Case Study in Bialystok (NE, Poland). Energies 2021, 14, 4793. [Google Scholar] [CrossRef]
- ANSI/ASHRAE Standard 169-2021; Climatic Data for Building Design Standards. American Society of Heating. Refrigerating and Air-Conditioning Engineers: Atlanta, GA, USA, 2021.
- Statistical Climatic Data for the Area of Poland for Energy Calculations of Buildings (Bialystok Weather Station). Available online: https://dane.gov.pl/pl/dataset/797,typowe-lata-meteorologiczne-i-statystyczne-dane-klimatyczne-dla-o?page=1&per_page=20&q=&sort=title&model=resources (accessed on 25 March 2024). (In Polish)
- Design Materials from Stiebel Eltron. Available online: https://www.stiebel-eltron.pl/toolbox/content/docs/planning/pl/Mini_Plama_HPA-O_CS_Plus.pdf (accessed on 25 March 2024). (In Polish).
- Galmet Materials—Heat Pump with Domestic Hot Water Heating. Available online: http://www.galmet.eu/ulotki/Ulotka_EN_02.pdf (accessed on 25 March 2024). (In Polish).
- Materials LR6-60PE 310M LongiSolar. Available online: https://www.solaris-shop.com/longi-solar-lr6-60hpb-310m-310w-mono-solar-panel/ (accessed on 25 March 2024).
- Fronius Materials—Symo 4.5-3-S Inverter. Available online: https://www.fronius.com/pl-pl/poland/energia-sloneczna/instalatorzy-i-partnerzy/dane-techniczne/wszystkie-produkty/falownik/fronius-symo/fronius-symo-4-5-3-s (accessed on 25 March 2024). (In Polish).
- The National Centre for Emissions Management. CO2, SO2, NOx, CO and Total Dust Emission Indicators for Electricity; National Center for Emission Balancing and Management: Warsaw, Poland, 2021; Available online: https://kobize.pl/uploads/materialy/materialy_do_pobrania/wskazniki_emisyjnosci/Wska%C5%BAniki_emisyjno%C5%9Bci_dla_energii_elektrycznej_grudzie%C5%84_2022.pdf (accessed on 25 March 2024). (In Polish)
- The National Centre for Emissions Management, Calorific Values (CA) and CO2 Emission Factors (WE) in 2020 for Reporting under the Emission Allowances Trading System for 2023, Warsaw. 2022. Available online: https://www.kobize.pl/pl/article/komunikaty/id/2232/wartosci-opalowe-wo-i-wskazniki-emisji-co2-we-w-roku-2020-do-raportowania-w-ramach-systemu-handlu-uprawnieniami-do-emisji-za-rok-2023 (accessed on 25 March 2024). (In Polish).
- Emission Indicators of Air Pollutants Emitted from Individual Heat Sources Developed by the Institute for Chemical Processing of Coal IOŚ-PIB KOBiZE. Available online: https://dane.gov.pl/pl/dataset/2182,wskazniki-emisji-zanieczyszczen-powietrza-emitowan/resource/31256/table (accessed on 25 March 2024). (In Polish)
Disclaimer/Publisher’s Note: The statements, opinions and data contained in all publications are solely those of the individual author(s) and contributor(s) and not of MDPI and/or the editor(s). MDPI and/or the editor(s) disclaim responsibility for any injury to people or property resulting from any ideas, methods, instructions or products referred to in the content. |
© 2024 by the authors. Licensee MDPI, Basel, Switzerland. This article is an open access article distributed under the terms and conditions of the Creative Commons Attribution (CC BY) license (https://creativecommons.org/licenses/by/4.0/).