Integrated Design and Flight Validation of Solar-Powered Unmanned Aerial Vehicle (UAV) Structure and Propulsion System


Abstract
:1. Introduction
1.1. Concept of Integrated Design
1.2. Integrated Design Work of the Solar-Powered UAV
1.3. Main Contributions of This Paper
2. Layout Design
2.1. Power System
2.2. Layout Configuration
2.3. Design Requirements
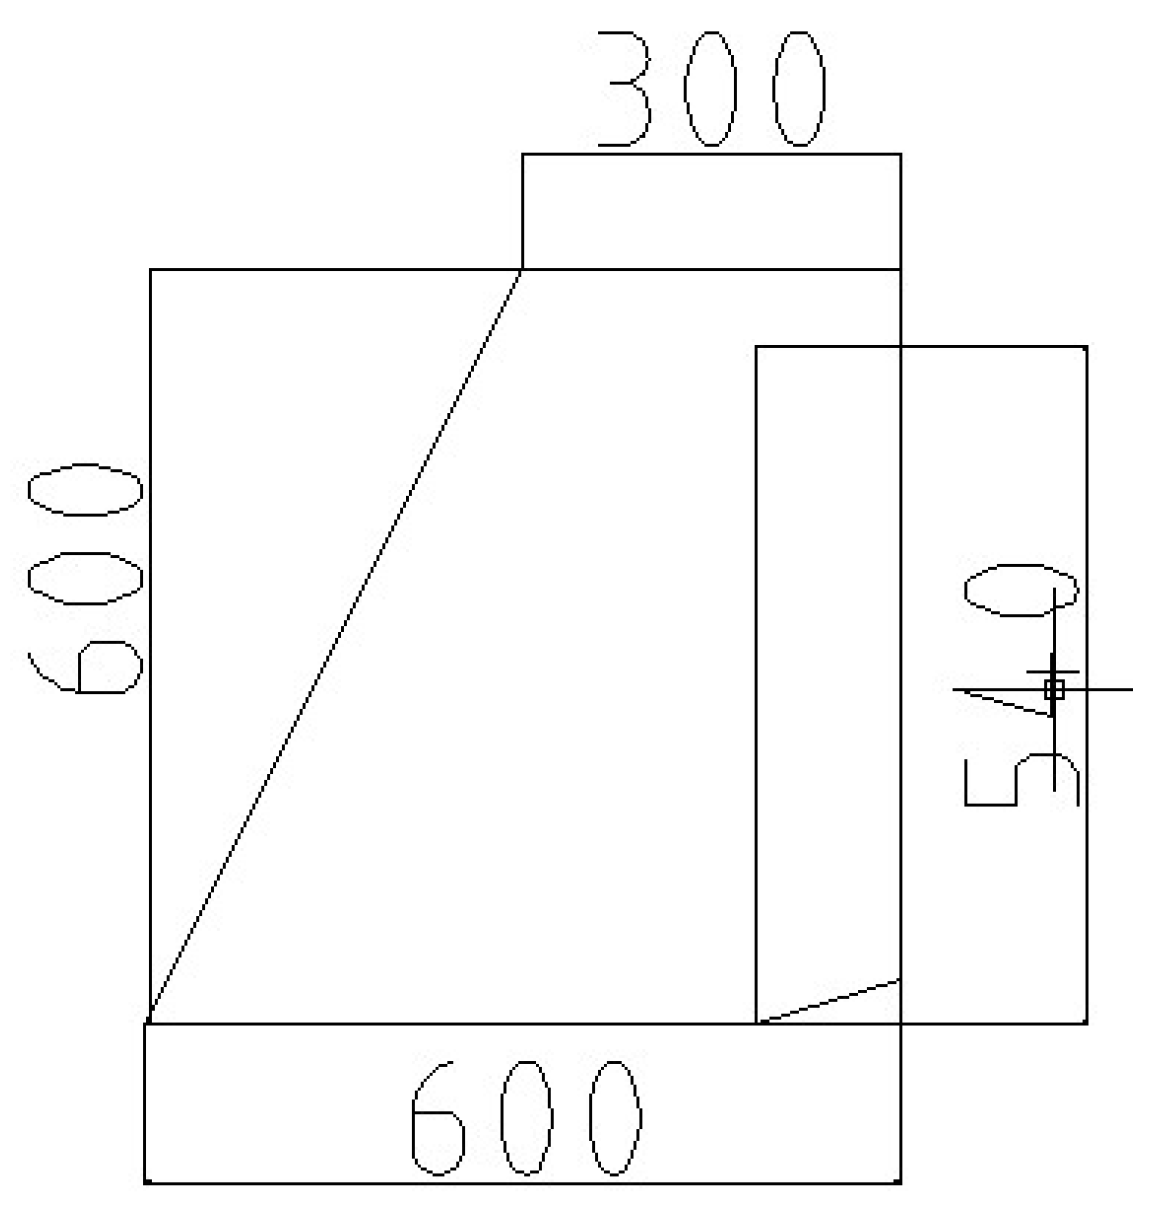
2.4. Wing Design
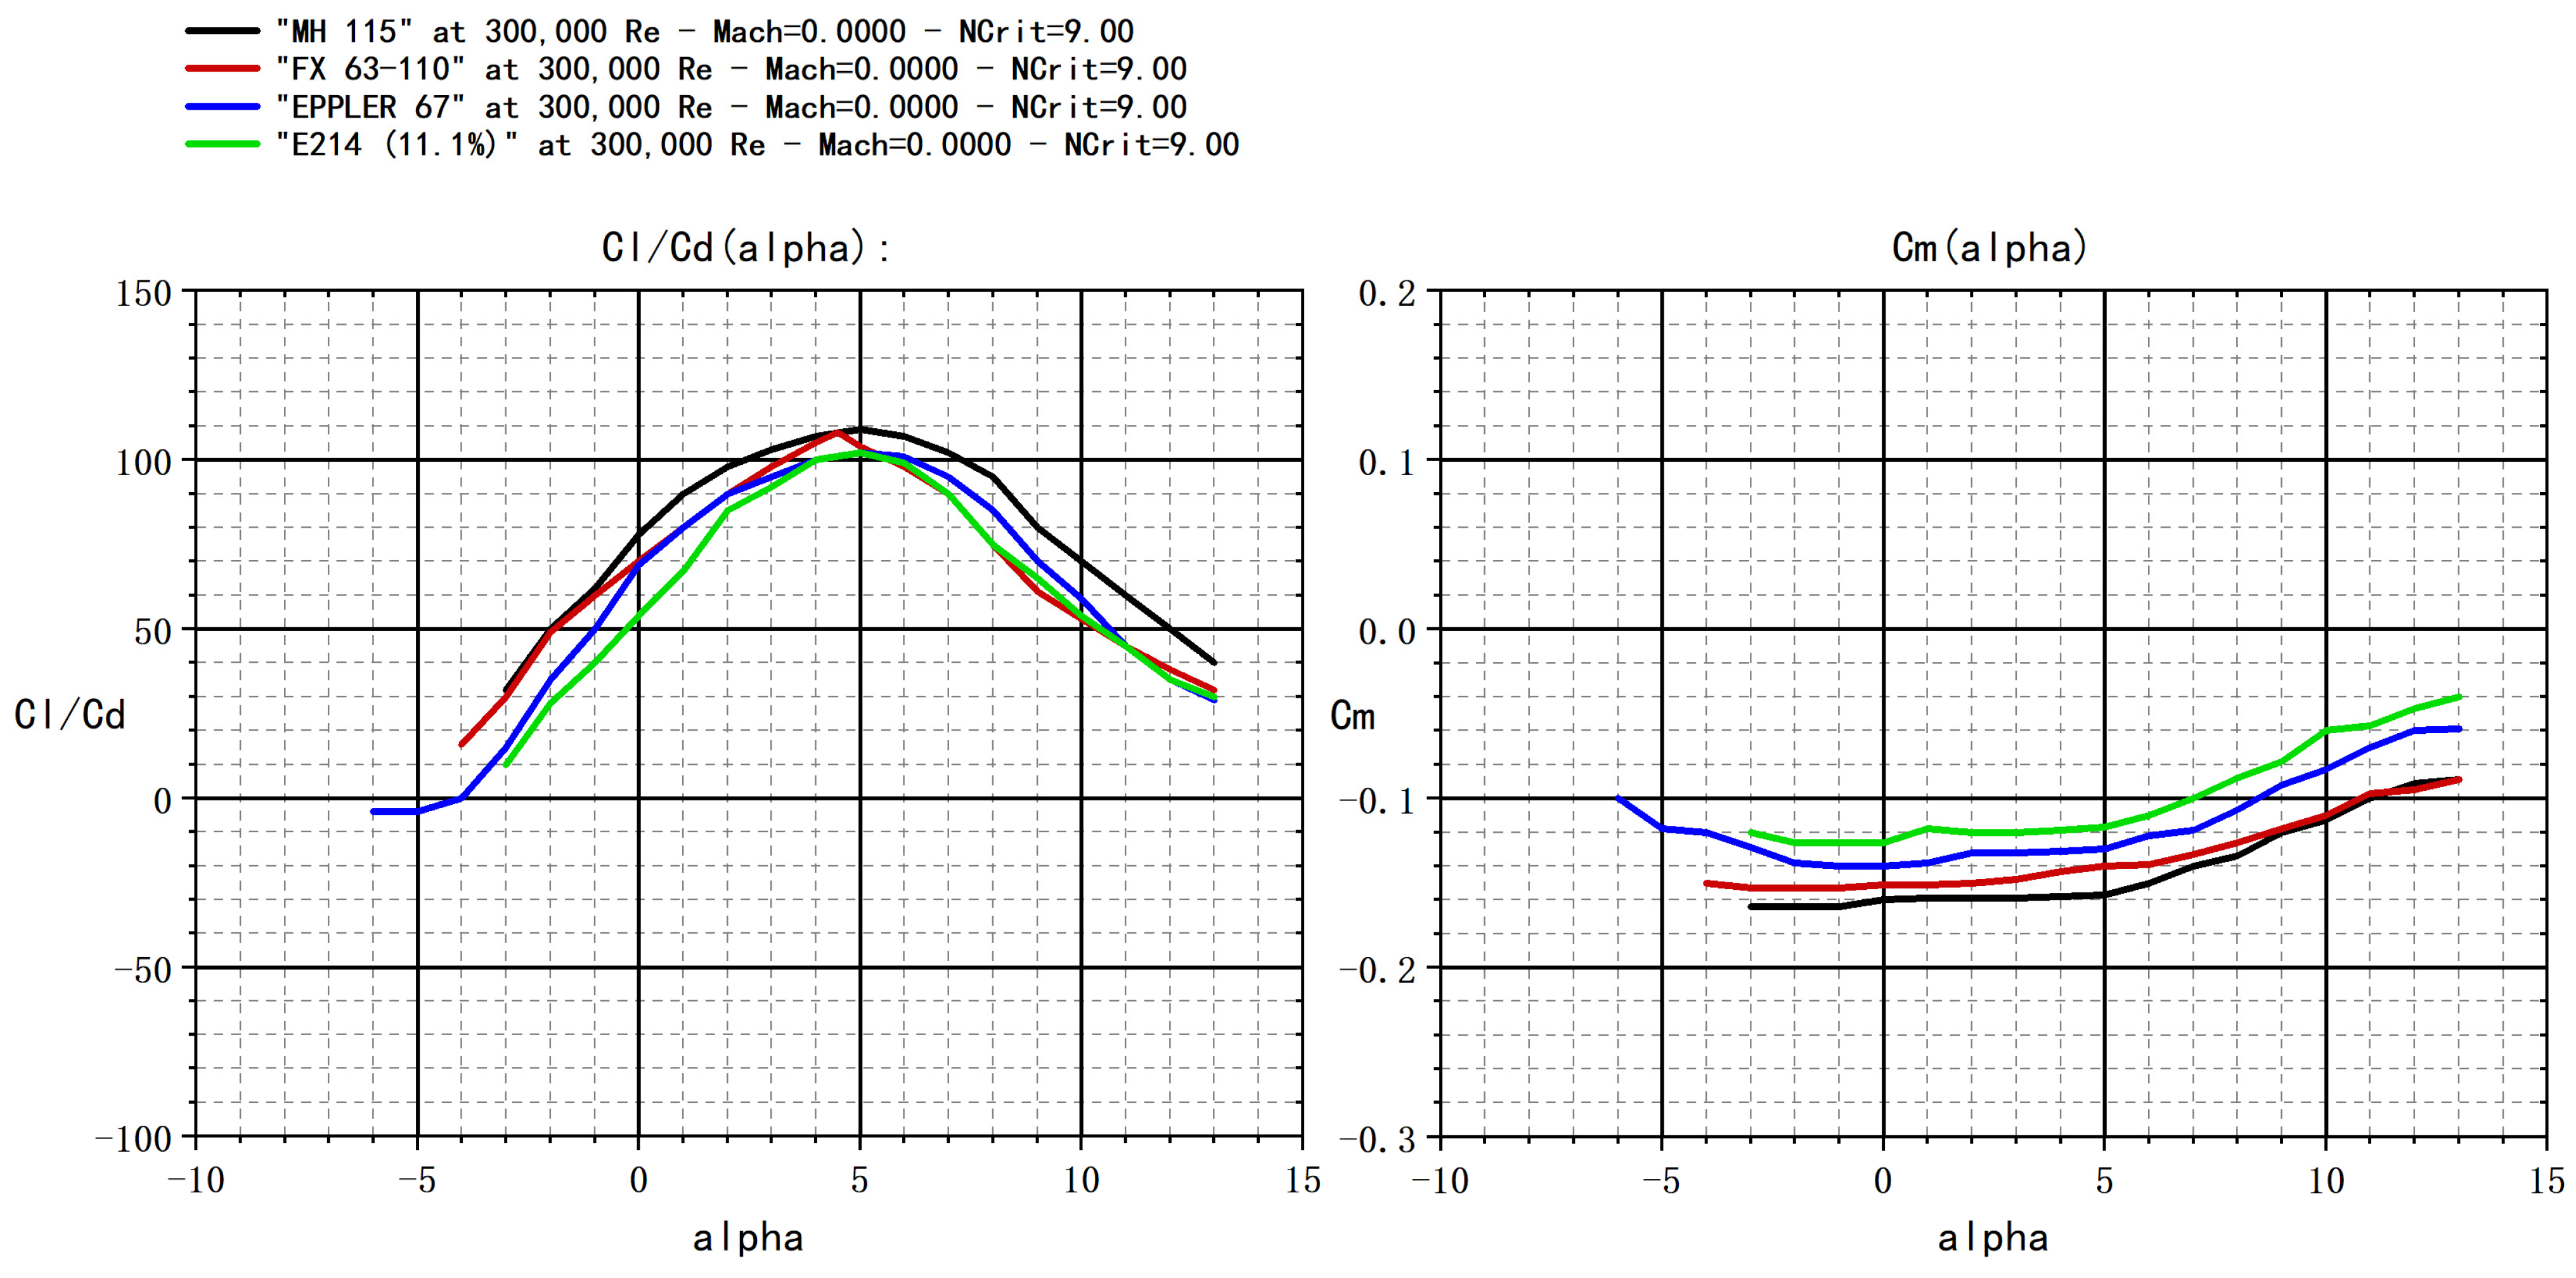
2.4.1. Selection of Airfoil
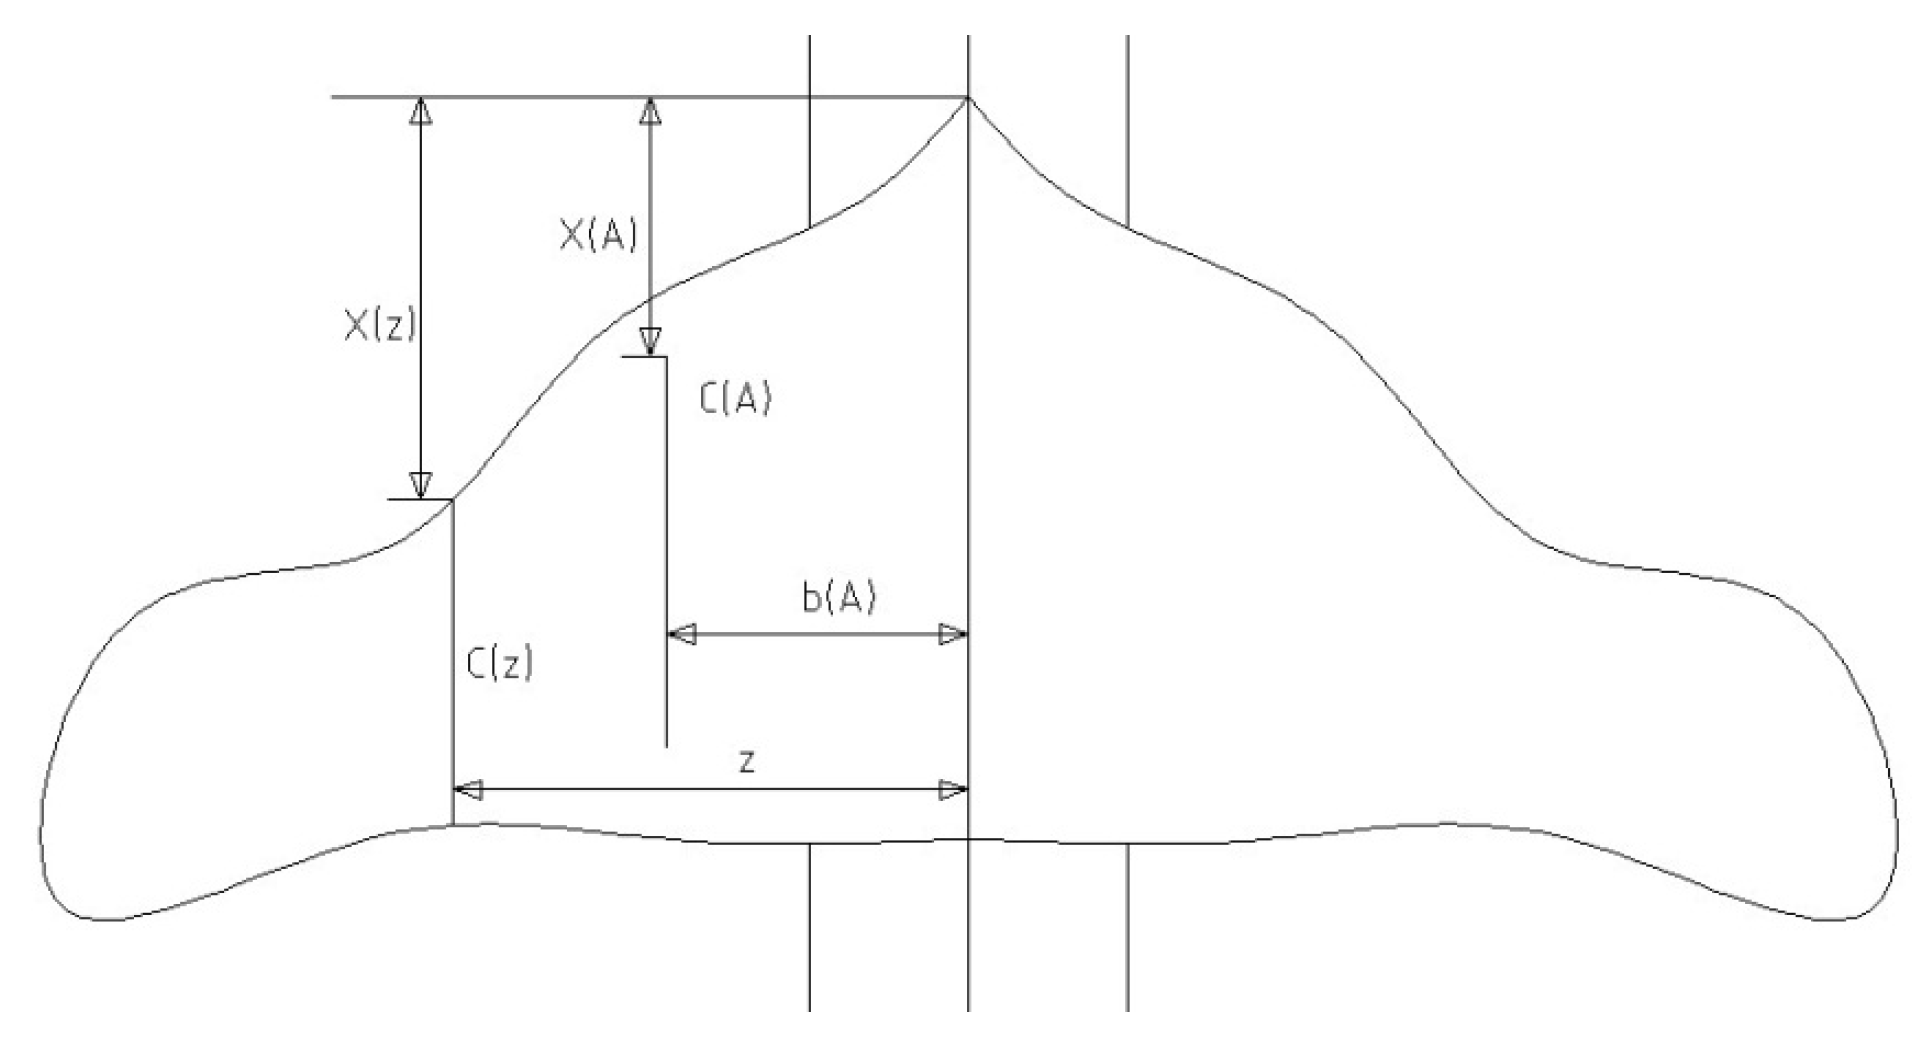
2.4.2. Geometric Parameters
2.4.3. Mean Aerodynamic Chord
2.4.4. Wing Lift Slope
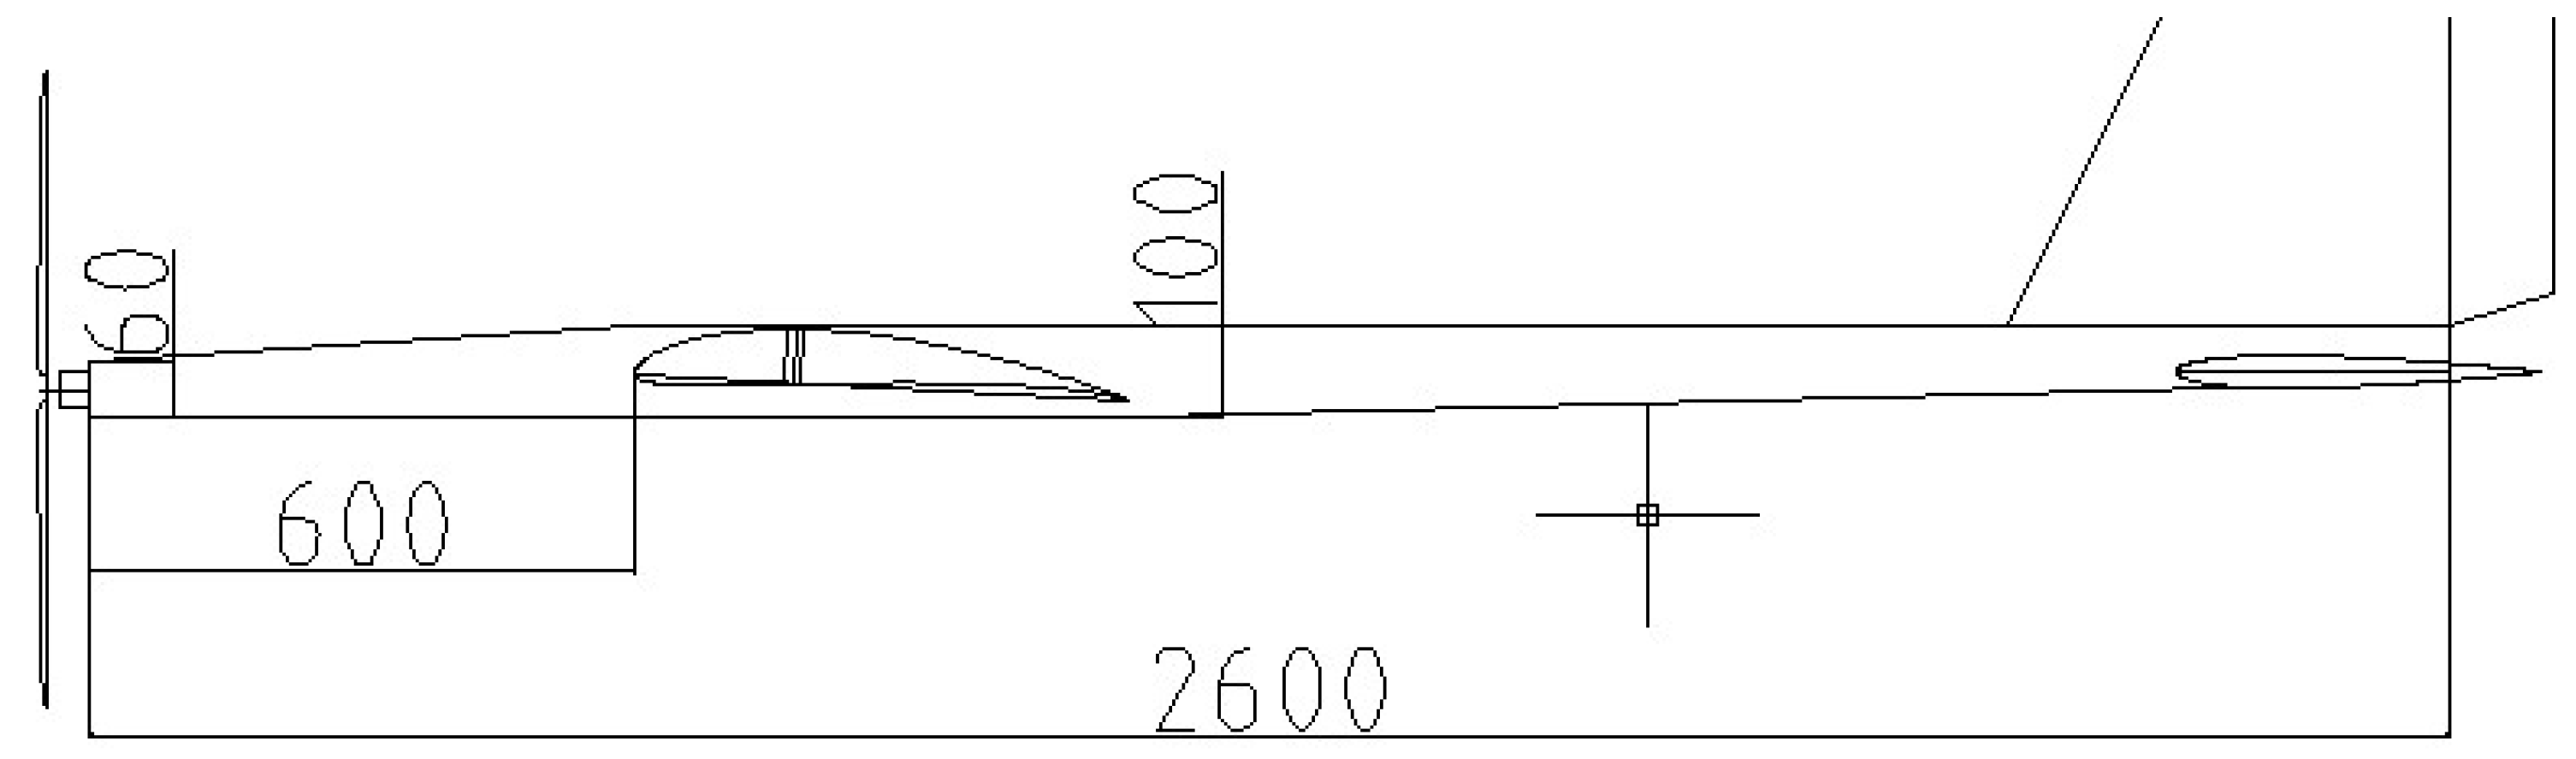
2.5. Fuselage Design
2.6. Tail Design
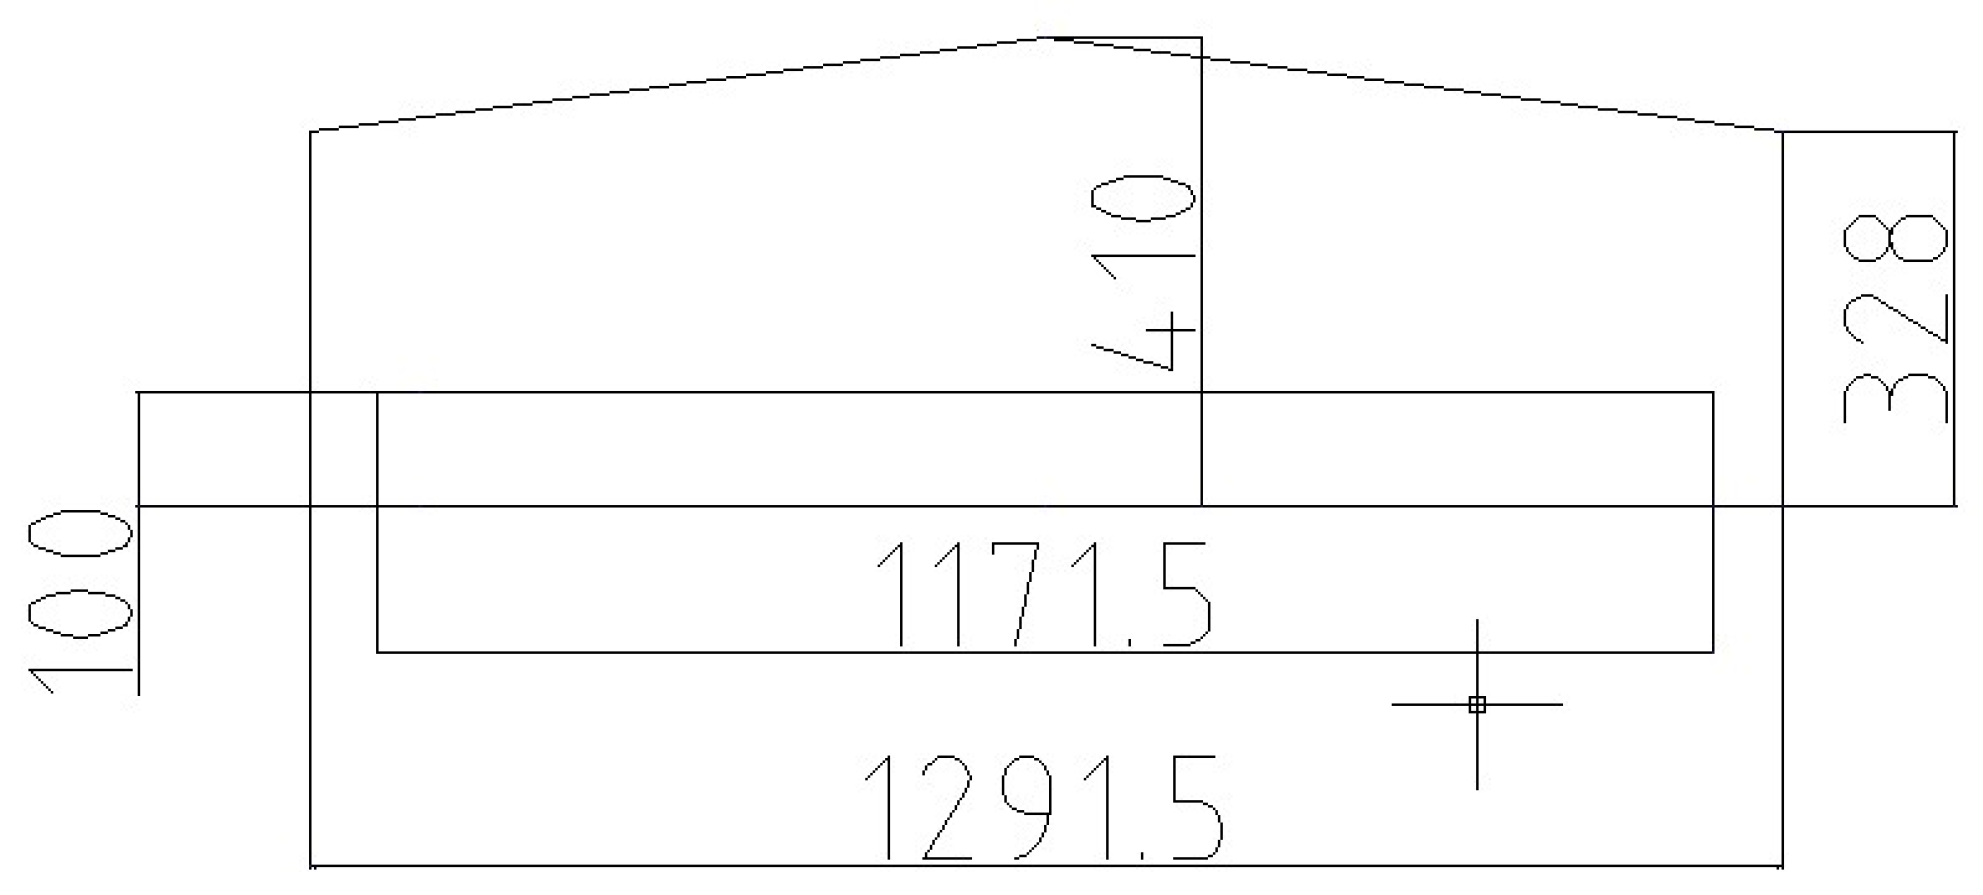
2.6.1. Horizontal Tail Design
2.6.2. Vertical Tail Design
3. Aerodynamic Performance Estimation
3.1. Lift-Induced Drag
3.2. Zero-Lift Drag
3.3. Maximum Lift-to-Drag Ratio
3.4. Lift Characteristics
4. Performance Estimation
4.1. Lift Estimation
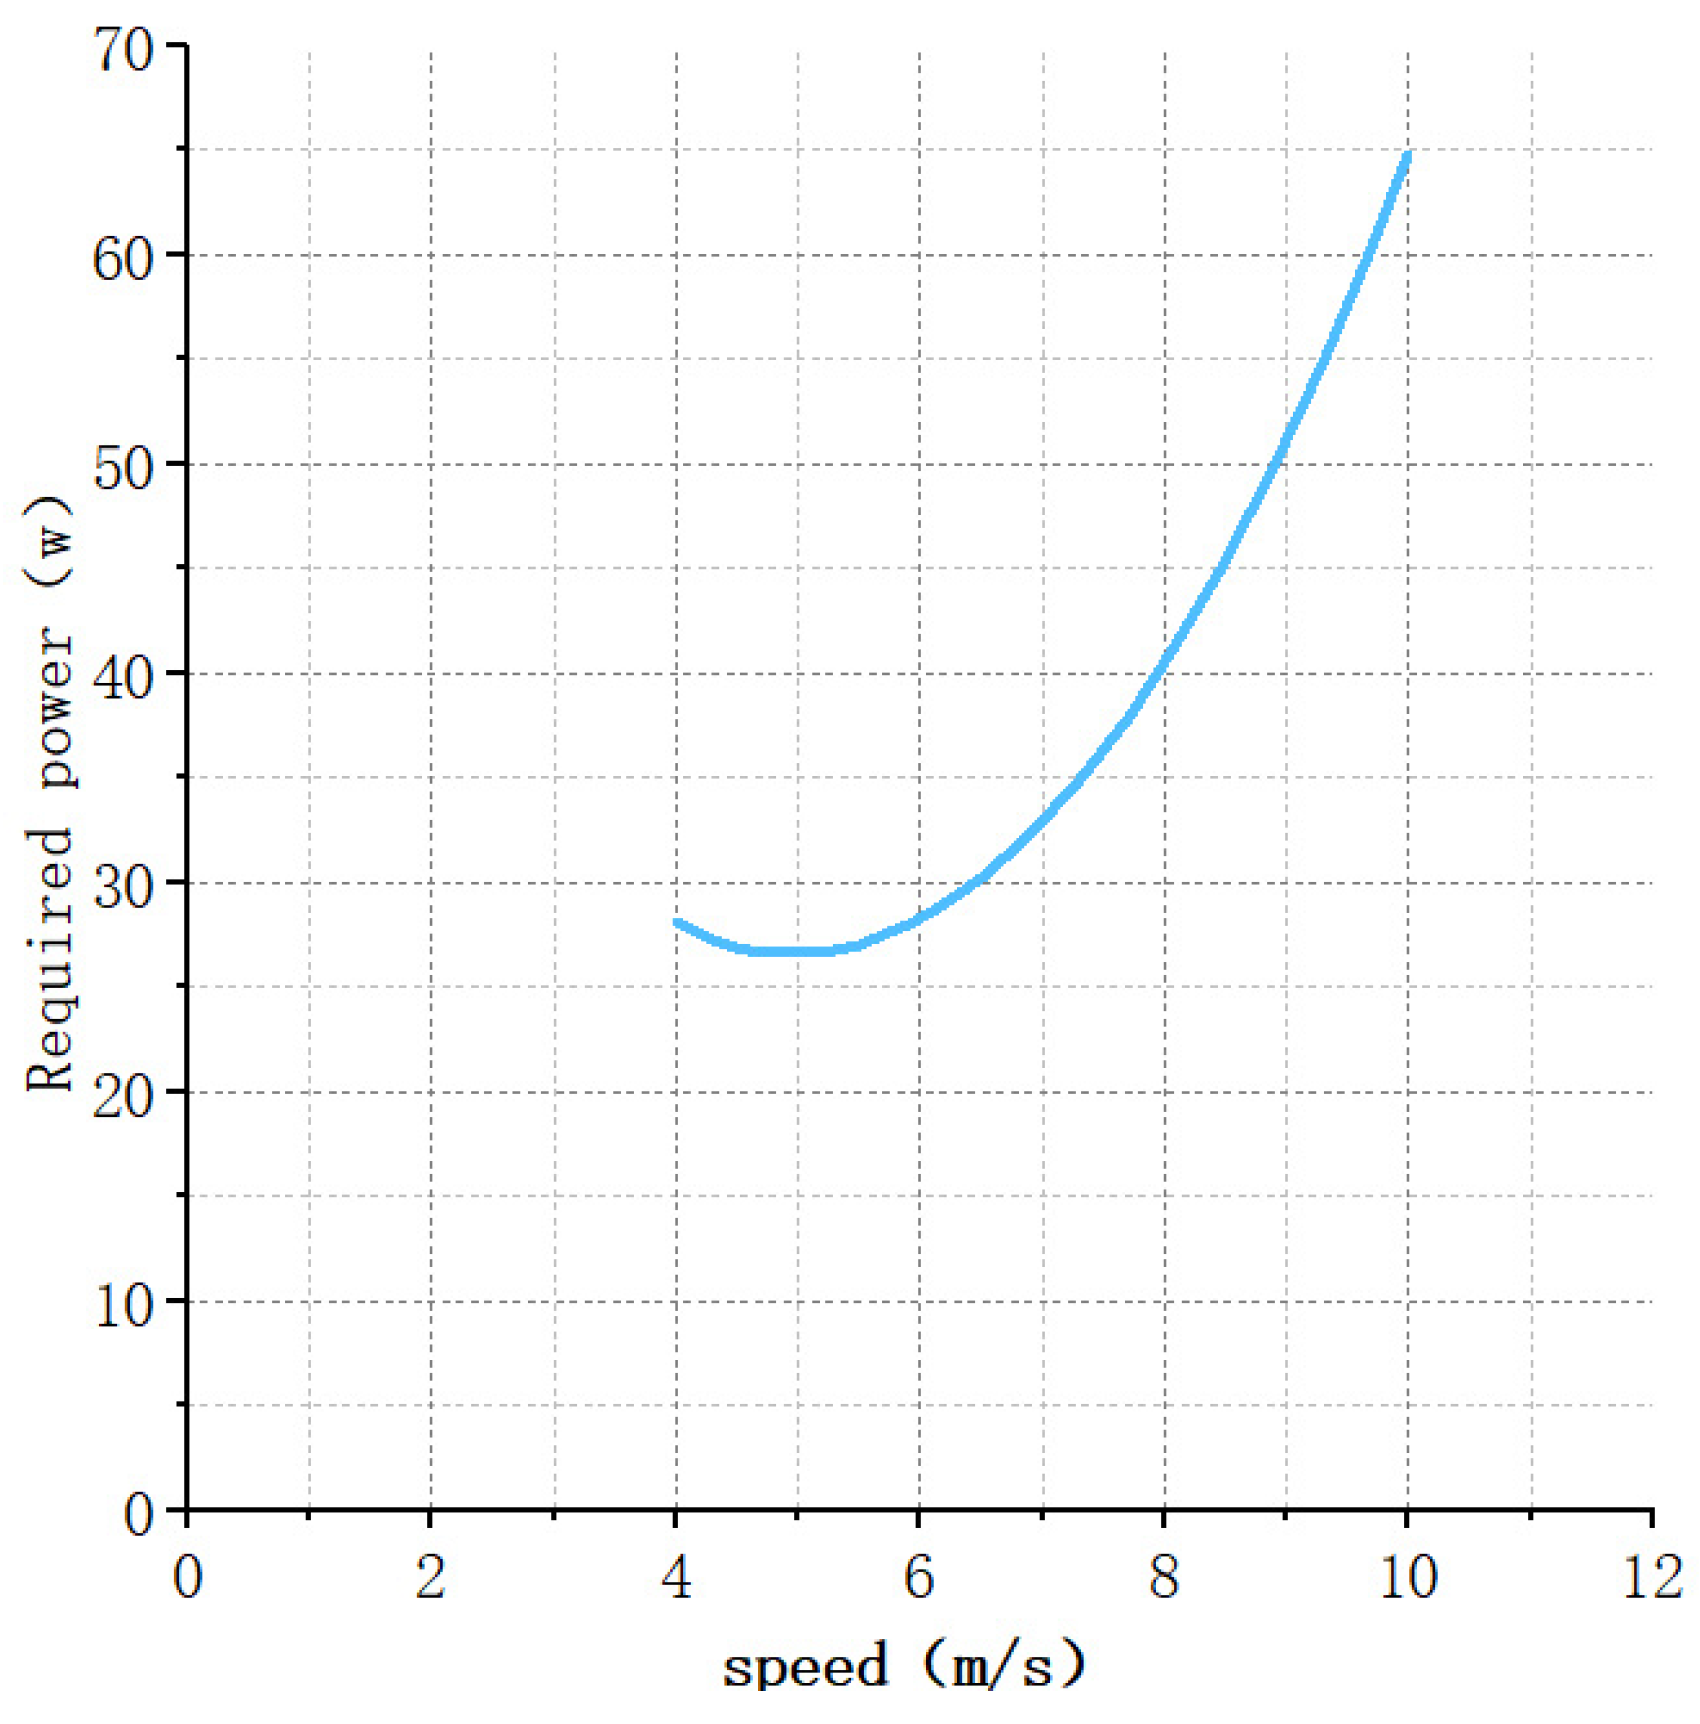
4.2. Propulsion Power and Climb Requirements
4.3. Climb Performance
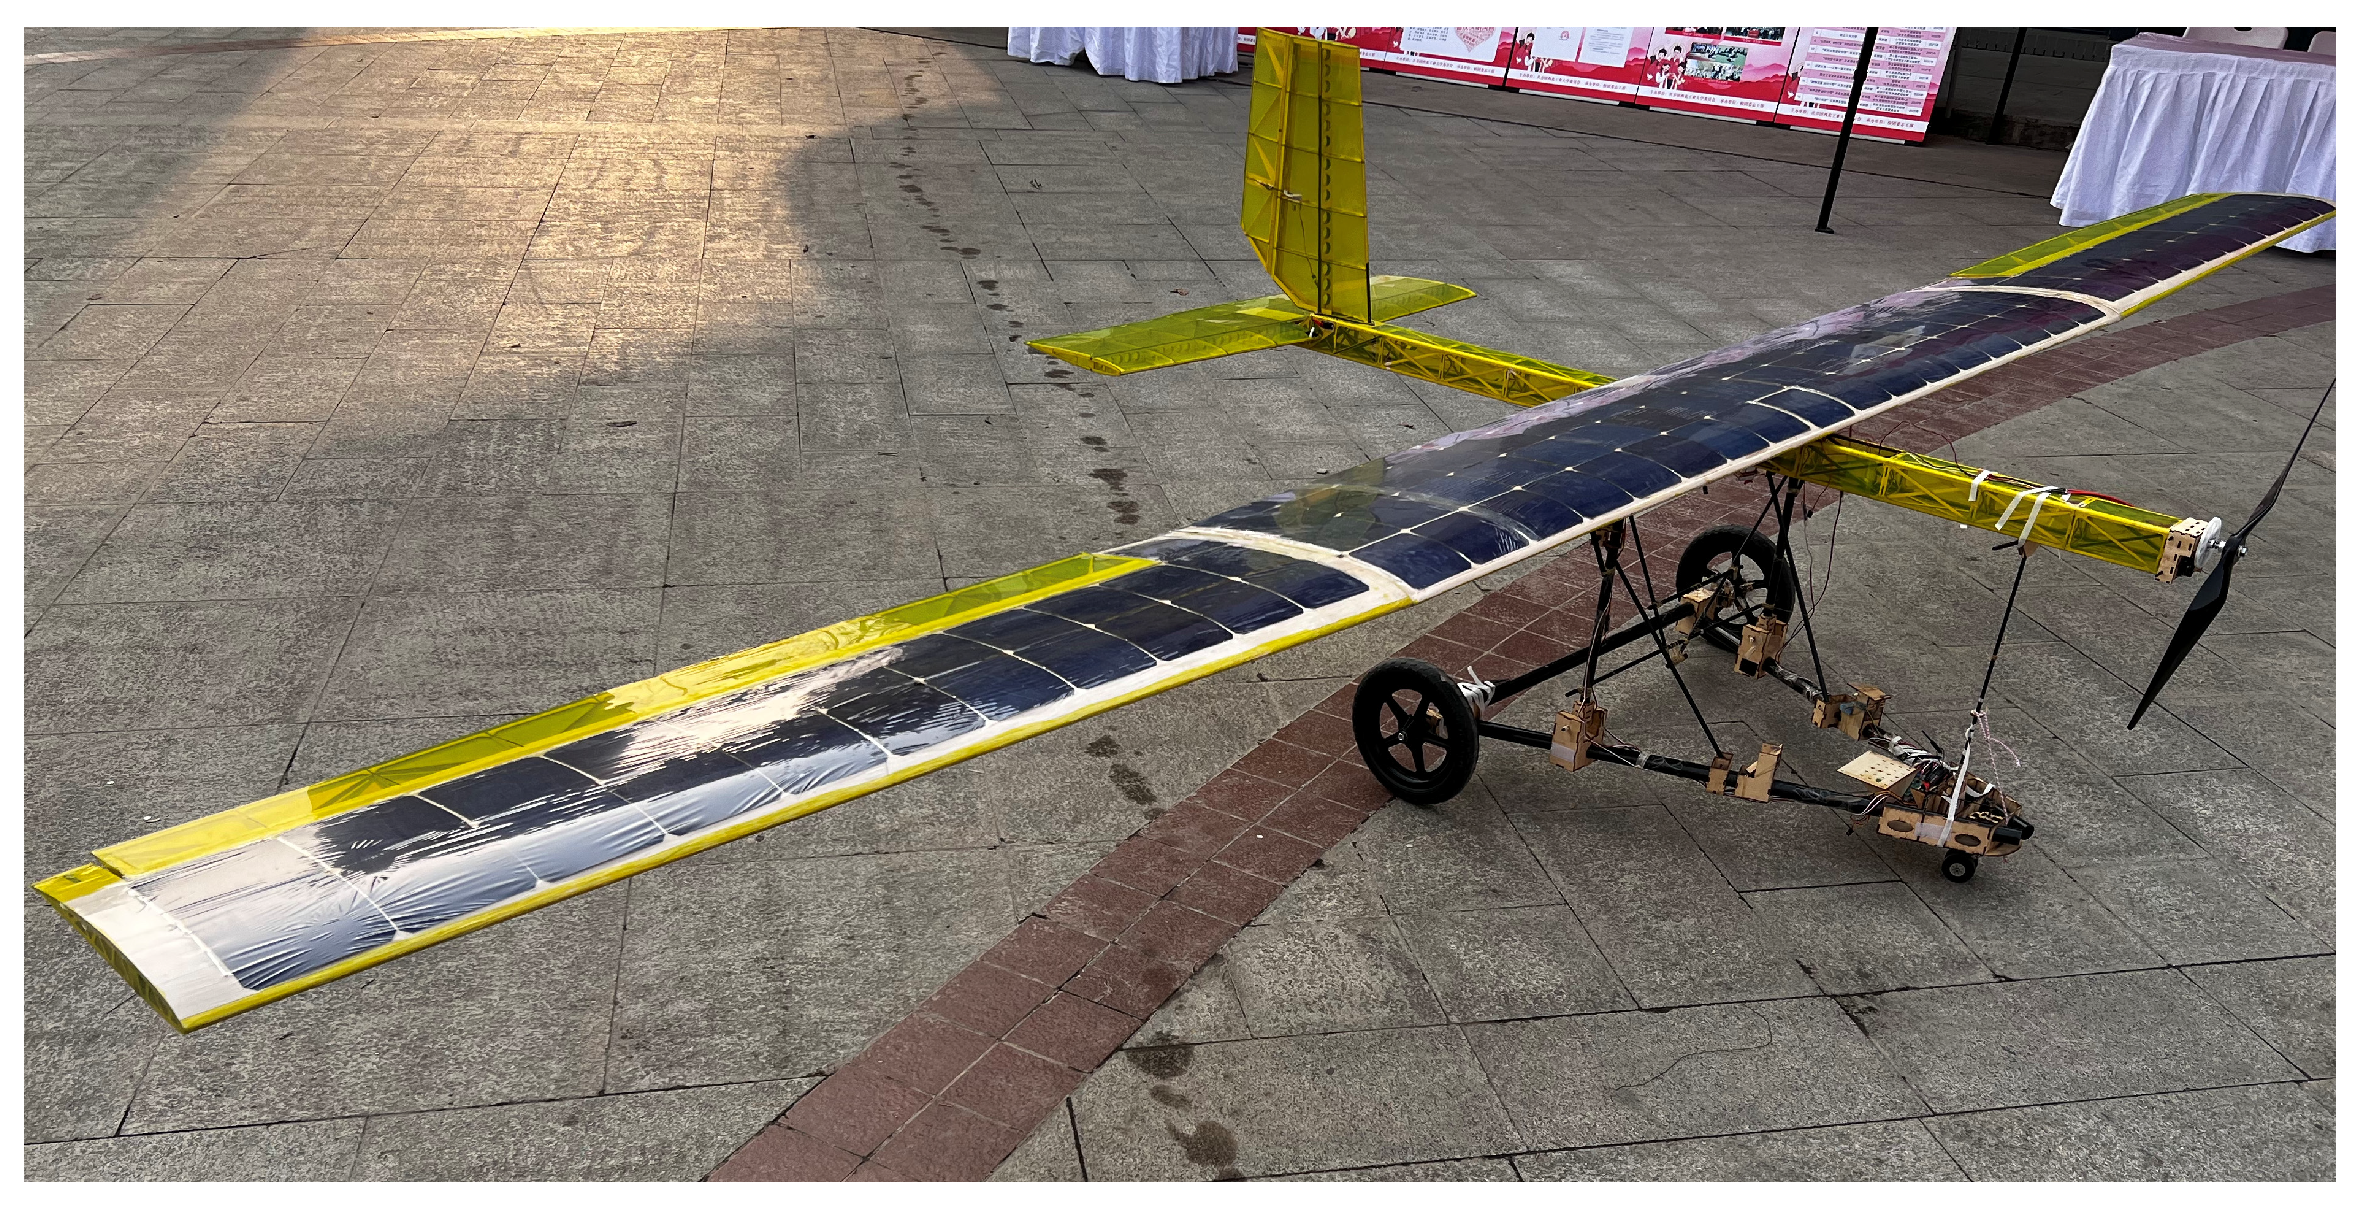
5. Prototype Testing and Flight Testing of the Power System and UAV Platform
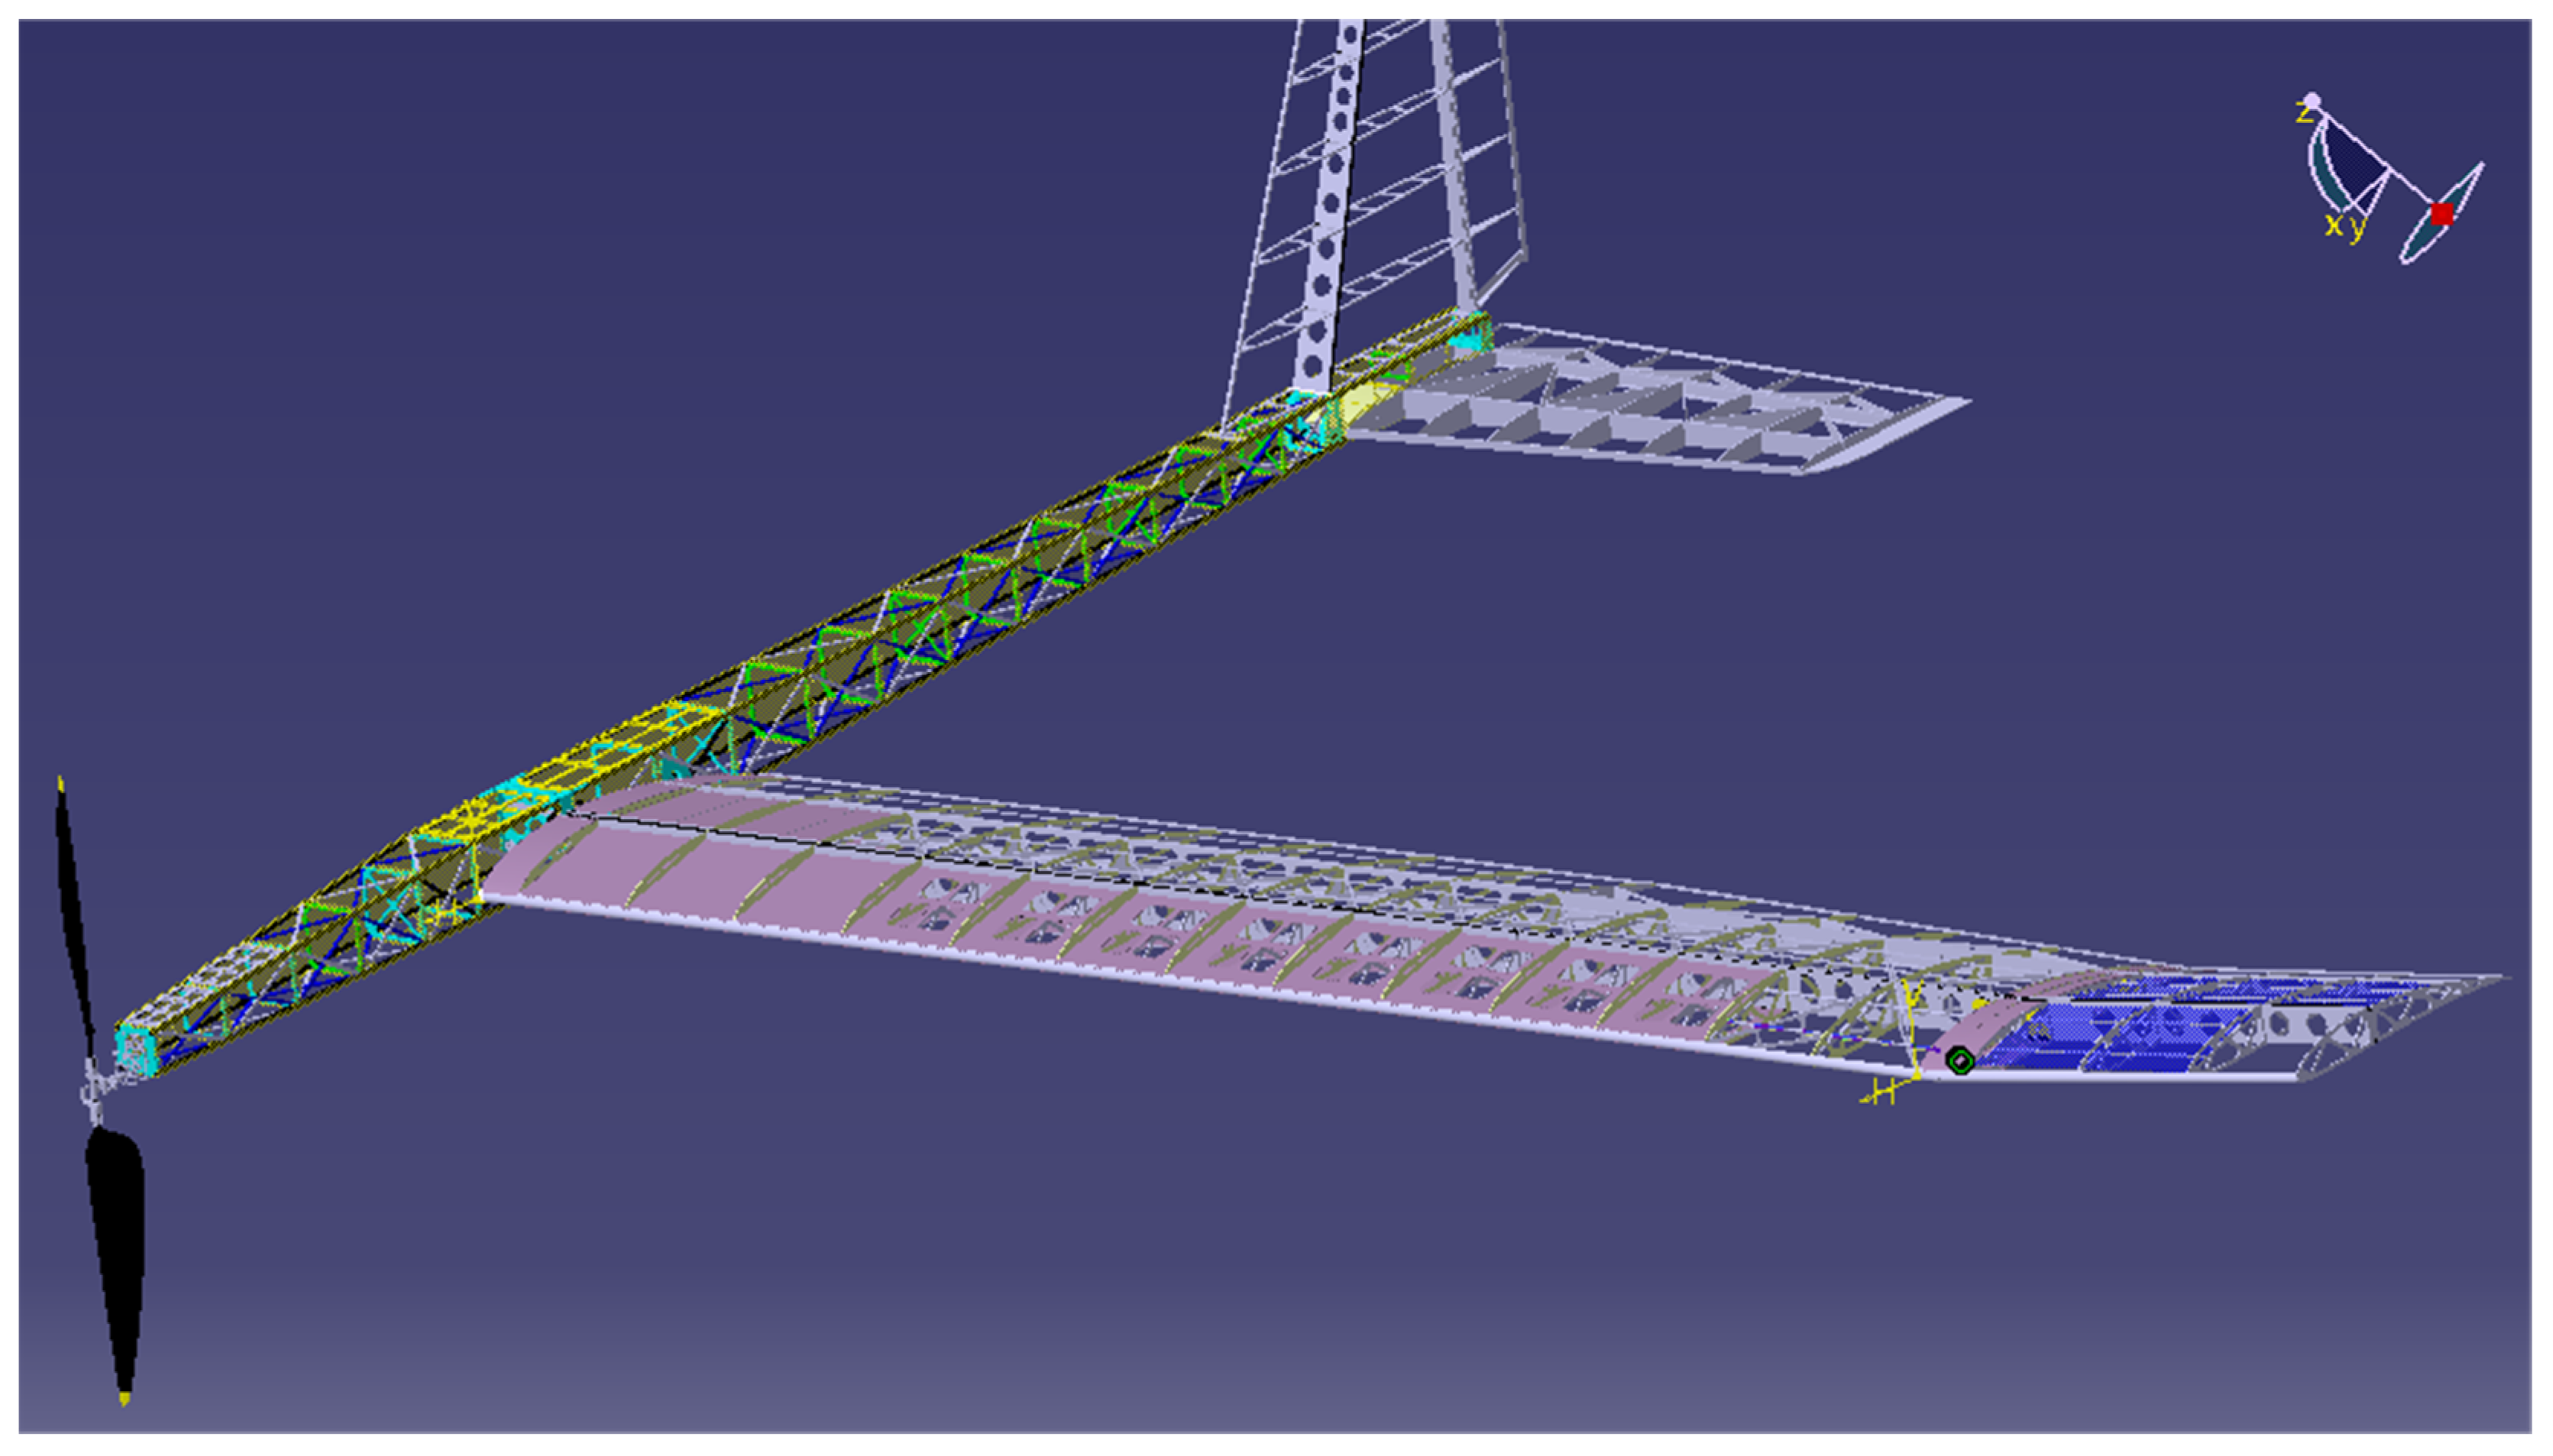
5.1. Establishment of a Three-Dimensional Digital Model
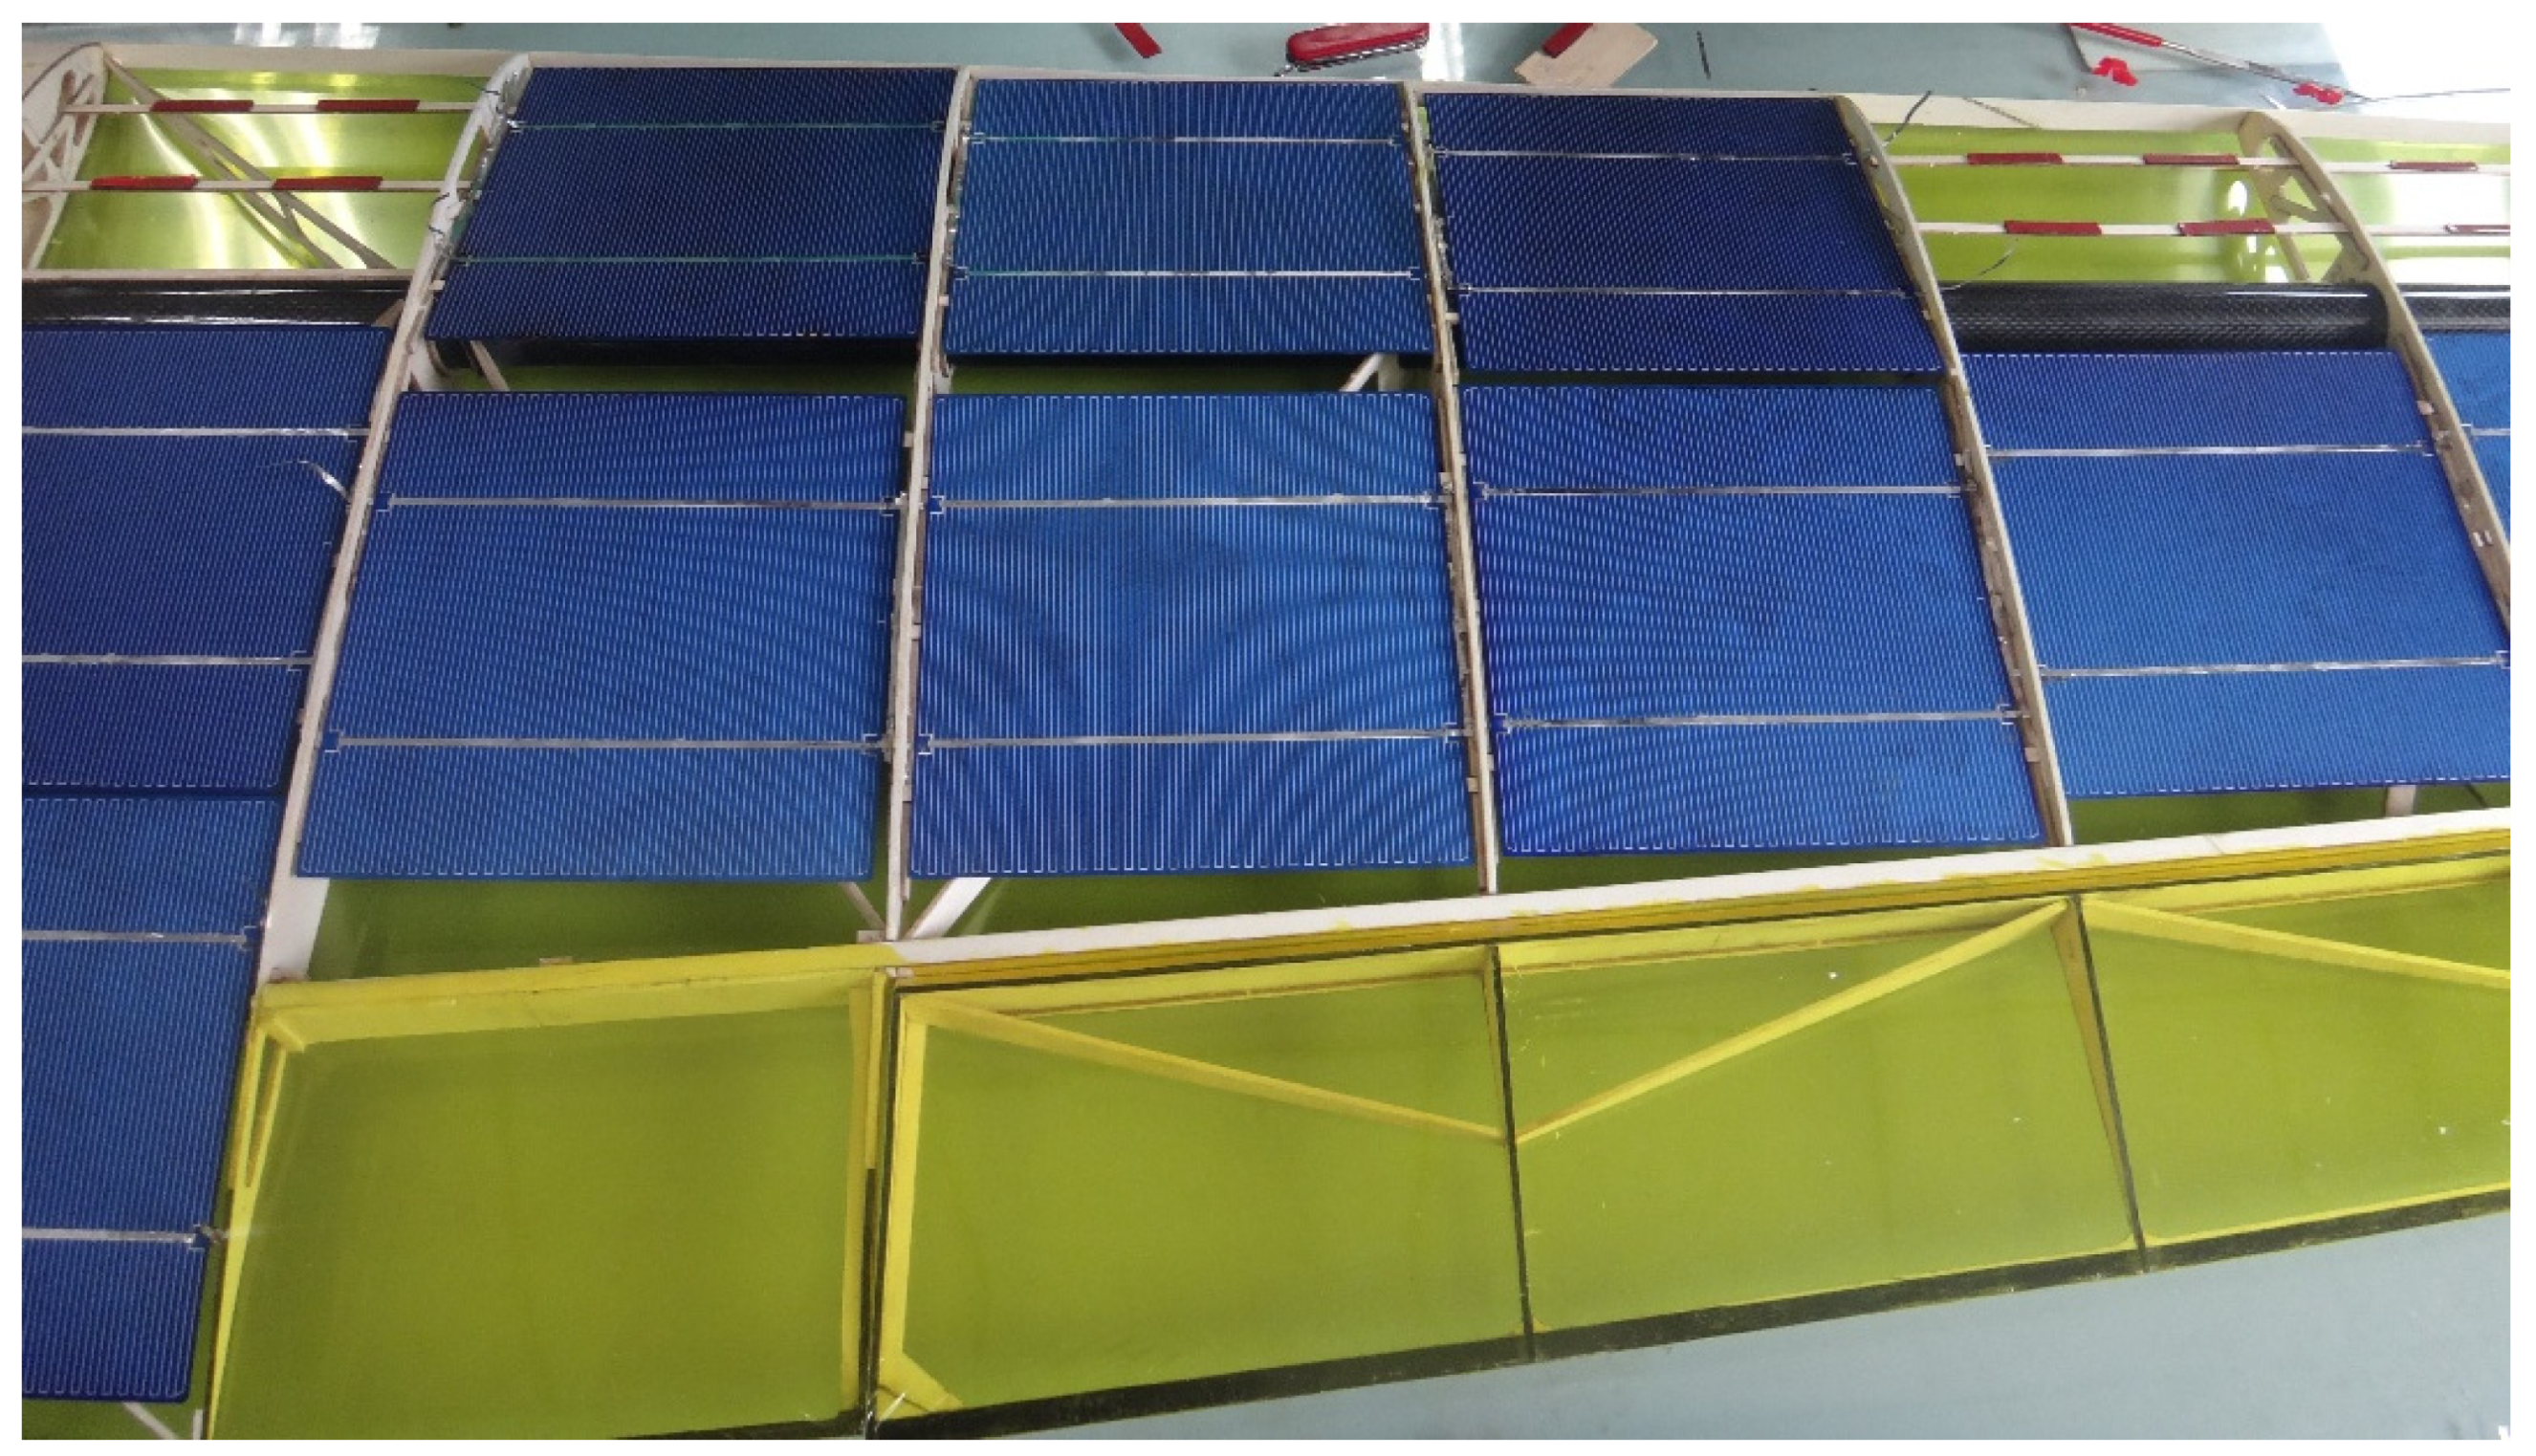
5.2. Integrated Design of Solar Panels and Structure
5.3. Ground Testing
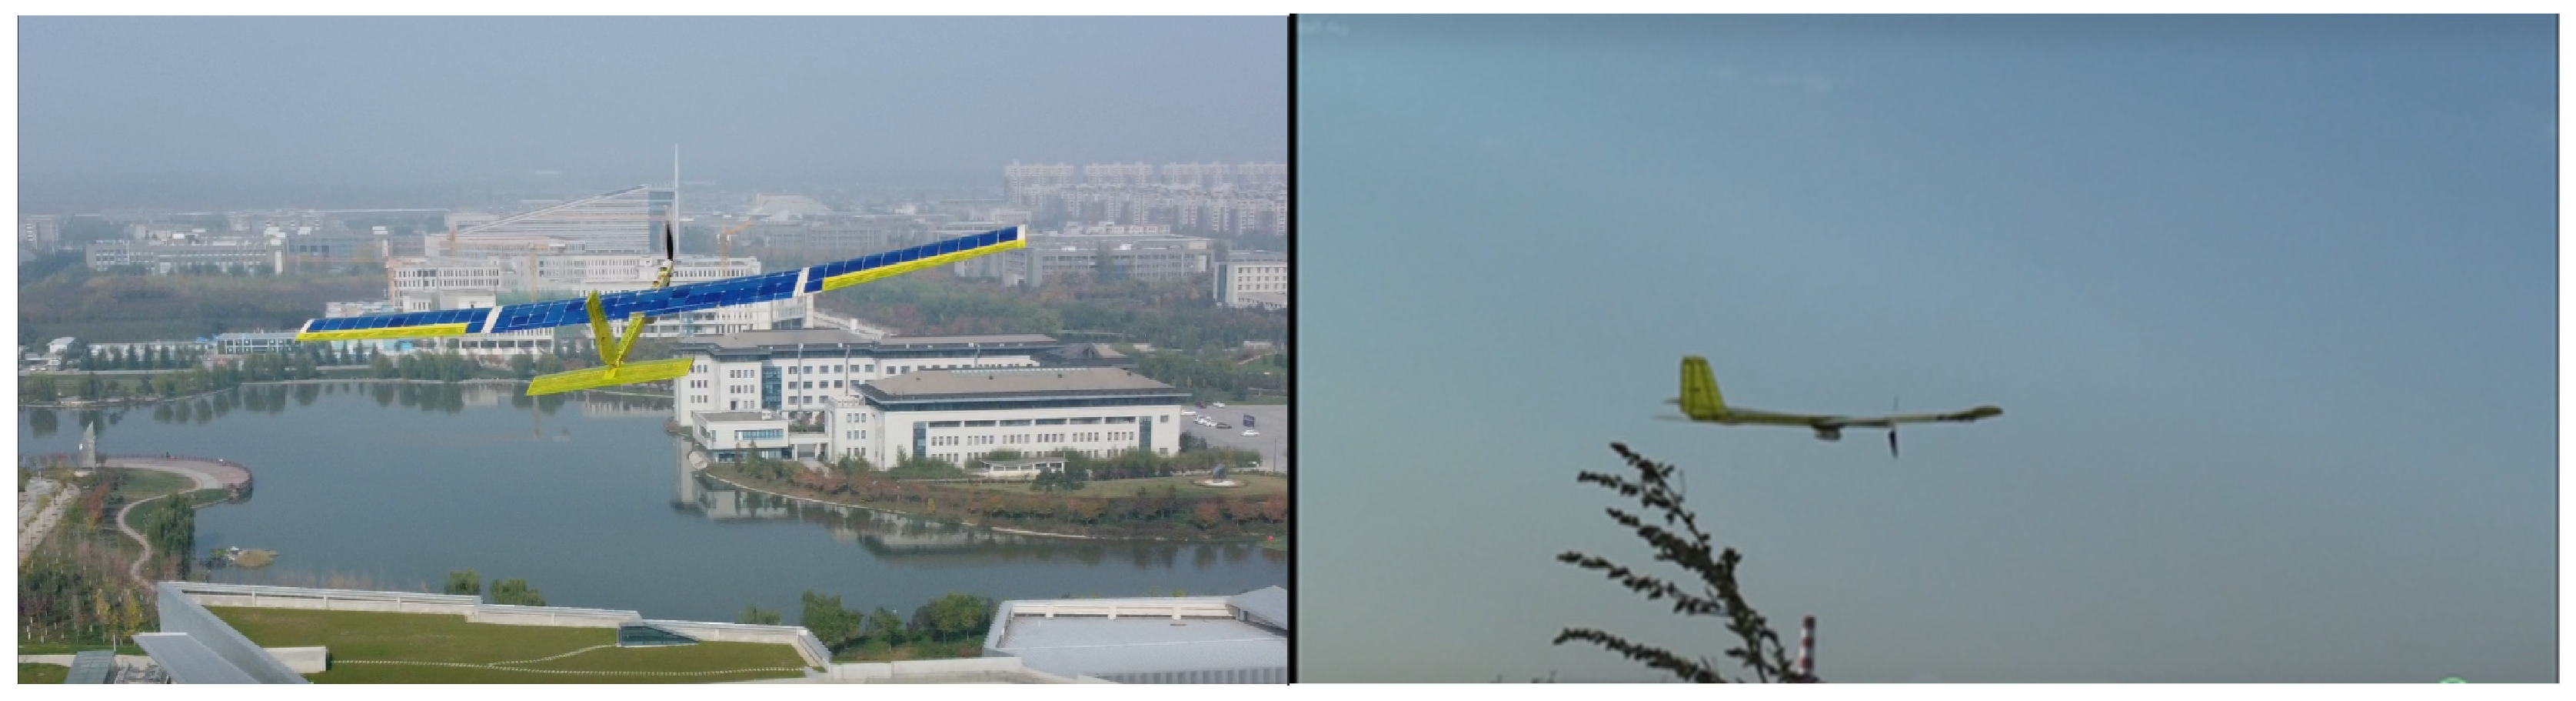
5.4. Flight Testing
- Empty aircraft flight verification: this test aimed to validate the trim, maneuverability, and stability of the UAV.
- Flight verification with payload: this test aimed to verify the climb rate of the UAV under certain payload conditions, comparing it with the theoretical calculations.
6. Comparison of Validation Flight Results with Theory
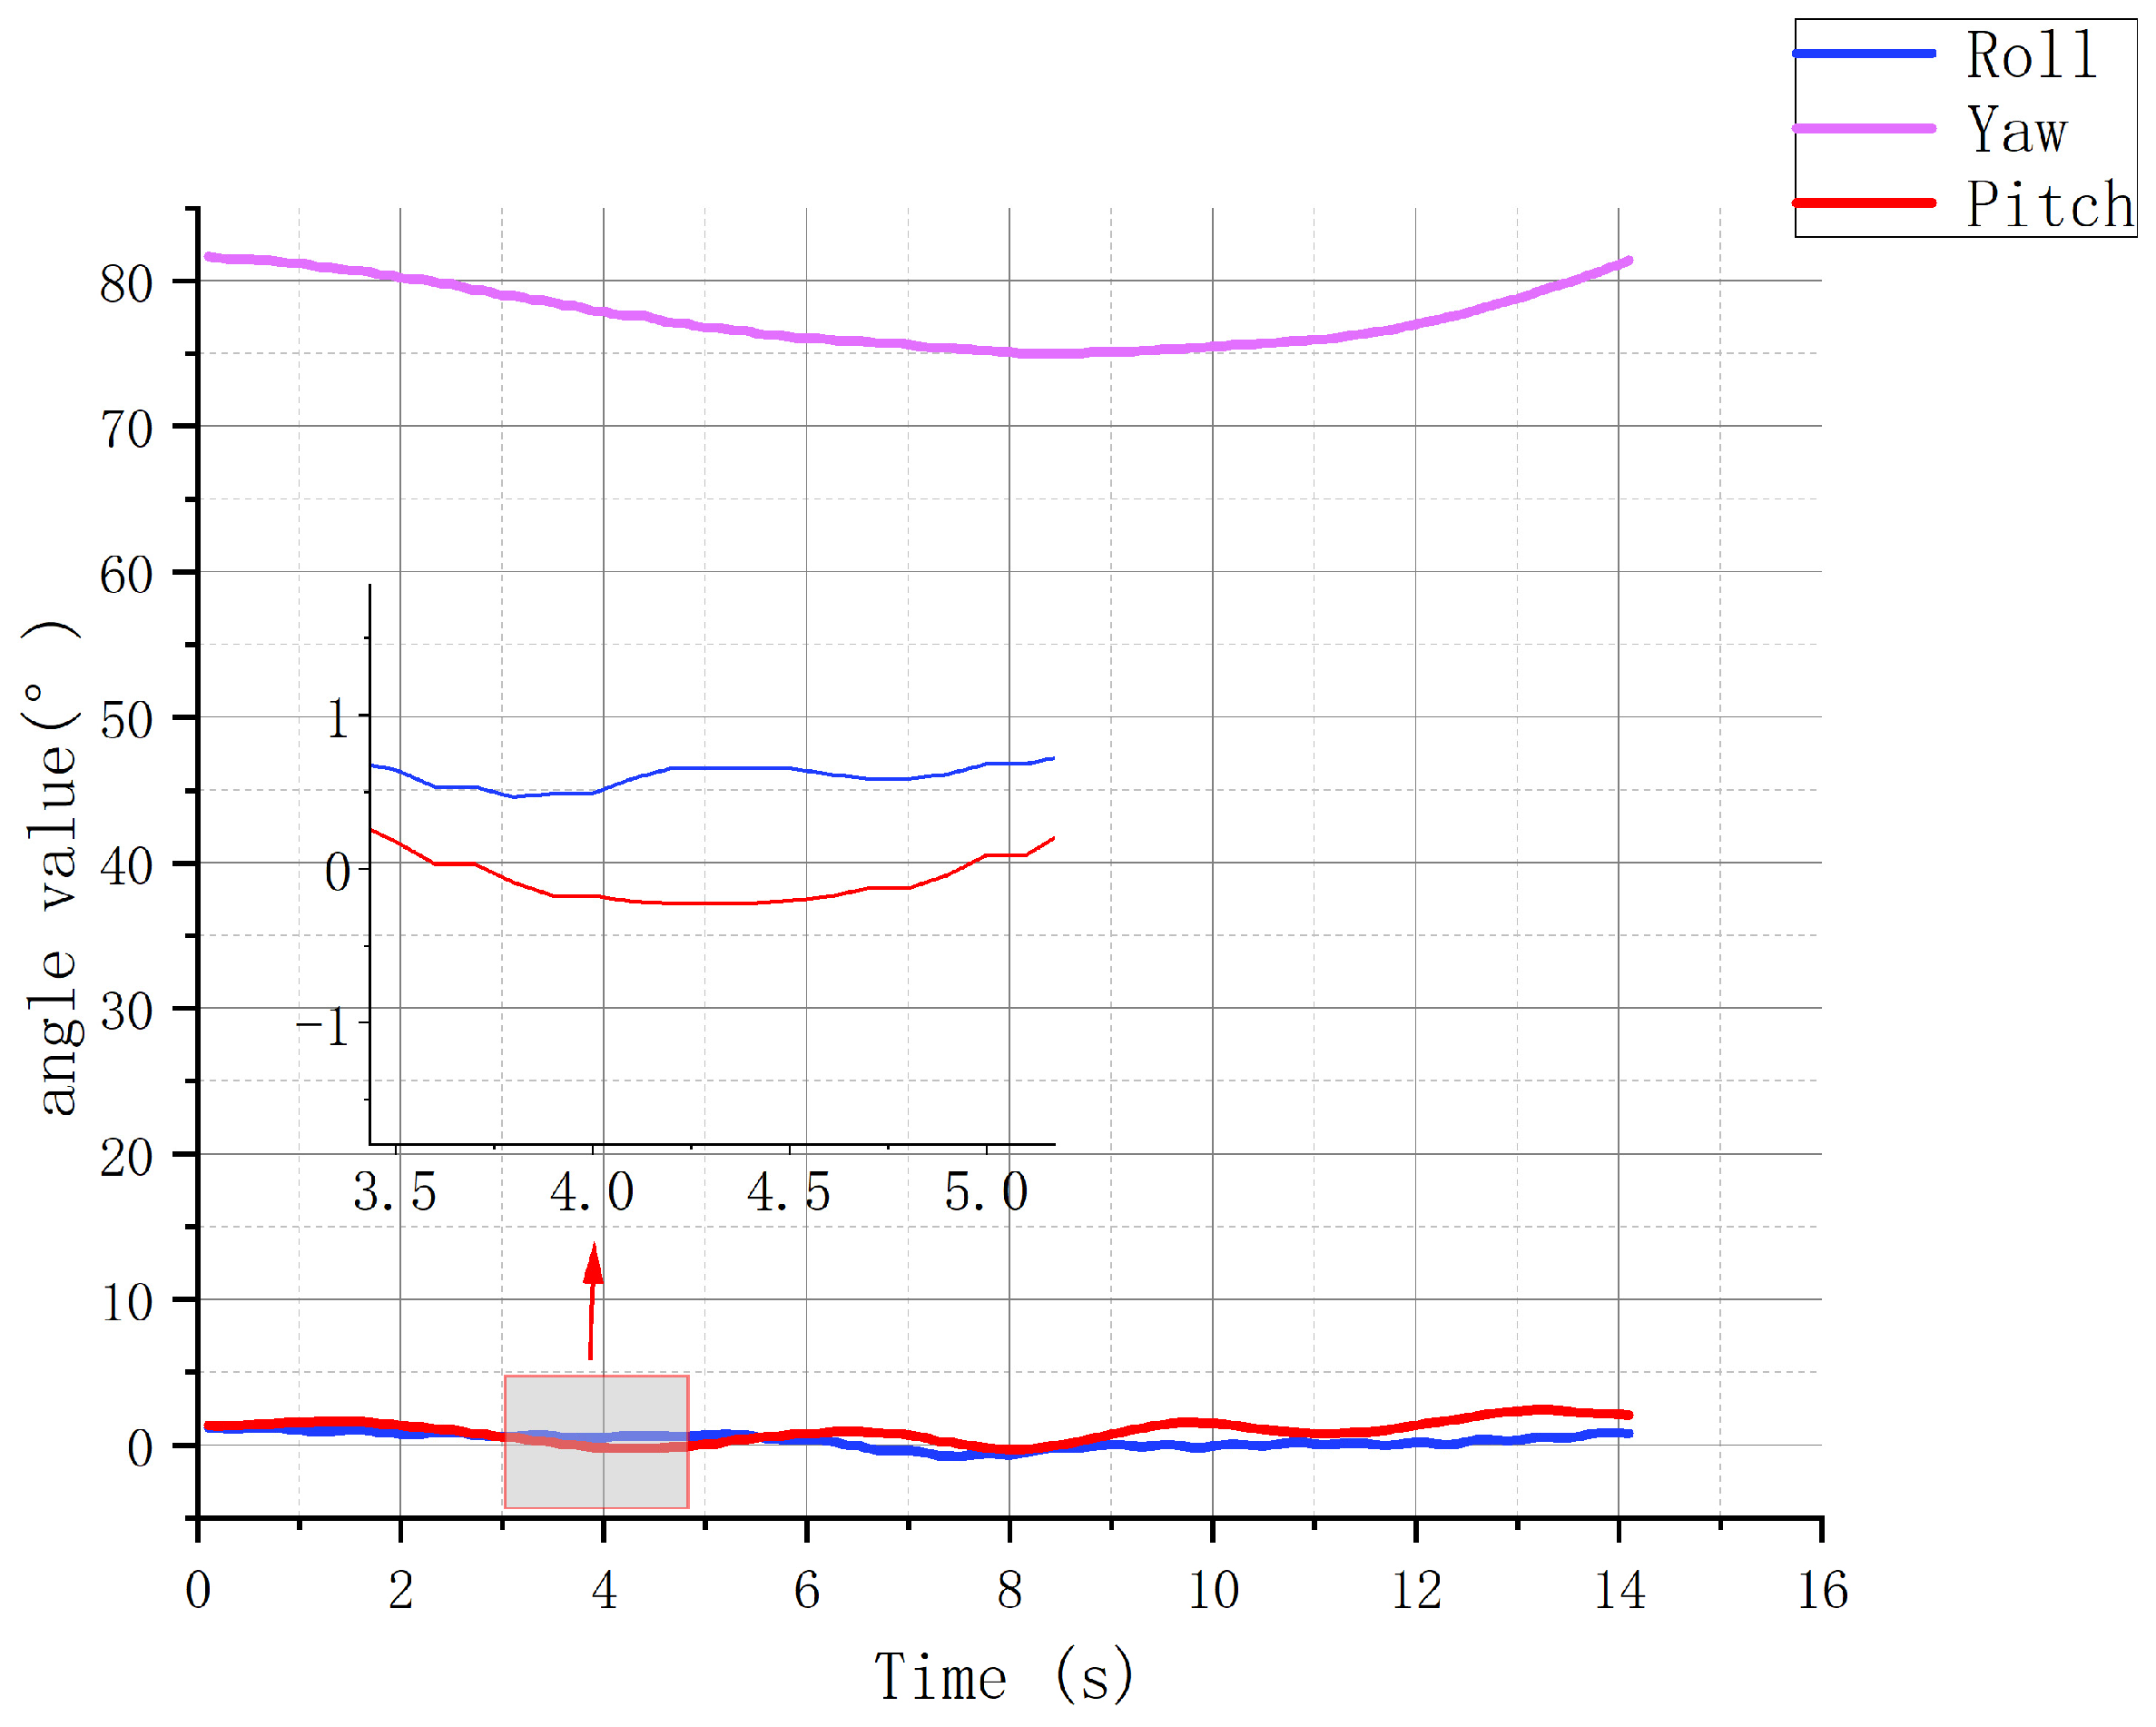
6.1. Results of Empty Aircraft Test Flight
6.2. Results of Payload Test Flight
7. Conclusions
Author Contributions
Funding
Data Availability Statement
Conflicts of Interest
References
- Noth, A.; Siegwart, R.; Engel, W. Design of Solar Powered Airplanes for Continuous Flight. Environ. Res. 2008, 18, 21–38. [Google Scholar] [CrossRef]
- Jiang, G.; Zhu, M.; Liang, H.; Wu, Z. Reliability Based Multidisciplinary Design Optimization of Solar Powered Aircraft. J. Nanjing Univ. Aeronaut. Astronaut. 2012, 44, 464–471. [Google Scholar] [CrossRef]
- Carmichael, R.; Erickson, L. PAN AIR—A Higher Order Panel Method for Predicting Subsonic or Supersonic Linear Potential Flows about Arbitrary Configurations. In Proceedings of the 14th Fluid and Plasma Dynamics Conference, Palo Alto, CA, USA, 23 June 1981. [Google Scholar]
- Panagiotou, P.; Yakinthos, K. Aerodynamic Efficiency and Performance Enhancement of Fixed-Wing UAVs. Aerosp. Sci. Technol. 2020, 99, 105575. [Google Scholar] [CrossRef]
- Sadraey, M.H. Aircraft Performance: An Engineering Approach; CRC Press: Boca Raton, FL, USA, 2017; ISBN 978-1-4987-7656-1. [Google Scholar]
- Ramanan, G.; Radha Krishnan, P.; Ranjan, H.M. An Aerodynamic Performance Study and Analysis of SD7037 Fixed Wing UAV Airfoil. Mater. Today Proc. 2021, 47, 2547–2552. [Google Scholar] [CrossRef]
- El Adawy, M.; Abdelhalim, E.H.; Mahmoud, M.; Ahmed Abo Zeid, M.; Mohamed, I.H.; Othman, M.M.; ElGamal, G.S.; ElShabasy, Y.H. Design and Fabrication of a Fixed-Wing Unmanned Aerial Vehicle (UAV). Ain Shams Eng. J. 2023, 14, 102094. [Google Scholar] [CrossRef]
- Liem, R.P.; Mader, C.A.; Martins, J.R.R.A. Surrogate Models and Mixtures of Experts in Aerodynamic Performance Prediction for Aircraft Mission Analysis. Aerosp. Sci. Technol. 2015, 43, 126–151. [Google Scholar] [CrossRef]
- Kulfan, B.; Bussoletti, J. “Fundamental” Parameteric Geometry Representations for Aircraft Component Shapes. In Proceedings of the 11th AIAA/ISSMO Multidisciplinary Analysis and Optimization Conference; American Institute of Aeronautics and Astronautics, Portsmouth, Virginia, 6 September 2006. [Google Scholar]
- Suresh, C.; Ramesh, K.; Paramaguru, V. Aerodynamic Performance Analysis of a Non-Planar C-Wing Using CFD. Aerosp. Sci. Technol. 2015, 40, 56–61. [Google Scholar] [CrossRef]
- Kapsalis, S.; Panagiotou, P.; Yakinthos, K. CFD-Aided Optimization of a Tactical Blended-Wing-Body UAV Platform Using the Taguchi Method. Aerosp. Sci. Technol. 2021, 108, 106395. [Google Scholar] [CrossRef]
- Liu, X.; Zhao, D.; Oo, N.L. Comparison Studies on Aerodynamic Performances of a Rotating Propeller for Small-Size UAVs. Aerosp. Sci. Technol. 2023, 133, 108148. [Google Scholar] [CrossRef]
- Oo, N.L.; Zhao, D.; Sellier, M.; Liu, X. Experimental Investigation on Turbulence Effects on Unsteady Aerodynamics Performances of Two Horizontally Placed Small-Size UAV Rotors. Aerosp. Sci. Technol. 2023, 141, 108535. [Google Scholar] [CrossRef]
- Yang, X.; Ma, D.; Zhang, L.; Yu, Y.; Yao, Y.; Yang, M. High-Fidelity Multi-Level Efficiency Optimization of Propeller for High Altitude Long Endurance UAV. Aerosp. Sci. Technol. 2023, 133, 108142. [Google Scholar] [CrossRef]
- Panagiotou, P.; Kaparos, P.; Yakinthos, K. Winglet Design and Optimization for a MALE UAV Using CFD. Aerosp. Sci. Technol. 2014, 39, 190–205. [Google Scholar] [CrossRef]
- Huang, J. Application and Development Trends of Computational Fluid Dynamics (CFD) Technology and Associated Systems in Aircraft Research and Development. In Proceedings of the 2019 National Conference on Industrial Fluid Mechanics, Taiyun, China, 29–30 June 2019; Fluid Mechanics Professional Committee of the Chinese Society of Mechanics: Beijing, China, 2019; p. 7. [Google Scholar]
- He, K.; Mao, Z.; Wang, Q.; Chen, H. Demonstration and validation flight test of scaled aircraft model and its key technologies. Acta Aerodyn. Sin. 2017, 35, 671–679. [Google Scholar]
- Zhang, W.; Guo, Q.; Zhang, Y. Study and Evolvement on Flight Test Technique of Remotely Piloted Subscale Model. Adv. Aeronaut. Sci. Eng. 2011, 2, 43–47. [Google Scholar] [CrossRef]
- Song, L.; Huang, J. The Study of Engine System Selection for Sub-scaled UCAV Flight Test Model. Aircr. Des. 2010, 30, 38–42. [Google Scholar] [CrossRef]
- Sun, M.; Shan, C.; Sun, K.; Jia, Y. Energy Management Strategy for High-Altitude Solar Aircraft Based on Multiple Flight Phases. Math. Probl. Eng. 2020, 2020, 6655031. [Google Scholar] [CrossRef]
- Zhong, W.; Guo, Y.; Zhang, K. Energy strategy on altitude profile for cycle flight of solar powered aircraft. Acta Aeronaut. Et Astronaut. Sin. 2020, 41, 109–118. [Google Scholar]
- Wang, H.; Su, S. An Energy Management Strategy for Long-endurance Solar-powered UAVs. Technol. Innov. Appl. 2023, 13, 12–16. [Google Scholar]
- Slim Abbes, M.; Bouaziz, S.; Chaari, F.; Maatar, M.; Haddar, M. An Acoustic–Structural Interaction Modelling for the Evaluation of a Gearbox-Radiated Noise. Int. J. Mech. Sci. 2008, 50, 569–577. [Google Scholar] [CrossRef]
- Son, O.; Wang, Z.; Gursul, I. Effect of Wing Planform on Plunging Wing Aerodynamics. J. Fluids Struct. 2023, 121, 103953. [Google Scholar] [CrossRef]
- Da Ronch, A.; Ventura, A.; Righi, M.; Franciolini, M.; Berci, M.; Kharlamov, D. Extension of Analytical Indicial Aerodynamics to Generic Trapezoidal Wings in Subsonic Flow. Chin. J. Aeronaut. 2018, 31, 617–631. [Google Scholar] [CrossRef]
- Wu, M.; Shi, Z.; Xiao, T.; Ang, H. Effect of Wingtip Connection on the Energy and Flight Endurance Performance of Solar Aircraft. Aerosp. Sci. Technol. 2021, 108, 106404. [Google Scholar] [CrossRef]
- Gudmundsson, S. Chapter 5—Aircraft Structural Layout. In General Aviation Aircraft Design, 2nd ed.; Gudmundsson, S., Ed.; Butterworth-Heinemann: Waltham, MA, USA, 2022; pp. 113–146. ISBN 978-0-12-818465-3. [Google Scholar]
- Sandhya, G.; Rishitha, V.S.; Sriram, S.; Sreehari, V. Design and Experimental Structural Analysis of a Solar Powered Aircraft Wing Structure. IOP Conf. Ser. Mater. Sci. Eng. 2021, 1057, 012027. [Google Scholar] [CrossRef]
- Mukhachev, P.; Padalitsa, D.; Ivanov, A. Preliminary Design and Technology Forecast Synthesis for Solar-Powered High Altitude Aircraft. Proc. Inst. Mech. Eng. Part G J. Aerosp. Eng. 2022, 236, 2225–2234. [Google Scholar] [CrossRef]
- Li, S.; Zhou, W.; Luo, J.; Xie, F. An Optimization Method of Overall Design in Small Long-endurance Solar Powered UAV. J. Air Force Eng. Univ. Nat. Sci. Ed. 2018, 19, 1–8. [Google Scholar]
- Wu, M.; Shi, Z.; Ang, H.; Xiao, T. Theoretical Study on Energy Performance of a Stratospheric Solar Aircraft with Optimum Λ-Shaped Rotatable Wing. Aerosp. Sci. Technol. 2020, 98, 105670. [Google Scholar] [CrossRef]
- Ren, Z.; Wang, Z.; Zhang, G. Research on Zero-Lift Drag Estimation Method at Lower Reynolds Numbers. Aeronaut. Comput. Tech. 2011, 41, 29–31+36. [Google Scholar]
- Zhao, L.; Tao, J.; Sun, H.; Sun, Q. Dynamic Modelling of Parafoil System Based on Aerodynamic Coefficients Identification. Automatika 2023, 64, 291–303. [Google Scholar] [CrossRef]
- Xiao, W.; Jin, X.; Wang, Y.; Zhuang, D.; Wang, S. The Effect of Solar-powered Aircraft Wing Airfoil on the Performance of Photovoltaic Modules. Aircr. Des. 2022, 42, 43–47. [Google Scholar] [CrossRef]
- El-Salamony, M.E.; Aziz, M.A. Impact of N-Shaped Wing Morphing on Solar-Powered Aircraft. Unmanned Syst. 2021, 9, 309–320. [Google Scholar] [CrossRef]
- Li, B.; Gao, Y.; Guo, W.; Kang, X.; Meng, H. Design of Lightweight High Aspect Ratio Main Beam for Small Solar-Powered UAV. J. Nav. Aviat. Univ. 2017, 32, 483–486. [Google Scholar]
- Kravchenko, I.F.; Loginov, V.V.; Ukrainets, Y.O.; Hlushchenko, P.A. Aerodynamic Characteristics of a Straight Wing with a Spiroid Wingtip Device. Trans. Aerosp. Res. 2021, 2021, 46–62. [Google Scholar] [CrossRef]
- Que, J.; Wang, W.; Wu, Y. Design of solar-powered aircraft configuration for reducing trim loss. J. Beijing Univ. Aeronaut. Astronaut. 2016, 42, 1479–1485. [Google Scholar] [CrossRef]
- Nicolosi, F.; Della Vecchia, P.; Ciliberti, D. An Investigation on Vertical Tailplane Contribution to Aircraft Sideforce. Aerosp. Sci. Technol. 2013, 28, 401–416. [Google Scholar] [CrossRef]
- Zhang, L.; Ma, D.; Yang, M.; Yao, Y. Overall Design and Sensitivity Analysis of Solar Aircraft Based on Feasible Region Planning Method. J. Phys. Conf. Ser. 2022, 2364, 012037. [Google Scholar] [CrossRef]
- Fioriti, M.; Boggero, L.; Corpino, S.; Prakasha, P.S.; Ciampa, P.D.; Nagel, B. The Effect of Sub-Systems Design Parameters on Preliminary Aircraft Design in a Multidisciplinary Design Environment. Transp. Res. Procedia 2018, 29, 135–145. [Google Scholar] [CrossRef]
- Li, Z.; Zhang, J.; Wu, P. Determination Method for Overall Parameters of Propeller-Based UAV. Hongdu Sci. Technol. 2018, 2, 24–28. [Google Scholar]
- Liu, Z.; Zhang, Y.; Chen, H.; Zhang, Z. Incremental Control System Design and Flight Tests of a Micro-Coaxial Rotor UAV. Aerosp. Sci. Technol. 2022, 131, 107979. [Google Scholar] [CrossRef]


| Mission Profile | Maximum Output Power | Units |
|---|---|---|
| Climb Phase | 120 | w |
| Level Flight Phase | 40 | w |
| Landing Phase | 30 | w |
| Requirements | Numerical Values | Units |
|---|---|---|
| Wingspan (A) | >5 | m |
| Size of non-disassemblable components | <2.4 | m |
| Reference value of thrust | 9.8 | N |
| UAV empty weight | 3–8 | kg |
| Wing loading | 2.66 | kg/m2 |
| Wing area | 3.0086 | m2 |
| Design flight speed | 7.5 | m/s |
| Target lift-to-drag ratio | 15 | |
| Climb rate | 0.3 | m/s |
| Number of solar panels | >72 |
| Parameter Name(s) | Numerical Values | Units |
|---|---|---|
| Wing area () | 3.0086 | |
| Fuselage area as a percentage of the wing area () | 0.0545 | |
| Wingspan length () | 5.8 | |
| Aspect ratio () | 11.8 | |
| Effective aspect ratio () | 10.98 | |
| Root taper ratio () | 0.6 |
| Name(s) | Numerical Values | Units |
|---|---|---|
| Horizontal tail aspect ratio () | 3.5 | |
| Horizontal tail taper ratio () | 0.8 | |
| Horizontal tail root chord length () | 0.4 | |
| Horizontal tail span length () | 1.26 | |
| Horizontal tail area () | 0.4536 | |
| Horizontal tail tip chord length () | 0.328 | |
| Elevator span length | 1.14 | |
| Elevator chord length | 0.1 | |
| Elevator up angle | 25 | ° |
| Elevator down angle | 20 | ° |
| Name(s) | Numerical Values | Units |
|---|---|---|
| Vertical tail aspect ratio () | 2 | |
| Vertical tail taper ratio () | 0.8 | |
| Vertical tail root chord length () | 0.6 | |
| Vertical tail area () | 0.4536 | |
| Vertical tail moment arm length () | 1.565 | |
| Vertical tail volume () | 0.025 | |
| Vertical tail span length () | 0.6 | |
| Rudder chord length | 0.115 | |
| Rudder span length | 0.54 | |
| Rudder area | 0.062 |
| Name(s) | Numerical Values | Units |
|---|---|---|
| Wetted area of the fuselage | 0.8828 | m2 |
| Wetted area of the wing | 6.16588 | m2 |
| Wetted area of the horizontal tail | 1.4995 | m2 |
| Total wetted area of the UAV | 8.548 | m2 |
| Drag coefficient | 0.01 |
| Speed | Lift Coefficient | Drag Coefficient | Drag | Power |
|---|---|---|---|---|
| 7.5 | 0.7563502 | 0.0483045 | 5.00704 | 37.5528 |
| 7.6 | 0.7365772 | 0.0474322 | 5.048604 | 38.36939 |
| 7.7 | 0.7175696 | 0.0466155 | 5.093099 | 39.21686 |
| 7.8 | 0.6992883 | 0.0458501 | 5.140434 | 40.09538 |
| 7.9 | 0.6816968 | 0.0451322 | 5.190524 | 41.00514 |
| 8 | 0.6647609 | 0.0444584 | 5.24329 | 41.94632 |
| 8.1 | 0.6484484 | 0.0438253 | 5.298658 | 42.91913 |
Disclaimer/Publisher’s Note: The statements, opinions and data contained in all publications are solely those of the individual author(s) and contributor(s) and not of MDPI and/or the editor(s). MDPI and/or the editor(s) disclaim responsibility for any injury to people or property resulting from any ideas, methods, instructions or products referred to in the content. |
© 2023 by the authors. Licensee MDPI, Basel, Switzerland. This article is an open access article distributed under the terms and conditions of the Creative Commons Attribution (CC BY) license (https://creativecommons.org/licenses/by/4.0/).
Share and Cite
Guo, Q.; Qiu, M.; Li, X.; Sun, W.; Guo, Z. Integrated Design and Flight Validation of Solar-Powered Unmanned Aerial Vehicle (UAV) Structure and Propulsion System. Energies 2023, 16, 7110. https://doi.org/10.3390/en16207110
Guo Q, Qiu M, Li X, Sun W, Guo Z. Integrated Design and Flight Validation of Solar-Powered Unmanned Aerial Vehicle (UAV) Structure and Propulsion System. Energies. 2023; 16(20):7110. https://doi.org/10.3390/en16207110
Chicago/Turabian StyleGuo, Qing, Minghao Qiu, Xiaoqiang Li, Wen Sun, and Zihua Guo. 2023. "Integrated Design and Flight Validation of Solar-Powered Unmanned Aerial Vehicle (UAV) Structure and Propulsion System" Energies 16, no. 20: 7110. https://doi.org/10.3390/en16207110
APA StyleGuo, Q., Qiu, M., Li, X., Sun, W., & Guo, Z. (2023). Integrated Design and Flight Validation of Solar-Powered Unmanned Aerial Vehicle (UAV) Structure and Propulsion System. Energies, 16(20), 7110. https://doi.org/10.3390/en16207110