

Large-Scale Rooftop Solar Photovoltaic Power Production Potential Assessment: A Case Study for Tehran Metropolitan Area, Iran


Abstract
:1. Introduction
2. Literature Review
3. Materials and Methods
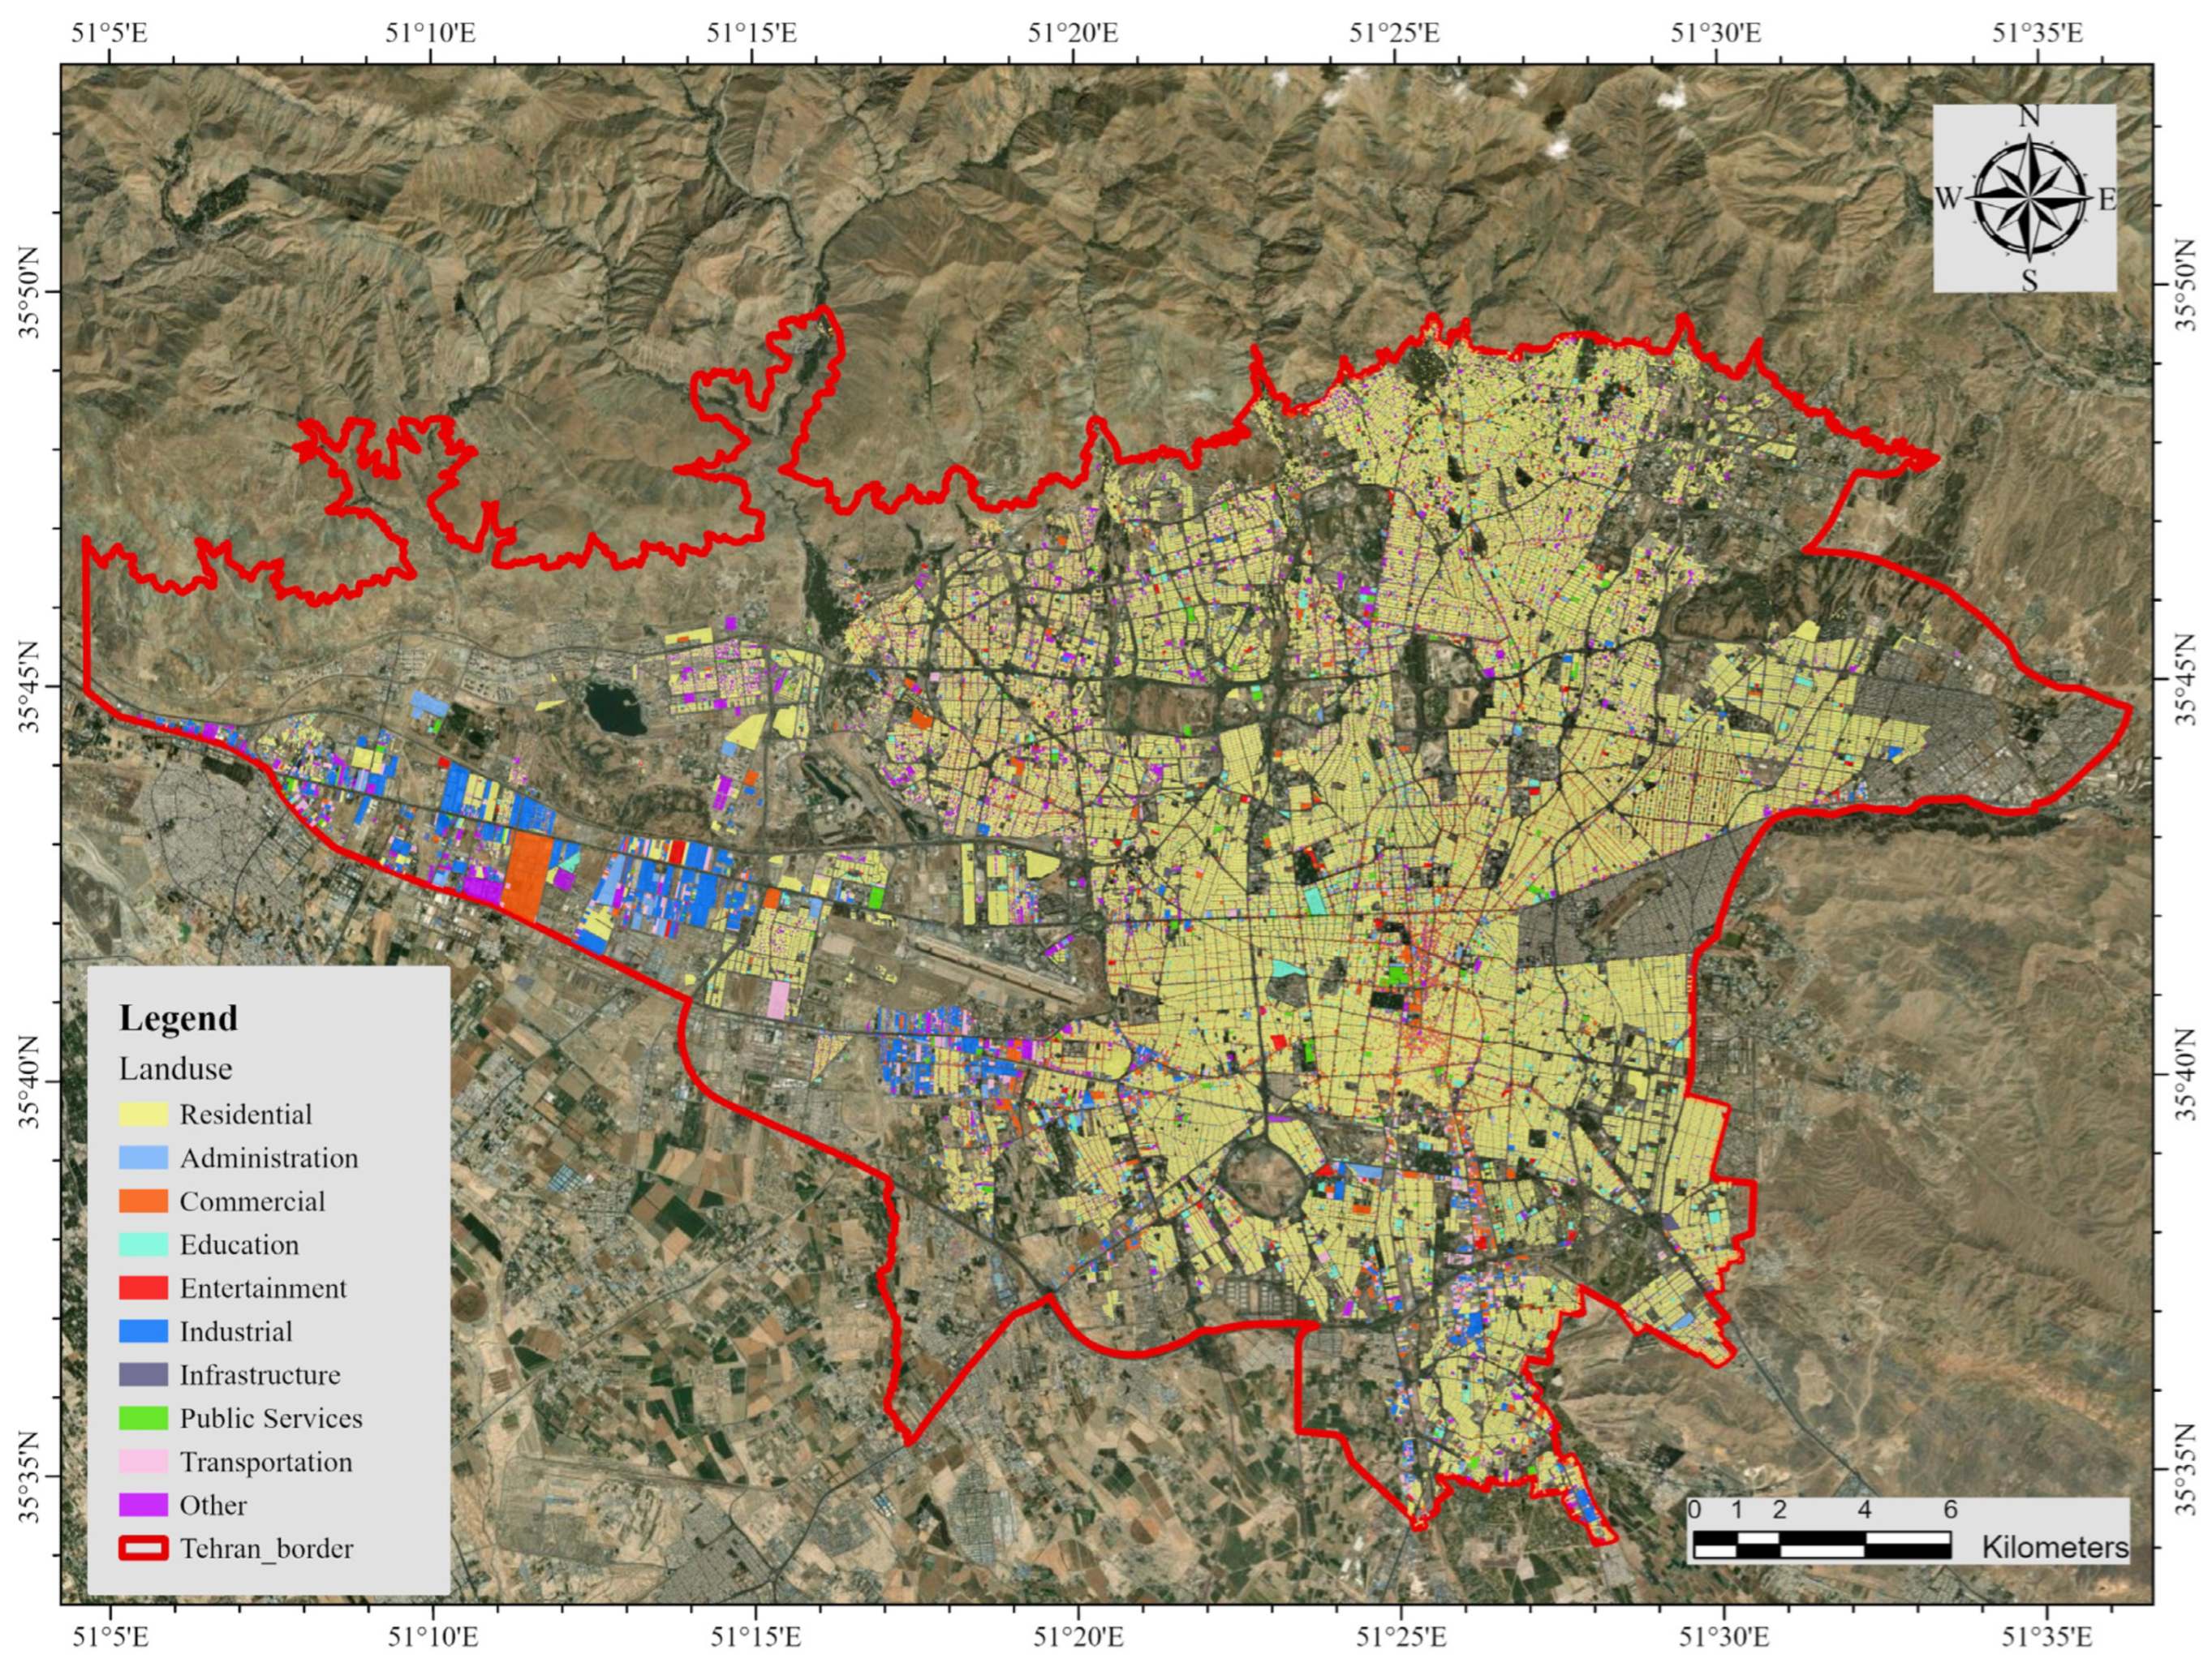
3.1. Study Area
3.2. Data
3.2.1. Land Parcels
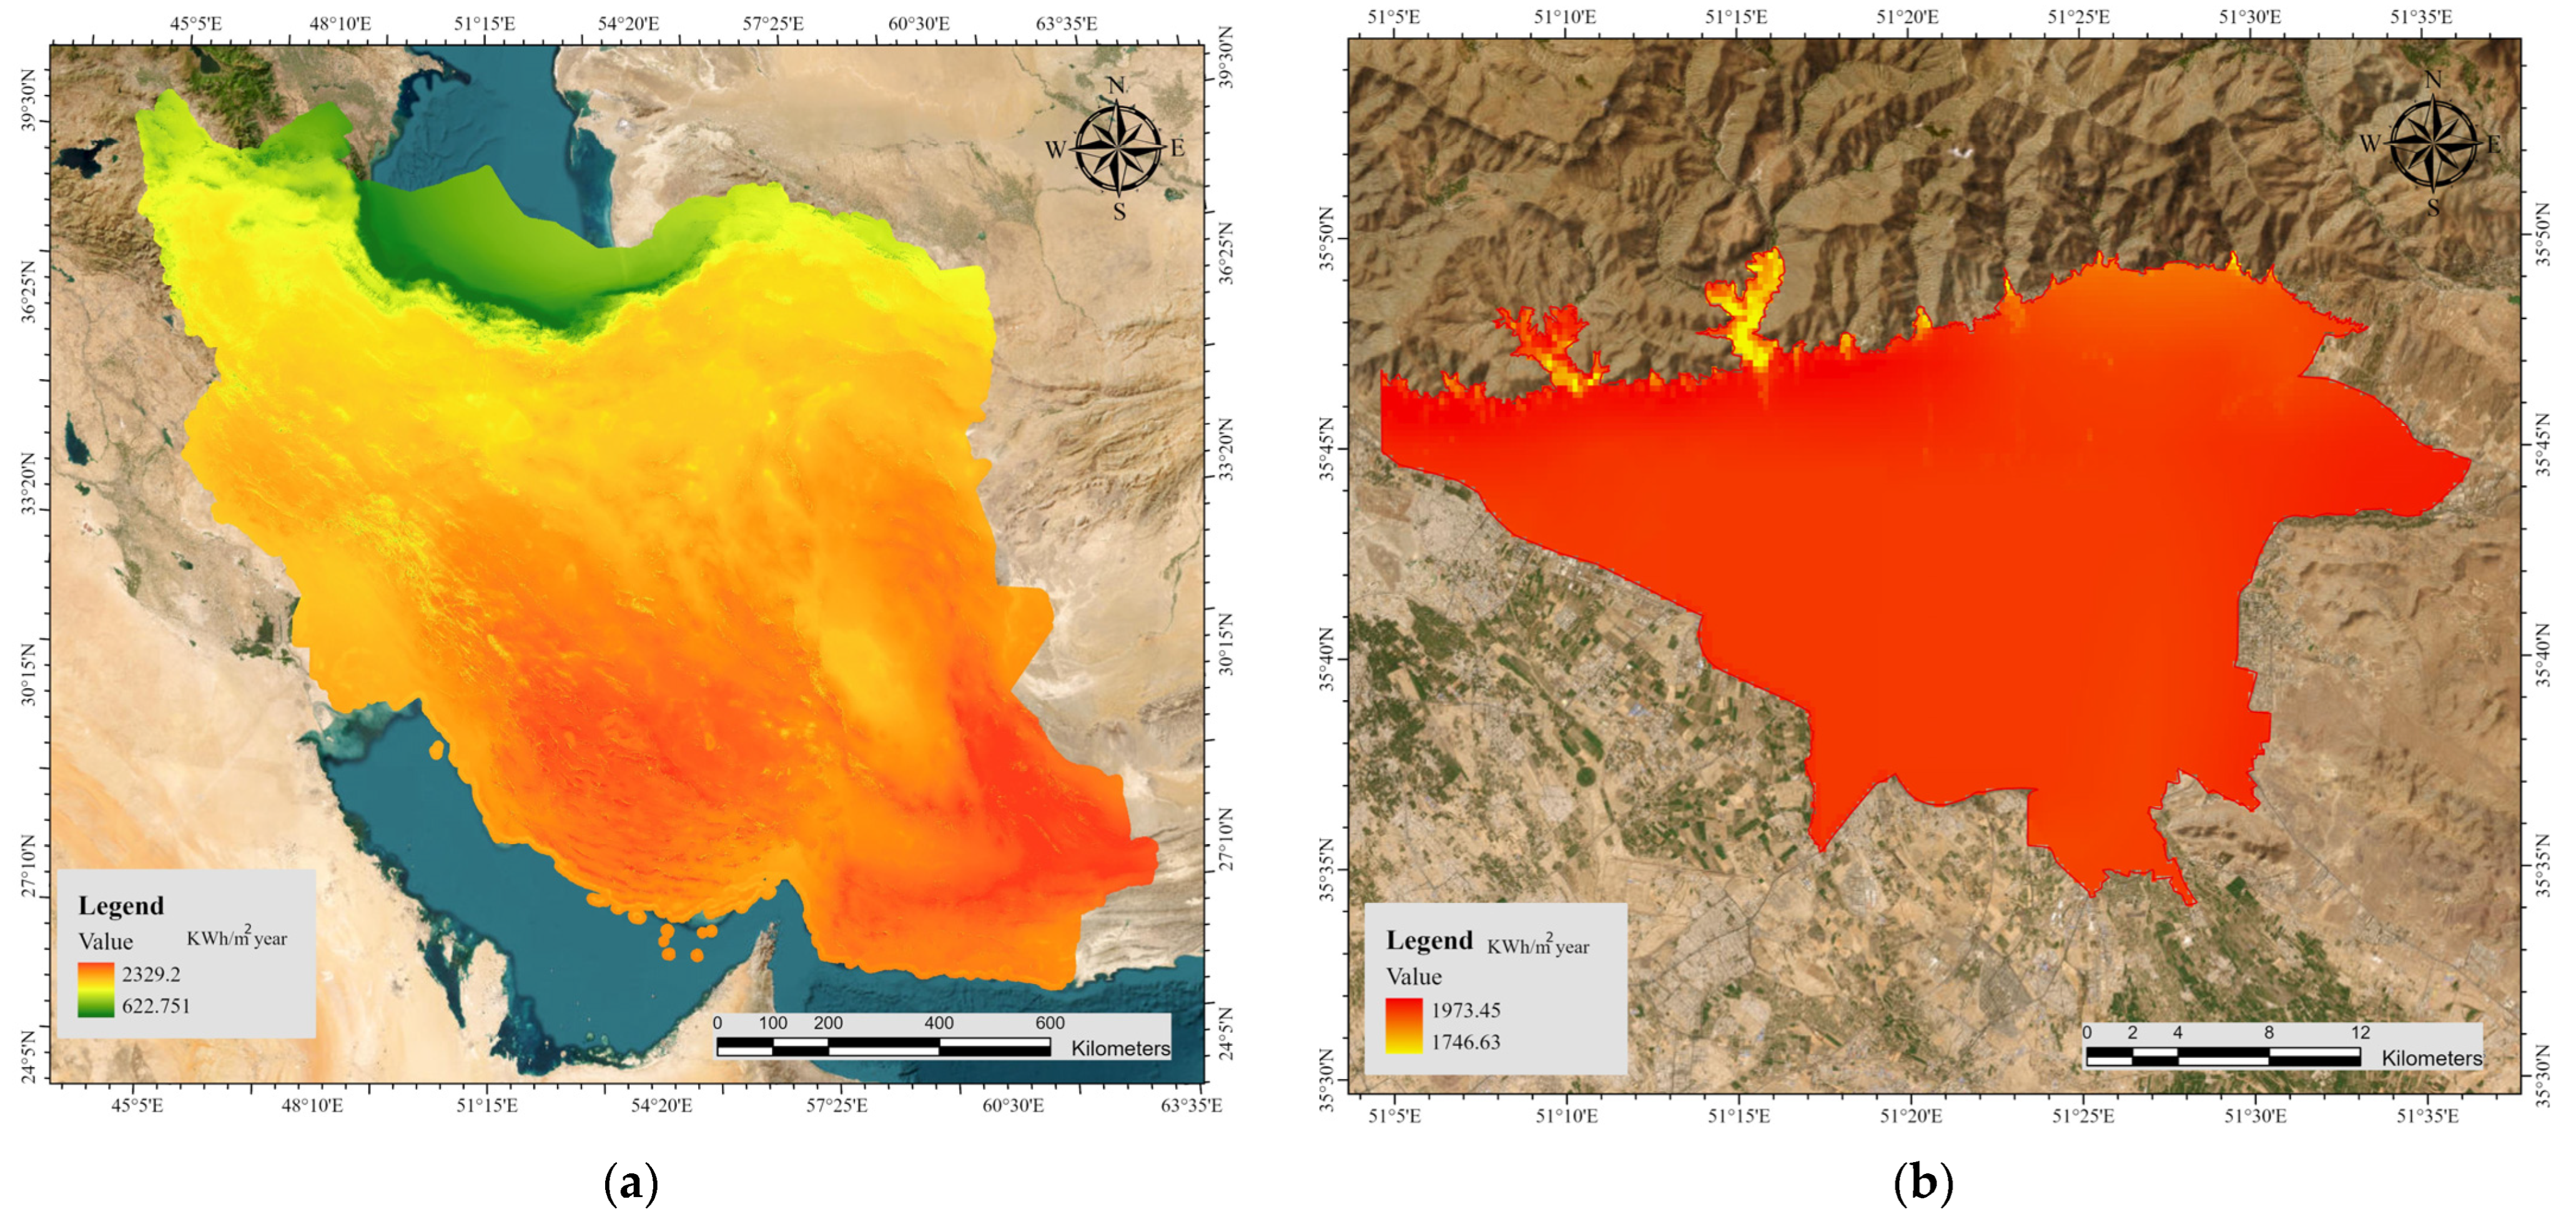
3.2.2. Solar Irradiance
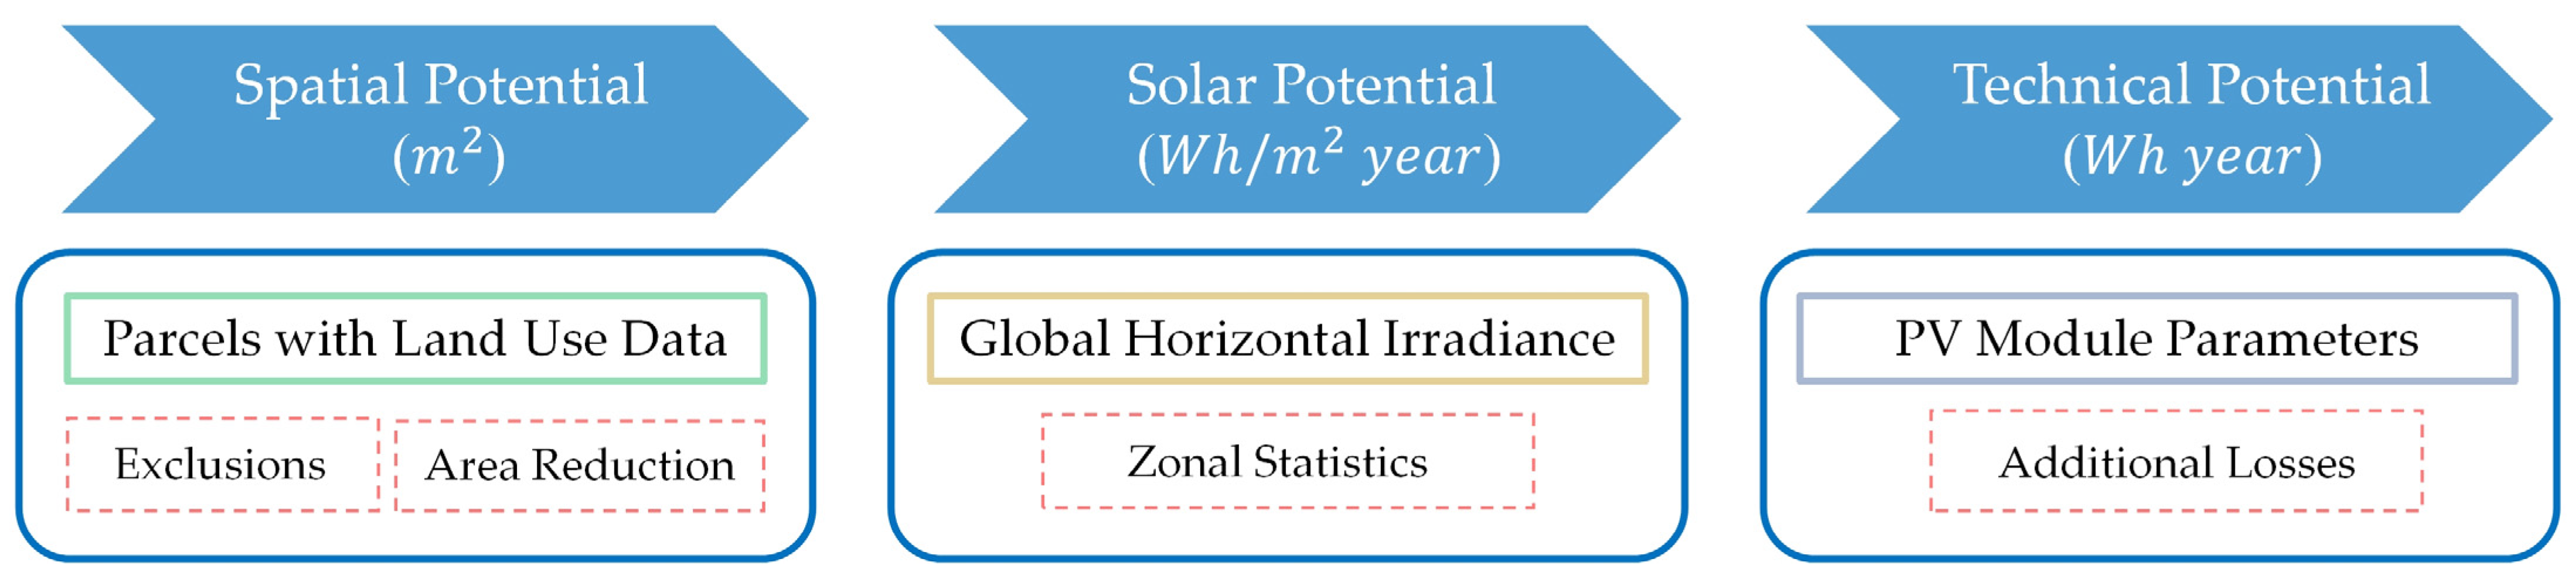
3.3. Spatial Potential
3.4. Physical Potential
3.5. Technical Potential
4. Results
4.1. Roof Exploitable Area
4.2. Solar Potential
4.3. Overall PV Potential
5. Discussion
6. Conclusions
Author Contributions
Funding
Data Availability Statement
Conflicts of Interest
References
- Yousefi, H.; Habibfar, R.; Farhadi, A.; Hosseini, S.M. Integrated Energy, Cost, and Environmental Life Cycle Analysis of Electricity Generation and Supply in Tehran, Iran. Sustain. Cities Soc. 2023, 97, 104748. [Google Scholar] [CrossRef]
- Taksibi, F.; Khajehpour, H.; Saboohi, Y. On the Environmental Effectiveness Analysis of Energy Policies: A Case Study of Air Pollution in the Megacity of Tehran. Sci. Total Environ. 2020, 705, 135824. [Google Scholar] [CrossRef] [PubMed]
- Shami, S.; Ranjgar, B.; Bian, J.; Khoshlahjeh Azar, M.; Moghimi, A.; Amani, M.; Naboureh, A. Trends of CO and NO2 Pollutants in Iran during COVID-19 Pandemic Using Timeseries Sentinel-5 Images in Google Earth Engine. Pollutants 2022, 2, 156–171. [Google Scholar] [CrossRef]
- Bayat, R.; Ashrafi, K.; Shafiepour Motlagh, M.; Hassanvand, M.S.; Daroudi, R.; Fink, G.; Künzli, N. Health Impact and Related Cost of Ambient Air Pollution in Tehran. Environ. Res. 2019, 176, 108547. [Google Scholar] [CrossRef]
- Hosseini, S.M.; Aslani, A.; Kasaeian, A. Energy, Water, and Environmental Impacts Assessment of Electricity Generation in Iran. Sustain. Energy Technol. Assess. 2022, 52, 102193. [Google Scholar] [CrossRef]
- Saeid Atabaki, M.; Mohammadi, M.; Aryanpur, V. An Integrated Simulation-Optimization Modelling Approach for Sustainability Assessment of Electricity Generation System. Sustain. Energy Technol. Assess. 2022, 52, 102010. [Google Scholar] [CrossRef]
- Sampaio, P.G.V.; González, M.O.A. Photovoltaic Solar Energy: Conceptual Framework. Renew. Sustain. Energy Rev. 2017, 74, 590–601. [Google Scholar] [CrossRef]
- Kuhn, T.E.; Erban, C.; Heinrich, M.; Eisenlohr, J.; Ensslen, F.; Neuhaus, D.H. Review of Technological Design Options for Building Integrated Photovoltaics (BIPV). Energy Build. 2021, 231, 110381. [Google Scholar] [CrossRef]
- Sun, L.; You, F. Machine Learning and Data-Driven Techniques for the Control of Smart Power Generation Systems: An Uncertainty Handling Perspective. Engineering 2021, 7, 1239–1247. [Google Scholar] [CrossRef]
- Najafi, G.; Ghobadian, B.; Mamat, R.; Yusaf, T.; Azmi, W.H. Solar Energy in Iran: Current State and Outlook. Renew. Sustain. Energy Rev. 2015, 49, 931–942. [Google Scholar] [CrossRef]
- Hamed Banirazi Motlagh, S.; Hosseini, S.M.A.; Pons-Valladares, O. Integrated Value Model for Sustainability Assessment of Residential Solar Energy Systems towards Minimizing Urban Air Pollution in Tehran. Solar Energy 2023, 249, 40–66. [Google Scholar] [CrossRef]
- Gassar, A.A.A.; Cha, S.H. Review of Geographic Information Systems-Based Rooftop Solar Photovoltaic Potential Estimation Approaches at Urban Scales. Appl. Energy 2021, 291, 116817. [Google Scholar] [CrossRef]
- Chen, S.; Liang, Z.; Guo, S.; Li, M. Estimation of High-Resolution Solar Irradiance Data Using Optimized Semi-Empirical Satellite Method and GOES-16 Imagery. Solar Energy 2022, 241, 404–415. [Google Scholar] [CrossRef]
- Bódis, K.; Kougias, I.; Jäger-Waldau, A.; Taylor, N.; Szabó, S. A High-Resolution Geospatial Assessment of the Rooftop Solar Photovoltaic Potential in the European Union. Renew. Sustain. Energy Rev. 2019, 114, 109309. [Google Scholar] [CrossRef]
- Fakhraian, E.; Forment, M.A.; Dalmau, F.V.; Nameni, A.; Guerrero, M.J.C. Determination of the Urban Rooftop Photovoltaic Potential: A State of the Art. Energy Rep. 2021, 7, 176–185. [Google Scholar] [CrossRef]
- Izquierdo, S.; Rodrigues, M.; Fueyo, N. A Method for Estimating the Geographical Distribution of the Available Roof Surface Area for Large-Scale Photovoltaic Energy-Potential Evaluations. Solar Energy 2008, 82, 929–939. [Google Scholar] [CrossRef]
- Ordóñez, J.; Jadraque, E.; Alegre, J.; Martínez, G. Analysis of the Photovoltaic Solar Energy Capacity of Residential Rooftops in Andalusia (Spain). Renew. Sustain. Energy Rev. 2010, 14, 2122–2130. [Google Scholar] [CrossRef]
- Singh, R.; Banerjee, R. Estimation of Rooftop Solar Photovoltaic Potential of a City. Solar Energy 2015, 115, 589–602. [Google Scholar] [CrossRef]
- Huang, Z.; Mendis, T.; Xu, S. Urban Solar Utilization Potential Mapping via Deep Learning Technology: A Case Study of Wuhan, China. Appl. Energy 2019, 250, 283–291. [Google Scholar] [CrossRef]
- Jo, J.H.; Otanicar, T.P. A Hierarchical Methodology for the Mesoscale Assessment of Building Integrated Roof Solar Energy Systems. Renew. Energy 2011, 36, 2992–3000. [Google Scholar] [CrossRef]
- Zhong, T.; Zhang, Z.; Chen, M.; Zhang, K.; Zhou, Z.; Zhu, R.; Wang, Y.; Lü, G.; Yan, J. A City-Scale Estimation of Rooftop Solar Photovoltaic Potential Based on Deep Learning. Appl. Energy 2021, 298, 117132. [Google Scholar] [CrossRef]
- Jiang, H.; Yao, L.; Lu, N.; Qin, J.; Liu, T.; Liu, Y.; Zhou, C. Geospatial Assessment of Rooftop Solar Photovoltaic Potential Using Multi-Source Remote Sensing Data. Energy AI 2022, 10, 100185. [Google Scholar] [CrossRef]
- Hong, T.; Lee, M.; Koo, C.; Jeong, K.; Kim, J. Development of a Method for Estimating the Rooftop Solar Photovoltaic (PV) Potential by Analyzing the Available Rooftop Area Using Hillshade Analysis. Appl. Energy 2017, 194, 320–332. [Google Scholar] [CrossRef]
- Pinna, A.; Massidda, L. A Procedure for Complete Census Estimation of Rooftop Photovoltaic Potential in Urban Areas. Smart Cities 2020, 3, 873–893. [Google Scholar] [CrossRef]
- Romero Rodríguez, L.; Duminil, E.; Sánchez Ramos, J.; Eicker, U. Assessment of the Photovoltaic Potential at Urban Level Based on 3D City Models: A Case Study and New Methodological Approach. Solar Energy 2017, 146, 264–275. [Google Scholar] [CrossRef]
- Walch, A.; Castello, R.; Mohajeri, N.; Scartezzini, J.-L. Big Data Mining for the Estimation of Hourly Rooftop Photovoltaic Potential and Its Uncertainty. Appl. Energy 2020, 262, 114404. [Google Scholar] [CrossRef]
- Huld, T.; Amillo, A. Estimating PV Module Performance over Large Geographical Regions: The Role of Irradiance, Air Temperature, Wind Speed and Solar Spectrum. Energies 2015, 8, 5159–5181. [Google Scholar] [CrossRef]
- Gautam, B.R.; Li, F.; Ru, G. Assessment of Urban Roof Top Solar Photovoltaic Potential to Solve Power Shortage Problem in Nepal. Energy Build. 2015, 86, 735–744. [Google Scholar] [CrossRef]
- Mainzer, K.; Fath, K.; Mckenna, R.; Stengel, J.; Fichtner, W.; Schultmann, F. A High-Resolution Determination of the Technical Potential for Residential-Roof-Mounted Photovoltaic Systems in Germany. Solar Energy 2014, 105, 715–731. [Google Scholar] [CrossRef]
- Joshi, S.; Mittal, S.; Holloway, P.; Shukla, P.R.; Ó Gallachóir, B.; Glynn, J. High Resolution Global Spatiotemporal Assessment of Rooftop Solar Photovoltaics Potential for Renewable Electricity Generation. Nat. Commun. 2021, 12, 1–15. [Google Scholar] [CrossRef]
- Mostafaeipour, A.; Qolipour, M.; Mohammadi, K. Evaluation of Installing Photovoltaic Plants Using a Hybrid Approach for Khuzestan Province, Iran. Renew. Sustain. Energy Rev. 2016, 60, 60–74. [Google Scholar] [CrossRef]
- Bakhshi-Jafarabadi, R.; Sadeh, J.; Dehghan, M. Economic Evaluation of Commercial Grid-Connected Photovoltaic Systems in the Middle East Based on Experimental Data: A Case Study in Iran. Sustain. Energy Technol. Assess. 2020, 37, 100581. [Google Scholar] [CrossRef]
- Korsavi, S.S.; Zomorodian, Z.S.; Tahsildoost, M. Energy and Economic Performance of Rooftop PV Panels in the Hot and Dry Climate of Iran. J. Clean Prod. 2018, 174, 1204–1214. [Google Scholar] [CrossRef]
- Ali Sadat, S.; Vakilalroaya Fini, M.; Hashemi-Dezaki, H.; Nazififard, M. Barrier Analysis of Solar PV Energy Development in the Context of Iran Using Fuzzy AHP-TOPSIS Method. Sustain. Energy Technol. Assess. 2021, 47, 101549. [Google Scholar] [CrossRef]
- Aryanfar, A.; Gholami, A.; Pourgholi, M.; Shahroozi, S.; Zandi, M.; Khosravi, A. Multi-Criteria Photovoltaic Potential Assessment Using Fuzzy Logic in Decision-Making: A Case Study of Iran. Sustain. Energy Technol. Assess. 2020, 42, 100877. [Google Scholar] [CrossRef]
- Hafeznia, H.; Yousefi, H.; Razi Astaraei, F. A Novel Framework for the Potential Assessment of Utility-Scale Photovoltaic Solar Energy, Application to Eastern Iran. Energy Convers. Manag. 2017, 151, 240–258. [Google Scholar] [CrossRef]
- Asakereh, A.; Soleymani, M.; Sheikhdavoodi, M.J. A GIS-Based Fuzzy-AHP Method for the Evaluation of Solar Farms Locations: Case Study in Khuzestan Province, Iran. Solar Energy 2017, 155, 342–353. [Google Scholar] [CrossRef]
- Noorollahi, E.; Fadai, D.; Akbarpour Shirazi, M.; Ghodsipour, S. Land Suitability Analysis for Solar Farms Exploitation Using GIS and Fuzzy Analytic Hierarchy Process (FAHP)—A Case Study of Iran. Energies 2016, 9, 643. [Google Scholar] [CrossRef]
- Atlas, G.S. Global Solar Atlas 2.0, a Free, Web-Based Application Is Developed and Operated by the Company Solargis Sro on Behalf of TheWorld Bank Group, Utilizing Solargis Data, with Funding Provided by the Energy Sector Management Assistance Program (Esmap). Available online: https://globalsolaratlas.info (accessed on 10 September 2022).
- Global Solar Atlas 2.0: Validation Report. Available online: https://documents.worldbank.org/en/publication/documents-reports/documentdetail/507341592893487792/global-solar-atlas-2-0-validation-report (accessed on 17 September 2023).
- Bosisio, A.; Berizzi, A.; Morotti, A.; Iannarelli, G.; Greco, B.; Boccaletti, C. A GIS-Based Approach to Assessing Large-Scale Building-Integrated Photovoltaic Generation: A Case Study of Milan, Italy. In Proceedings of the 2022 AEIT International Annual Conference, AEIT 2022, Rome, Italy, 3–5 October 2022. [Google Scholar] [CrossRef]
- Tabadkani, A.; Aghasizadeh, S.; Banihashemi, S.; Hajirasouli, A. Courtyard Design Impact on Indoor Thermal Comfort and Utility Costs for Residential Households: Comparative Analysis and Deep-Learning Predictive Model. Front. Archit. Res. 2022, 11, 963–980. [Google Scholar] [CrossRef]
- Shayesteh, H.; Steadman, P. Coevolution of Urban Form and Built Form: A New Typomorphological Model for Tehran. Front. Arch. Res. 2015, 42, 1124–1147. [Google Scholar] [CrossRef]
- Saeed, A.; Mousa, M.; Salah, M.M.; Zekry, A.; Abouelatta, M.; Shaker, A.; Amer, F.Z.; Mubarak, R.I. Design and Simulation of ETL-Free Perovskite/Si Tandem Cell With 33% Efficiency. WSEAS Trans. Electron. 2022, 13, 137–141. [Google Scholar] [CrossRef]
- Elibol, E.; Özmen, Ö.T.; Tutkun, N.; Köysal, O. Outdoor Performance Analysis of Different PV Panel Types. Renew. Sustain. Energy Rev. 2017, 67, 651–661. [Google Scholar] [CrossRef]
- Gaglia, A.G.; Lykoudis, S.; Argiriou, A.A.; Balaras, C.A.; Dialynas, E. Energy Efficiency of PV Panels under Real Outdoor Conditions–An Experimental Assessment in Athens, Greece. Renew. Energy 2017, 101, 236–243. [Google Scholar] [CrossRef]


| Land Use Category | Number | Percentage | Area (km2) | Percentage |
|---|---|---|---|---|
| Residential | 719,427 | 88.97% | 148.07 | 69.13% |
| Administration | 2186 | 0.27% | 11.39 | 5.32% |
| Commercial | 39,122 | 4.84% | 16.50 | 7.7% |
| Education | 3903 | 0.48% | 1.56 | 0.73% |
| Entertainment | 990 | 0.12% | 6.65 | 3.11% |
| Industrial | 7768 | 0.96% | 4.99 | 2.33% |
| Infrastructure | 4557 | 0.56% | 2.02 | 0.94% |
| Public Services | 7506 | 0.93% | 4.11 | 1.92% |
| Transportation | 1748 | 0.22% | 4.59 | 2.14% |
| Other | 21,396 | 2.65% | 14.31 | 6.68% |
| Total | 808,603 | 100% | 214.19 | 100% |
| Category | CBFR |
|---|---|
| Residential | 0.55 |
| Industrial | 0.4 |
| Commercial | 0.45 |
| Infrastructure | 0.35 |
| Education | 0.4 |
| Public services | 0.4 |
| Entertainment | 0.4 |
| Transportation | 0.35 |
| Administration | 0.4 |
| Other | 0.45 |
| Coefficient | Flat | Industrial |
|---|---|---|
| θ 1 | 0° | 20° |
| Cd 2 | 0.5 | 0.8 |
| Cc 3 | 0.45 | 0.45 |
| Csh 4 | 0.45 | 0.9 |
| Category | Area (m2) | CBFR | CRR | AERA (km2) |
|---|---|---|---|---|
| Residential | 148,070,071.46 | 0.55 | 0.1 | 8.14 |
| Industrial | 11,392,848.36 | 0.4 | 1.23 | |
| Commercial | 16,503,993.77 | 0.45 | 0.1 | 0.74 |
| Infrastructure | 1,561,705.58 | 0.35 | 0.1 | 0.05 |
| Education | 6,645,727.94 | 0.4 | 0.1 | 0.27 |
| Public services | 4,988,788.78 | 0.4 | 0.1 | 0.2 |
| Entertainment | 2,015,453.33 | 0.4 | 0.1 | 0.08 |
| Transportation | 4,106,075.41 | 0.35 | 0.1 | 0.14 |
| Administration | 4,591,122.04 | 0.4 | 0.1 | 0.18 |
| Other | 14,305,942 | 0.45 | 0.1 | 0.64 |
| Category | AERA (km2) | EPPR (GWh/Year) |
|---|---|---|
| Residential | 8.14 | 15,760.54 |
| Industrial | 1.23 | 2382.41 |
| Commercial | 0.74 | 1437.7 |
| Infrastructure | 0.05 | 105.79 |
| Education | 0.27 | 514.48 |
| Public services | 0.2 | 386.15 |
| Entertainment | 0.08 | 156 |
| Transportation | 0.14 | 278.14 |
| Administration | 0.18 | 355.43 |
| Other | 0.64 | 1246.36 |
| Category | Parcel Area (km2) | AERA (km2) | EPV (GWh/Year) | Ep (MW) |
|---|---|---|---|---|
| Residential | 148.07 | 8.14 | 2246.82 | 1498.87 |
| Industrial | 11.39 | 1.23 | 339.64 | 226.46 |
| Commercial | 16.50 | 0.74 | 204.96 | 136.69 |
| Infrastructure | 1.56 | 0.05 | 15.08 | 10.06 |
| Education | 6.65 | 0.27 | 73.34 | 48.93 |
| Public services | 4.99 | 0.2 | 55.05 | 36.73 |
| Entertainment | 2.02 | 0.08 | 22.24 | 14.84 |
| Transportation | 4.11 | 0.14 | 39.65 | 26.45 |
| Administration | 4.59 | 0.18 | 50.67 | 33.8 |
| Other | 14.31 | 0.64 | 177.68 | 118.48 |
| Total | 214.19 | 11.67 | 3225.13 | 2151.31 |
Disclaimer/Publisher’s Note: The statements, opinions and data contained in all publications are solely those of the individual author(s) and contributor(s) and not of MDPI and/or the editor(s). MDPI and/or the editor(s) disclaim responsibility for any injury to people or property resulting from any ideas, methods, instructions or products referred to in the content. |
© 2023 by the authors. Licensee MDPI, Basel, Switzerland. This article is an open access article distributed under the terms and conditions of the Creative Commons Attribution (CC BY) license (https://creativecommons.org/licenses/by/4.0/).
Share and Cite
Ranjgar, B.; Niccolai, A. Large-Scale Rooftop Solar Photovoltaic Power Production Potential Assessment: A Case Study for Tehran Metropolitan Area, Iran. Energies 2023, 16, 7111. https://doi.org/10.3390/en16207111
Ranjgar B, Niccolai A. Large-Scale Rooftop Solar Photovoltaic Power Production Potential Assessment: A Case Study for Tehran Metropolitan Area, Iran. Energies. 2023; 16(20):7111. https://doi.org/10.3390/en16207111
Chicago/Turabian StyleRanjgar, Babak, and Alessandro Niccolai. 2023. "Large-Scale Rooftop Solar Photovoltaic Power Production Potential Assessment: A Case Study for Tehran Metropolitan Area, Iran" Energies 16, no. 20: 7111. https://doi.org/10.3390/en16207111
APA StyleRanjgar, B., & Niccolai, A. (2023). Large-Scale Rooftop Solar Photovoltaic Power Production Potential Assessment: A Case Study for Tehran Metropolitan Area, Iran. Energies, 16(20), 7111. https://doi.org/10.3390/en16207111