Article

Large-Scale Rooftop Solar Photovoltaic Power Production Potential Assessment: A Case Study for Tehran Metropolitan Area, Iran

Electrical Engineering, Department of Energy, Politecnico di Milano, 20156 Milan, Italy
*
Author to whom correspondence should be addressed.
Energies 2023, 16(20), 7111; https://doi.org/10.3390/en16207111
Submission received: 18 September 2023 / Revised: 10 October 2023 / Accepted: 14 October 2023 / Published: 16 October 2023

Abstract

:
The exponential growth of population and industries has brought about an increase in energy consumption, causing severe climatic and environmental problems. Therefore, the move towards green renewable energy is being ever more intensified. This study aims at estimating the rooftop solar power production for Tehran, the capital city of Iran, using a Geospatial Information System (GIS) to assess the big data of city building parcels. Tehran is faced with severe air pollution due to its excessive fossil fuel usage, and its electricity demand is increasing. As a result, this paper attempts to provide the quantified solar power potential of city roof tops for policymakers and authorities in order to facilitate decision-making in relation to integrating renewable energies into the power production infrastructure. The results shows that approximately 3000 GWh (more than 14% of the total electric energy consumption) of solar power can be produced by the rooftop PV installations in Tehran. The potential nominal power of rooftop PV installations is estimated to be more than 2000 MW, which is four times the current installed PV capacity of the whole country. The findings of the study suggest that there is great potential hidden on the rooftops of the city, which can be utilized to assist the power systems of the city in the longer run for a more sustainable future.

1. Introduction

The rapid growth of global energy consumption and the escalating concerns over climate change have intensified the quest for sustainable and renewable energy sources. Iran, as a nation characterized by substantial energy consumption and production, faces increasing challenges arising from its heavy reliance on fossil fuels. The country is among the highest CO2-emitting nations in the world, with electricity production causing nearly one-third of the pollution [1]. The persistent use of non-renewable energy sources not only results in environmental degradation, but also poses economic and social implications. Tehran has been dealing with severe air pollution in recent decades and is one of the most polluted cities in the world [2,3]. The cost of health issues caused by air pollution is estimated to be approximately 5% of the total GDP of the city [4].
In spite of recent regulations and initiatives for renewable energy establishment, still, more than 85% of the electricity production relies on fossil fuel-based power plants (FFPP) [
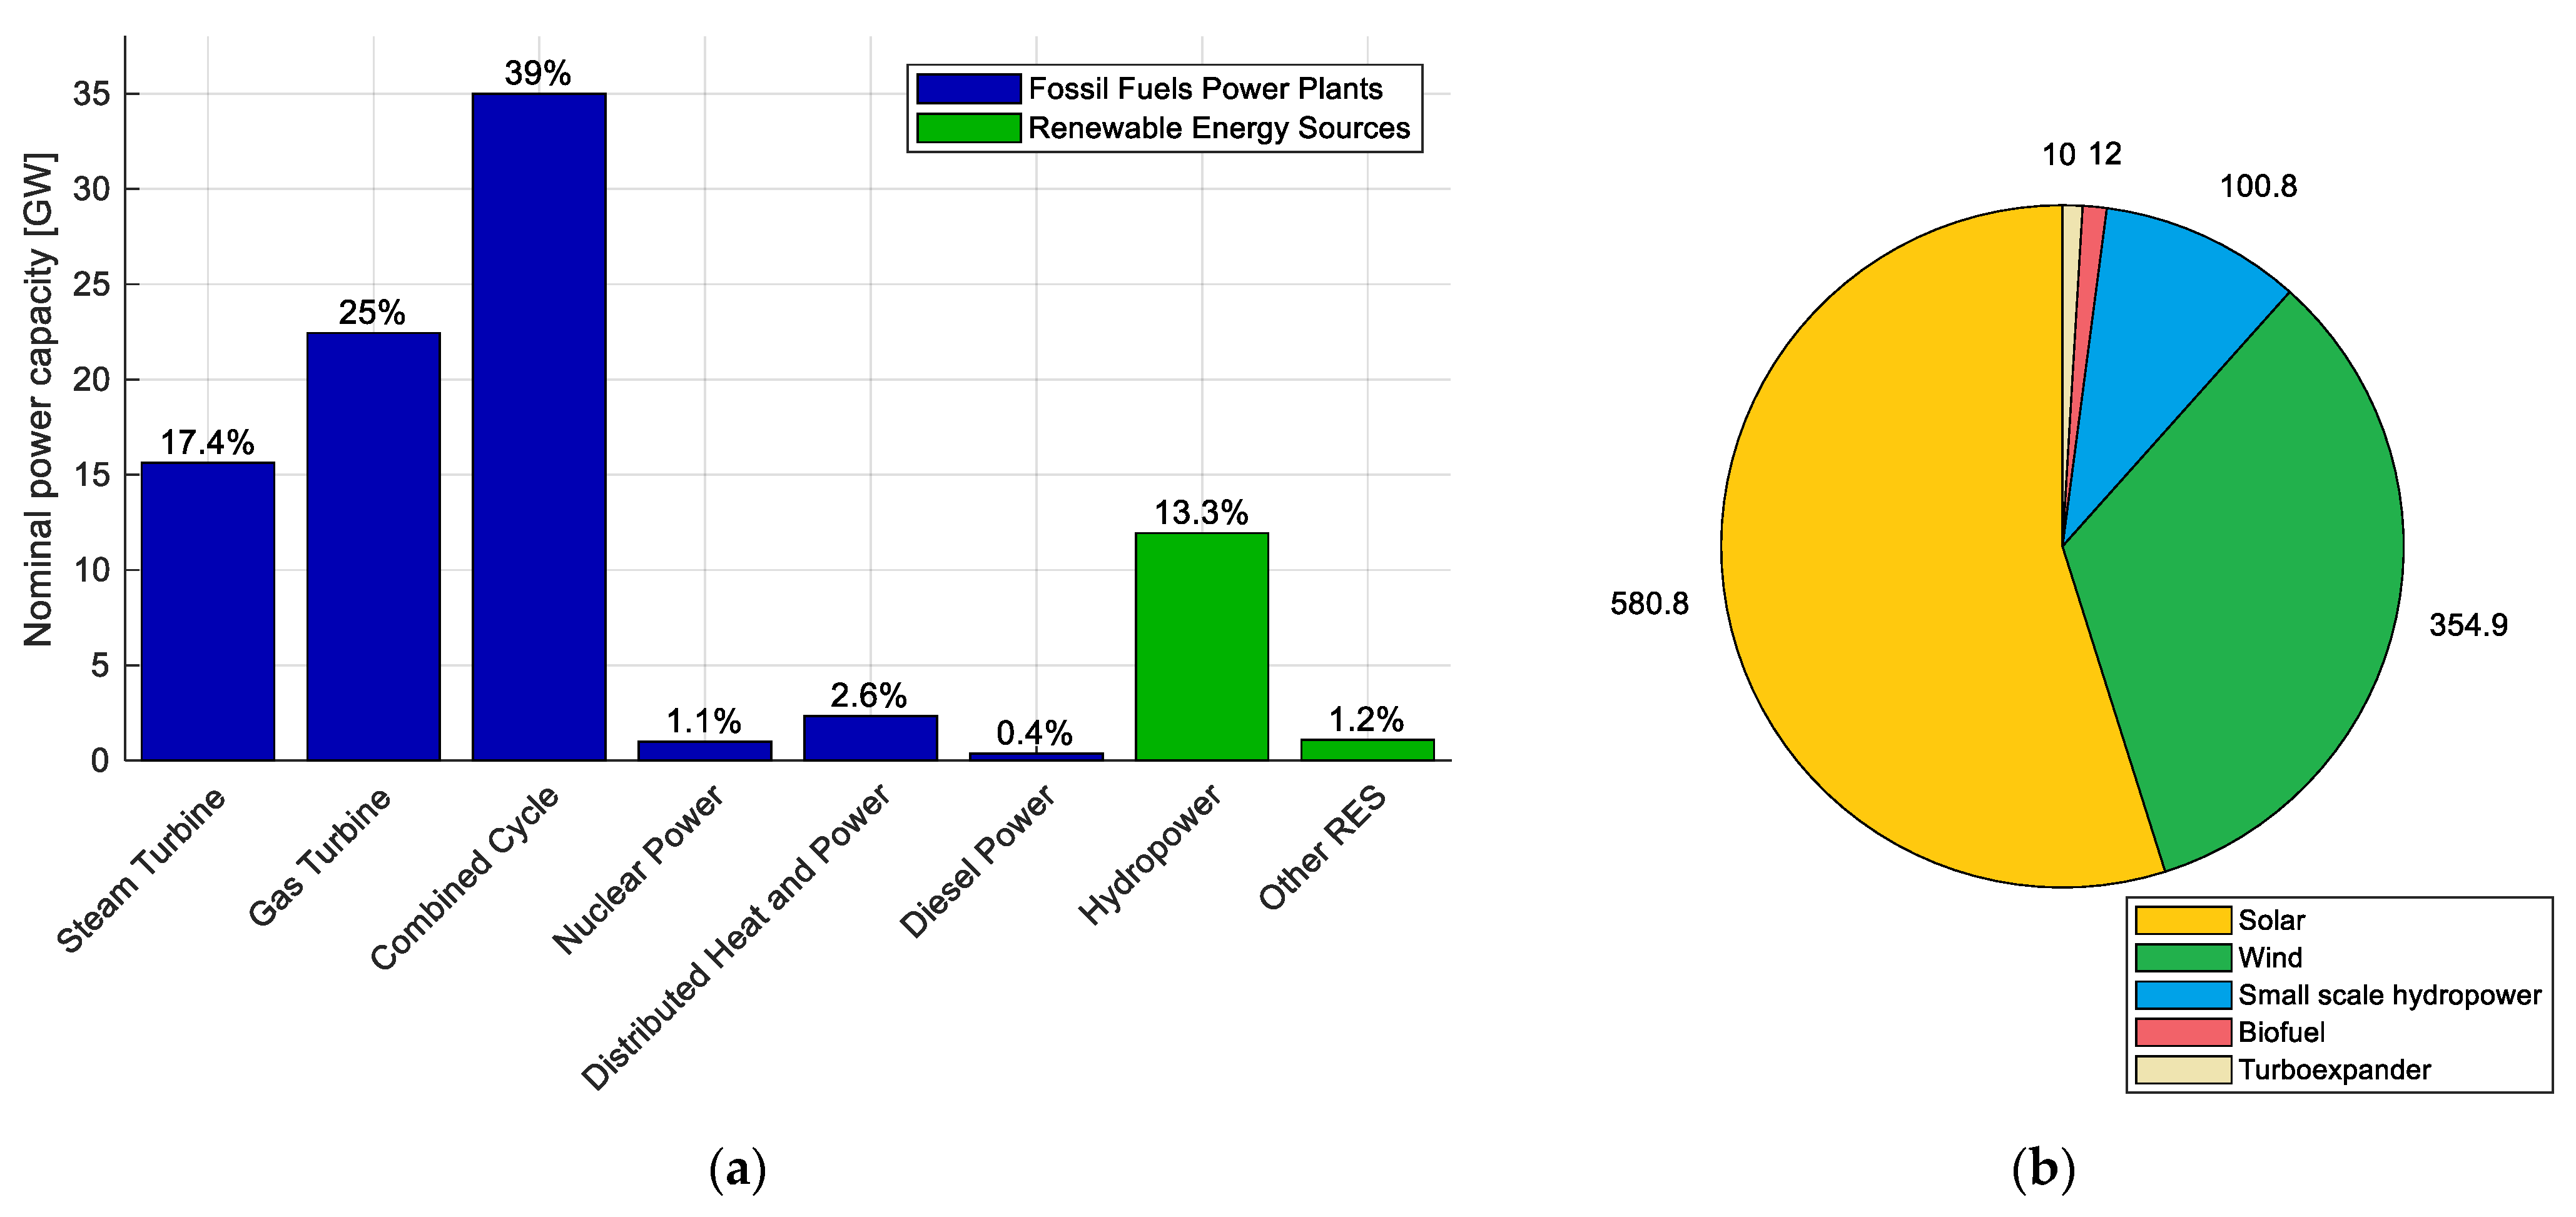
5]. The situation is even worse in Tehran, where FFPP accounts for nearly 96% of the electricity production, based on a report from Iran’s power generation, transmission and distribution management company (TAVANIR) in 2020. Figure 1a shows the distribution of electric power plants in Iran based on the latest report from TAVANIR published 18 June 2023. The notable point is that renewable energy resources (RES) contribute only 1.2% of the 91,000 MW nominal power capacity of the whole country. Figure 1b depicts the distribution of these RES plants.
Based on the latest reports from TAVANIR, during the hottest days of July 2023, a new historical maximum consumption record above 70,000 MW was recorded for the country. This puts a lot of pressure on the power production network of Iran, resulting in power outages. To prevent blackouts and cope with the supply–demand gap in the summer of 2022, the government was forced to limit the power usage of electricity-intensive industries and office hours [6].
Considering the increase in power demand and environmental problems, the need to adopt clean and sustainable energy solutions is becoming paramount. Among these, solar photovoltaic (PV) systems have emerged as a promising solution, offering clean, abundant, and inexhaustible energy from the sun [7]. Rooftop solar PV installations, in particular, present a compelling opportunity to harness solar energy within urban environments, optimizing space utilization within cities, preventing conflicts with other sectors such as food production, reducing dependence on traditional fossil fuels and eventually moving towards green net-zero-energy buildings [8]. The incorporation of intelligent systems within renewable energy production can further increase the efficiency in the power generation sector [9].
Iran, a country endowed with abundant solar irradiance and an expanding urban landscape, is positioned to exploit the enormous potential of rooftop solar PV technology [10]. The capital city, Tehran, as the core of Iran’s economic and cultural activities, has experienced unprecedented urban development over the years, resulting in an increased demand for electricity [11]. To address this growing energy demand sustainably, there is an urgent need to assess the rooftop solar PV power production potential across the metropolitan area.
This paper endeavors to explore the untapped potential of solar energy, particularly through rooftop photovoltaic (PV) installations, in the Tehran metropolitan area. It presents a comprehensive study focusing on a large-scale rooftop solar PV power production potential assessment for the Tehran metropolitan area. By quantifying the capacity for solar energy generation in this urban setting, the study seeks to provide valuable insights for policymakers, urban planners, and energy stakeholders and thus facilitate informed decision-making towards the integration of renewable energy solutions into the existing energy infrastructure, moving towards cleaner energy production and decreasing its carbon footprint. Furthermore, the findings will facilitate the formulation of effective strategies for integrating renewable energy into the current energy system, thus accelerating Iran’s sustainable development goals and its commitment to combat climate change.
The remainder of the paper proceeds as follows: Section 2 presents a detailed literature review of different methods and various aspects of rooftop PV potential assessment. Section 3 discusses the study area, data used and the methodology employed. Then, Section 4 provides the results obtained within this research. Discussion of the results of the study, as well as its limitations and potential future research areas, are presented in Section 5. Finally, Section 6 concludes the work by providing final remarks.

2. Literature Review

The interest in studying rooftop-mounted solar PV power potential assessment has risen worldwide in recent years. Based on the literature, the most important steps when addressing rooftop PV potential are, first, to accurately estimate the available rooftop area to be used for installing PV modules. In this regard, Geospatial Information System (GIS) in combination with various methods such as sampling, geostatistical, modeling and machine learning (ML) methods, together with satellite imagery, LiDAR and digital surface models (DSMs), has been used to calculate the available roof area [12]. Then, the amount of solar irradiation in the available area must be determined. There are various ways to estimate received solar power in a region, including physical, empirical and semi-empirical models that basically use satellite data to acquire the main meteorological parameters for modeling purposes [13]. The last aspect of these estimations is the technical part, concerning the PV technologies available, along with different design approaches and their performance and loss rates. Here, we present a brief literature review of the state-of-the-art research on this subject, focusing on the aforementioned aspects, along with studies on this subject for Iran. For a more detailed review of works conducted, readers can refer to the following articles [12,14,15].
Estimating the available roof area to be exploited for PV panel establishment is the primary step in rooftop PV potential assessment. Izquierdo et al. developed a method to estimate the available roof area using land use and population density data to compute the rooftop solar energy potential of cities of Spain [16]. They reported an available roof area of 14 ± 4.5 m2 per capita in Spain to install PV modules. In another study on Andalusia in Spain, Ordóñez et al. [17] developed a statistical method to calculate available roof area based on the number and typology of buildings. Moreover, they considered different design scenarios and evaluated their respective power outputs. They found that there is a 9.73 GW per year potential in the rooftops of the residential buildings in the study area. Singh and Banerjee [18] proposed a method to estimate building footprint areas from land use data, which they later used to estimate the available roof area for PV installation. For obtaining the solar irradiation, they used data from a reference book and the Liu Jordan physical model to compute the plane-of-array (POA) solar irradiance. They also performed simulations using the PVSyst software to acquire appropriate ratio values for estimating available roof area and solar irradiance in the study area of Mumbai, India. They computed the potential power production as 2190 MW, which could provide more than 14% of the consumption of city. Furthermore, they evaluated the potential output power of various types of PV modules.
Satellite imagery and DL methods have shown promising results in terms of accurate available roof area [19]. Jo and Otanicar employed object-based image analysis (OBIA) on high-resolution satellite imagery to omit rooftop objects from the final roof area and calculate their shadowing effect [20]. The results show that the proposed method of roof area detection for the PV installation had a 4.21% error rate. In another study, Zhong et al. [21] proposed an approach to extract the roof area from satellite imagery using deep learning (DL) with 92% accuracy. They considered the rooftop as a horizontal plane, and thus used global horizontal irradiance (GHI) to determine potential solar irradiation and computed the yearly solar power output to be 311,853 GWh for the city of Nanjing, China. Jiang et al. [22] took advantage of DL methods for both estimating roof area available from satellite images and solar irradiance from geostationary satellites.
One of the most determinative parameters affecting the PV panels’ performance is shadowing, which can have several sources, such as adjacent panels, roof features, and surrounding building and trees. GIS has been beneficial in this regard, employing spatial analyses for computing shadowed areas based on 3D building data. Hong et al. developed a method to analyze the effects of building shadowing on the available roof top area through hillshade spatial analysis [23]. They acquired the footprint area of buildings along with the number of floors to calculate the shadowed area, and exclude it from the overall roof area. They estimated the available roof area of the Gangnam district in Seoul to be 4.96 km2, with a potential 1130 GWh annual solar power production. Pinna and Massidda, in their study [24], used DSM data to consider rooftop orientation and slope in their estimation of rooftop solar power potential for Cagliari, Italy. They also developed an algorithm for computing the shading effect using the DSM model, which they have published in open source format on GitHub. Rodríguez et al. [25] used 3D CityGML models to extract roof area based on geometric building models through the SimStadt software developed by the university of Stuttgart. In an extensive study, Walch et al. [26] evaluated the rooftop PV potential of Switzerland through a comprehensive method combining ML, GIS and physical solar irradiance models. They developed 3D CityGML models of a building to derive its roof geometry products, such as slope, orientation and available area, to run simulations on different PV panel design. They also used the DSM model together with ML methods to quantify shading effects. Moreover, they employed physical models and meteorological data to compute solar irradiance, and then used ML to extrapolate their calculation for the entire area. They applied their methodology to 9.6 million rooftops throughout Switzerland, and the results revealed that 55% of the total roof area is available for PV installations, which could produce an annual power of 24 ± 9 TWh, equivalent to 40% of the country’s electricity demand.
A small portion of research has focused on the different PV modules’ performances under various ecological and geographical circumstances. For example, Huld and Amillo [27] studied the performance of two module types in a large-scale area of Africa–Europe–Asia in relation to multiple factors, including module reflectivity, solar spectral variations, air temperature and wind. They found that the most noticeable effect is on temperature and irradiance.
Finally, there are studies that focus on the financial potential, and combined it with previous levels of assessments to evaluate the degree to which this potential is feasibly exploitable. Furthermore, they provide results that can be of utmost importance for decision-makers and authorities. Gautam et al. [28] studied the energy usage and electricity consumption situation in Nepal, and assessed the potential power output and economic feasibility of deploying PV panels on rooftops. Mainzer et al. [29], after computing the potential rooftop solar power for each municipality in Germany, evaluated the outcome relative to the electric loads of municipalities to propose policies for maximizing the solar power, and also assessed the technical potential under different scenarios. In a global-scale big data study, Joshi et al. [30] studied the potential rooftop PV, combining the bottom-up and top-down approaches using a fishnet DL method. They estimated the global potential to be 27 TWh/year out of 0.2 million km2 available rooftop area.
Regarding the research study area, much of the work mainly concentrates on the overall potential of the country to adopt a solar PV system, and demonstrates this potential through economic evaluation [31,32,33]. In [34], using a multi-criteria decision-making method, the authors have shown possible hurdles in the way of PV adoption in Iran. They found that the most prominent negative features are the disordered economic state and the cumbersome nature of paperwork and bureaucracy. The recommended solutions were identified as financial incentives. In another study, a fuzzy logic decision-making method was employed to determine which provinces of Iran are most capable of adopting PV power plants using social, technical, economic and environmental criteria [35]. There is also some research that has used GIS methods to assess PV solar energy usage in Iran [36,37,38].
According to the existing literature, a notable gap exists in the assessment of the rooftop solar power potential within Iran, despite its geographical location that should dispose it to taking advantage of this clean and abundant energy. Regarding the country, much of the previous research has aimed at detecting the most suitable site the construction of large-scale PV power plants, rather than rooftop-integrated PV installations. Therefore, this research intends to cover this gap and quantitatively explore the potential of urban rooftops to produce electricity from solar energy. It endeavors to provide a much more realistic value of the potential power generation in order to improve awareness among policymakers and decision-makers in the move towards clean solar energy.

3. Materials and Methods

The overall methodology adopted in this study is presented in Figure 2. As can be seen, the top-down approach has three main aspects. In the first level, the exploitable roof area is calculated. Then, using spatial analysis and the solar irradiation layer, the potential power output for the area estimated in the first step is computed. Finally, the parameters related to the technical potential of PV panels are applied to yield a final estimation of possible power output.

3.1. Study Area

The metropolitan area of Tehran, the capital city of Iran, is chosen for this research. Its geographical extent ranges from 51 ° 4 to 51 ° 36 longitudes and from 35 ° 34 to 35 ° 50 latitudes (Figure 3). It had a population of nearly 9 million according to official census data from 2016, which now stands at 9.5 million (2022 population estimation data), with 16 million in the wider suburban area, which makes it the 29th most populated city in the world. The air pollution metrics in the city are quite high, and it experiences a large number of days with unhealthy air. It is a densely populated city, with most of the buildings being residential with high electricity consumption. On the other hand, it has great solar potential, with most of the days of year being sunny. Therefore, it is selected for the evaluation of rooftop PV potential. Figure 3 depicts the study area, with parcels data super imposed over the satellite imagery basemap.

3.2. Data

3.2.1. Land Parcels

City parcels with land use categories were acquired from the Tehran municipality for estimating the available roof area. The original data contained 24 categories. However, these categories have been merged into more general categories. Meanwhile, two categories of parcels (green spaces, military bases) with lower building footprint ratios (BFR) were omitted from the data. Moreover, parcels below 2.5 m2 were also removed from the final layer. Table 1 illustrates the numbers and percentages of parcels in different categories. As can be seen, most of the parcels are residential. The next largest categories are commercial and other buildings. The rooftop area will be extracted from these parcels’ areas. As mentioned earlier, a benefit of rooftop PV installations is that the land cost is not a factor, since it takes advantage of unused roof space.

3.2.2. Solar Irradiance

Since most of the roofs in Tehran are flat, for this study, we used global horizontal irradiance (GHI). GHI is the sum of direct and diffuse radiation received on a horizontal plane. We acquired the GHI raster layer from the “Global Solar Atlas” [39], which is an organization supported by the world bank that collects and applies state-of-the-art satellite data and methods, and produces different solar irradiation products for all regions of the world. They employ a semi-empirical method that is explained in detail on their website, which takes into account the atmospheric effects (aerosol, ozone, water vapor and cloud) and shading influences of the surrounding terrain. Moreover, they have carried out an extensive evaluation of the model’s output by comparing it to in-situ measurements made at more than 200 stations in different parts of the world under various weather conditions. The results show a ±4.0% degree of reliability [40]. Figure 4 displays the GHI layer for Iran (a) and Tehran (b), which is extracted via masking using the city border. We can see that the potential solar power for Tehran varies from a to b. Also, it is obvious that for most of the city, the value is high, except for in the mountainous parts located in the north of the city. However, the value is much higher compared to other countries that have employed PV plants, especially European countries, and even the ones positioned in southern areas.

3.3. Spatial Potential

The aim of this part of the methodology is to estimate the final exploitable roof area, as it is the backbone of rooftop PV potential assessments. Due to the lack of precise data on different roof geometries, and to increase the simplicity of computations, the available roof area is approximated progressively by applying empirical reduction coefficients. This approach is extensively employed in the literature [17,18,25,41] for its low computation cost and acceptable capacity to approximate real-world quantities.
In this regard, first, it should be noted that a building comprises only a portion of a parcel. The other portions comprise the yard, entertainment, parking and other usages. Therefore, a ratio must be determined to derive the building footprint area (BFA) from the whole parcel area. By 6 studying the literature [42,43], a preliminary assessment of building composition in Iran was carried out. Furthermore, by overlaying these findings on satellite imagery in the GIS environment, measurements were made on a random sample of buildings with parcels in each category, and their relative BFR coefficients ( C B F R ) were determined. The relative BFRs for each category of parcels are shown in Table 2.
Another important aspect when estimating spatial potential is roof typology. A certain portion of each rooftop can be exploited for PV panel installation. This is also mainly based on the typologies of the roofs. There are four main roof types studied in the literature, including flat, industrial, double-pitched and complex. The dominant roof type in Tehran is flat. Only a portion of industrial buildings use industrial roof type. This is also verified by inspecting satellite imagery. To compute the reduction rate (RR) of the two roof types, the first factor to be considered is the roof slope ( θ ), which is 0 for flat roofs, and is assumed to be 20 degrees for industrial buildings. A sizeable amount of roof area is occupied by heating, ventilation and air conditioning devices. This is taken into account by a roof devices coefficient C d of 0.5 for flat buildings and 0.8 for industrial roofs. A covering coefficient C c of 0.45 for both roof typologies is considered to account for the proper planning of PV panels, taking into account the shadowing of panels on each other and the optimal orientation towards sun. The next most important factor is the shadowing effect caused by objects and other buildings around a roof. Flat roofs are mostly used on residential building, and they host more devices compared to industrial buildings. Also, almost all residential buildings are surrounded by other residential building, as opposed to industrial buildings. Thus, C s h values of 0.45 and 0.9 are adopted for flat and industrial roof types, respectively. Table 3 summarizes the various coefficients employed.

3.4. Physical Potential

As discussed before, the GHI layer within Solar Atlas is used in this study to assess physical solar potential. However, our contribution to the development of this phase is that, as opposed to previous studies that use a single value for a large region, we used zonal statistics to calculate the GHI value specific to each parcel. Zonal statistics can be used to calculate a value for a zone based on a statistic tool such as maximum, mean, sum, etc., using the values of the underlying raster layer (Figure 5).

3.5. Technical Potential

In the last step, the characteristics of PV modules must be considered. PV panels differ based on the materials used, and each has a different performance rate. Here, we consider the most widely used PV technology, a standard 60-cell mono-crystalline silicon panel with a size of 1.63 m2, which has a cell efficiency of 22.9% and a rating power of 300 W. There are different technologies with various cell efficiency values ranging from above 40% to 12%. We chose a commonly used type of PV module for this potential assessment task [44]. However, the panel efficiency was assumed to be C P V e f f = 0.22 to be on the safe side. Other losses in the PV’s performance in outdoor conditions arise due to temperature, panel orientation, and installing restrictions. We consider the losses due to temperature and azimuth to be 10% ( C T = 0.9 , C A z = 0.9 ). The losses that arise as a result of the surface reflection of panels, dust on PV arrays, cabling, and inverter efficiency are all summarized within the installation ratio coefficient ( C I R = 0.8 ).

4. Results

4.1. Roof Exploitable Area

The reduction coefficients for flat ( C F ) and industrial ( C I n d ) roofs are calculated using Equations (1) and (2) below. Then, the roof reduction coefficient ( C R R ) can be calculated based on the percentages of roofs represented in every category (Equation (3)). Since roofs are mostly flat in Tehran, the value of C R R is equal to the flat roof coefficient for almost all the categories, but for the industrial category, 60% of roofs are considered industrial, and the rest are flat.
C F = C d C c C s h   ~   0.1
C I n d = C d C c C s h cos θ   ~   0.383
C R R = C F P F + C I n d P I n d
where P F and P I n d are the percentages of flat and industrial roofs, respectively. The exploitable roof area ( A E R A ) is computed using Equation (4). Table 4 shows the A E R A of each category, derived after applying the BFR and RR coefficients to the raw parcel area. We can see that 5.5% of the total 148 km2 parcel area in Tehran can be used for PV installation.
A E R A = A C B F R C R R

4.2. Solar Potential

After deriving the exploitable roof area and a specific solar irradiation value for each building, we can calculate the potential power yields of the rooftops. When computing the solar irradiation value for each parcel, we used the zonal tool with mean statistics, which computes the mean values of pixels from the underlying georeferenced GHI layer (Equation (5)). Table 5 shows the exploitable area of each category, along with the potential received power of that area, as calculated by Equation (6).
x ¯ = 1 n i = 1 n x i
where x ¯ is the mean GHI value for a zone (building parcel), n is the number and x i gives the values of the pixels in the GHI layer corresponding to the zone.
E P P R = i = 1 m A i G H I i C B F R C R R
where E P P R is the potential power received, A i is the parcel area, G H I i is the GHI value for the parcel computed by zonal statistics and m is the number of parcels within a category.

4.3. Overall PV Potential

In order to obtain the final PV potential of the rooftop area, we have to apply the technical ratio. The total technical ratio ( C T e c h ) is calculated using Equation (7). The derived rate is a little above 14%, which coheres with the results of related studies on the efficiency of monocrystalline PV panels in outdoor environments [45,46]. This value is applied to the previous potential computed via Equation (6), and then we can obtain the overall PV production ( E P V ) through Equation (8). Additionally, by considering the standard PV panel features mentioned earlier, the potential install capacity for each category can also be estimated ( E P ) via Equation (9). Table 6 summarizes the overall results acquired via the steps outlined below.
C T e c h = C P V e f f C T C A z C I R ~ 0.1425
E P V = E P P R · C T e c h
E P = A E R A 1.63 300

5. Discussion

The present study has attempted to estimate the potential power output of rooftop solar PV installations in Tehran, the capital of Iran. The methodology proposed is based on a multi-level framework within the GIS environment. Of the 214 km2 parcel area, 11.67 km2 is estimated as the roof area exploitable for PV panel installation, which represents 5.45% of the total parcel area. Based on the solar irradiation data, the power production for a year is calculated to be 3225 GWh. Considering the TAVANIR report, this amount corresponds to approximately 14% of the electricity consumption of Tehran in the year 1400 (national calendar system, 21 March 2021–20 March 2022)—23,450 GWh. On the other hand, the capacity potential is computed to be 2151 MW, which is nearly one-third of the July 2023 peak in the Tehran power distribution network. Moreover, this number is roughly four times the current PV capacity of the whole country (580.7 MW).
This work would benefit from several adaptations that would enable it to achieve a more accurate result. The main inputs of this assessment were roof area and solar radiation. If these were to be acquired in a more precise manner, the results would reflect a finer estimation. Therefore, a way to improve the current research could involve the acquisition and usage of more finely detailed building information to obtain the exact roof area and its geometry. Also, 3D data can be very useful in this regard when computing the shadow effects of buildings. Furthermore, the employment of a combination of physical–empirical methods for modeling the sun, its trajectory, its orientation, its azimuth, and other parameters in the area relevant to calculating different components of solar irradiance can yield an outcome more reflective of the real-world situation for potential solar power evaluation. Moreover, considering the financial aspects of such developments, including the PV panels’ efficiency through time and the requirements of other necessary equipment, could lead to a more realistic assessment, and help us determine the financial feasibility of using PVs in the more effective management of a renewable energy infrastructure.

6. Conclusions

In conclusion, this paper aims to bridge the existing knowledge gap by providing a detailed analysis of the rooftop solar PV power production potential of the Tehran metropolitan area, Iran. By deepening our understanding of the capacity for solar energy generation, stakeholders can devise more effective strategies that will foster the sustainable development of renewable energy sources, while contributing to Iran’s commitment to mitigate climate change and enhance energy security. The results show a potential yearly power production of approximately 3000 GWh as derivable from rooftop PV installations in Tehran city. This amount is around 14% of the total electricity consumption of the city. Other cities in more southern areas of Iran show even greater potential in solar power production, which highlights the great opportunity for green energy production and carbon footprint reduction in the country. A problem that is met in establishing PV plants is land acquisition, which is costly and controversial, as it might bring about conflicts with other sectors, such as agriculture. It can thus be regarded as a threat to the food production system—another important strategic factor for society. In cases of rooftop PV, though, there is no need to acquire new land, and it can exploit unused space on rooftops. The investigation into Tehran’s rooftop solar PV potential holds the promise of ushering in a new era of clean energy utilization, bolstering Iran’s energy security and environmental sustainability without causing conflicts with the food production system. By capitalizing on its natural solar resources and embracing rooftop PV installations, the nation can pave the way towards a greener and more sustainable future.

Author Contributions

Conceptualization, B.R.; data curation, B.R.; investigation, B.R.; methodology, B.R. and A.N.; project administration, A.N.; software, B.R.; supervision, A.N.; validation, B.R.; visualization, B.R.; writing—original draft, B.R.; writing—review and editing, A.N. All authors have read and agreed to the published version of the manuscript.

Funding

This research received no external funding.

Data Availability Statement

Solar irradiance data is openly available at global solar atlas (website: https://globalsolaratlas.info accessed on 17 September 2023). Parcel data is available upon request from authors.

Conflicts of Interest

The authors declare no conflict of interest.

References

  1. Yousefi, H.; Habibfar, R.; Farhadi, A.; Hosseini, S.M. Integrated Energy, Cost, and Environmental Life Cycle Analysis of Electricity Generation and Supply in Tehran, Iran. Sustain. Cities Soc. 2023, 97, 104748. [Google Scholar] [CrossRef]
  2. Taksibi, F.; Khajehpour, H.; Saboohi, Y. On the Environmental Effectiveness Analysis of Energy Policies: A Case Study of Air Pollution in the Megacity of Tehran. Sci. Total Environ. 2020, 705, 135824. [Google Scholar] [CrossRef] [PubMed]
  3. Shami, S.; Ranjgar, B.; Bian, J.; Khoshlahjeh Azar, M.; Moghimi, A.; Amani, M.; Naboureh, A. Trends of CO and NO2 Pollutants in Iran during COVID-19 Pandemic Using Timeseries Sentinel-5 Images in Google Earth Engine. Pollutants 2022, 2, 156–171. [Google Scholar] [CrossRef]
  4. Bayat, R.; Ashrafi, K.; Shafiepour Motlagh, M.; Hassanvand, M.S.; Daroudi, R.; Fink, G.; Künzli, N. Health Impact and Related Cost of Ambient Air Pollution in Tehran. Environ. Res. 2019, 176, 108547. [Google Scholar] [CrossRef]
  5. Hosseini, S.M.; Aslani, A.; Kasaeian, A. Energy, Water, and Environmental Impacts Assessment of Electricity Generation in Iran. Sustain. Energy Technol. Assess. 2022, 52, 102193. [Google Scholar] [CrossRef]
  6. Saeid Atabaki, M.; Mohammadi, M.; Aryanpur, V. An Integrated Simulation-Optimization Modelling Approach for Sustainability Assessment of Electricity Generation System. Sustain. Energy Technol. Assess. 2022, 52, 102010. [Google Scholar] [CrossRef]
  7. Sampaio, P.G.V.; González, M.O.A. Photovoltaic Solar Energy: Conceptual Framework. Renew. Sustain. Energy Rev. 2017, 74, 590–601. [Google Scholar] [CrossRef]
  8. Kuhn, T.E.; Erban, C.; Heinrich, M.; Eisenlohr, J.; Ensslen, F.; Neuhaus, D.H. Review of Technological Design Options for Building Integrated Photovoltaics (BIPV). Energy Build. 2021, 231, 110381. [Google Scholar] [CrossRef]
  9. Sun, L.; You, F. Machine Learning and Data-Driven Techniques for the Control of Smart Power Generation Systems: An Uncertainty Handling Perspective. Engineering 2021, 7, 1239–1247. [Google Scholar] [CrossRef]
  10. Najafi, G.; Ghobadian, B.; Mamat, R.; Yusaf, T.; Azmi, W.H. Solar Energy in Iran: Current State and Outlook. Renew. Sustain. Energy Rev. 2015, 49, 931–942. [Google Scholar] [CrossRef]
  11. Hamed Banirazi Motlagh, S.; Hosseini, S.M.A.; Pons-Valladares, O. Integrated Value Model for Sustainability Assessment of Residential Solar Energy Systems towards Minimizing Urban Air Pollution in Tehran. Solar Energy 2023, 249, 40–66. [Google Scholar] [CrossRef]
  12. Gassar, A.A.A.; Cha, S.H. Review of Geographic Information Systems-Based Rooftop Solar Photovoltaic Potential Estimation Approaches at Urban Scales. Appl. Energy 2021, 291, 116817. [Google Scholar] [CrossRef]
  13. Chen, S.; Liang, Z.; Guo, S.; Li, M. Estimation of High-Resolution Solar Irradiance Data Using Optimized Semi-Empirical Satellite Method and GOES-16 Imagery. Solar Energy 2022, 241, 404–415. [Google Scholar] [CrossRef]
  14. Bódis, K.; Kougias, I.; Jäger-Waldau, A.; Taylor, N.; Szabó, S. A High-Resolution Geospatial Assessment of the Rooftop Solar Photovoltaic Potential in the European Union. Renew. Sustain. Energy Rev. 2019, 114, 109309. [Google Scholar] [CrossRef]
  15. Fakhraian, E.; Forment, M.A.; Dalmau, F.V.; Nameni, A.; Guerrero, M.J.C. Determination of the Urban Rooftop Photovoltaic Potential: A State of the Art. Energy Rep. 2021, 7, 176–185. [Google Scholar] [CrossRef]
  16. Izquierdo, S.; Rodrigues, M.; Fueyo, N. A Method for Estimating the Geographical Distribution of the Available Roof Surface Area for Large-Scale Photovoltaic Energy-Potential Evaluations. Solar Energy 2008, 82, 929–939. [Google Scholar] [CrossRef]
  17. Ordóñez, J.; Jadraque, E.; Alegre, J.; Martínez, G. Analysis of the Photovoltaic Solar Energy Capacity of Residential Rooftops in Andalusia (Spain). Renew. Sustain. Energy Rev. 2010, 14, 2122–2130. [Google Scholar] [CrossRef]
  18. Singh, R.; Banerjee, R. Estimation of Rooftop Solar Photovoltaic Potential of a City. Solar Energy 2015, 115, 589–602. [Google Scholar] [CrossRef]
  19. Huang, Z.; Mendis, T.; Xu, S. Urban Solar Utilization Potential Mapping via Deep Learning Technology: A Case Study of Wuhan, China. Appl. Energy 2019, 250, 283–291. [Google Scholar] [CrossRef]
  20. Jo, J.H.; Otanicar, T.P. A Hierarchical Methodology for the Mesoscale Assessment of Building Integrated Roof Solar Energy Systems. Renew. Energy 2011, 36, 2992–3000. [Google Scholar] [CrossRef]
  21. Zhong, T.; Zhang, Z.; Chen, M.; Zhang, K.; Zhou, Z.; Zhu, R.; Wang, Y.; Lü, G.; Yan, J. A City-Scale Estimation of Rooftop Solar Photovoltaic Potential Based on Deep Learning. Appl. Energy 2021, 298, 117132. [Google Scholar] [CrossRef]
  22. Jiang, H.; Yao, L.; Lu, N.; Qin, J.; Liu, T.; Liu, Y.; Zhou, C. Geospatial Assessment of Rooftop Solar Photovoltaic Potential Using Multi-Source Remote Sensing Data. Energy AI 2022, 10, 100185. [Google Scholar] [CrossRef]
  23. Hong, T.; Lee, M.; Koo, C.; Jeong, K.; Kim, J. Development of a Method for Estimating the Rooftop Solar Photovoltaic (PV) Potential by Analyzing the Available Rooftop Area Using Hillshade Analysis. Appl. Energy 2017, 194, 320–332. [Google Scholar] [CrossRef]
  24. Pinna, A.; Massidda, L. A Procedure for Complete Census Estimation of Rooftop Photovoltaic Potential in Urban Areas. Smart Cities 2020, 3, 873–893. [Google Scholar] [CrossRef]
  25. Romero Rodríguez, L.; Duminil, E.; Sánchez Ramos, J.; Eicker, U. Assessment of the Photovoltaic Potential at Urban Level Based on 3D City Models: A Case Study and New Methodological Approach. Solar Energy 2017, 146, 264–275. [Google Scholar] [CrossRef]
  26. Walch, A.; Castello, R.; Mohajeri, N.; Scartezzini, J.-L. Big Data Mining for the Estimation of Hourly Rooftop Photovoltaic Potential and Its Uncertainty. Appl. Energy 2020, 262, 114404. [Google Scholar] [CrossRef]
  27. Huld, T.; Amillo, A. Estimating PV Module Performance over Large Geographical Regions: The Role of Irradiance, Air Temperature, Wind Speed and Solar Spectrum. Energies 2015, 8, 5159–5181. [Google Scholar] [CrossRef]
  28. Gautam, B.R.; Li, F.; Ru, G. Assessment of Urban Roof Top Solar Photovoltaic Potential to Solve Power Shortage Problem in Nepal. Energy Build. 2015, 86, 735–744. [Google Scholar] [CrossRef]
  29. Mainzer, K.; Fath, K.; Mckenna, R.; Stengel, J.; Fichtner, W.; Schultmann, F. A High-Resolution Determination of the Technical Potential for Residential-Roof-Mounted Photovoltaic Systems in Germany. Solar Energy 2014, 105, 715–731. [Google Scholar] [CrossRef]
  30. Joshi, S.; Mittal, S.; Holloway, P.; Shukla, P.R.; Ó Gallachóir, B.; Glynn, J. High Resolution Global Spatiotemporal Assessment of Rooftop Solar Photovoltaics Potential for Renewable Electricity Generation. Nat. Commun. 2021, 12, 1–15. [Google Scholar] [CrossRef]
  31. Mostafaeipour, A.; Qolipour, M.; Mohammadi, K. Evaluation of Installing Photovoltaic Plants Using a Hybrid Approach for Khuzestan Province, Iran. Renew. Sustain. Energy Rev. 2016, 60, 60–74. [Google Scholar] [CrossRef]
  32. Bakhshi-Jafarabadi, R.; Sadeh, J.; Dehghan, M. Economic Evaluation of Commercial Grid-Connected Photovoltaic Systems in the Middle East Based on Experimental Data: A Case Study in Iran. Sustain. Energy Technol. Assess. 2020, 37, 100581. [Google Scholar] [CrossRef]
  33. Korsavi, S.S.; Zomorodian, Z.S.; Tahsildoost, M. Energy and Economic Performance of Rooftop PV Panels in the Hot and Dry Climate of Iran. J. Clean Prod. 2018, 174, 1204–1214. [Google Scholar] [CrossRef]
  34. Ali Sadat, S.; Vakilalroaya Fini, M.; Hashemi-Dezaki, H.; Nazififard, M. Barrier Analysis of Solar PV Energy Development in the Context of Iran Using Fuzzy AHP-TOPSIS Method. Sustain. Energy Technol. Assess. 2021, 47, 101549. [Google Scholar] [CrossRef]
  35. Aryanfar, A.; Gholami, A.; Pourgholi, M.; Shahroozi, S.; Zandi, M.; Khosravi, A. Multi-Criteria Photovoltaic Potential Assessment Using Fuzzy Logic in Decision-Making: A Case Study of Iran. Sustain. Energy Technol. Assess. 2020, 42, 100877. [Google Scholar] [CrossRef]
  36. Hafeznia, H.; Yousefi, H.; Razi Astaraei, F. A Novel Framework for the Potential Assessment of Utility-Scale Photovoltaic Solar Energy, Application to Eastern Iran. Energy Convers. Manag. 2017, 151, 240–258. [Google Scholar] [CrossRef]
  37. Asakereh, A.; Soleymani, M.; Sheikhdavoodi, M.J. A GIS-Based Fuzzy-AHP Method for the Evaluation of Solar Farms Locations: Case Study in Khuzestan Province, Iran. Solar Energy 2017, 155, 342–353. [Google Scholar] [CrossRef]
  38. Noorollahi, E.; Fadai, D.; Akbarpour Shirazi, M.; Ghodsipour, S. Land Suitability Analysis for Solar Farms Exploitation Using GIS and Fuzzy Analytic Hierarchy Process (FAHP)—A Case Study of Iran. Energies 2016, 9, 643. [Google Scholar] [CrossRef]
  39. Atlas, G.S. Global Solar Atlas 2.0, a Free, Web-Based Application Is Developed and Operated by the Company Solargis Sro on Behalf of TheWorld Bank Group, Utilizing Solargis Data, with Funding Provided by the Energy Sector Management Assistance Program (Esmap). Available online: https://globalsolaratlas.info (accessed on 10 September 2022).
  40. Global Solar Atlas 2.0: Validation Report. Available online: https://documents.worldbank.org/en/publication/documents-reports/documentdetail/507341592893487792/global-solar-atlas-2-0-validation-report (accessed on 17 September 2023).
  41. Bosisio, A.; Berizzi, A.; Morotti, A.; Iannarelli, G.; Greco, B.; Boccaletti, C. A GIS-Based Approach to Assessing Large-Scale Building-Integrated Photovoltaic Generation: A Case Study of Milan, Italy. In Proceedings of the 2022 AEIT International Annual Conference, AEIT 2022, Rome, Italy, 3–5 October 2022. [Google Scholar] [CrossRef]
  42. Tabadkani, A.; Aghasizadeh, S.; Banihashemi, S.; Hajirasouli, A. Courtyard Design Impact on Indoor Thermal Comfort and Utility Costs for Residential Households: Comparative Analysis and Deep-Learning Predictive Model. Front. Archit. Res. 2022, 11, 963–980. [Google Scholar] [CrossRef]
  43. Shayesteh, H.; Steadman, P. Coevolution of Urban Form and Built Form: A New Typomorphological Model for Tehran. Front. Arch. Res. 2015, 42, 1124–1147. [Google Scholar] [CrossRef]
  44. Saeed, A.; Mousa, M.; Salah, M.M.; Zekry, A.; Abouelatta, M.; Shaker, A.; Amer, F.Z.; Mubarak, R.I. Design and Simulation of ETL-Free Perovskite/Si Tandem Cell With 33% Efficiency. WSEAS Trans. Electron. 2022, 13, 137–141. [Google Scholar] [CrossRef]
  45. Elibol, E.; Özmen, Ö.T.; Tutkun, N.; Köysal, O. Outdoor Performance Analysis of Different PV Panel Types. Renew. Sustain. Energy Rev. 2017, 67, 651–661. [Google Scholar] [CrossRef]
  46. Gaglia, A.G.; Lykoudis, S.; Argiriou, A.A.; Balaras, C.A.; Dialynas, E. Energy Efficiency of PV Panels under Real Outdoor Conditions–An Experimental Assessment in Athens, Greece. Renew. Energy 2017, 101, 236–243. [Google Scholar] [CrossRef]
Figure 1. (a) The nominal power capacities of different kinds of power plants in Iran. Fossil fuel-based power plants are in blue and non-fossil fuel-based ones are in green. (b) The distribution of various forms of RES plants in Iran (in MW). Source: Report published by TAVANIR on 18 June 2023.
Energies 16 07111 g001
Figure 2. The overall methodology of this study.
Energies 16 07111 g002
Figure 3. The study area with land parcels.
Energies 16 07111 g003
Figure 4. (a) The GHI layer for Iran. (b) The masked layer for Tehran.
Energies 16 07111 g004
Figure 5. The zonal statistics’ functionality. The cells whose centroids (red squares) fall within the zone marked in the green area are selected (yellow highlight) for statistical analysis, the results of which are stored as the value for the zone.
Energies 16 07111 g005
Table 1. The statistics of the parcel layer.
Land Use CategoryNumber PercentageArea (km2)Percentage
Residential719,42788.97%148.0769.13%
Administration21860.27%11.395.32%
Commercial39,1224.84%16.507.7%
Education39030.48%1.560.73%
Entertainment9900.12%6.653.11%
Industrial77680.96%4.992.33%
Infrastructure45570.56%2.020.94%
Public Services75060.93%4.111.92%
Transportation17480.22%4.592.14%
Other21,3962.65%14.316.68%
Total808,603100%214.19100%
Table 2. The BFR for each category of parcels.
CategoryCBFR
Residential0.55
Industrial0.4
Commercial0.45
Infrastructure0.35
Education0.4
Public services0.4
Entertainment0.4
Transportation0.35
Administration0.4
Other0.45
Table 3. The roof area reduction coefficients for the two roof types.
CoefficientFlatIndustrial
θ 120°
Cd 20.50.8
Cc 30.450.45
Csh 40.450.9
1 roof slope angle; 2 roof devices coefficient; 3 panels covering coefficient; 4 shadowing effect coefficient.
Table 4. The exploitable roof area for each category after applying the reduction ratios.
CategoryArea (m2)CBFRCRRAERA (km2)
Residential148,070,071.460.550.18.14
Industrial11,392,848.360.4 0.1 0.4 + 0.383 0.6 ~ 0.27 1.23
Commercial16,503,993.770.450.10.74
Infrastructure1,561,705.580.350.10.05
Education6,645,727.940.40.10.27
Public services4,988,788.780.40.10.2
Entertainment2,015,453.330.40.10.08
Transportation4,106,075.410.350.10.14
Administration4,591,122.040.40.10.18
Other14,305,9420.450.10.64
Table 5. The exploitable roof area and potential received power for each category of buildings.
CategoryAERA (km2)EPPR (GWh/Year)
Residential8.1415,760.54
Industrial1.232382.41
Commercial0.741437.7
Infrastructure0.05105.79
Education0.27514.48
Public services0.2386.15
Entertainment0.08156
Transportation0.14278.14
Administration0.18355.43
Other0.641246.36
Table 6. Summary of the results obtained.
CategoryParcel Area (km2)AERA (km2) EPV (GWh/Year)Ep (MW)
Residential148.078.142246.821498.87
Industrial11.391.23339.64226.46
Commercial16.500.74204.96136.69
Infrastructure1.560.0515.0810.06
Education6.650.2773.3448.93
Public services4.990.255.0536.73
Entertainment2.020.0822.2414.84
Transportation4.110.1439.6526.45
Administration4.590.1850.6733.8
Other14.310.64177.68118.48
Total214.1911.673225.132151.31
Disclaimer/Publisher’s Note: The statements, opinions and data contained in all publications are solely those of the individual author(s) and contributor(s) and not of MDPI and/or the editor(s). MDPI and/or the editor(s) disclaim responsibility for any injury to people or property resulting from any ideas, methods, instructions or products referred to in the content.

