Article

The Cost to Consumers of Carbon Capture and Storage—A Product Value Chain Analysis

by
Anna Hörbe Emanuelsson
* and
Filip Johnsson
Division of Energy Technology, Chalmers University of Technology, Chalmersplatsen 4, 41296 Gothenburg, Sweden
*
Author to whom correspondence should be addressed.
Energies 2023, 16(20), 7113; https://doi.org/10.3390/en16207113
Submission received: 11 August 2023 / Revised: 19 September 2023 / Accepted: 10 October 2023 / Published: 16 October 2023
(This article belongs to the Section B: Energy and Environment)

Abstract

:
High-cost abatement measures to mitigate greenhouse gas emissions in the basic commodity industry is known to result in substantial increases in the production costs. Consequently, investments in such measures are lagging behind what is required to make deep emission cuts in line with the Paris Agreement. As high-cost abatement measures (such as Carbon Capture and Storage; CCS) are perceived as expensive for the basic commodity producer, this study investigates the impacts down-stream of the product value chain when assuming full cost pass-through (i.e., the cost increase related to basic commodity production is fully passed on down-stream of the product chain to the end-consumer). We investigate the effects on both costs, by means of a techno-economic assessment, and carbon footprints, using a Life Cycle Assessment (LCA), along the product value chain for the case of post-combustion CCS applied to the cement, pulp, Waste-to-Energy (WtE), and refinery industries, towards abating fossil- and process-related emissions and generating negative emissions. Here, we analyse the product value chains that involve cement to a high-speed railway, pulp to a disposable baby diaper, WtE in connection with housing and plastic products, and refineries to different transportation solutions (truck transport and air-freight). The results show that even though the costs for producing basic commodities can increase significantly (200% for cement, 75% for pulp, 230% for heat, and 6–37% for refinery products) when implementing CCS, the increases in prices for end-users are marginal (1% for the railway, 3% for the disposable baby diaper, 1% for the housing, 0.4% for truck transport and 2% for air-freight). Simultaneously, the carbon footprint associated with the end-use may be reduced by up to 36% for the railway, 31% for the diaper, 80% for the housing, and 3–23% for the refinery cases.

1. Introduction

Global carbon dioxide (CO2) emissions need to reach net-zero around mid-century and become net-negative thereafter, in order to comply with the Paris Agreement and restrict global warming to less than 2 °C with reasonable certainty [1]. Negative emissions are needed to compensate for residual greenhouse gas (GHG) emissions in hard-to-abate sectors and to compensate for a likely overshoot in emissions, i.e., net-negative emissions are likely to be required in the second half of the century. Industry accounted for approximately 20% of global GHG emissions in 2019, and is predicted to become one of the sectors with the highest levels of residual emissions [2]. The European Union’s emission cap and trade scheme (EU ETS) includes energy-intensive sectors, such as the cement industry, pulp and paper industry, and oil refineries [3]. However, most industries currently receive substantial amounts of free allocation of emission allowances, which means that currently they do not pay for all their emissions according to the Polluter Pays Principle. Within the fourth trading period (Year 2021–2030) of the EU ETS, the total number of yearly emission allowances is decreased, to pursue the objectives of achieving climate neutrality by Year 2050 and reducing net GHG emissions by 55% by Year 2030 relative to the Year 2005 levels [3]. In addition, within the so-called Fit for 55 initiative, the free allowances will be phased out and replaced by a Carbon Border Adjustment Mechanism (CBAM) and the reduction in yearly allocation of allowances will almost double (yearly reduction of 4.3% compared to 2.2%), with the last emission allowance to be issued in Year 2039. Taken together, it can be expected that allowance prices will increase further from the current (spring of 2023) level of 80–100 €/tCO2.
Depending on the type of industry, different emission mitigation options exist. Many of the options for achieving deep cuts in emissions are costly and require substantial alterations to the processes, which means that several industries are characterised as ‘hard-to-abate’. Applying such measures results in increased production costs, i.e., corresponding to that the cost of the carbon emissions is internalised (see, for example [4,5,6]). The resulting increase in the product selling price can expose industries to increased competition from regions with less-stringent climate policies. However, even though high-cost abatement measures will result in large production cost increases due to increased operational expenditures (OPEX) and annualised capital expenditures (CAPEX), previous studies have shown that the end-consumer may experience only a marginal cost increase. This principle has been shown assuming full cost pass-through for production cost increases, such as an increased carbon tax [7] and for the implementation of high-cost abatement measures, such as Carbon Capture and Storage (CCS) (see, for example, [8,9,10,11]), as is the focus of this work. The costs for implementing CCS in industrial plants differ significantly depending on factors such as emission volumes and CO2 concentrations in the flue gases, availability of excess heat to drive part of the capture process, logistical conditions for transport to CO2 storage sites, and whether CCS is implemented as part of a new-built plant or retrofitted to an existing plant. It is, therefore, important to expand upon previous studies with case studies that represent different product value chains.
Previous studies have focused on the cement, steel, and pulp industries (see, for example, [8,9,10,11]), while in this study, the number of industries is extended further to include cement, pulp, Waste-to-Energy (WtE), and oil refineries, covering a wider range of end-use products. These industries are of interest because all of them are included in the EU ETS (the WtE sector is included in EU ETS in Sweden and Denmark [12]). Furthermore, the cement industry is a well-known hard-to-abate sector due to its inherent process emissions. The oil refineries are likewise hard-to-abate, since they use fossil feedstocks and the site emissions represent a small percentage of the total life-cycle emissions from their products, i.e., the fuels. The chemical pulp industry and WtE sector both have the possibility to deliver negative emissions due to their large biogenic emissions. Negative emissions can be generated by applying CCS at existing large point sources of biogenic CO2 emissions, provided that the biomass feedstock is sourced from a system for which the carbon stock is at least maintained or with a net growth (e.g., a well-developed forest management system). Furthermore, the selected industries are interesting to analyse because they vary significantly with regards to the types of end-uses (i.e., infrastructure/building projects or bulk products) and end-consumers (i.e., governmental or private consumers). The basic commodities are further associated with usage in a variety of down-stream sectors that are in great need of decarbonisation, such as buildings and infrastructure, road transportation and aviation, and housing in cities. Previous studies have focused on either single industries and/or single end-product systems (e.g., [8,9,10,11]). The wide range of industries and end-uses explored in the present work, therefore, offers additional comparisons and promotes generalisability across industries.
We investigate the effects on costs, using a techno-economic assessment, and carbon footprints, using Life Cycle Assessment (LCA), along the product value chain from basic product to end-use of post-combustion CCS applied to the above-mentioned industries, with the goals of abating fossil- and process-related emissions and generating negative emissions. The analysis is carried out for several product value chains: cement to a high-speed railway, pulp to a disposable baby diaper, WtE connected to housing through district heating (DH) and municipal solid waste (MSW) handling, and refineries to different transportation solutions. The overall aim of the work is to illustrate the impacts on consumer costs and emissions of applying CCS as a deep mitigation measure.

2. Methodology

The product value chain, which encompasses attaining the feedstock to end-use, is mapped out, and the production cost of the basic commodity is calculated to analyse how the changes in production cost and selling price, including profit margins, affect the cost of the end-use. In this work, full cost pass-through is assumed, meaning that a cost increase in the basic production process is fully passed on down-stream of the product chain to the end-consumer. This is to illustrate how such a cost increase could affect the consumer price. Emission factors for the basic commodity and its end-use are evaluated to analyse how the total life-cycle emissions can be reduced for the basic commodity and end-use product or service when implementing CCS.
The product value chains are analysed through the following three steps:
  • Quantifying the cost increase through the value chain, assuming full cost pass-through;
  • Quantifying the changes in GHG emissions by determining the emissions factors associated with the basic product and its end-use;
  • Identifying actors in the product value chain that play key roles in enabling the implementation of CCS as a mitigation measure.

2.1. Cost Evaluation

This work considers retrofits of existing production facilities with CCS, and the CAPEX of the plant itself is, therefore, assumed to have been depreciated. The basic commodity plants are assumed to be located in Europe and the CCS plant is Nth of a kind. The CAPEX is expressed as the annualised Total Capital Requirement (TCR), which includes direct costs for components, costs for retrofitting the mill, contingency costs, spare parts costs [1% of the Total Plant Cost (TPC)], start-up cost (3% of TPC), owner’s cost (7% of TPC), working capital, and interest during the construction phase (8%) [13], as depicted in Figure 1. The owner’s cost is covering the costs, for example, for feasibility studies and improving the infrastructure beyond the site boundary, and includes permitting and legal fees. For more detailed information, see [14].
All costs and prices are adjusted using the Chemical Engineering Plant Cost Index (CEPCI) and expressed in €2020. Historically, sectors that are deemed to be at risk of carbon leakage due to international cost competitiveness [15] have received free allocation of emission allowances from the EU ETS cap and trade system. In Phase 4 of the system (2021–2030), these sectors will continue to receive 100% free allocation of emission allowances during the first half of the period [16]. However, the free allocation is planned to be phased out with an increasing rate and be completely phased out by Year 2033 [17]. The CBAM will replace the free allocation as a means to reduce carbon leakage [18]. In this work, a charge on fossil-based emissions of 80 €/tCO2 is applied to compare the effect of a CO2 price similar to the EU-ETS allowance price in Year 2022. However, the reference cases do not include any costs for purchasing emission allowances.
The cost of the commodity, C s , c c o m (€ per functional unit of commodity), with and without CCS for each product p (basic commodity or intermediate product), for each sector s, is evaluated according to Equation (1) [9]:
C s , c c o m = O P E X s , c v a r + O P E X s , c f i x + C A P E X s , c + C s , c d e l i v e r y + C t r a n s p o r t + C t a x
where O P E X s , c v a r is the variable operational expenditures, O P E X s , c f i x is the fixed operational expenditures, T C R s , p is the annualised investment cost, C s , c d e l i v e r y is the delivery cost of the industrial product, C t r a n s p o r t is the transportation and storage cost of CO2, and C t a x is the carbon tax.
C A P E X s , c is calculated according to Equation (2) [5]:
C A P E X s , c = T C R s · i 1 1 + i L
where TCR is the Total Capital Requirement, i is the discount rate (assumed to 8%), and L is the economic life-time (assumed to be 25 years). The TCR of the CCS plant is scaled to the production capacities of the plants used in this work, according to Equation (3) [19]):
T C R j = T C R r e f · P j P r e f n
where TCRj is the TCR of the scaled emission source, TCRref is the TCR of the reference emissions source, Pj is the production capacity of the emission source to which the cost is scaled, Pref is the production capacity of the reference emissions source, and n is an equipment-specific scaling factor (in this study, set to 0.6) [19].

2.2. Emissions Factor Evaluation

Life-cycle emissions are calculated for each basic commodity, intermediate product, and end-use, with and without CCS. The emissions are calculated using attributional Life Cycle Assessment (LCA), as this study has a more business-oriented perspective than a systemic one. The primary objective of this emissions evaluation is to compare the carbon footprints of commodities produced with and without CCS. Moreover, environmental impacts related to new installations of capital goods, i.e., the CCS facilities and related equipment, are excluded from the LCA because they generally have limited impacts on the Global Warming Potential (GWP).
All the industries studied use biogenic feedstocks to some extent, so the origin and handling of the feedstock are of high importance. Biomass used in production is assumed to be produced from forest management systems that at least maintain the carbon stock in the biomass system, such that the biogenic emissions are assumed to be accounted for as zero emissions in this work. Yet, the biogenic emissions are presented in the results, as they show the potential for creating negative emissions (or any other use of the CO2, such as for electrofuel production). Moreover, the net changes in carbon stocks and GHG emissions and removals from forestry activities are reported in the land use, land-use change and forestry (LULUCF) sector according to the Kyoto Protocol [20]. When evaluating the emissions factor of any basic commodity using CCS technologies, captured biogenic emissions are primarily intended to compensate for any residual fossil emissions from the process, and are secondarily intended to be used to create negative emissions. In this work, it is assumed that a commodity can be sold as a climate-positive product, e.g., pulp, when combined with CCS (i.e., Bio-CCS in relation to biogenic emissions). This is simply to ensure that the emissions reductions from CCS follow the cost increases, i.e., added value. As previously explained, negative emissions are in this work assumed to be used primarily to reduce the emissions factor of a product to zero. Thereafter, one could argue that additional negative emissions should be sold on a separate market (e.g., the voluntary carbon market), as carbon dioxide removal (CDR) certificates rather than using them to create climate-positive products. The emissions factor for each basic commodity is evaluated according to GWP100 (thereby including all the relevant GHG emissions), as expressed in Equation (4):
E F c o m m o d i t y = i E i P j · C F
where EFcommodity is the emissions factor for each basic commodity in CO2,eq per F.U. of commodity, Ei is all the production-related emissions, up-stream and direct emissions (including fossil and negative emissions), Pj is the production capacity of the emissions source, and CF is the capacity factor of the basic commodity plant.
The total emissions related to each end-use are then evaluated using the EF values for each basic commodity (calculated as above) or by using emissions factors from the ecoinvent database for other related materials and activities, as in Equation (5):
E t o t = i ( M i · E F i )
where Etot is the total GHG emissions associated with the end-use, Mi is the amount/use of each commodity/material in its respective end-use, and EFi is the emissions factor for each commodity/material (including direct and indirect GHG emissions).
Table 1 shows the functional unit for each basic and intermediate commodity used in this work.

2.3. CCS Configuration and CCS Chain

In this work, a conventional, post-combustion, amine-based CO2 capture process is assumed with a 90% capture rate for the cement plant, pulp mill, WtE plant, and oil refinery. The CCS plant requires heat for regeneration of the solvent, and the amount of heat needed is in this work assumed to be 2.8 GJ/tCO2 captured [5]. The heat for the CCS unit can be supplied either internally if there is availability of excess heat of a sufficiently high temperature or externally through the installation of an additional power plant. For the cement plant, no excess heat is available, and an additional power plant needs to be installed to generate steam for the regeneration of the absorbent. The power plant is assumed to be a natural gas (NG)-fired combined cycle unit, and the additional emissions are co-captured [5]. For the Kraft pulp mill, CCS is applied to two out of three emission sources, the recovery boiler and the lime kiln, resulting in an overall capture rate for the mill of 77.5% [14,21]. Heat for the regeneration step is supplied internally, thereby less electricity is produced and sold to the grid in the pulp CCS case, although the same amount of crude tall oil is produced. The WtE plant is a Combined Heat and Power (CHP) plant in which one-third of the emissions is considered fossil and two-thirds are biogenic. Part of the heat production will be used for the CCS plant, meaning that less heat will be available to sell to the DH network. However, this can be counteracted in part by recovering heat from the reboiler using a heat pump. Therefore, two CCS cases are considered in this work. The change in energy output of the WtE plant and its effect on the DH network are determined using the spreadsheet model developed by Beiron et al. [22]. For the oil refinery, it is assumed that CCS is applied to all the stacks with sufficiently high CO2 concentrations in the flue gases, in line with the work of Biermann et al. [23]. Additional NG must be combusted to supply the heat needed to the reboiler.
The economic life-time of the CCS plant is assumed to be 25 years, with a discount rate of 8% [5,6]. Furthermore, a transportation and storage cost for CO2 in the range of 35–50 €/tCO2 is listed in the literature [24,25], and an average value of 42.5 €/tCO2 is used in this work. It is further assumed that the CO2 is transported by ship at a pressure of 7 bar, which are the conditions commonly cited in the literature [26,27], and at a temperature of −49.1 °C [13]. The assumed cost for conditioning and compressing the CO2 is taken from Deng et al., 2019 [13]. Naturally, depending on the geographical location of the CCS plant, the transportation distance will differ. In this work, the distance from plant to CO2 storage location is assumed to be 2000 km. Several modes of transportation might be needed, e.g., truck, rail transport, pipelines, and shipping. However, in this work, it is assumed that the full distance is covered by shipping.

2.4. Product Value Chains

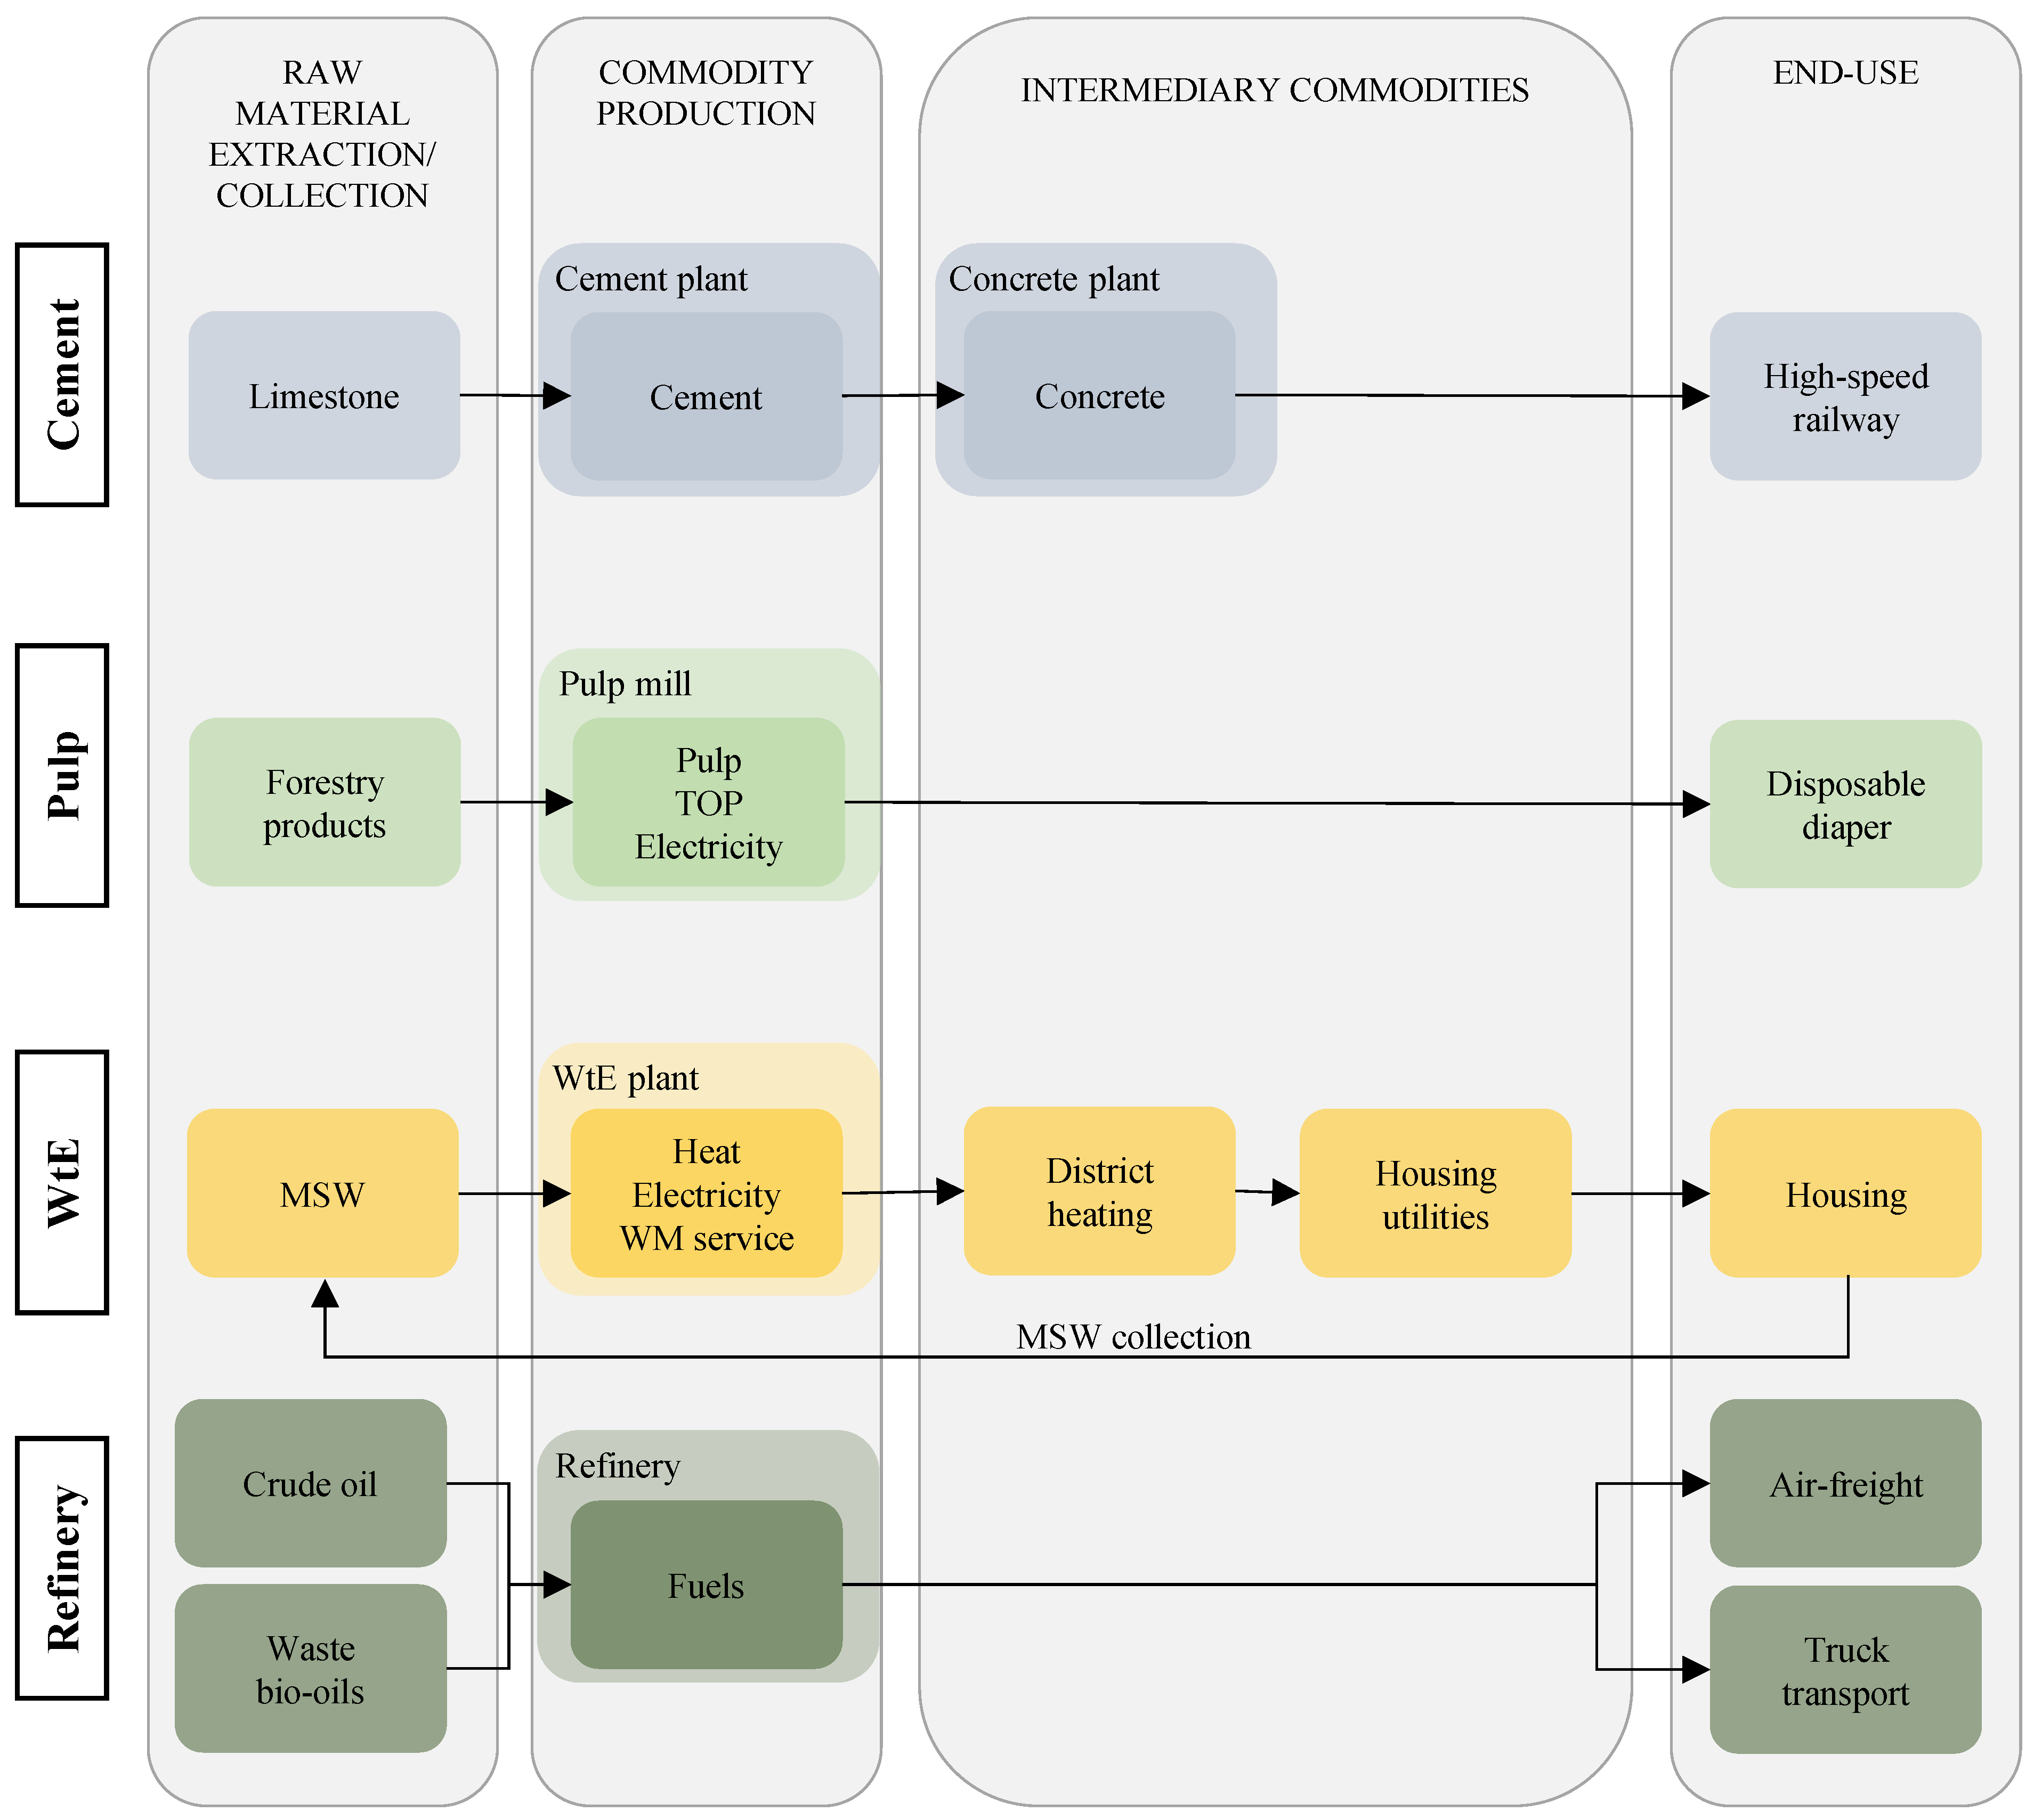
Figure 2 shows the product value chains considered in this work for the four industries. One or several end-uses are analysed for each industry. Different types of end-uses are considered, representing a variety of end-consumers, including government-funded agencies (in this case, the National Transport Administration), companies and private consumers. The end-uses considered for the industries are: (1) cement to high-speed railway; (2) pulp to disposable baby diaper; (3) WtE to housing and plastic products; and (4) refinery to air-freight and truck transportation. The industries studied have different characteristics and systemic functions, where the cement plant is considered a single-output process, the pulp mill and biorefinery are multi-output processes, and the WtE plant is a multi-functional system. In this type of analysis where full cost pass-through is assumed, the additional costs when implementing CCS must be allocated to the services provided by the basic commodity producer, so as to avoid double-charging customers and double-claiming emissions. The method of allocation of costs and emissions for the basic commodity depends on the type of system considered. With a single-output process, all the production costs and emissions related to the process are directly related to the commodity produced. However, with a multi-output process, an allocation problem occurs whereby the costs and emissions need to be divided between the multiple products produced. In this work, allocation on an energy basis is used for the multi-output processes. Moreover, the WtE plant is considered multi-functional, in that three services are provided: the production of heat; production of electricity; and the service of managing waste. Since the services associated with the WtE plant vary greatly in nature, an economic allocation has been applied according to their market values, as specified in Table 2. It should be noted that for some sectors, such as the WtE sector, system expansion and energy substitution are common approaches, since the commodities produced in this sector are using wider systems settings (e.g., electricity and heat) and a change in the WtE sector might result in changes outside of the value chain studied in this work [28]. However, in this work, the reduced heat production in the WtE plant is accounted for in the intermediate production as a smaller heat delivery to the DH network that needs to be compensated by heat delivery from other units. For more detailed information about the product value chains see the Appendix A.
Table 2 provides an overview of the general economic assumptions and basic commodity plant configurations. The selling price of the basic commodity for the reference case is determined by the market prices for each basic commodity on the European market. The selling price of each commodity for the CCS cases are then determined by the difference in production cost compared to the reference case. Further details of the economic parameters, such as raw material prices, are given in Appendix A Table A1. In the following sections, each product value chain and its associated assumptions are described in further detail.

3. Results

Figure 3 shows the relative cost increases and emissions reductions for the four industries and their related case study end-uses. The production cost of the basic commodity increases significantly for all of the studied industries. However, when moving further down the value chain to the end-use, the cost increment is small for all end-uses. Furthermore, the life-cycle emissions associated with the basic commodity are drastically reduced when implementing CCS, thereby also reducing significantly the emissions related to the end-product. Thus, when the cost of implementing CCS is passed on down the value chain to the end-user, CCS gives a small cost increase for a substantial reduction in the life-cycle emissions of the end-products and services. This is largely because the basic commodity represents a large share of the total emissions but only a small fraction of the total value of the end-product.
The refinery to end-use case studies stand out. The largest share of the life-cycle emissions associated with fuel occur in the use phase, while the emissions related to the production of the fuel are rather limited (5% in this case). Implementing CCS at the oil refinery without changing feedstock will obviously have a limited impact on life-cycle emissions reductions (a reduction of 3% in these cases). To achieve deep cuts in the life-cycle emissions of the fuel, the fossil feedstock used in the refinery must be replaced. The use of waste bio-oils in this work can be seen as a first step towards changing the feedstock, and this can reduce the life-cycle emissions by around 20%, as shown in Figure 3. Yet, changing the feedstock is also more costly due to the high purchase cost of such bio-oils. Therefore, the higher relative increase in costs for the bio and bio-CCS cases reflect the increased purchasing prices of bio-oils compared to crude-oil and not the cost associated with the implementation of CCS. Furthermore, aviation is included in the EU ETS, and for comparison the reference case (conventional fossil jet fuel) has been plotted assuming an added cost of emission allowances of 80 €/tCO2. At present, the aviation sector acquires the major share (82%) of their allowances for free [42]. Here, we assume that the free allocations have been phased out, i.e., in line with aim of the Fit for 55 strategy. The 80 €/tCO2 value is arbitrarily chosen; after Year 2030, when there will be a steep reduction in the free allowances, the allowance price may be higher. The 80 €/tCO2 level also makes the reference case more expensive than the bio-CCS case. However, it should be noted that if the share of fossil-derived emissions in the use-phase for the bio-CCS case would have to pay 80 €/tCO2, then this case would still be more expensive than the conventional fuel.
From Figure 3, it can be seen that even though the cost increase linked to implementing CCS is substantial in the basic commodity industry, for most industries it drops rather quickly when considering the impact on the cost of the end-product. This suggests that already an intermediary stakeholder could be an enabler of the transition. For example, in the cement industry, the cost of cement increases by 200%, while the cost of concrete increases by 30%. The concrete producer could, therefore, take up an enabling position. However, it should be noted that even if the cost increment is low for the end-product, it might still be perceived as high by the consumers of intermediary products. For example, even though the cost of housing only increases by 1.2% when implementing CCS in the WtE sector, the price of DH still increases by approximately 9%. Consequently, consumers who consider various heating solutions may find other less-expensive alternatives, such as an individual heat pump in the context of a single-family household. Another issue that is not considered here is the size of the profit margin for the different industries along the value chain. Thus, in the absence of any premium for carbon-neutral or climate-positive products, a large share of the profit margin may be consumed by the implementation of CCS.
Figure 4 shows an overview of the relative cost increases and emissions reductions for the different end-uses explored in this work. As previously stated, most end-uses where the basic commodity represents a significant share of the life-cycle emissions experience a small cost increment, together with a significant reduction in emissions (e.g., railway, diaper, housing, and plastic bag). However, in those cases where the basic commodity represents only a small fraction of the product, such as for the butter package with its content, the emissions reductions associated with that end-use are small. It should also be noted that larger impacts are seen in the air-freight sector compared to the road transportation sector, since aviation fuel is commonly not taxed within the EU and the aviation sector currently receives free allocation of emissions in the EU ETS. In contrast, the fuel used for road transportation is heavily taxed. However, air-freight is a relatively cheap service compared to commercial passenger aviation, meaning that the impact on such an end-product would be smaller.

3.1. Cost Break-Down

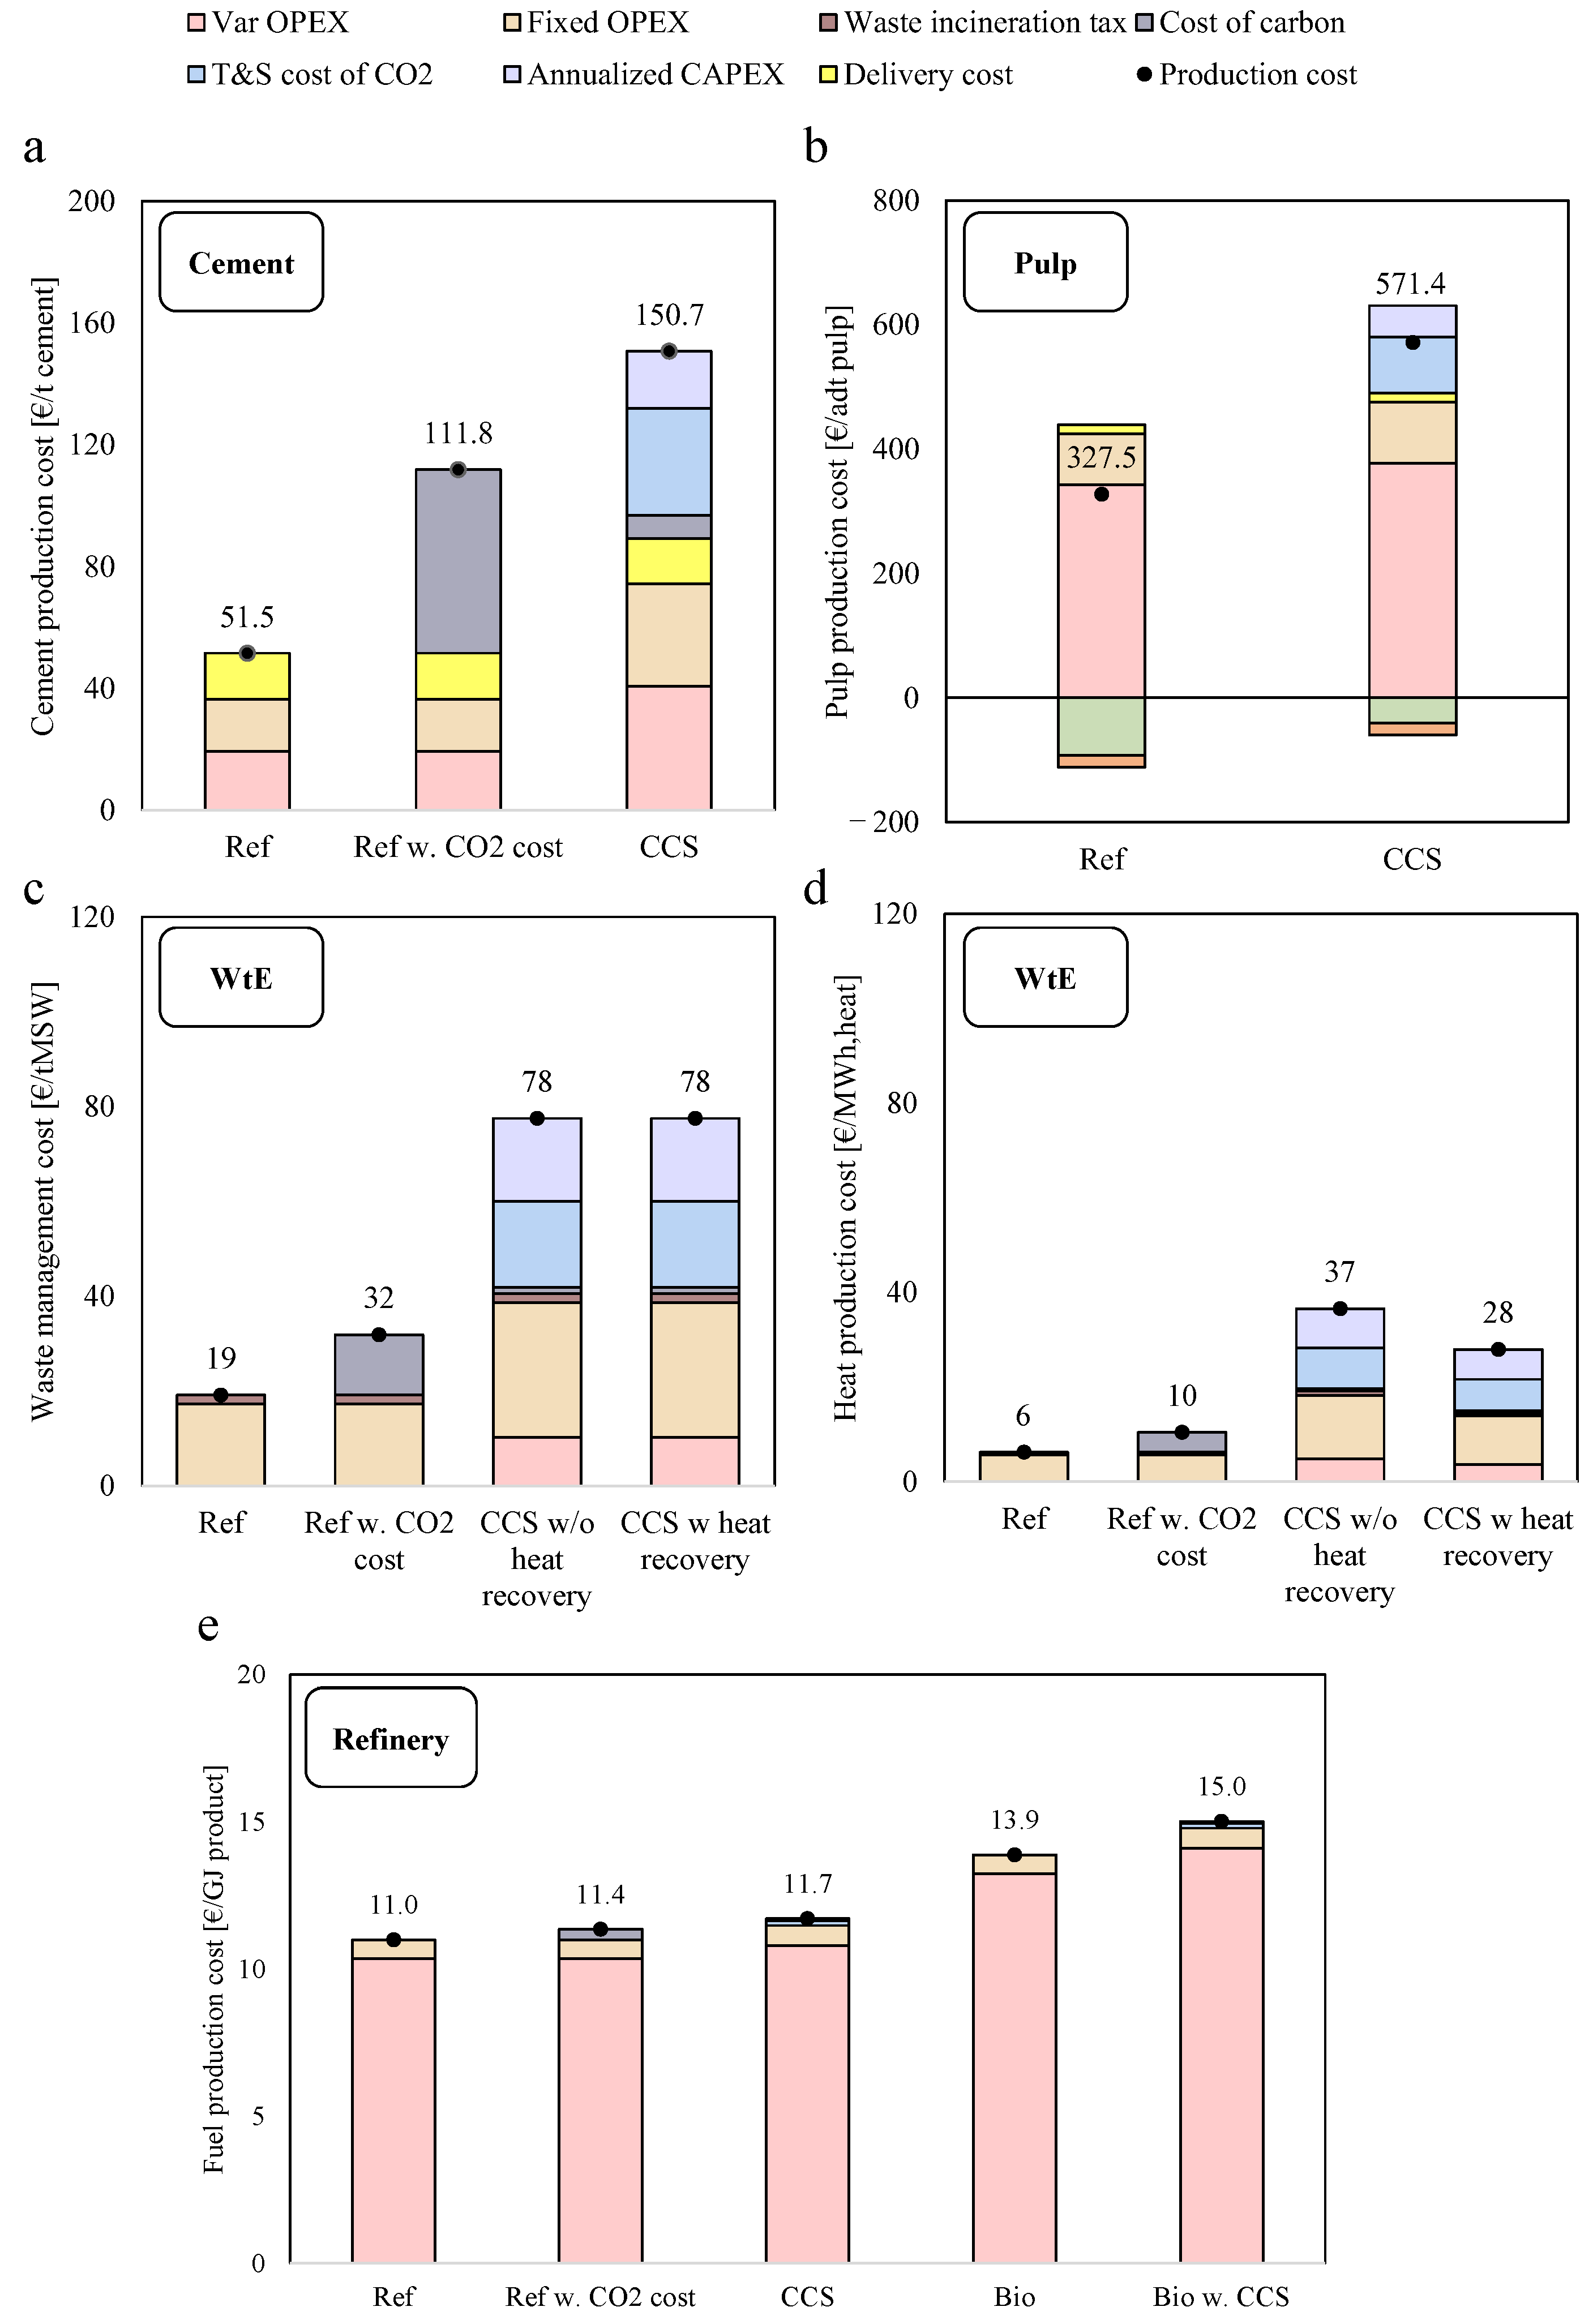
Figure 5 shows the basic commodity production cost break-down per functional unit for the four industries. The implementation of CCS technologies leads to different levels of cost increase, depending on the cost of the reference basic commodity. Notably, industries with inexpensive basic commodities, such as the cement and WtE sectors, experience a relatively significant relative cost increase following CCS implementation (see Figure 3a,c,d and Figure 5a,c,d). In contrast, industries with already elevated production costs, such as the pulp sector, undergo a comparatively lower relative cost increase, despite encountering a similar absolute cost increase (see Figure 3b and Figure 5b). In addition, it is interesting to note which cost components are the dominant contributors to the cost increase resulting from CCS implementation. For all industries, the transportation and storage costs of CO2 constitute a substantial proportion of the cost increase, accompanied by an increase in operating expenditures and annualised capital expenditures. It can also be noted that the CAPEX for the CCS unit in general represents a rather small share of the total cost increase (see Figure 5a–e). The refinery fuel production cost (see Figure 5e) constitutes to a large extent of the costs for the raw material, crude oil, and waste bio-oils. To reduce costs and identify suitable business models, a comprehensive analysis of these distinct cost components is crucial.
This economic analysis results in CO2 capturing costs, excluding the costs for transportation and storage of CO2, for each separate industry according to Table 3.
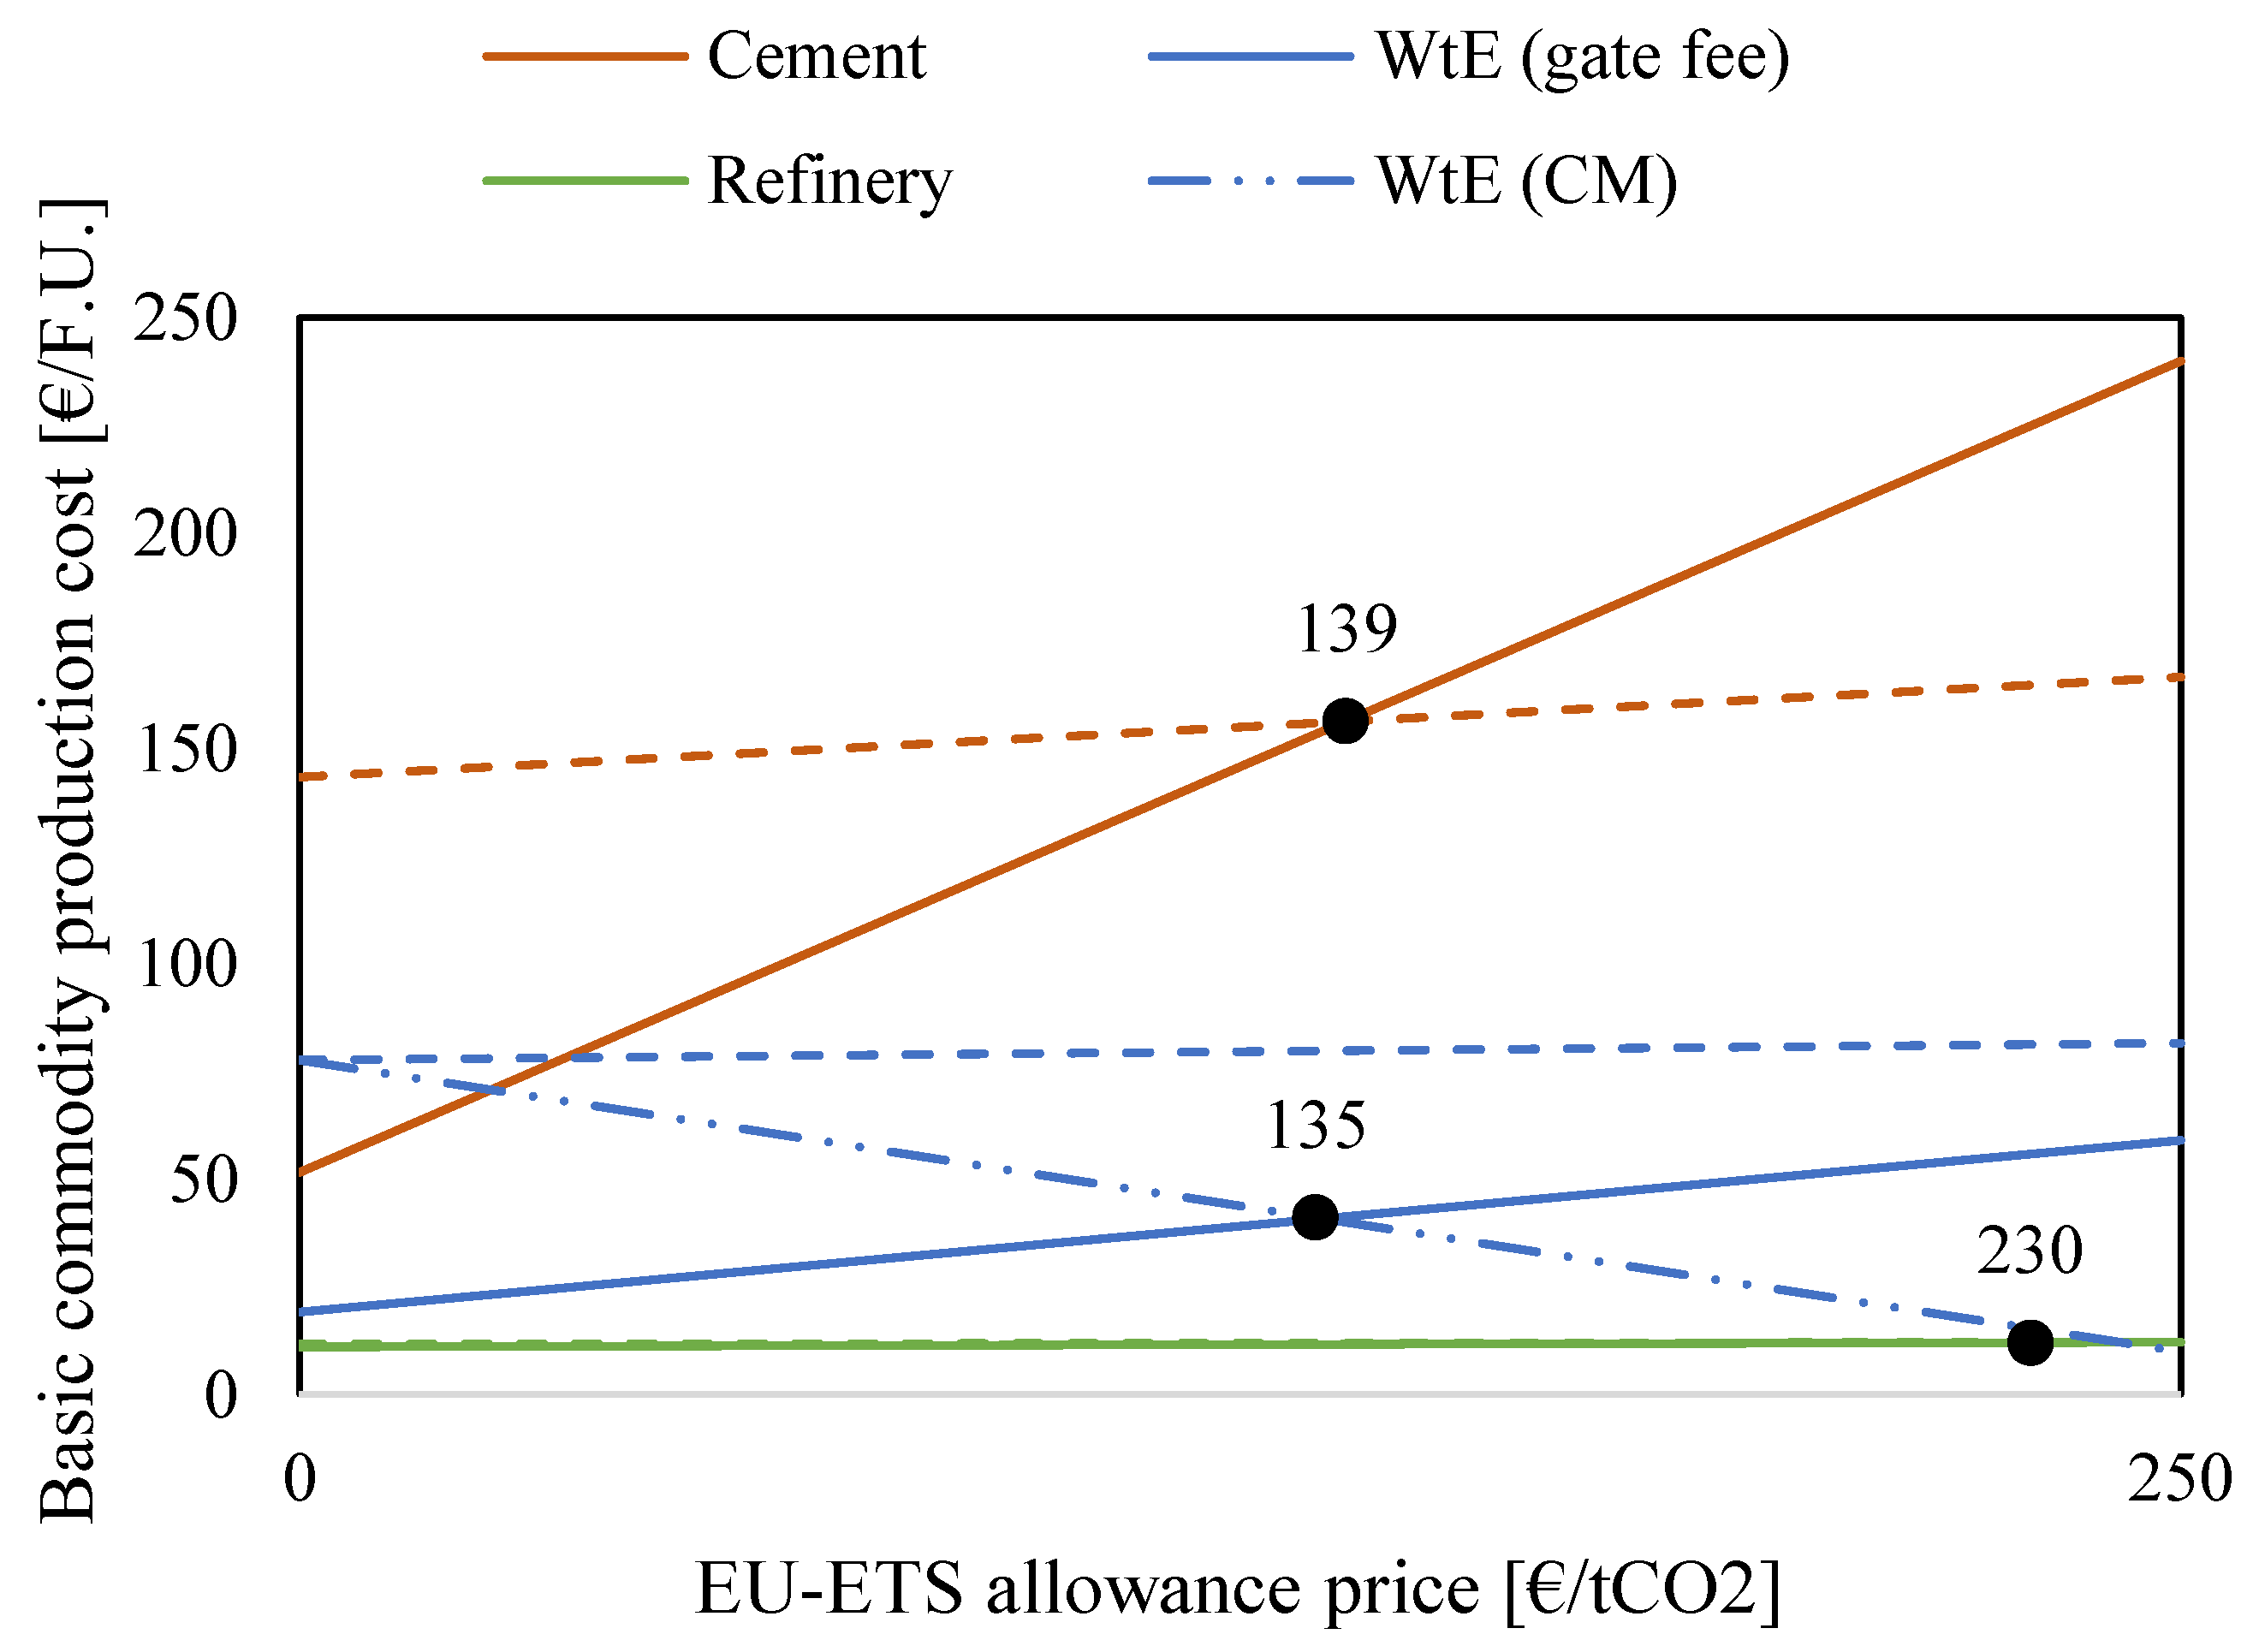
Figure 6 shows an analysis of the break-even EU ETS allowance price for the reference case compared to the CCS case. The analysis shows that at allowance prices of 139 and 230 €/tCO2 CCS become competitive for the cement and the fossil-based refinery sectors, respectively. However, for the WtE sector, only one-third of the emissions are fossil-derived, meaning that a rather high allowance price is needed to break even. Thus, to render this investment economically feasible, the negative emissions (two-thirds of the total emissions) should be sold on a separate carbon market (CM), when such a market is available. Assuming that there is a market for negative-emissions certificates and that these can be sold at a price equal to the allowance price, the CCS case for WtE breaks even at 135 €/tCO2. It seems reasonable to assume that any market or incentives for biogenic CCS would not assign a value to negative emissions that is higher than the cost to emit fossil CO2.

3.2. Life-Cycle Emissions

Table 4 shows the calculated emissions factors for each commodity and end-use for the reference and CCS cases, respectively. The EF column shows the total emissions factor, which is the sum of the fossil emissions and negative emissions, i.e., obtained when CCS is applied to biogenic emissions (as indicated above, the biogenic emissions are regarded as zero emissions when emitted to the atmosphere). For the cement, pulp, and WtE plants, the carbon footprint for the basic commodity is decreased drastically by up to 90% depending on the configuration. This is largely due to the fact that the up-stream emissions associated with extraction of the raw material (limestone, pulpwood, and waste handling) for the basic commodity plant represent a rather small share of the total carbon footprint. However, as mentioned above, the refinery has rather large up-stream emissions associated with crude oil and NG extraction and transportation, which cannot be reduced using CCS, and the carbon footprint associated with the fuel production is, therefore, not reduced significantly. A similar reasoning applies to the plastic products incinerated in the WtE plant (see Appendix A Figure A2). For further details and the life-cycle emissions break-down for each end-use, see Appendix A Figure A1 and Figure A2.

4. Discussion

From the results of the present work as well as previous studies, it is clear that investing in high-abatement measures, such as CCS, has major impacts on basic commodity production costs, whereas the impacts on down-stream costs (as well as price, since we have included certain profit margins, as defined in Table 2) appear to be weak, even though the emissions reduction potential are substantial. This refined and expanded analysis agrees with previous research (see, e.g., [8,9,10,11]). Furthermore, it should be noted that even though the case studies in this work have been applied exclusively to the CCS technology, the methodology used and the outcomes of the analysis are transferable to any kind of high-cost abatement measure that could be implemented in basic commodity industries, for example hydrogen-based steel production. Future work could include other product value chains with different characteristics as well as other industries such as the steel industry.

4.1. Low-Carbon Products and Added Value

Other important aspects are market competition and the extent to which offering low-carbon products will confer a competitive advantage. If the CCS-produced commodity is to be sold at a higher price than a non-CCS-produced commodity, this suggests that it must have some added value. However, if one disregards the production step, the two commodities are identical (having the same properties), so the added value of using CCS is only via emissions reductions. While an added value is typically connected to economic returns, it could also provide ecological and/or social value together with economic value [43]. Added value in the form of emissions reductions could lead to an increased willingness to pay for consumers, meaning that the commodity could be sold at a premium price compared to the conventional product, which would entail higher revenue for the producer.
Moreover, CCS-produced commodities will face market barriers, such as being exposed to competition from non-CCS-produced commodities or being replaced with other types of commodities or other mitigation measures [44]. Examples of this are cement in a building being replaced with wood or lighter construction materials, or DH as a heating solution in a villa being replaced by an individual heat pump. Thus, if there is no possibility to earn a premium for low-carbon products, they may result in losses. Naturally, the magnitude of this market risk depends on the commodity and the existence of alternative solutions, as well as on the development of carbon pricing systems, such as the EU ETS. As a result of the previously mentioned Fit for 55 package with the revision of the EU ETS system, the price of emission allowances is likely to increase which, together with the phase out of free allocations, may result in allowance prices that are well in parity with the cost of CCS.

4.1.1. Profit Margins and Full Cost Pass-Through

Clift et al. have suggested that “the ratio of environmental impact to economic value decreases markedly along the supply chain” [45], meaning that the strongest environmental impact is linked to the commodity production, albeit with only a small added value, while the opposite phenomenon occurs down-stream of the chain where substantial value is added at a lower environmental cost. Consequently, profit margins tend to be smaller in the beginning of the value chain and larger in the later stages. This is closely linked to the assumption of full cost pass-through and the extents to which different industries can transfer costs through the value chain. However, the extent to which this can be accomplished varies between industries and depends on several factors, such as market structure, demand, market power, and competition. For example, a company with greater market power might have greater opportunities to absorb cost shocks and, thus, have the prerequisites for full cost pass-through [46]. In contrast, if the competition is hard, the profit margin of the firm may be low, such that even a small increase in the production cost will have a significant impact on the profit margin. For example, the refinery sector is highly exposed to market risks, and even though the cost increment is low for truck transportation and air-freight, the cost increase at the fuel pump is significantly higher. The prospects for motivating consumers to choose these lower-carbon fuels without any incentives or policy interventions will depend greatly on consumer preferences. Moreover, the fuel production cost for the refineries is highly dependent upon the cost for feedstock materials (e.g., crude oil or waste-oils), and with their profit margin being rather low, there is only a narrow window of opportunity to absorb external costs. This points to the importance of a strong climate policy that incentivises mitigation measures.

4.1.2. Comparison of Industries and Cross-Value Chain Collaboration

Depending on the properties of the basic industries and associated value chains, the possibilities to transform the value chain may differ. These possibilities will reflect the following: the market on which the commodity is traded (nationally or internationally); the identity of the end-consumer (governmental actor or private consumer); and the cost structure of the basic commodity (cheap bulk products will experience an even larger relative cost increment than more-expensive basic commodities). Governmental actors (e.g., national road administrations) often have clearly defined targets in line with governmental climate targets (for example, net-zero emissions by Year 2045 for Sweden) and, thereby, have the opportunity to engage in green public procurement to comply with those targets. Governmental actors might have a greater opportunity to internalise the increase in the cost of the low-carbon commodities to benefit the commons if this contributes to national climate targets. In this manner, the cost of emission reductions is shared among all citizens, since the state pays for the emission reductions by purchasing, for example, low-carbon cement with tax-payer’s money. This deviates from the ‘polluter pays’ principle, whereby the polluter (cement industry) rather than Society (the citizens) should pay for the emissions reductions. However, the pulp industry, for example, might not experience the same benefits, as pulp is an internationally traded product and being a component in a wide variety of bulk consumer products, such as diapers, toilet paper, moving boxes, etc. The pulp industry might, therefore, experience higher market barriers due to competition and would be reliant on the willingness of private consumers to pay for climate-positive products (although the results from the present study show that the cost would increase only marginally). On the other hand, the pulp industry might also be able to use market segments that contain consumers with low price sensitivity (meaning that demand changes to a small degree when the cost of the product increases) and with other customer values, such as valuing decreased climate impact. It is inevitable that the basic commodity producer is the actor taking on the greater risk when investing in high-cost abatement measures. To mitigate some of these risks and to spread the risk across all actors in the value chain, cross-value chain collaboration and long-term agreements will most likely be needed. If the findings from this study were to be applied so that risk could be moved from the basic commodity producer and shared along the value chain, it could encourage adoption of high-cost abatement technologies in major emitting industries. However, there are challenges with reaching full cost passthrough and research is needed to investigate whether this is achievable through voluntary agreements or if policy interventions are needed.

4.2. Policies and Business Models for Negative Emissions

Policy models, such as state guarantees through reversed auctioning, could be used to incentivise and create markets for negative emissions [47]. This type of policy model can be motivated by the fact that producing negative emissions incurs a cost for the emitter who mitigates the biogenic emissions, whereas the benefits are shared by all. Yet, it is reasonable to assume that in the longer run a market for negative emissions should be developed that involves sectors with emissions that are hard to abate, e.g., in the form of quota obligations or voluntary carbon markets (VCM). There is also a need for the EU to introduce some type of CO2 removal credit system [48], so as to comply with the proposed targets for climate neutrality by Year 2050 [49]. VCM could be used by basic commodity producers that are creating negative emissions. Instead of linking the negative emissions to the commodity, they could be sold at the VCM, thereby generating further revenues.

5. Conclusions

This work shows that when the cost for CCS implementation is distributed along the product value chain assuming full cost pass-through it potentially imposes a small cost increase on end-consumers, assuming that the end-product producer can maintain a sufficiently large profit margin. While the cost increases only marginally for the end-user (0.3–3.3%), the related emissions are reduced by up to 36%. The magnitude of the cost increase for the end-product naturally depends on the specific end-use and what share of the cost the basic commodity represents. However, the same trends are seen regardless of the industry or end-use considered in the present work. Naturally, the methodology used and the outcomes of this analysis are transferable to any type of high-cost abatement measure in the basic commodity industry, and are not limited to just CCS. For example, the same methodology could be used for hydrogen-based steel production (which is estimated to be around 15–100% more costly than conventional steel production [50]). Moreover, intermediary actors in the value chain could play key roles as enablers of the transition, due to the significant drop in cost increment that occurs already for these actors.

Author Contributions

Conceptualization, F.J. and A.H.E.; methodology, A.H.E. and F.J.; software, A.H.E.; formal analysis, A.H.E.; investigation, A.H.E.; data curation, A.H.E.; writing—original draft preparation, A.H.E.; writing—review and editing, A.H.E. and F.J.; visualization, A.H.E.; supervision, F.J.; project administration, A.H.E. and F.J.; funding acquisition, F.J. All authors have read and agreed to the published version of the manuscript.

Funding

This project has received funding from the European Union’s Horizon 2020 research and innovation programme under grant agreement no. 101022487 (ACCSESS project).

Data Availability Statement

Publicly available datasets were analyzed in this study.

Conflicts of Interest

The authors declare no conflict of interest. The funders had no role in the design of this study; in the collection, analyses, or interpretation of data; in the writing of the manuscript; or in the decision to publish the results.

Appendix A

Appendix A.1. Commodity Costs and Prices

Table A1 shows the costs and prices for other raw materials that are needed and by-products that are produced during basic commodity production.
Table A1. Other commodity costs and prices for raw materials and by-products in basic commodity production.
CommodityCost/PriceUnitReferences
Cement chain
   Limestone3€/t[9]
Pulp chain
   Round wood40€/m3[6]
   Tall oil pitch500€/t[14]
WtE chain
   Plastic bag b0.67€/bag[51]
   Butter package b2.7€/butter package[52]
Refinery chain
   Crude oil61.4 aUS$/barrel[53]
a Average crude oil price in Year 2019. b Assumed average price on the Swedish market.

Appendix A.2. Cement Chain

Cement production generates both fuel-based and process-based emissions from the calcination process in the lime kiln. The process-based emissions account for approximately two-thirds of the total emissions and occur due to the decomposition of carbonate material that originates from the input raw material, limestone. The cement plant has an assumed production capacity of 1.5 Mt of cement per year. The thermal energy requirement in the cement kiln is assumed to be 3025 MJ per tonne of cement clinker [9]. For further details on the assumed fuel mix, see Table A2.
Table A2. Assumed thermal energy requirement and fuel mix for cement production.
Cement Plant Specifications
   Thermal energy requirement *3025MJ/t cement[9]
Fuel mix
   Coal49% of energy supplied[54]
   Petcoke23% of energy supplied[54]
   Fuel oil1% of energy supplied[54]
   Alternative fuel a15% of energy supplied[54]
   Biomass11% of energy supplied[54]
* In the cement kiln/precalciner. a Assuming 40% biomass-based.
Cement is a bulk product that is commonly used in large infrastructure or building projects. In this work, a high-speed railway is studied as an end-product, with the National Transport Administration as the consumer. Cementitious materials account for approximately 45% of the total cradle-to-gate life-cycle emissions of the railway. The concrete used in the construction is assumed to be ready-mix concrete (RMC), with a cement content of 18 wt%. For details of the specific properties, such as the material composition of the railway, see Table A3. The material composition of the high-speed railway was acquired via personal communication with the Swedish Transport Administration.
Table A3. Assumed material composition (in wt%) of the high-speed railway.
Material CompositionMaterial Used in the RailwayEmissions Factor
Concrete83wt%[55]-tCO2,eq/m3concreteOwn calculations
Steel products *5wt%[55]-tCO2,eq/tsteelecoinvent database
Asphalt4wt%[55]-tCO2,eq/tasphaltecoinvent database
Cement3wt%[55]-tCO2,eq/tcementOwn calculations
Additional limestone2wt%[55]-tCO2,eq/tlimestoneecoinvent database
* Rails, construction steel, and reinforcement steel.

Appendix A.3. Pulp Chain

The Kraft pulp mill has three main point emission sources: the recovery boiler, the lime kiln, and the multi-fuel boiler (also referred to as the ‘power boiler’ or ‘bark boiler’). The pulp mill has an assumed production capacity of 0.8 M air-dried tonne (ADt) pulp per year, with the raw material assumed to be pine and spruce (50%/50%) [14]. In addition to producing pulp, the mill is co-producing crude tall oil and electricity, both of which are sold on the market, thereby generating an income for the mill. As mentioned previously, the biomass used in the mill is assumed to have been produced through forest management that maintains the carbon stock of the forests, meaning that the electricity and heat produced are considered to be carbon-neutral in the reference case.
Pulp is commonly used in bulk private consumer products, and the end-product considered here is a disposable diaper for a baby. Fluff pulp is a major constituent of the diaper, accounting for approximately 32 wt% of the final product. For the specific properties of the diaper, such as the material composition which is taken from [56], see Table A4.
Table A4. Disposable baby diaper material composition and related emissions factors.
Material CompositionMaterial Use per DiaperEmission Factor
Fluff pulp12.7g[56]-kgCO2,eq/kgOwn calculations
Non-wovens9.53g[56]-kgCO2,eq/kgecoinvent database
LDPE film18.8g[56]-kgCO2,eq/kgecoinvent database
Elastics0.02g[56]-kgCO2,eq/kgecoinvent database
SAP15.15g[56]-kgCO2,eq/kgecoinvent database
Adhesive0.95g[56]-kgCO2,eq/kgecoinvent database
LDPE, low-density polyethylene.

Appendix A.4. WtE Chain

Incineration of waste in WtE plants is one way to handle municipal solid waste (MSW), and around 27% of all MSW generated in the EU-27 in Year 2021 was incinerated [57]. CCS is a possible abatement measure to reduce emissions in the WtE sector. However, in this particular sector, it is not straight-forward to define the conditions under which CCS can be regarded as a ‘sustainable’ mitigation measure, since it will continue the linear use of carbon atoms as resources, while there are possibilities for chemical recycling of the waste, which would be more in line with the EU’s Waste Framework Directive [58]. Other technologies, such as thermo-chemical recycling technologies [59], could enable the circular use of carbon atoms within Society. However, since the WtE system is already in place today and CCS is part of the climate road map of the sector according to CEWEP [60], the effects of CCS on WtE are assumed to be of relevance, justifying their exploration in the present work. In addition, even if thermo-chemical recycling is applied, part of the process can involve CO2 capture from future incinerators if these are integrated into the thermo-chemical recycling process.
The WtE plant studied is a CHP plant that provides the following three services: waste management; heat to the DH network; and electricity to the grid (see Figure 2). The incoming waste is of both fossil and biogenic origin, accounting for one-third and two-thirds, respectively, of the total [30], with the fossil-derived fraction largely consisting of plastics. The plant handles 535 kt of MSW yearly.
Two types of end-uses were considered: housing and plastic products (Figure 1). Households use several different utilities, such as heat, electricity, water, and waste management services. The heat demand from housing is in this work assumed to be supplied through DH. Since the households are using several of the services provided by the WtE plant, their monthly living costs are affected in several ways. Since not all the incoming waste originates directly from households, but some also from other municipal waste collection systems, one could consider loading the additional cost of CCS onto the extended producer responsibility. Thus, the producer would include the additional cost of waste handling in the price set for the product. In this work, two plastic products are considered using this principle: a plastic carrier bag and food packaging in the form of a butter package. The plastic carrier bag is composed completely of plastics, while the plastic in the butter package represents a much smaller share of the total product, which also includes the butter itself. For detailed information about the products, see Table A5.
The cost of housing for the reference case is based on the average rental apartment in the Gothenburg region, as obtained from Statistics Sweden [61,62,63].
The utility usages in the household are assumed according to Table A5.
Table A5. Assumptions regarding the housing end-use: utility use per household and year and associated emissions factor per utility.
Housing Utility Use per YearUse per Household and YearEmissions Factor
Waste461.5kg[64]-tCO2,eq/tMSWOwn calculations
Heat9300kWh[65]-tCO2,eq/kWhheatOwn calculations
Electricity6925kWh[66]0.365tCO2,eq/kWhelSwedish Environmental Protection Agency [67]
Water4378m3[66]-tCO2,eq/kgecoinvent database
Table A6 shows the assumed material compositions of the two plastic products (plastic carrier bag and butter package) investigated.
Table A6. Plastic products (plastic bag and butter package): assumptions and compositions.
Composition
Plastic bag [68]
   Plastics (LDPE)
     Weight41.66g
Butter package
   Plastics [69]
     Weight250 (52)g

Appendix A.5. Refinery Chain

A refinery produces multiple products, and in this study, the products are assumed to be fuels for transportation, such as diesel, petrol, and jet fuel. Conventional refineries process a fossil feedstock, i.e., crude oil. The refinery emissions usually account for a small share of the total life-cycle emissions of a fuel. Up-stream emissions related to crude oil and NG extraction are substantial compared to the refinery emissions, as the process has a rather high feedstock-to-product efficiency rate, which in this work is assumed to be 89% [25]. However, the largest share of emissions is related to the combustion of the fuel in the use phase. This fact makes this industry different than the others studied in this work. Since the refinery emissions only account for a small fraction of the total life-cycle emissions, implementing CCS at the refinery will have a weak impact on emissions reductions for the fuel. Therefore, other mitigation measures, such as feedstock switching, must be implemented to have a stronger impact on fuel-related emissions. Currently, the dominant production of biofuels is through the processing of waste bio-oils to produce hydro-treated esters and fatty acids (HEFAs). The availability of waste oils is limited but the HEFA route can also use other feedstocks, such as vegetable oils, although these alternatives may raise sustainability concerns [70]. Waste bio-oils would need to be imported to meet the quantities required by the refining industries, leading to a need to replace the current application of such oils with alternative feedstocks, thus potentially resulting in carbon leakage from one industry to another. Other biorefinery concepts are emerging using other feedstocks that comply with the EU’s definition of advanced biofuels, i.e., feedstocks listed in the EU Renewable Energy Directive [71]. However, in this work, a conventional oil refinery processing a fossil feedstock is used as the reference case, with an additional case that assumes the replacement of 20% of the fossil feedstock with waste bio-oils, in this case Used Cooking Oils (UCO).
The end-uses studied in this work are related to fuel use in the transportation sector. Some parts of the transportation sector are easier to decarbonise than others, such as passenger vehicles using electrification. However, other segments, such as heavy-duty vehicles and aviation, face greater challenges. One way to decarbonise these sectors is through replacing fossil fuels with biofuels. In 2021, the EU proposed a policy whereby jet fuel suppliers need to blend renewable jet fuels with fossil jet fuels [72]. The proposed target is a renewable share of 5% in Year 2030, increasing to 63% in Year 2050. The renewable share is further divided into biofuel and synthetic fuels. HEFA is already used in the aviation sector but currently accounts for only 0.5% of total jet fuel demand [70]. Moreover, due to aviation being operated across national borders and the complexity of such policy measures, the sector has so far been exempt from excise duty [73], although the sector is now included in the EU ETS. Similarly, heavy-duty vehicles, such as trucks and buses, account for more than 6% of EU GHG emissions, and the EU has proposed targets to reduce sector-related emissions by 45% up to Year 2030 and by 90% up to Year 2040, relative to the emissions levels in Year 2019 [74].
Cost structure for the end-uses of air-freight and truck transportation is assumed according to [75]. Up-stream emissions related to crude oil and natural gas extraction and transportation are adapted from [76].

Appendix A.6. Life-Cycle Emissions

In the following section, more detailed results are presented for the life-cycle emissions for intermediary commodities and end-uses.

Appendix A.6.1. Intermediary Commodities

Figure A1 shows the detailed life-cycle emissions for the intermediary commodities of concrete and district heating.
Figure A1. Detailed results regarding the life-cycle emissions for the intermediary commodities of concrete and district heating.
Energies 16 07113 g0a1

Appendix A.6.2. End-Uses

Figure A2 shows a more detailed breakdown of the emissions posts (shown as relative emission reductions) from the LCA results for the end-uses investigated for each industry.
Figure A2. Detailed breakdown of the emissions posts (shown as relative emission reductions) from the LCA results for the end-uses investigated for each industry.
Energies 16 07113 g0a2

References

  1. Intergovernmental Panel on Climate Change. Global Warming of 1.5 °C. Available online: https://www.ipcc.ch/sr15/ (accessed on 10 February 2020).
  2. Buck, H.; Carton, W.; Lund, J.; Markusson, N. Why Residual Emissions Matter Right Now. Nat. Clim. Change 2023, 13, 351–358. [Google Scholar] [CrossRef]
  3. EU Emissions Trading System (EU ETS). Available online: https://climate.ec.europa.eu/eu-action/eu-emissions-trading-sys4tem-eu-ets_en (accessed on 13 April 2023).
  4. IEA Greenhouse Gas R&D Programme (IEA GHG). CO2 Capture in the Cement Industry, 2008/3. July 2008. Available online: https://ieaghg.org/docs/General_Docs/Reports/2008-3.pdf (accessed on 20 January 2023).
  5. IEAGHG. Deployment of CCS in the Cement Industry, 2013/19. December 2013. Available online: https://ieaghg.org/docs/General_Docs/Reports/2013-19.pdf (accessed on 20 January 2023).
  6. Onarheim, K.; Santos, S.; Kangas, P.; Hankalin, V. Performance and cost of CCS in the pulp and paper industry part 2: Economic feasibility of amine-based post-combustion CO2 capture. Int. J. Greenh. Gas Control 2017, 66, 60–75. [Google Scholar] [CrossRef]
  7. Stede, J.; Pauliuk, S.; Hardadi, G.; Neuhoff, K. Carbon Pricing of Basic Materials: Incentives and Risks for the Value Chain and Consumers. SSRN Electron. J. 2021, 189, 107168. [Google Scholar] [CrossRef]
  8. Klement, J.; Rootzén, J.; Normann, F.; Johnsson, F. Supply Chain Driven Commercialisation of Bio Energy Carbon Capture and Storage. Front. Clim. 2021, 3, 615578. [Google Scholar] [CrossRef]
  9. Rootzén, J.; Johnsson, F. Managing the costs of CO2 abatement in the cement industry. Clim. Policy 2017, 17, 781–800. [Google Scholar] [CrossRef]
  10. Rootzén, J.; Johnsson, F. Paying the full price of steel—Perspectives on the cost of reducing carbon dioxide emissions from the steel industry. Energy Policy 2016, 98, 459–469. [Google Scholar] [CrossRef]
  11. Subraveti, S.G.; Rodr, E.; Ram, A.; Roussanaly, S. Is Carbon Capture and Storage (CCS) Really So Expensive? An Analysis of Cascading Costs and CO2 Emissions Reduction of Industrial CCS Implementation on the Construction of a Bridge. Environ. Sci. Technol. 2023, 57, 2595–2601. [Google Scholar] [CrossRef] [PubMed]
  12. Warringa, G.; Waste Incineration under the EU ETS An assessment of Climate Benefits. Zero Wate Eur. 2021. Available online: www.cedelft.eu (accessed on 20 January 2023).
  13. Deng, H.; Roussanaly, S.; Skaugen, G. Techno-economic analyses of CO2 liquefaction: Impact of product pressure and impurities Analyses. Int. J. Refrig. 2019, 103, 301–315. [Google Scholar] [CrossRef]
  14. IEAGHG. Techno-Economic Evaluation of Retrofitting CCS in a Market Pulp Mill and an Integrated Pulp and Board Mill, Report: 2016/10; IEAGHG: Cheltenham, UK, 2016. [Google Scholar]
  15. European Commission. Commission Delegated Decision (EU) 2019/708, supplementing Directive 2003/87/EC of the European Parliament and of the Council concerning the determination of sectors and subsectors deemed at risk of carbon leakage for the period 2021 to 2030. Off. J. Eur. Union 2019, 5, 20–26. [Google Scholar]
  16. Allocation to Industrial Installations. Available online: https://ec.europa.eu/clima/eu-action/eu-emissions-trading-system-eu-ets/free-allocation/allocation-industrial-installations_en (accessed on 14 June 2022).
  17. European Parliament. Climate Change: Deal on a More Ambitious Emissions Trading System (ETS)|News|European Parliament. 2023. Available online: https://www.europarl.europa.eu/news/en/press-room/20221212IPR64527/climate-change-deal-on-a-more-ambitious-emissions-trading-system-ets (accessed on 30 May 2023).
  18. Climact. Is the Eu Ets Proposal Fit For 55%?—An Analysis of the Commision’s Proposal for the EU ETS Revision. January 2022. Available online: https://climact.com/wp-content/uploads/2022/01/Climact-ETS-report-220125.pdf (accessed on 27 April 2023).
  19. Garðarsdóttir, S.Ó.; Normann, F.; Skagestad, R.; Johnsson, F. Investment costs and CO2 reduction potential of carbon capture from industrial plants—A Swedish case study. Int. J. Greenh. Gas Control 2018, 76, 111–124. [Google Scholar] [CrossRef]
  20. UNFCCC. Reporting and Accounting of LULUCF Activities under the Kyoto Protocol|UNFCCC. Available online: https://unfccc.int/topics/land-use/workstreams/lulucf-under-the-kyoto-protocol/reporting-and-accounting-of-lulucf-activities-under-the-kyoto-protocol (accessed on 27 April 2023).
  21. Onarheim, K.; Santos, S.; Kangas, P.; Hankalin, V. Performance and costs of CCS in the pulp and paper industry part 1: Performance of amine-based post-combustion CO2 capture. Int. J. Greenh. Gas Control 2017, 59, 58–73. [Google Scholar] [CrossRef]
  22. Beiron, J.; Normann, F.; Johnsson, F. A techno-economic assessment of CO2 capture in biomass and waste-fired combined heat and power plants—A Swedish case study. Int. J. Greenh. Gas Control 2022, 118, 103684. [Google Scholar] [CrossRef]
  23. Biermann, M.; Langner, C.; Roussanaly, S.; Normann, F.; Harvey, S. The role of energy supply in abatement cost curves for CO2 capture from process industry—A case study of a Swedish refinery Citation for the original published paper (version of record): The role of energy supply in abatement cost curves for CO2 capt. Appl. Energy 2022, 319, 119273. [Google Scholar] [CrossRef]
  24. IOGP. The Potential for CCS and CCU in Europe—Report to the Thirty Second Meeting of the European Gas Regulatory Forum 5–6 June 2019; IOGP: London, UK, 2019. [Google Scholar]
  25. Global CCS Institute. Technology Readiness and Costs of CCS Technology Readiness; Global CCS Institute: Melbourne, Australia, 2021. [Google Scholar]
  26. Knoope, M.M.J.; Ramírez, A.; Faaij, A.P.C. The influence of uncertainty in the development of a CO2 infrastructure network. Appl. Energy 2015, 158, 332–347. [Google Scholar] [CrossRef]
  27. Decarre, S.; Berthiaud, J.; Butin, N.; Guillaume-combecave, J. CO2 maritime transportation. Int. J. Greenh. Gas Control 2010, 4, 857–864. [Google Scholar] [CrossRef]
  28. Astrup, T.F.; Tonini, D.; Turconi, R.; Boldrin, A. Life cycle assessment of thermal Waste-to-Energy technologies: Review and recommendations. Waste Manag. 2015, 37, 104–115. [Google Scholar] [CrossRef]
  29. Roussanaly, S.; Berghout, N.; Fout, T.; Garcia, M.; Gardarsdottir, S.; Nazir, S.M.; Ramirez, A.; Rubin, E.S. Towards improved cost evaluation of Carbon Capture and Storage from industry. Int. J. Greenh. Gas Control 2021, 106, 103263. [Google Scholar] [CrossRef]
  30. Renova. Årsredovisning 2021 Renova Miljö AB. 2021, pp. 1–28. Available online: https://goteborg.se/wps/PA_Pabolagshandlingar/file?id=37526 (accessed on 15 January 2023).
  31. Jafri, Y.; Ahlström, J.M.; Furusjö, E.; Harvey, S.; Pettersson, K.; Svensson, E.; Wetterlund, E. Double Yields and Negative Emissions? Resource, Climate and Cost Efficiencies in Biofuels with Carbon Capture, Storage and Utilization. Front. Energy Res. 2022, 10, 797529. [Google Scholar] [CrossRef]
  32. Ahlström, J.; Jafri, Y.; Wetterlund, E.; Furusjö, E. Sustainable aviation fuels—Options for negative emissions and high carbon efficiency. Int. J. Greenh. Gas Control. 2022, 125, 1–26. [Google Scholar] [CrossRef]
  33. European Commission. Competitiveness of the European Cement and Lime Sectors. 2018, p. 312. Available online: https://www.wifo.ac.at/jart/prj3/wifo/resources/person_dokument/person_dokument.jart?publikationsid=61003&mime_type=application/pdf (accessed on 8 September 2020).
  34. Broberg, T.; Dijkgraaf, E.; Meens-Eriksson, S. Burn or let them bury? The net social cost of producing district heating from imported waste. Energy Econ. 2022, 105, 105713. [Google Scholar] [CrossRef]
  35. Market Data|Nord Pool. Available online: https://www.nordpoolgroup.com/en/Market-data1/Dayahead/Area-Prices/SE/Yearly/?view=table (accessed on 3 May 2023).
  36. Årsmedelspriser Motorbränslen—Svenska Petroleum och Biodrivmedel Institutet. Available online: http://207.154.197.103/statistik/priser/mer-prisstatistik/arsmedelspriser-motorbranslen/ (accessed on 12 April 2023).
  37. Jet Fuel—Monthly Price (Euro per Gallon)—Commodity Prices—Price Charts, Data, and News—IndexMundi. Available online: https://www.indexmundi.com/commodities/?commodity=jet-fuel&months=60&currency=eur (accessed on 12 April 2023).
  38. ETSAP. Oil Refineries. IEA ETSAP—Technol. Br. 2014, 1–11. Available online: https://iea-etsap.org/E-TechDS/PDF/P04_OilRef_KV_Apr2014_GSOK.pdf (accessed on 5 March 2023).
  39. Building Materials and Components Statistics: June 2021—GOV.UK. Available online: https://www.gov.uk/government/statistics/building-materials-and-components-statistics-june-2021 (accessed on 22 June 2022).
  40. Statistics|Eurostat. Available online: https://ec.europa.eu/eurostat/databrowser/view/nrg_pc_205/default/table?lang=en (accessed on 14 June 2022).
  41. Skogsindustrierna. Så Går Det för Skogsindustrin. Skogsindustrierna, Nr 1, 2022-03-09. 2022. Available online: https://www.skogsindustrierna.se/siteassets/dokument/sa-gar-det-for-skogsindustrin/2022/sa_gar_det_for_skogsindustrin_090322.pdf (accessed on 26 May 2023).
  42. Allocation to the Aviation Sector. Available online: https://climate.ec.europa.eu/eu-action/eu-emissions-trading-system-eu-ets/free-allocation/allocation-aviation-sector_en (accessed on 26 May 2023).
  43. Bocken, N.M.P.; Short, S.W.; Rana, P.; Evans, S. A literature and practice review to develop sustainable business model archetypes. J. Clean. Prod. 2014, 65, 42–56. [Google Scholar] [CrossRef]
  44. Löfgren, Å.; Rootzén, J. Brick by brick: Governing industry decarbonization in the face of uncertainty and risk. Environ. Innov. Soc. Transit. 2021, 40, 189–202. [Google Scholar] [CrossRef]
  45. Clift, R.; Wright, L. Relationships Between Environmental Impacts and Added Value Along the Supply Chain. Technol. Forecast. Soc. Change 2000, 65, 281–295. [Google Scholar] [CrossRef]
  46. Neuhoff, K.; Ritz, R.A. Carbon Cost Pass-Through in Industrial Sectors; Cambridge Working Papers in Economics; Energy Policy Research Group, University of Cambridge: Cambridge, UK, 2019. [Google Scholar]
  47. Zetterberg, L.; Johnsson, F.; Möllersten, K. Incentivizing BECCS—A Swedish Case Study. Front. Clim. 2021, 3, 685227. [Google Scholar] [CrossRef]
  48. Rickels, W.; Proelß, A.; Geden, O.; Burhenne, J.; Fridahl, M. Integrating Carbon Dioxide Removal into European Emissions Trading. Front. Clim. 2021, 3, 690023. [Google Scholar] [CrossRef]
  49. 2050 Long-Term Strategy. Available online: https://ec.europa.eu/clima/eu-action/climate-strategies-targets/2050-long-term-strategy_en (accessed on 30 August 2022).
  50. Vogl, V.; Åhman, M.; Nilsson, L.J. Assessment of hydrogen direct reduction for fossil-free steelmaking. J. Clean. Prod. 2018, 203, 736–745. [Google Scholar] [CrossRef]
  51. Romson, Å.; Boberg, N.; Eriksson, F.A.; Herlaar, S.; Sanctuary, M. Svenska MiljöEmissionsData (SMED). Försäljningseffekter av Skatt på Plastpåsar; Sveriges Meteorologiska och Hydrologiska Institut: Norrköping, Sweden, 2022.
  52. SCB. Livsmedelsförsäljningstatistik 2019. Available online: https://www.scb.se/hitta-statistik/statistik-efter-amne/handel-med-varor-och-tjanster/inrikeshandel/livsmedelsforsaljning-fordelad-pa-varugrupper/pong/publikationer/livsmedelsforsaljningsstatistik-2019/ (accessed on 3 February 2023).
  53. World Bank. Commodity Price Data (The Pink Sheet). Available online: https://www.worldbank.org/en/research/commodity-markets (accessed on 9 October 2022).
  54. iRootzén, J.; Johnsson, F. CO2 emissions abatement in the Nordic carbon-intensive industry—An end-game in sight? Energy 2015, 80, 715–730. [Google Scholar] [CrossRef]
  55. Caspersson, J. Trafikverket. Underlagsrapport: Klimat Och Energi. Framtagen i Samband Med Regeringsuppdraget Angående Nya Stambanor för Höghastighetståg 2020/2021. Borlänge, Sweden. 2021. Available online: https://bransch.trafikverket.se/contentassets/60ecb96cb94a4cac994aae8bea032992/18-maj-2021/klimat-och-energi.pdf (accessed on 7 July 2022).
  56. Mendoza, J.M.F.; D’Aponte, F.; Gualtieri, D.; Azapagic, A. Disposable baby diapers: Life cycle costs, eco-efficiency and circular economy. J. Clean. Prod. 2019, 211, 455–467. [Google Scholar] [CrossRef]
  57. Eurostat. Municipal Waste Statistics. Available online: https://ec.europa.eu/eurostat/statistics-explained/index.php?title=Municipal_waste_statistics#cite_note-1 (accessed on 7 July 2022).
  58. Waste Prevention and Management—Environment—European Commission. Available online: https://ec.europa.eu/environment/green-growth/waste-prevention-and-management/index_en.htm (accessed on 14 April 2023).
  59. Vela, I.C.; Vilches, T.B.; Berndes, G.; Johnsson, F.; Thunman, H. Co-recycling of natural and synthetic carbon materials for a sustainable circular economy. J. Clean. Prod. 2022, 365, 132674. [Google Scholar] [CrossRef]
  60. Confederation of European Waste-to-Energy Plants (CEWEP). Waste-to-Energy Climate Roadmap—The Path to Carbon Negative. 2022. Available online: https://www.cewep.eu/wte-climate-roadmap/ (accessed on 3 February 2023).
  61. Genomsnittlig Bostadsarea per Person Efter Region, Hushållstyp Och Boendeform. År 2012—2021. PxWeb. Available online: https://www.statistikdatabasen.scb.se/pxweb/sv/ssd/START__HE__HE0111__HE0111A/HushallT23/ (accessed on 14 March 2023).
  62. Antal Hushåll Och Genomsnittligt Antal Personer per Hushåll efter Region, Boendeform Och Lägenhetstyp (Exklusive Småhus). År 2012—2021. PxWeb. Available online: https://www.statistikdatabasen.scb.se/pxweb/sv/ssd/START__HE__HE0111__HE0111A/HushallT30/ (accessed on 14 March 2023).
  63. Boendeutgift per Hushåll och antal Hushåll efter Region och Upplåtelseform. År 2020–2021. PxWeb. Available online: https://www.statistikdatabasen.scb.se/pxweb/sv/ssd/START__HE__HE0202/HE0202T02N/ (accessed on 14 March 2023).
  64. Naturvårdsverket. Kommunalt Avfall. 2020; pp. 7–8. Available online: https://www.naturvardsverket.se/vagledning-och-stod/avfall/kommunalt-avfall/ (accessed on 3 March 2023).
  65. Energistatistik för Flerbostadshus. Available online: https://www.energimyndigheten.se/statistik/den-officiella-statistiken/statistikprodukter/energistatistik-for-flerbostadshus/ (accessed on 14 March 2023).
  66. Persson, M.L.; Dahlin, H.; Sjöqvist, D.; Ulaner, M.; Wiederholm, J. Nils Holgerssons Underbara Resa Genom Sverige—En Avgiftsstudie för 2021; Mari-Louise Persson, Riksbyggen samt Ordförande i Nils Holgersson-Gruppen: Stockholm, Sweden, 2021. [Google Scholar]
  67. Energiföretagen. Miljövärdering av Fjärrvärme. 2022. Available online: https://www.energiforetagen.se/statistik/fjarrvarmestatistik/miljovardering-av-fjarrvarme/ (accessed on 1 March 2023).
  68. Civancik-uslu, D.; Puig, R.; Hauschild, M.; Fullana-i-palmer, P. Life cycle assessment of carrier bags and development of a littering indicator. Sci. Total Environ. 2019, 685, 621–630. [Google Scholar] [CrossRef] [PubMed]
  69. Kan, M.; Miller, S.A. Environmental impacts of plastic packaging of food products. Resour. Conserv. Recycl. 2022, 180, 106156. [Google Scholar] [CrossRef]
  70. Van Dyk, S.; Saddler, J. Progress in Commercialization of Biojet/Sustainable Aviation Fuels (SAF): Technologies, Potential and Challenges; IEA Bioenergy Technology Collaboration Programme: Paris, France, 2021. [Google Scholar]
  71. EU. Directive (EU) 2018/2001 of the European Parliament and of the Council of 11 December 2018 on the promotion of the use of energy from renewable sources. Off. J. Eur. Union 2018. Available online: https://eur-lex.europa.eu/legal-content/EN/TXT/PDF/?uri=CELEX:32018L2001 (accessed on 7 May 2023).
  72. Proposal for a Regulation of the European Parliament and of the Council on Ensuring a Level Playing Field for Sustainable Air Transport. Available online: https://eur-lex.europa.eu/legal-content/EN/TXT/HTML/?uri=CELEX:52021PC0561 (accessed on 15 March 2023).
  73. Excise Duty on Energy. Available online: https://taxation-customs.ec.europa.eu/taxation-1/excise-duties/excise-duty-energy_en (accessed on 15 March 2023).
  74. European Commission. Reducing CO2 Emissions from Heavy-Duty Vehicles. Available online: https://climate.ec.europa.eu/eu-action/transport-emissions/road-transport-reducing-co2-emissions-vehicles/reducing-co2-emissions-heavy-duty-vehicles_en (accessed on 10 May 2023).
  75. Van der Meulen, S.; Grijspaardt, T.; Mars, W.; van der Geest, W.; Roest-Crollius, A.; Kiel, J. Cost Figures for Freight Transport—Final Report; Netherlands Institute for Transport Policy Analysis (Kim): Zoetermeer, The Netherlands, 2020. [Google Scholar]
  76. Edwards, R.; Larivé, J.-F.; Beziat, J.-C. Well-to-Wheels Analysis of Future Automotive Fuels and Power Trains in the European Context; European Commission Joint Research Centre, Institute for Energy: Washington, DC, USA, 2011. [Google Scholar]
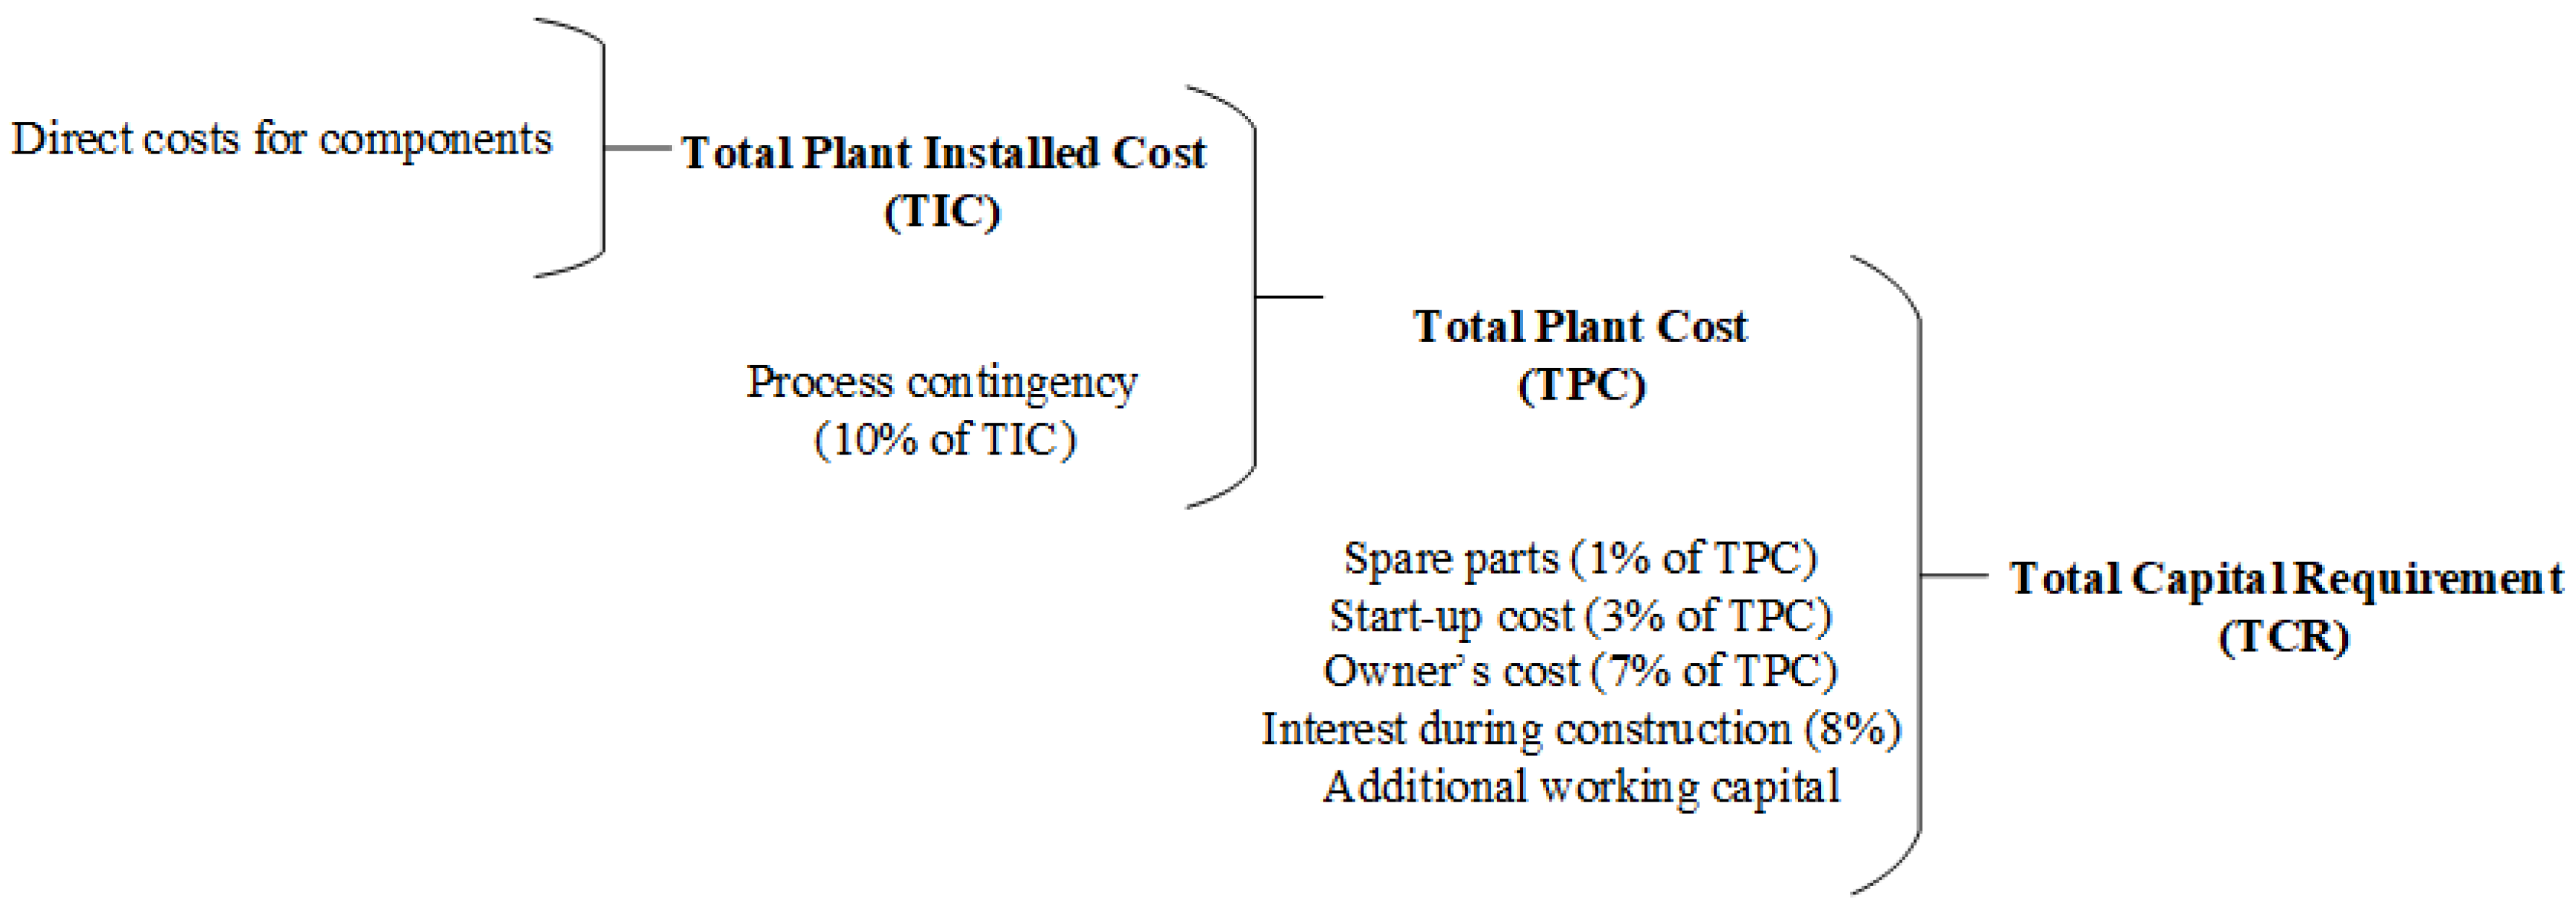
Figure 1. Break-down of total capital requirement cost structure. Adapted from [13].
Energies 16 07113 g001
Figure 2. Product value chains analysed in this work: cement to high-speed railway; pulp to disposable baby diaper; WtE to housing and plastic products; and refinery to air-freight and truck transportation.
Energies 16 07113 g002
Figure 3. Relative cost increments (line graph) and emissions reductions (bar chart) along the value chain for the end-uses studied. ‘Ref w. CO2 cost’ refers to the reference case with an added carbon tax. The emissions reductions are calculated by comparing the emissions factors for CCS-produced commodities with the reference commodity. (a) The cement value chain. (b) The pulp value chain. (c,d) The WtE value chain towards housing and plastic bags, respectively, with “hr” meaning heat recovery. (e,f) The refinery value chains towards truck transport and air-freight, respectively.
Energies 16 07113 g003
Figure 4. Overview of the relative cost increases and GHG emissions reductions for various end-uses.
Energies 16 07113 g004
Figure 5. Break-down of the commodity production costs for: (a) Cement, (b) pulp, (c,d) WtE (waste management cost and heat production cost respectively), (e) refinery.
Energies 16 07113 g005
Figure 6. EU ETS allowance prices for situations in which the commodity production cost is the same for the reference case (whole lines), which pays for allowances, and the CCS case (dashed line). The production cost for WtE is shown for the gate-fee, and WtE (CM) represents the case in which negative emissions are sold on a separate carbon market.
Energies 16 07113 g006
Table 1. Basic industrial commodities and associated functional units.
IndustryCommodityFunctional Unit
CementCement
Concrete
t cement
m3 concrete
PulpPulpADt pulp
WtEHeat
Waste management
MWhheat
t MSW
RefineryFuelGJfuel
MSW, municipal solid waste; ADt, ‘air-dried tonnes’.
Table 2. Overview of the economic assumptions made for the cement plant, Kraft pulp mill, WtE plant, and refinery.
General AssumptionsCement Plant Kraft Pulp MillWtE Plant Refinery
Installed capacity1.5 Mt cement 0.8 MADt pulp0.55 Mt MSW d11.4 Mt crude oil
Average capacity utilisation rate (%)91.3 [29]95.9 [29]97.3 e86.9 [23]
Discount rate (%)8888
Economic life-time (years)25252525
Reference plant and CCS configuration[5][14][22,30][31,32]
Economic Parameters
Delivery cost15 €/t of cement [5]15 €/t of ADt pulp-4.1 €/GJ liquid fuel [31]
Average market price per reference unit64 €2020 per tonne of cement a [33]1099 €2021 per tonne of air-dried market pulp c49.3 € per tMSW f [34]
20.6 € per MWhel [35]
15 € per MWhheat g [22]
19.8 €/GJdiesel i [36]
13.4 €/GJjet fuel [37]
OPEX
Electricity price (€/MWh b)81.9 € b81.9 € b20.6 € h [35]81.9 € b
Natural gas price --
MEA price (€/t)1620162016201620
Fixed OPEX[4][14]6% of TCR[23,38]
a European Commission, 2018. Recalculated to €2020 values using the cement price index [39]. Thus, the profit margin is 12.4 € per tonne of cement (difference between the selling price and production cost). b EU-27 electricity price average in Year 2020 [40]. c Average price on the European market per tonne of bleached softwood market pulp [41]. d Maximum amount allowed to incinerate according to approved environmental permit. e 535 kt MSW incinerated in Year 2021. f Average Swedish gate-fee. g However, the average DH selling price in the Gothenburg region in 2021 was 826 SEK/MWh, including 25% VAT. h Average electricity price in Sweden in Year 2020. i Production cost including revenue. The market price is determined by including distribution costs and taxes. The profit margin is assumed to 0.65 € per GJ of product [38].
Table 3. CO2 capturing costs for the four basic commodity industries, excluding CO2 transportation and storage costs.
IndustryCementPulpWtERefinery
CO2 capture cost excl. transportation and storage77739189€/tCO2
Table 4. Calculated life-cycle emissions for each commodity and case.
CommodityCaseEFBiogenic EmissionsNegative Emissions
CementCementRef
CCS
Ref
CCS
0.75
0.09
0.35
0.08
0.05
0.01
-
-
-
0.05
-
-
tCO2eq/t cement
tCO2eq/t cement
tCO2eq/m3 concrete
tCO2eq/m3 concrete
Concrete
PulpPulpRef
CCS
0.10
−2.0
2.72
0.61
-
2.11
tCO2eq/ADt pulp
tCO2eq/ADt pulp
WtEHeatRef
CCS w. heat recovery
CCS w/o heat recovery
Ref
CCS w. heat recovery
CCS w/o heat recovery
0.05
−0.12
−0.09
0.19
−0.28
−0.28
0.10
0.015
0.011
0.35
0.035
0.035
-
0.13
0.10
-
0.32
0.32
tCO2eq/MWhheat
tCO2eq/MWhheat
tCO2eq/MWhheat
tCO2eq/t MSW
tCO2eq/t MSW
tCO2eq/t MSW
Waste management
RefineryProductsRef
CCS
Bio
Bio-CCS
12.2
9.2
10
7.8
-
-
0.87
0.10
-
-
-
0.77
kgCO2eq/GJproduct
kgCO2eq/GJproduct
kgCO2eq/GJproduct
kgCO2eq/GJproduct
Disclaimer/Publisher’s Note: The statements, opinions and data contained in all publications are solely those of the individual author(s) and contributor(s) and not of MDPI and/or the editor(s). MDPI and/or the editor(s) disclaim responsibility for any injury to people or property resulting from any ideas, methods, instructions or products referred to in the content.