Abstract
To supply stable and high-quality power according to the advancement of industrial growth, electric power companies have performed maintenance of power facilities using various methods. In the case of domestic power distribution facilities, there are limitations in performing diagnostic management on all facilities owing to the large number of facilities; therefore, old facilities are managed using the health index assessment method. The health index assessment comprises only facility operation data and external environmental data and is managed only for four types of distribution facilities including overhead/underground transformers and switchgears. In the case of high voltage overhead lines, there are a large number of wires such as transformers and switchgears connected to the lines, and the ripple effect of power outages is large. However, in Korea, there is no overhead line health index standard. In overseas cases, a health index for overhead lines was developed, but only the material characteristics and surrounding environment of the overhead lines were considered and economic feasibility was not considered. Therefore, in this paper, we developed a health index evaluation methodology for ultra-high voltage overhead lines that considers economic feasibility. In this paper, unlike the existing health index evaluation method that uses only operational data and external environmental data to determine facility performance evaluation and aging replacement standards, we developed an economic health index evaluation methodology that additionally considers failure probability and risk costs. Using the health index assessment methodology developed in this paper, it is possible to expect a reduction in facility operating costs and investment costs from the perspective of the electric power companies through the replacement of old extra-high voltage overhead cables. In addition, from the perspective of consumers, it is expected to increase power reliability and reduce the ripple effect of failure by preferentially replacing equipment with a high probability of failure.
1. Introduction
As economic growth develops, consumers continue to demand a stable and high-quality power supply, and power companies continuously develop and maintain power facilities to meet this demand. Thus, the failure of power facilities causes enormous economic losses to the consumers and the power companies. For this reason, the power companies manage the power facilities in various ways, and power facility management technologies have been developed accordingly. Conventional power facilities depend on a time-based maintenance (TBM) method with regular cycles before exhausting the life of the facility [1]. In introducing the TBM management method, the life of the power facility must be predicted through an experimental life evaluation. Accordingly, the overall lifespan of the power facilities is predicted through a life evaluation based on accelerated tests, and the TBM management method is accordingly operated.
Since the 1990s, condition-based maintenance (CBM) methods have been applied to monitor the conditions of the facilities online by attaching a sensor to the power facility, optimizing maintenance according to the abnormal signs of the facility and predicting the facility’s life. As the CBM method is applied, methods for predicting the life of the power facilities have become more diverse. However, these have certain limitations, such as limitations in sensing technologies and expensive diagnostic systems. Thus, most countries use the health index to predict the state of power facilities. The health index expresses the overall state of the power facilities as an indicator to establish a strategy for replacing the power facilities. The health index defined in the Council on Large Electric Systems (CIGRE) technical document is shown in Table 1 [2,3,4].

Table 1.
Defining the CIGRE health index.
The criteria for evaluating and weighting the health index may vary depending on the physical characteristics of the equipment or the surrounding environment. For example, Kinetrics uses a weighted sum method to calculate the health index of power transformers. The health index is calculated using data such as Dissolved Gas Analysis (DGA), the power factor, and the load factor. Equation (1) is used by Kinetrics to calculate the HI score and Table 2 shows the evaluation items and weights used by Kinetrics [5].
Table 2.
Health Index Features of Kinetrics.
In case the ,
Many countries use the CBM (condition-based maintenance) to evaluate the health index of overhead lines, but none of these methods consider costs. In [6], they evaluate the health index of transmission lines by considering the visual inspection status of the poles, the condition of the insulators, and the ground resistance. In [7], they evaluate the lines in a similar way to [6], but also consider the surrounding environment where the lines are installed. In [8], they evaluate the condition by reflecting the material condition of the lines in more detail than in [6,7]. The health index is evaluated by considering the distance from the beach to the lines, the pollution level of the surrounding air, and the diameter of the lines.
In the case of distribution facilities in Korea, the old facilities are being replaced through the power distribution facility diagnosis and the health index assessment to increase the efficiency of the facility operation and minimize the damage to power companies and consumers. Recently, considering the probability of failure of devices and the complex impact on systems, the environment, and the safety of workers, research has been conducted on the Risk-Based Maintenance (RBM) method, which is a maintenance direction that can meet the preferences of the facility operators and managers [9]. The RBM method determines the priority of facility replacement based on the risk factors affecting a facility. Risk assessment is quantitatively derived by calculating the interaction between the probability of power facility failure and the ripple effect that ensues when failure occurs, where the facility operator analyzes and evaluates a case using calculated risks to establish replacement priorities [10]. Although many research institutes and papers have applied or studied the asset management of power equipment using the RBM method, most of them were only for transmission and transformation power facilities [11,12]. In contrast, the power distribution facilities lack sufficient diagnostic failure data for asset management using the RBM method, and failure data are insufficient because the facilities are demolished as a preventive measure before a failure occurs. Therefore, the RBM method is hard to apply to the power distribution facilities. In addition, as the risk cost calculation used in RBM is determined by policy decision-making, the health index and diagnosis results are mainly used in the asset management of the distribution facilities in Korea. Therefore, in this paper, we propose a new risk-based health index assessment method that applies the facility risk costs to the health index assessment as a quantitative concept.
2. Health Index in Korea
2.1. Power Facility Operation Environments
For domestic power facilities, the health index assessment based on preventive diagnosis is mainly used. In Korea, as the main purpose is to provide high-quality power stably, the high reliability of the power systems is maintained through advance replacement before an equipment failure occurs [13]. Because the transmission and substation facilities have large power facilities, few facilities, and a large ripple effect due to facility failures, periodic preventive diagnosis is performed on all facilities, and breakdowns are prevented through 24 h monitoring by attaching diagnostic sensors [14]. However, as shown in Table 3, performing activities such as patrols and inspections on all power distribution facilities is difficult because the power distribution facilities are numerous but small in size and many facilities are exposed to the outside environment. Thus, attaching diagnostic sensors to and the monitoring of power distribution facilities are impossible. Therefore, the health index assessment for the major power distribution facilities has been introduced and operated to prevent the failure of the power distribution facilities.
Table 3.
Power distribution facility quantity.
2.2. Health Index Standards
The health index assessment is currently applied only to the management of the power distribution facilities and is introduced and operated only for a total of four facility types: overhead transformers, overhead switchgears, underground switchgears, and transformers. Although the health index assessment items for each facility are different, all of the four types are composed of a perfect score of 100. Meanwhile, a score of 81 or higher is considered a very poor grade, thus requiring replacement. The criteria for the health index assessment for each facility are evaluated using the items of operation data and external environmental data, as shown in Table 4.
Table 4.
Evaluation items for the health index of power distribution facilities.
The Korea Electric Power Corporation (KEPCO) has established and is operating its own standards for old replacements through the health index assessment. According to an analysis of the ratio of old replacements using the health index assessment among power distribution facilities removed by KEPCO over the past 10 years, about 30% of the power distribution facilities were replaced through the health index assessment. Table 5 shows the demolition rate of the overhead transformers according to the reasons for demolition from January 2013 to December 2022 [15].
Table 5.
Ratio of overhead transformer demolition according to the reason for demolition.
2.3. Difficulties and Solutions in the Health Index Evaluation of Distribution Facilities
A domestic health index assessment is evaluated using external environment data and operational data. However, there is a limit to securing diagnostic data, and there is a tendency for the old replacement quantity to be excessively calculated because the economic feasibility is not considered. If the allocated replacement budget is insufficient, the old facilities may not be replaced. In addition, because the health index assessment is performed only for the overhead and ground switchgear/transformers among the various power distribution facilities, there are no standards for the health index assessment for the overhead lines, which account for a large number of power distribution facilities, and the equipment is instead replaced after an operator’s visual inspection and regular inspection once every 4 years. The overhead lines are among the power distribution facilities installed in the external environments, yet, there is still no standard for the health index assessment for the overhead lines despite the high risk of accidents due to the corrosion and deterioration caused by the external operating environment.
In this study, we present a methodology for the health index evaluations to determine the criteria for replacing aging extra-high-voltage overhead lines. This methodology can evaluate the overall conditions by reflecting the operational data, the external environmental conditions, and the economic evaluation items, which can be used as health index assessment items to evaluate the performance of the overhead lines. In addition, the existing section-weighted summation methodology is disadvantageous given that the health index assessment score differs greatly depending on the difference in Section 1. Therefore, in this study, we propose a methodology for the health index assessments based on a linear equation rather than a stepwise weighted summation format.
3. Proposed Method
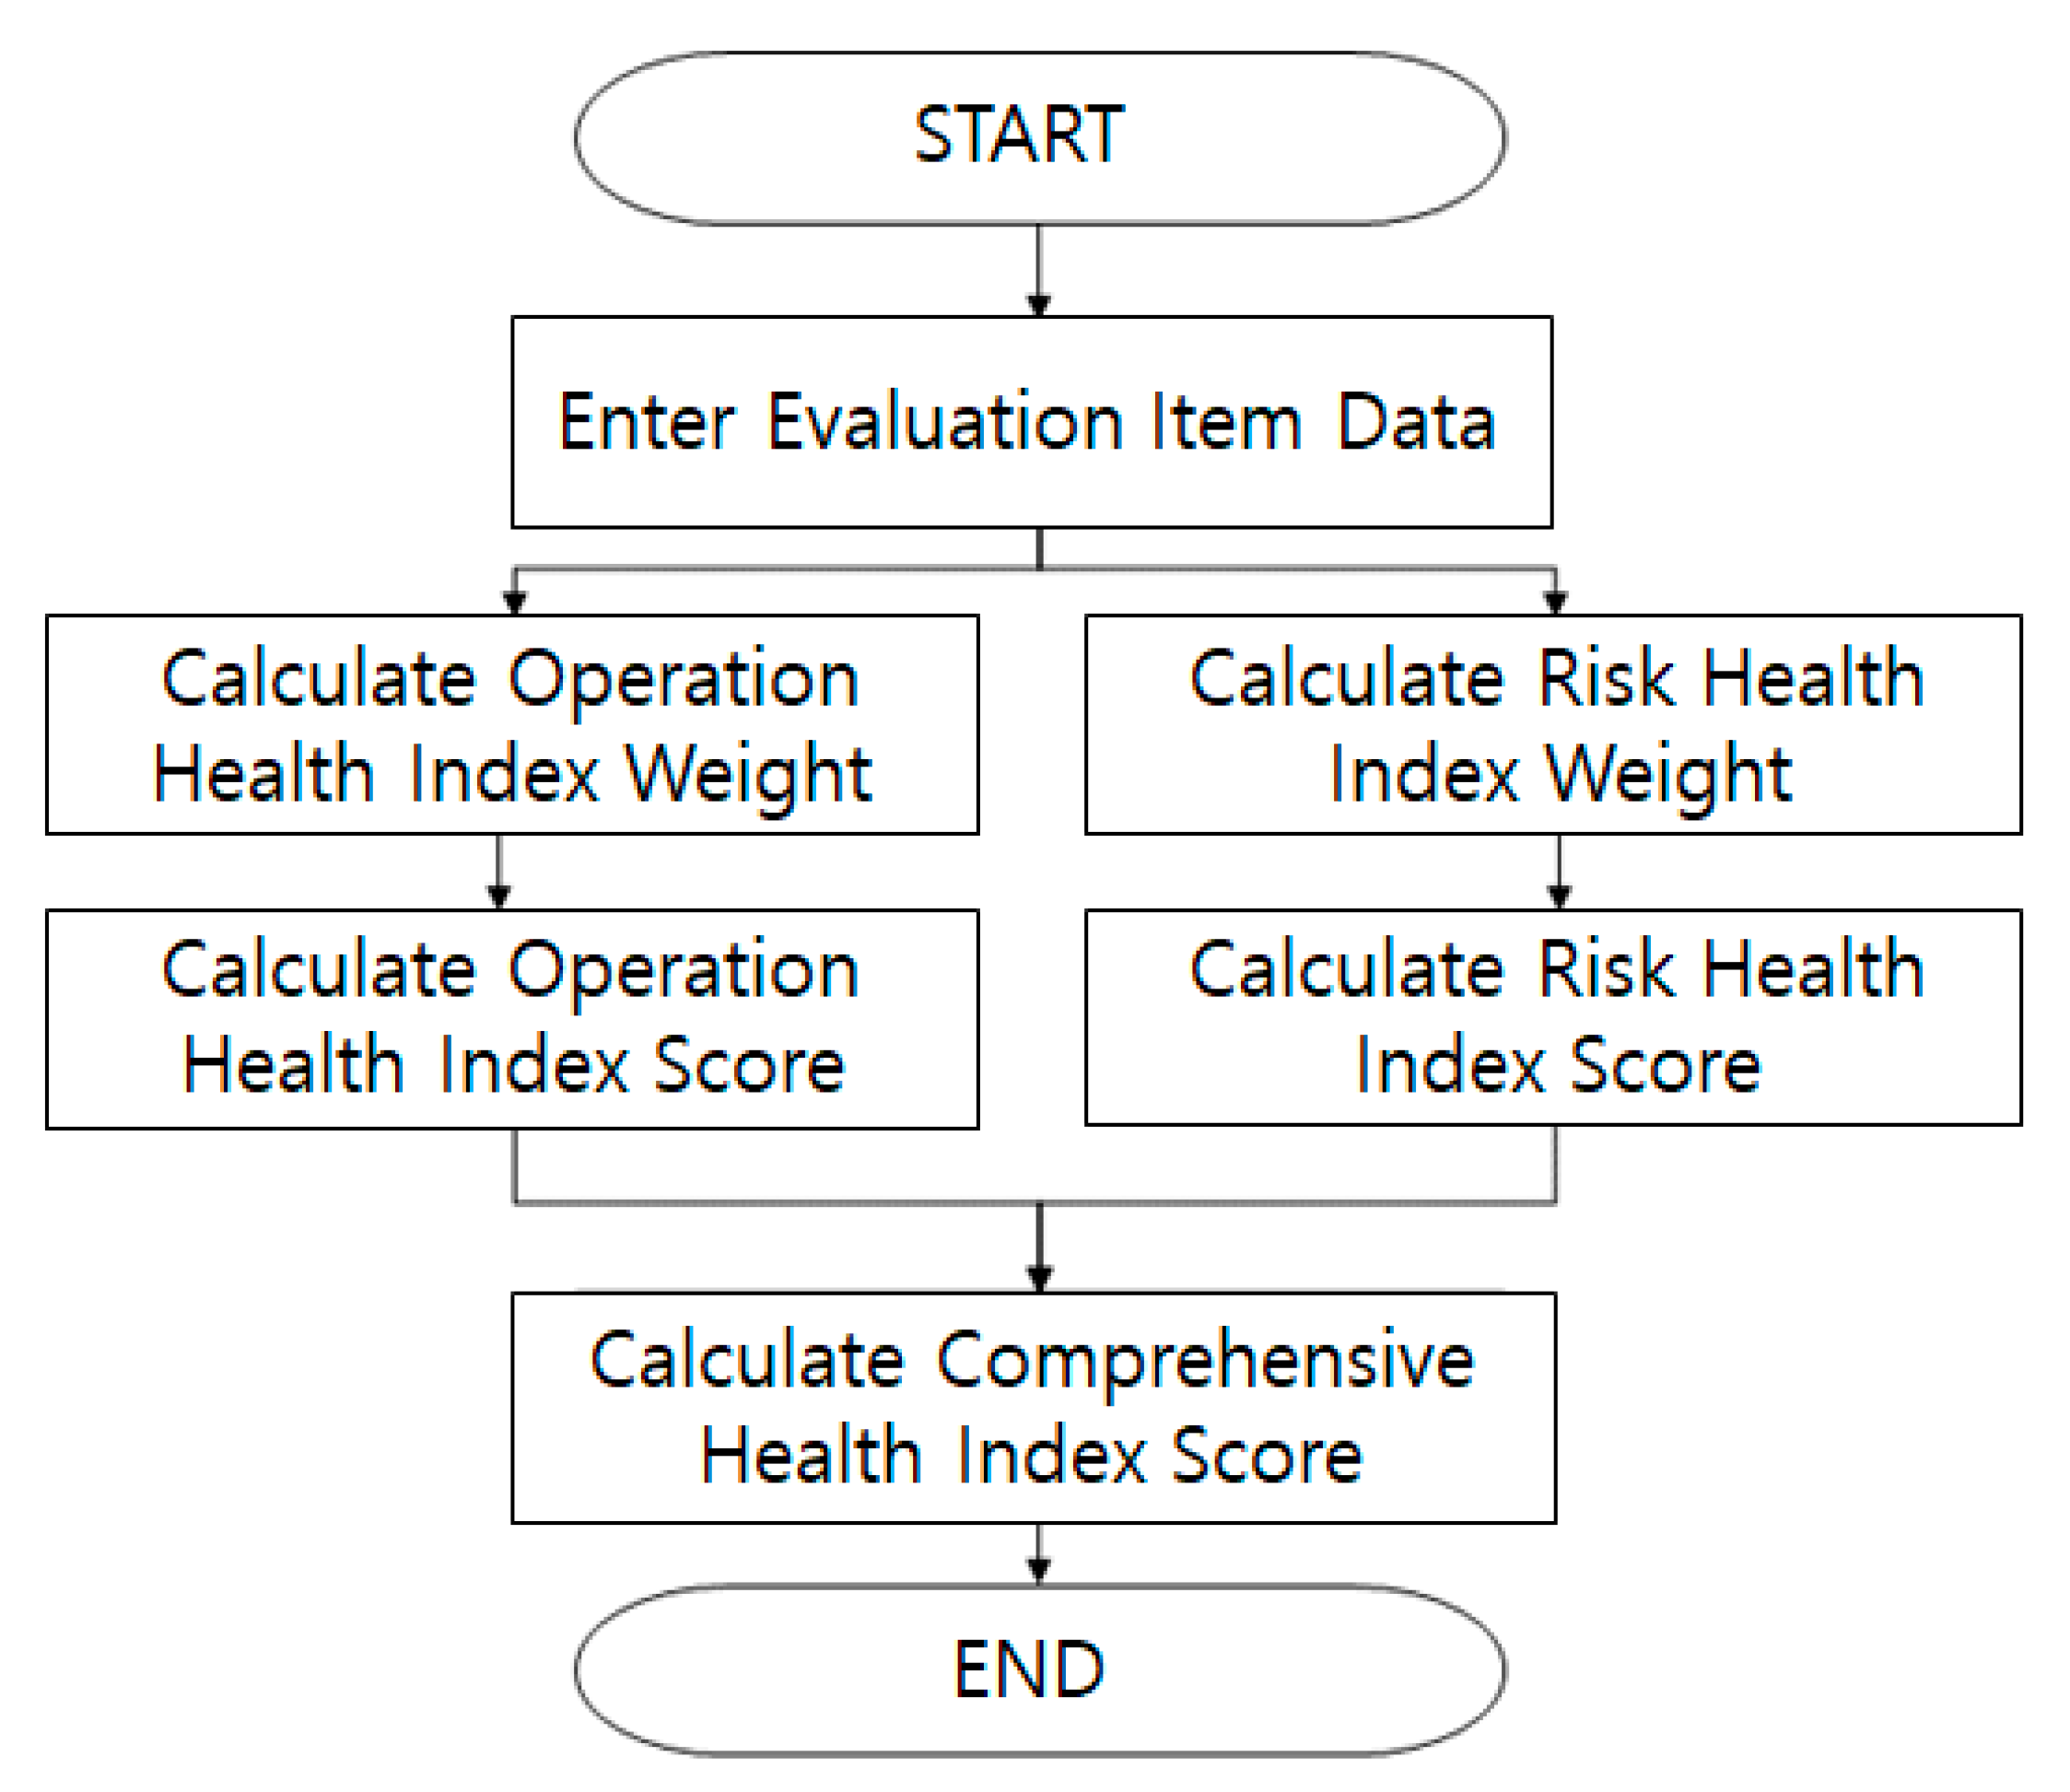
Figure 1 shows the health index assessment method proposed in this paper. Herein, the operation health and the risk health cost are calculated to determine the overall health score.
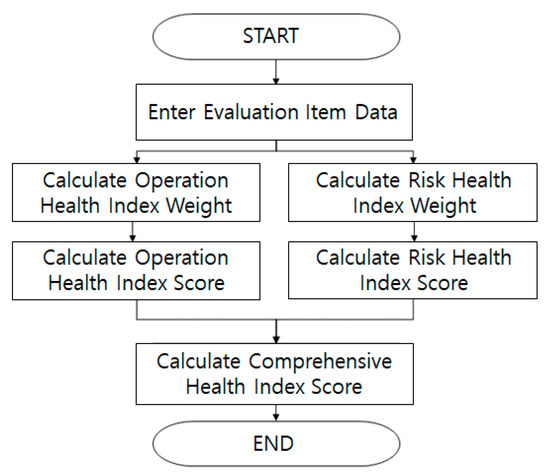
Figure 1.
The health index assessment method.
3.1. Operation Health Index Weight
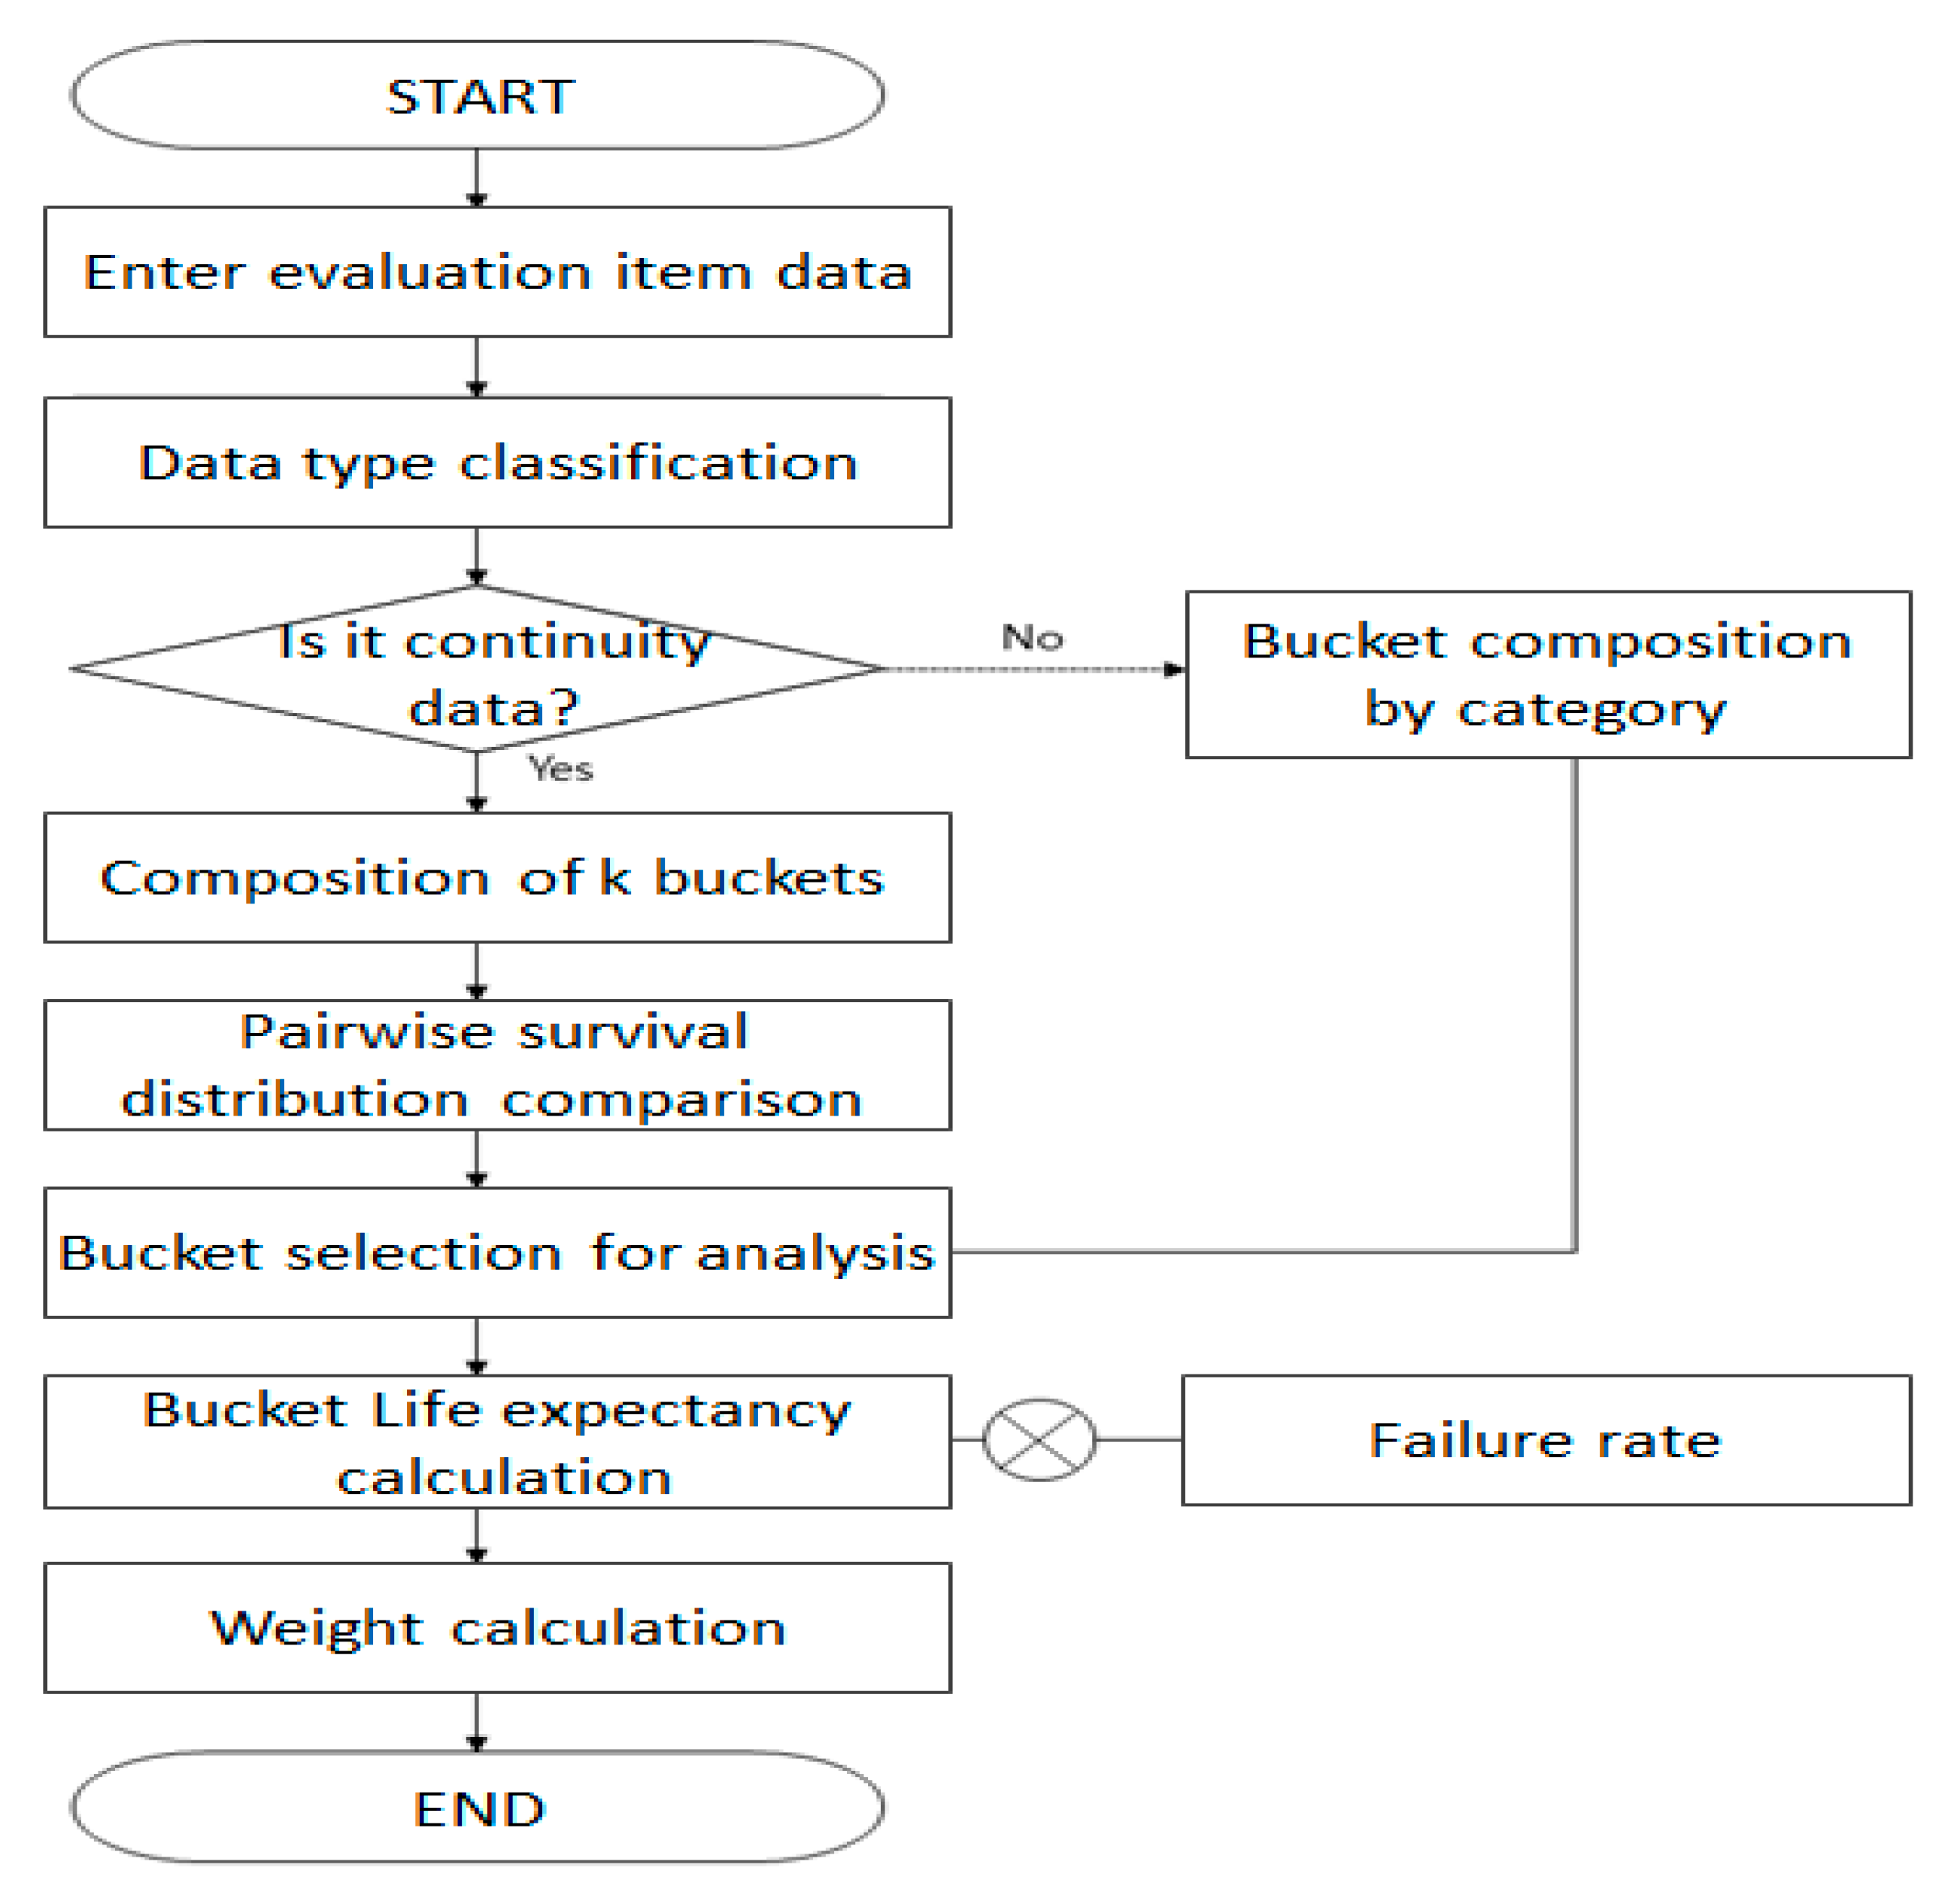
As mentioned in Section 2.3, the overhead lines are simply replaced every four years based on visual inspections, so detailed failure data is insufficient. So, in this paper, the weights of the operation health index assessment items were calculated using survival analysis. The calculation process is shown in Figure 2.
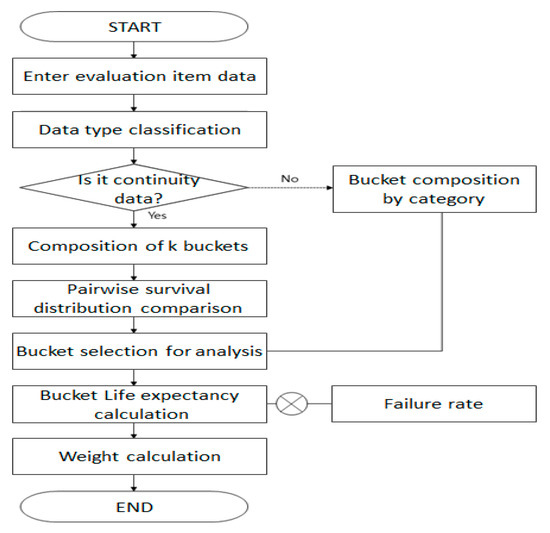
Figure 2.
The calculation algorithm process of operation health index weight.
Using the weights calculated for each evaluation item, the operation health index assessment formula was constructed as shown in Equation (2). At this time, the operation health index assessment score was based on a perfect score of 100 points.
In the case when ,
3.2. Risk Health Index Weight
In the event of a breakdown of the lines, the customer suffers from power failure and the power company incurs costs to solve it. In the event of a facility failure, the cost of sales loss for each line that suffers from the failure to supply power to the power company and the line replacement cost for restoring the power facilities in the event of a failure are defined. Therefore, in this paper, two items, the power outage equipment cost and the line replacement cost in the event of a line failure, were defined and used as risk costs.
When calculating the risk cost, the failure probability of each line calculated through the survival analysis was applied to the risk cost defined in this paper, and the failure risk cost for each line was calculated using the average annual power consumption per region.
The failure risk cost relational expression defined in this study is shown in Equation (3).
Equation (4) shows the method for calculating the failure risk cost score using the risk cost. Here, the failure risk cost score was based on 100 points.
The line replacement cost, defined as a risk factor in this study, was calculated using the KEPCO construction standard unit price and the wire length as follows:
The method for calculating the line replacement score using the line replacement cost is shown in Equation (6). Here, the line replacement score was based on 100 points.
Because the power supply interruption and the line replacement always accompany each other in the event of a failure, the health index of the total risk cost evaluation was calculated by defining the health index score of the failure risk cost and the health index score of the line replacement cost at a ratio of 0.5:0.5. This was calculated on a scale of 100 points.
Therefore, the overall health index assessment formula for the overhead lines in this paper was calculated as shown in Equation (9).
4. Case Study
4.1. Health Index Weight
In this paper, the weights of the health index assessment were calculated using the data of about 4.7 million overhead lines installed in Korea. The average values for 2021 were used for the unit price and blackout time in the health index assessment items of risk cost, and the operation health index assessment items were defined as factors that affect the performance of the overhead lines for the operation health index assessment. The operation health index assessment items are listed in Table 6 [16].
Table 6.
Evaluation factor.
In evaluating the health index, the data types must be classified for each evaluation item and the maximum value must be selected for each evaluation item. For this purpose, the results of the data type classification and the bucket selection of the evaluation items are shown in Table 7 [17].
Table 7.
Data type classification.
Table 7 shows the average life expectancy at the point where the survival probability is 0.995 using the analysis bucket for each evaluation item. Here, the life expectancy of each bucket is used only for weight calculation, where the failure rate for each evaluation item in the failure data was multiplied by the reciprocal of the average life. The final calculations for the weights for each evaluation item are shown in Table 8. Here, the sum of the weights was calculated out of 100 points.
Table 8.
Life expectancy, failure rate, and weight results for each evaluation item bucket.
Here, the salt damage grade and the kind of overhead line are categorical data. The weight calculated by multiplying the life expectancy and the failure rate for each grade is shown in Table 9.
Table 9.
Result of salt damage grade and kind of overhead line weight.
The final operation health index calculation formula using the calculated weight is shown in Equation (10).
Here, in case of ;
in case of ;
in case of ;
in case of ;
in case of ;
in case of ;
in case of ;
in case of .
4.2. Result of Overhead Line Total Health Index
Currently, in Korea, the health index ratings are distinguished in units of 20 points. The overall health index assessment results by grade are shown in Figure 3 and Table 10. The Gyeongbuk and Gangwon regions apparently have plenty of extremely poor supplies, whereas the Seoul and Namseoul Headquarters have a few.
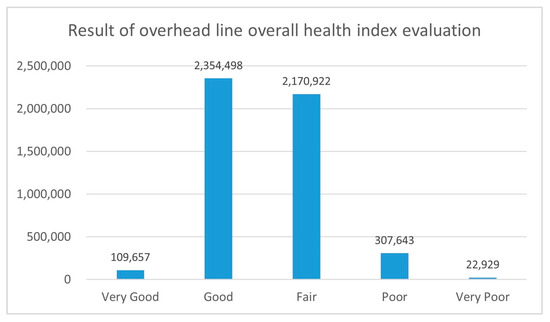
Figure 3.
Result of the overall health index assessment of overhead lines by grade.
Table 10.
Results of the overall health index assessment rating of overhead lines.
Table 11 and Table 12 show that the forest rates in the Gangwon and North Gyeongsang regions were higher than those in other regions, whereas the underground rate was low [18]. Given the many long-span lines in the mountainous areas, and because the construction cost for replacing them is high, these characteristics are reflected by the large number of replacement items of the health index.
Table 11.
Forest rate by administrative district.
Table 12.
Underground rate of national headquarters.
Analyzing the number of actual spans for each level of the health index and its ratio to the total number of spans, as shown in Table 13, we see that there were many lines with an actual span of 50 m or more in the Gangwon, Chungbuk, and Gyeongbuk regions. In particular, the number of spans in Gangwon and Gyeongbuk was higher than that in other regions; therefore, the number of spans with an actual span of 50 m or more was the highest in Gangwon and Gyeongbuk. This proves that the replacement cost of the overhead cables is high because the underground rate is low and there are many long-span sections in the forest area.
Table 13.
Number of spans over 50 m for each level of the health index.
In Seoul and South Seoul Headquarters, the very poor quantity was calculated to be significantly less. This means the overhead cable operating environment was good because the number of overhead cables was low in the downtown area, the pollution level was good, and the wind speed was not as strong as that in other areas. In the past, we used the replacement method of overhead lines that relied only on instantaneous/diagnostic extraction. However, according to the health evaluation method developed in this paper, a risk-based replacement can prevent consumer life/property damage through a stable power supply and prevent power facility accidents.
4.3. Analysis of Economic Effects
Overhead line aging replacement was previously performed solely by visual inspection. This paper analyzes the cost-effectiveness of replacing overhead lines using the conventional method and the proposed method. The expected replacement quantity of extra-high-voltage overhead lines in the future was calculated to analyze the economic effects of the health index assessment model proposed in this study. As for the lifetime of the overhead lines, the manufacturer’s warranty period of 30 years was applied. Table 14 shows the calculation of the quantity of the extra-high-voltage overhead lines over 30 years for the next 3 years and the analysis of such replacement quantity using the method proposed in this study.
Table 14.
Estimated replacement quantity of extra-high voltage overhead lines for the next 3 years.
As shown in the above results, it is necessary to replace a much smaller quantity when replacing the extra-high-voltage overhead lines using the method proposed in this paper than when replacing simple old overhead lines. This can reduce the annual replacement cost by more than 400 million won and can increase the accuracy of failure prevention by investing in activities such as precise diagnosis of overhead lines with reduced costs.
5. Conclusions
In this paper, a method for evaluating the health index of overhead lines was proposed to establish criteria for the efficient replacement of the power distribution facilities.
For the major power distribution facilities, there is an old replacement standard called the health index assessment, but there is no old replacement standard for the about 4.7 million power distribution overhead lines based on span, which were replaced only through diagnoses and visual inspections. This resulted in excessive diagnostic costs. In addition, by preemptively replacing overhead lines to prevent failure, excessive facility investment has been executed due to preemptive replacement even though the durability of the overhead lines remains. Thus, in this paper, a health index assessment model was proposed to establish the cost-effective power distribution facility operating costs and the facility replacement standards for overhead cables. The overhead lines were evaluated based on the failure risk cost, which considers the health index and the probability of failure risk. It was confirmed that the proposed method is more economical than the conventional aging replacement method when used to replace the equipment.
In future works, we plan to apply the algorithm developed in this study to an actual operating environment, perform replacements for more than 1 year, analyze statistical data on failure occurrence and old demolition, and consider machine learning-based algorithm accuracy verification results and expert opinions. In addition, we plan to increase the accuracy of the equipment condition estimation by adjusting the weights of the operation health and risk cost health using an analytic hierarchy process and calculating the optimal overall health weight.
Author Contributions
Conceptualization, H.L. and B.L.; methodology, H.L. and Y.K. (Yongha Kim); software, H.L.; validation, H.L. and Y.K. (Yongha Kim); formal analysis, H.L.; investigation, G.H. and Y.K. (Yuri Kim); resources, H.L. and B.L.; data curation, H.L.; writing—original draft preparation, H.L. and B.L.; writing—review and editing, G.H. and Y.K. (Yuri Kim); visualization, H.L.; supervision, Y.K. (Yongha Kim); project administration, H.L. All authors have read and agreed to the published version of the manuscript.
Funding
This research received no external funding.
Data Availability Statement
Data are contained within the article.
Conflicts of Interest
The authors declare no conflict of interest.
References
- Kwon, D.-J. Technology Trends for Asset Management System of Power Facilities. Korean Inst. Electr. Eng. 2018, 67, 30–33. [Google Scholar]
- TB309; Asset Management of Transmission Systems and Associated CIGRE Activities. CIGRE: Paris, France, 2006.
- TB422; Transmission Asset Risk Management. CIGRE: Paris, France, 2010.
- TB541; Asset Management Decision Making Using Different Risk Assessment Methodologies. CIGRE: Paris, France, 2013.
- Naderian, A.; Cress, S.; Piercy, R.; Wang, F.; Service, J. An Approach to Determine the Health Index of Power Transformers. In Proceedings of the 2008 IEEE International Symposium on Electrical Insulation, Vancouver, BC, Canada, 9–12 June 2008; pp. 192–196. [Google Scholar]
- Thongchai, P.; Pao-La-Or, P.; Kulworawanichpong, T. Condition-based health index for overhead transmission line maintenance. In Proceedings of the 2013 10th International Conference on Electrical Engineering/Electronics, Computer, Telecommunications and Information Technology, Krabi, Thailand, 15–17 May 2013; pp. 1–4. [Google Scholar] [CrossRef]
- Hashim, R.; Usman, F.; Baharuddin, I.N.Z. Determining Health Index of Transmission Line Asset using Condition-Based Method. Resources 2019, 8, 80. [Google Scholar] [CrossRef]
- Naranpanawe, L.; Ma, H.; Saha, T.K.; Lee, C.; Ghosal, A. A Practical Health Index for Overhead Conductors: Experience from Australian Distribution Networks. IEEE Access 2020, 8, 218863–218873. [Google Scholar] [CrossRef]
- Arunraj, N.S.; Maiti, J. Risk-based maintenance—Techniques and applications. J. Hazard. Mater. 2007, 142, 653–661. [Google Scholar] [CrossRef] [PubMed]
- Lee, H.-S. RISK Assessment of Asset Management System for Distribution Transformer. Ph.D. Thesis, Korea National University of Transportation, Uiwang-si, Republic of Korea, 2021. [Google Scholar]
- Yahaya, M.S.; Azis, N.; Ab Kadir, M.Z.A.; Jasni, J.; Hairi, M.H.; Talib, M.A. Estimation of Transformers Health Index Based on the Markov Chain. Energies 2017, 10, 1824. [Google Scholar] [CrossRef]
- Kadim, E.J.; Azis, N.; Jasni, J.; Ahmad, S.A.; Talib, M.A. Transformers Health Index Assessment Based on Neural-Fuzzy Network. Energies 2018, 11, 710. [Google Scholar] [CrossRef]
- Kim, Y.M.; Kim, M. Asset Management System Technology Trend Analysis of Power Facilities. In Proceedings of the Symposium of the Korean Institute of communications and Information Sciences, Yeosu, Korea, 17–19 November 2021; pp. 13–14. [Google Scholar]
- KEPCO. The Monthly Report on Major Electric Power Statistic; KEPCO: Naju-si, Republic of Korea, 2022. [Google Scholar]
- KEPCO. Statistics of Electric Power in Korea; KEPCO: Naju-si, Republic of Korea, 2022; Volume 91. [Google Scholar]
- KEPCO. Standard of Distribution Line Inspection; KEPCO: Naju-si, Republic of Korea, 2022. [Google Scholar]
- KEPCO. Statistics of Inspection and Diagnosis; KEPCO: Naju-si, Republic of Korea, 2022. [Google Scholar]
- Korea Forest Service. Statistics of Forest; Korea Forest Service: Cheongsong-gun, Republic of Korea, 2021. [Google Scholar]

Disclaimer/Publisher’s Note: The statements, opinions and data contained in all publications are solely those of the individual author(s) and contributor(s) and not of MDPI and/or the editor(s). MDPI and/or the editor(s) disclaim responsibility for any injury to people or property resulting from any ideas, methods, instructions or products referred to in the content. |
© 2023 by the authors. Licensee MDPI, Basel, Switzerland. This article is an open access article distributed under the terms and conditions of the Creative Commons Attribution (CC BY) license (https://creativecommons.org/licenses/by/4.0/).