Article

Experimental Study of the Corrugation Profile Effect on the Local Heat Transfer Coefficient

1
Department of Architecture and Engineering, University of Parma, Parco Area delle Scienze 181/A, 43124 Parma, Italy
2
SITEIA.PARMA Interdepartmental Centre, University of Parma, Parco Area delle Scienze 181/A, 43124 Parma, Italy
*
Author to whom correspondence should be addressed.
Energies 2023, 16(20), 7181; https://doi.org/10.3390/en16207181
Submission received: 12 September 2023 / Revised: 11 October 2023 / Accepted: 18 October 2023 / Published: 20 October 2023
(This article belongs to the Section J1: Heat and Mass Transfer)

Abstract

:
This paper introduces an inverse study method applied to an experimental dataset of infrared temperature acquisitions to determine the local convective heat transfer coefficient of the turbulent flow inside a duct with corrugated surfaces. The study focuses on six tubes with different corrugation profiles: helical, transversal, and cross-helical. Previous research has shown that transversal corrugation generates the highest improvement in heat transfer performance, while helical corrugations are the easiest to manufacture. Consequently, the single helix solution is the preferred one in heat exchangers adopted in the food industry. A merger solution between them is represented by the cross-helix profile. The estimation process proposed in this study employs the external surface temperature of the tube, acquired with an infrared thermal camera, as starting data for the inverse heat conduction problem inside the pipe wall region. The calculation of its Laplacian was finally achieved by a filtering technique applied to the infrared temperature acquisitions.

1. Introduction

The enhancement of heat transfer, which is extensively studied in engineering, plays a crucial role in reducing costs, optimizing the size, and improving the efficiency of heat exchangers. Typically, techniques to enhance convective heat transfer can be categorized into two main types: passive and active methods. The first ones require an external power source [1], while the second ones achieve the same results without it [2,3]. Passive techniques are often preferred due to their cost-effectiveness and ease of implementation in devices. Among the various passive approaches used to enhance convective heat transfer, swirl-flow, treated and rough surfaces, corrugated tubes, coiled tubes, and flow additives [4] can be found. Among these approaches, corrugated tubes are widely adopted in industrial applications [5] and extensively studied in the scientific literature.
Wall corrugation has been extensively investigated as it works as a source of disruption in the primary flow, leading to an early transition to turbulent regimes. This transition showed significant improvements in performances from the thermal point of view for the tube section and, at the same time, it limited the increase in the pressure drop in comparison to different passive techniques, like the use of insert devices [3]. The use of tubes with corrugated walls significantly enhances the performance from the thermal point of view compared to smooth pipes. Moreover, wall corrugations have been shown to be able to disrupt the thermal boundary layer, increase the mixing of the flow due to the generation of secondary swirl, and increase the heat exchange area. The key geometrical parameters that define corrugation include the pipe diameter, corrugation pitch, corrugation depth, and corrugation profile [5,6].
Various geometries have been investigated, such as transversal grooved pipes [7], converging and diverging pipes [8], dimpled pipes [9], spirally corrugated pipes [10,11], internally corrugated pipes [12], and wavy channels [13,14]. When discussing the enhancement capabilities of corrugated tubes, the available scientific literature mainly focuses on the average heat exchange behavior across the pipe section or the entire heat exchange surface region [15,16,17]. This simplified method, suitable for many practical applications, arises from the challenges of locally assessing the heat flux on the inner surface of a duct. The dimensions of the sensors, inaccessibility of the surface due to its geometry, or harsh conditions hinder the placement of sensors on the inner surface of the pipe [18]. However, in certain practical industrial cases, knowledge of the performances from a local point of view is crucial. For example, in food pasteurization, irregular temperature distributions could negatively impact bacteria heat destruction or cause local overheating of the product. Additionally, experimental information on the local behavior of the heat transfer coefficient of convection over the area of heat exchange can afford deeper insights into increasing mechanisms and understanding the causal connection between modifications to the shape of the area of heat exchange and the improvement of convection.
This study aims to address this gap by introducing and assessing an experimental technique for evaluating the local heat transfer coefficient in ducts with different corrugation profiles. The estimation procedure utilized in this study involves solving the inverse heat conduction problem (IHCP) inside the domain of the pipe wall, employing the distribution of the temperature on the outer surface as starting data, and considering the distribution of the convection coefficient on the interface between the internal wall and the fluid as unknown [19]. Since the wall temperature distribution exhibits significant variations over space, as a consequence of the complicated outcome of surface corrugation on the flow arrangement, the proposed method demands a high-resolution temperature measurement technique, which was attained using a liquid cooled infrared camera. It is important to note that the applications of IR devices to IHCPs primarily rely on cameras with cryogenic cooling due to their excellent performance in terms of their noise-equivalent temperature difference [20,21]. As recognized, IHCPs present challenges as they are ill-posed and highly sensitive to variations in input data, including those arising from experimental noise.
To overcome these difficulties, especially when using infrared thermography as a temperature measurement technique, various methods based on data processing have been proposed in the literature. Among them, it is possible to include the iterative method of conjugate gradient, the method of Laplace transformation, the method of the sequential function specification, methods of regularization like the Tikhonov one, the method of mollification, the approach of function reciprocity, the method of the truncated singular value decomposition, and the technique of filtering [22]. Cattani et al. used a 2D thermal quadrupole model and the truncated singular value decomposition method for estimating the local internal convective heat transfer coefficient of a tube’s flow [23]. Xiong et al. [24] adopted the sequential function specification to concurrently determine the spatially and temporally varying internal fluid temperature and convective heat transfer coefficient of two-dimensional pipes. Delpueyo et al. [25] used a regularization approach based on an optimized derivative Gaussian filter starting from noisy temperature fields to obtain a heat source reconstruction. Colaço et al. [26] used the so-called “reciprocity function approach” for the non-intrusive estimation of internal heat transfer coefficients in ducts. Ngendahayo et al. [27] adopted the Tikhonov regularization method for the estimation of surface temperatures from interior measurements, while Bozzoli et al. [28] applied the Tikhonov regularization method for estimating the local heat transfer coefficient in coiled pipes. Among these estimation approaches, the one that best fits many unknown variables and input signals, like temperature maps with high resolution, i.e., infrared maps, is the filtering approach [29]. Furthermore, by using a noise-filtered temperature distribution for solving heat conduction equations for the calculation of the internal convective heat transfer coefficient, it is possible to avoid complex algorithms for solving the related inverse problem.
In this study, the IHCP of an ill-conditioned nature is addressed using a filtering technique with the distribution of temperature obtained with infrared acquisition, enabling the determination of the distribution of the coefficient of convection in corrugated pipes. Moreover, the obtained results provide valuable insights for the design and optimization of heat exchangers utilizing corrugated tubes.

2. Experimental Setup

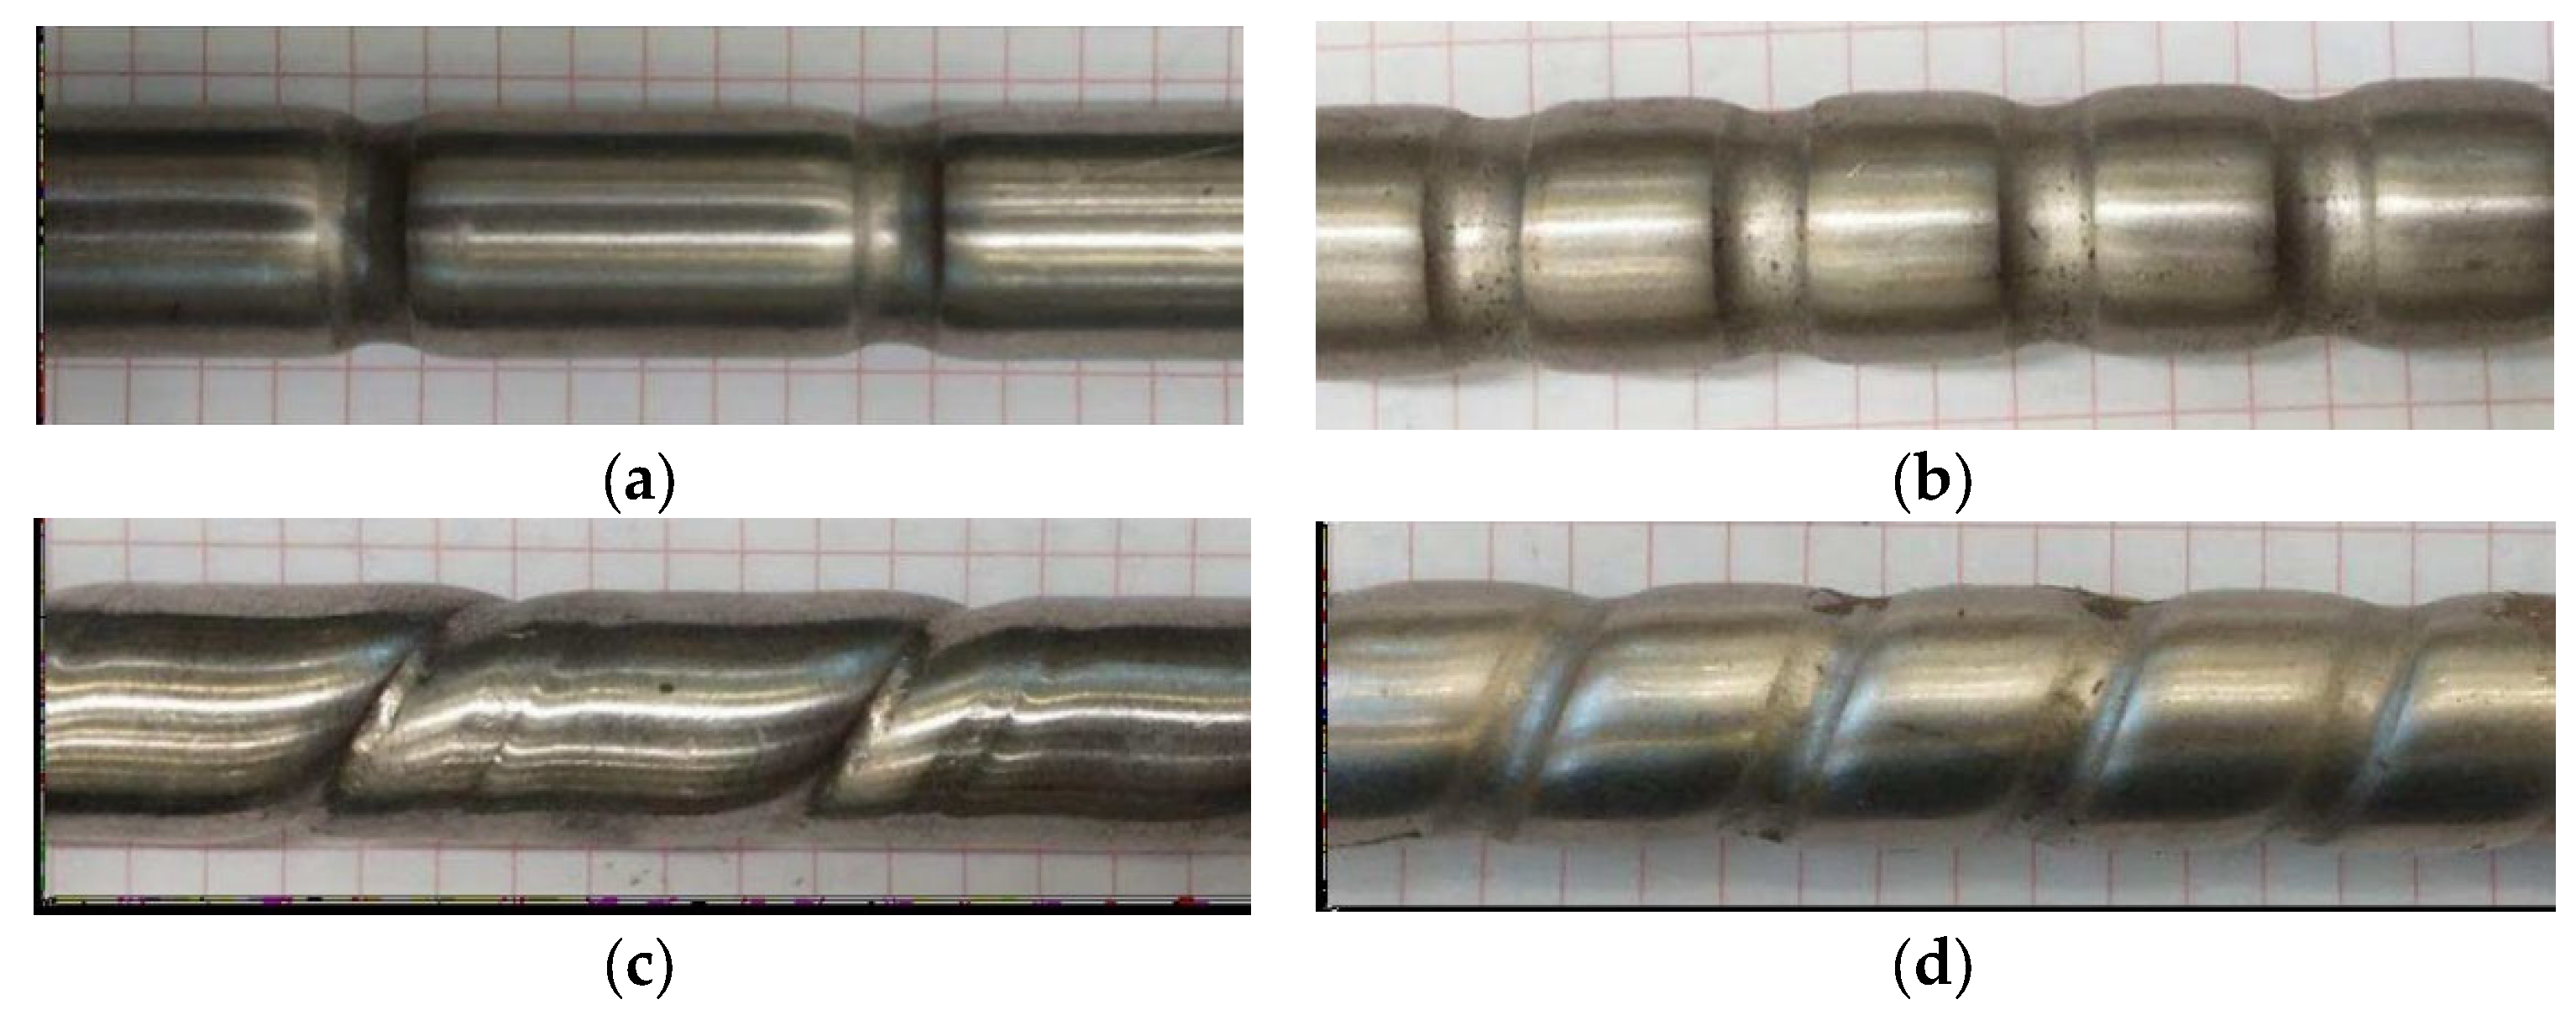
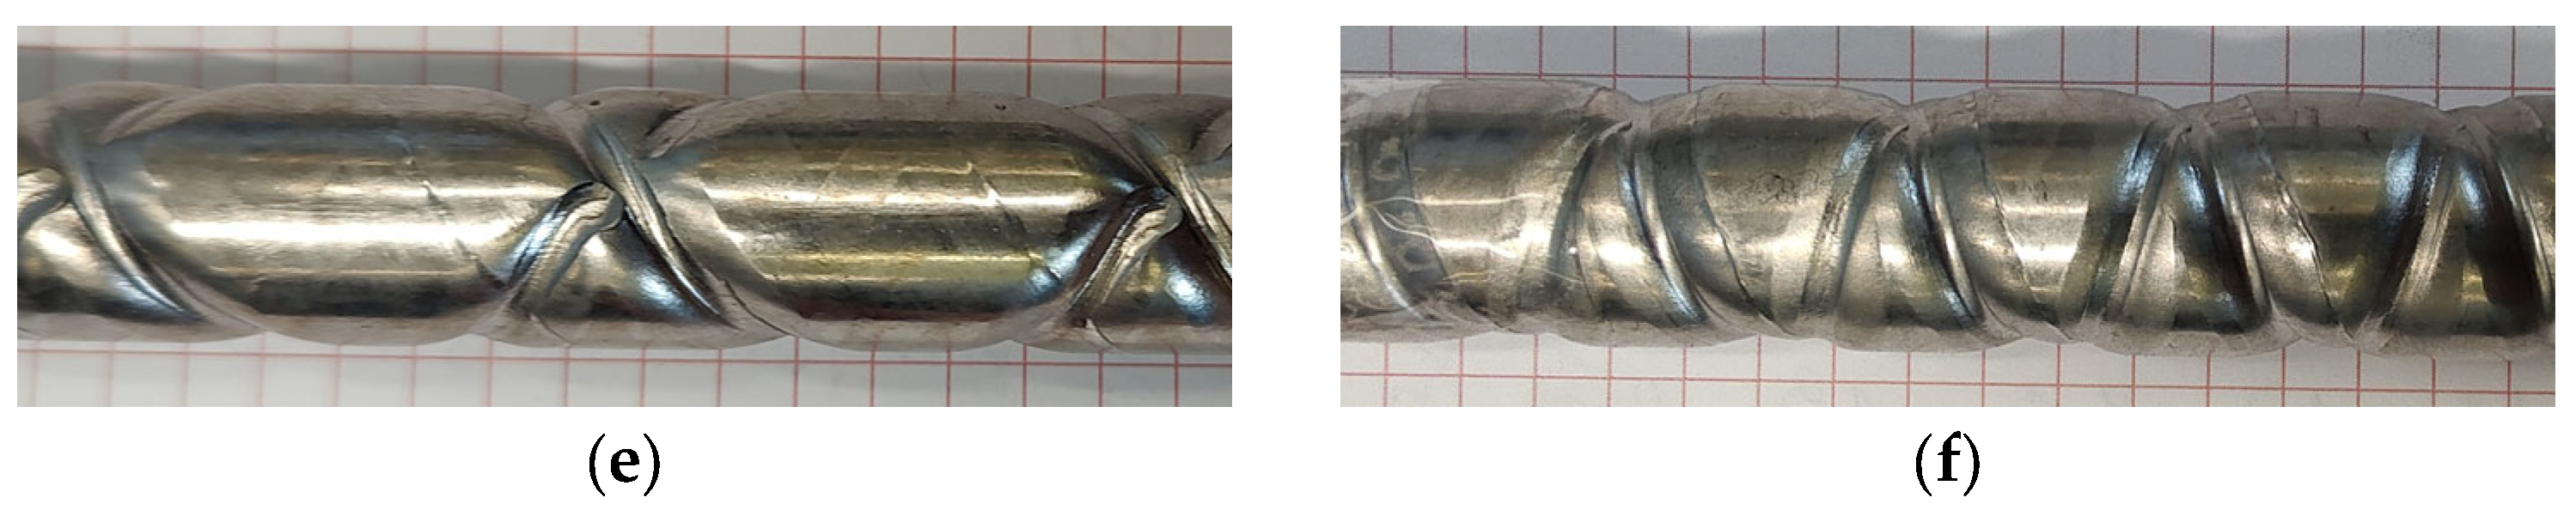
2.1. Pipe Geometries
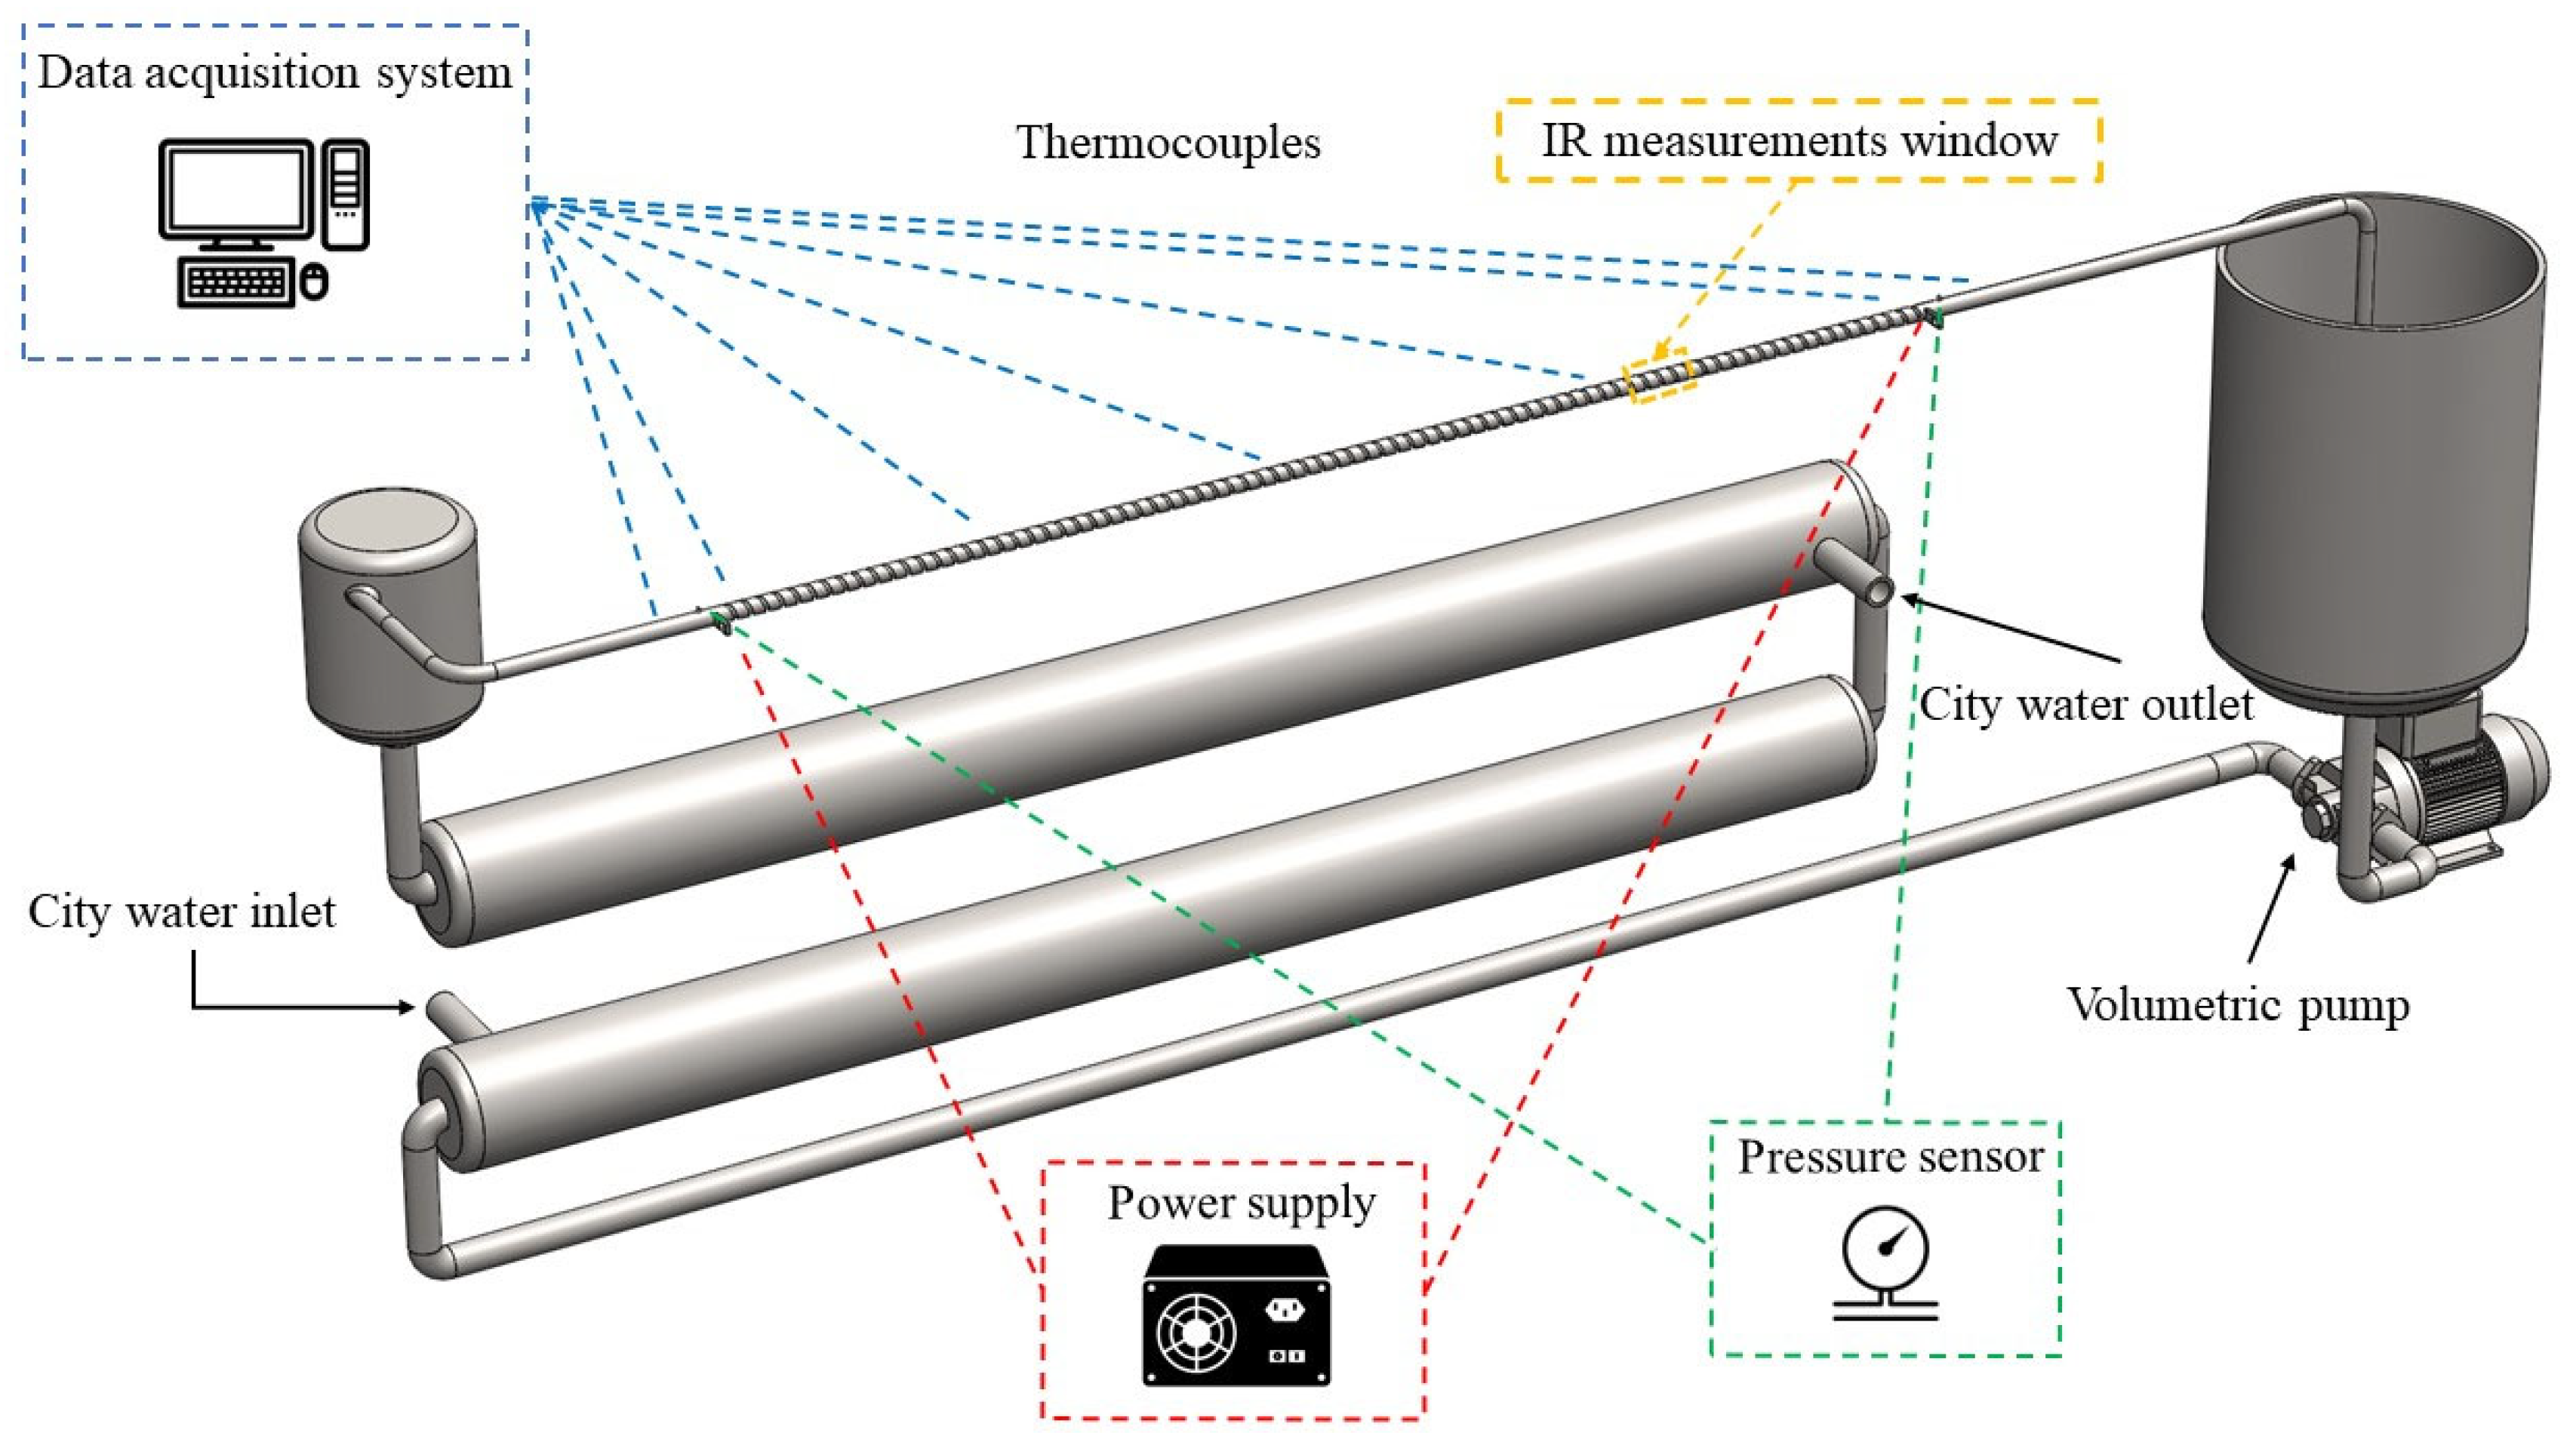
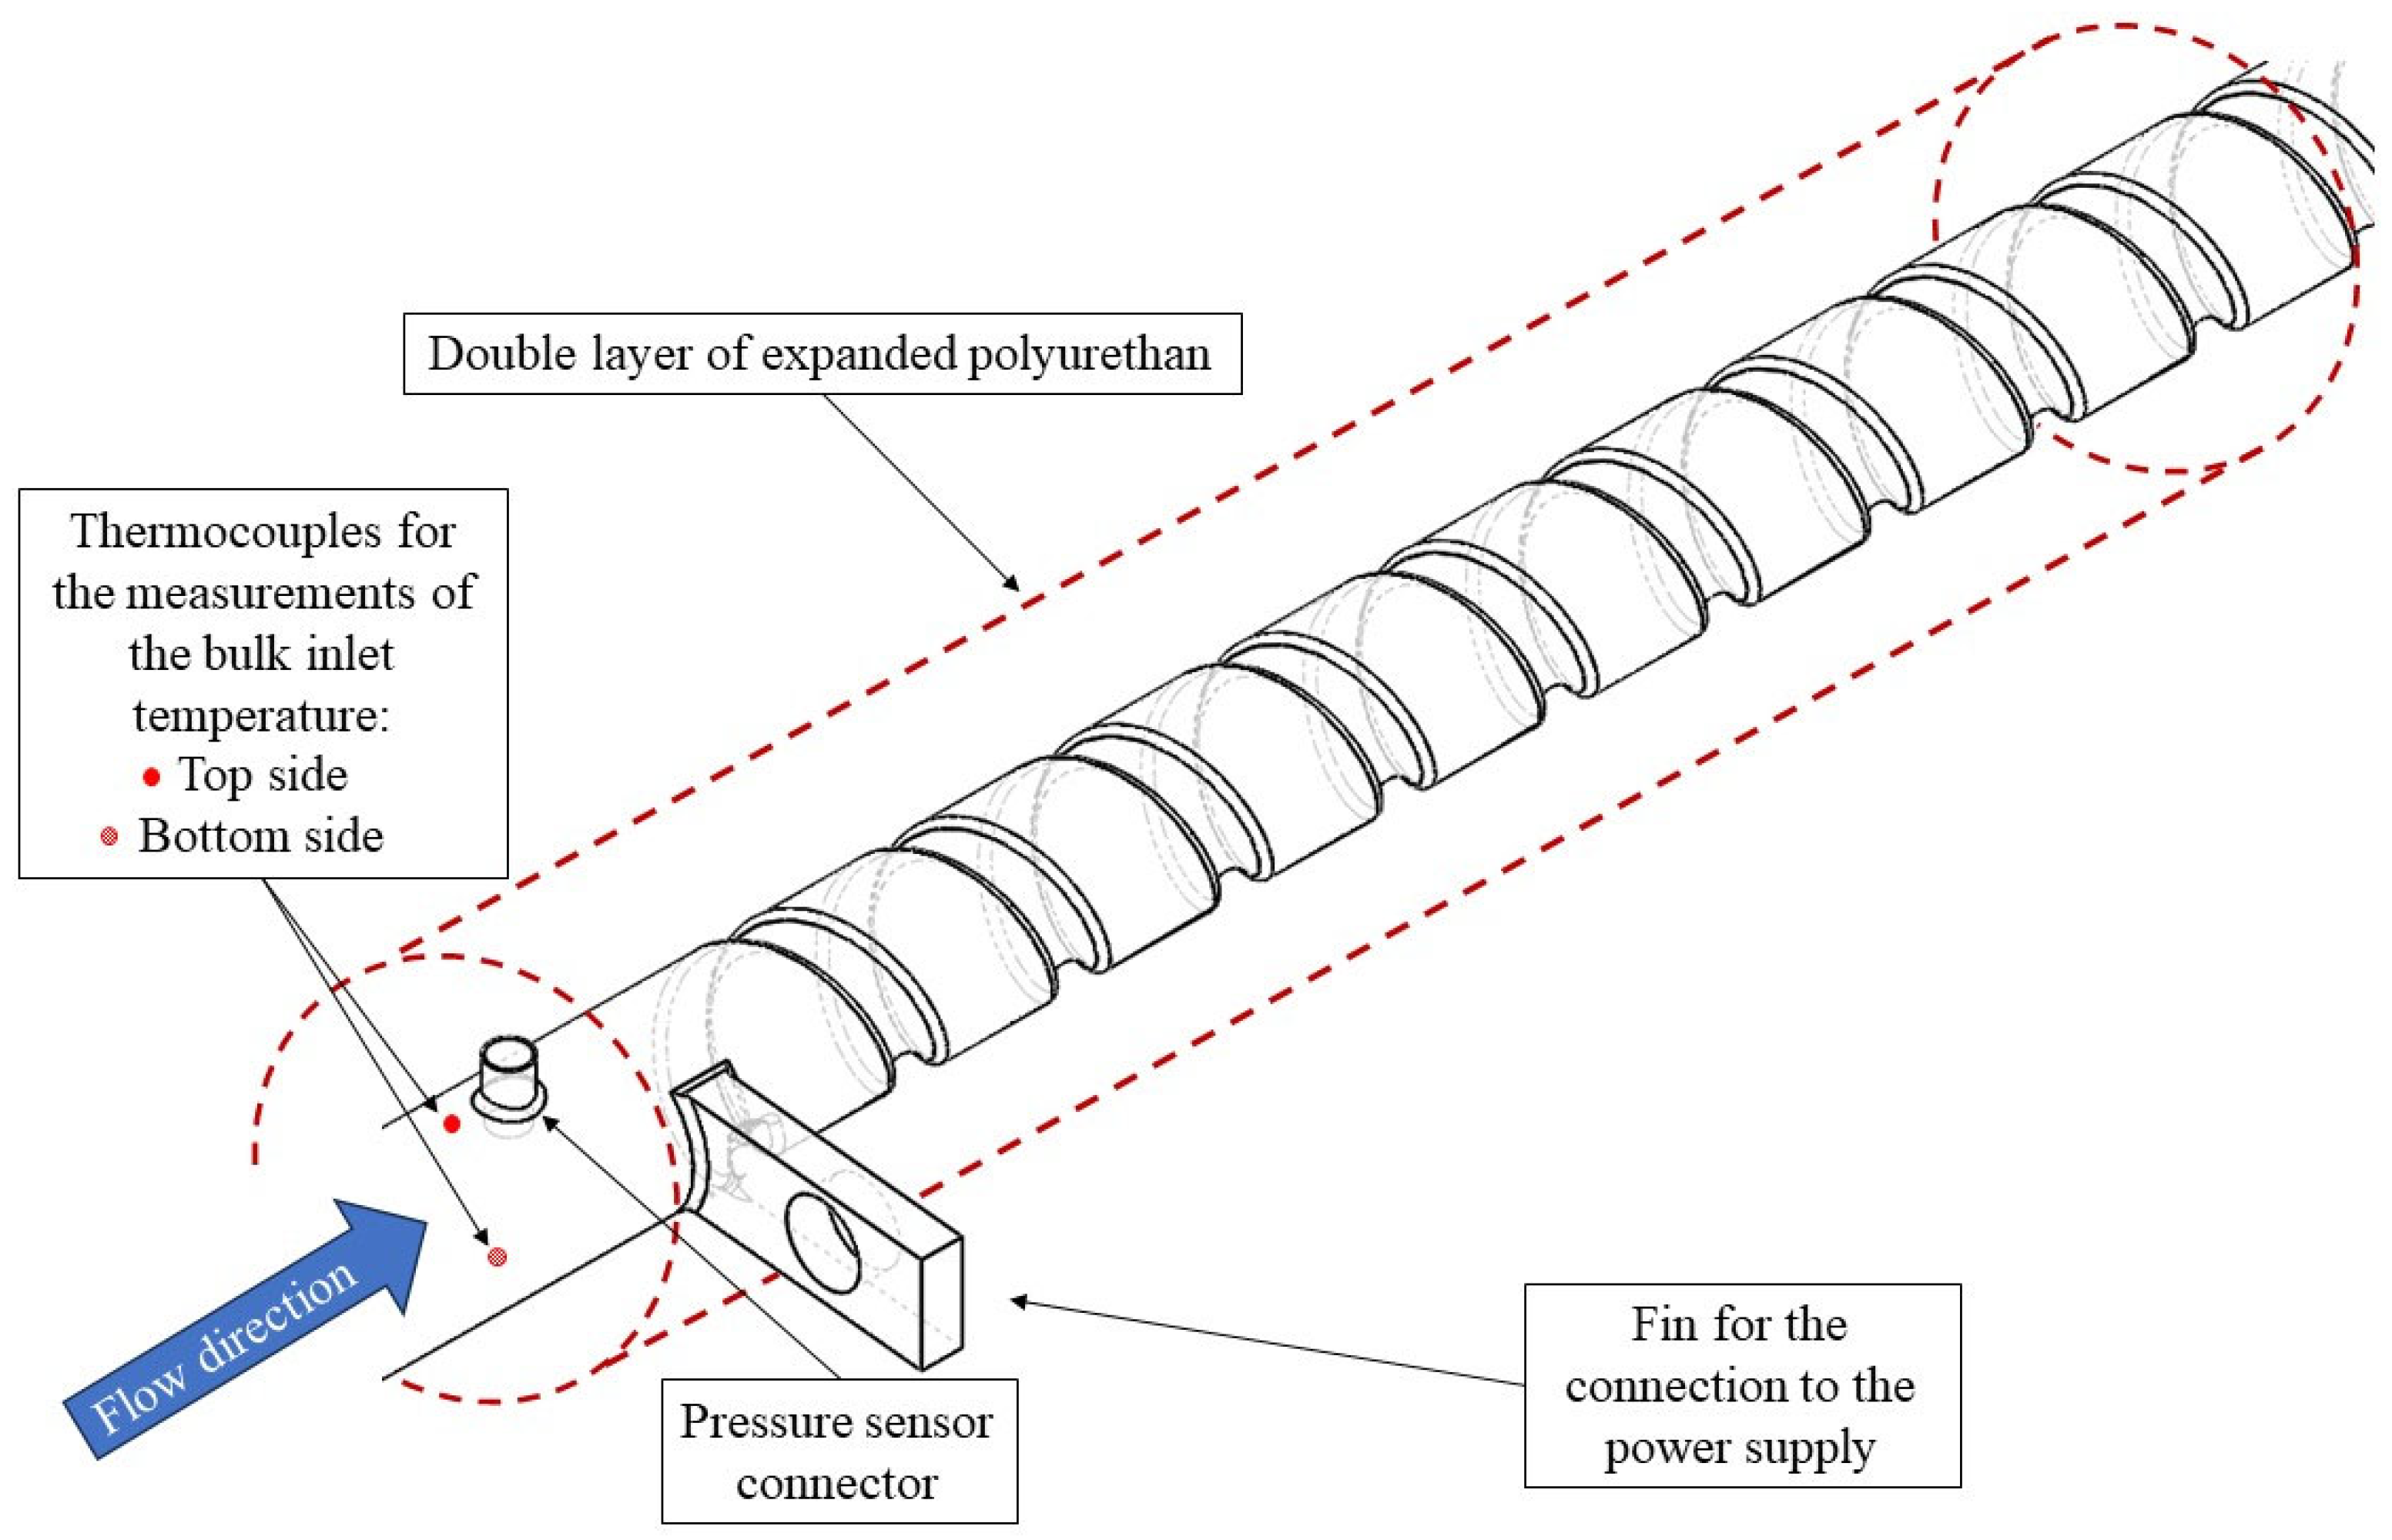
In this study, we conducted experimental investigations on six different stainless steel pipes made of AISI 304, each characterized by unique geometrical parameters and corrugation profiles. All the tested pipes had a uniform wall thickness of 1 mm, an outer envelope radius (ro) of 8 mm, and a length of 3 m. The corrugation profile of the pipes varied, including the helical, transversal, and cross-helical profiles. For each corrugation profile, we considered two different corrugation pitch values: 16 mm and 32 mm. Table 1 provides a summary of the geometric characteristics of the six pipes under study.
Helical corrugation is the most used in industrial applications due to its ease of production compared to transversal corrugation. Helical corrugation involves continuous rotation of the pipe, resulting in an internal helical groove and a corresponding external helical one obtained by embossing a smooth tube. Consequently, cross-helical corrugated pipes can also be produced by rolling the same tube two times, incorporating two helical corrugations in reverse directions. On the other hand, transversal corrugation is obtained by a more discontinuous process. Figure 1 provides a representation of the six tubes, highlighting the differences in corrugation profiles and pitches.
To create a heating section along the length of the pipes, a heated 1.84 m segment was established by applying two steel electrodes electrically connected to a power supply (HP 6671A) operating within the ranges of 0–8 V and 0–220 A. The heat flux was generated by the Joule effect on the wall of the pipe, and it was assumed to be uniform across the heating section. It was determined by dividing the provided electrical power (adjusted for heat losses to the ambient environment) by the solid volume of the pipe. To minimize heat losses to the ambient environment, the pipes were thermally insulated with a double layer of expanded polyurethane. We gave special attention to the impacts associated with buoyancy forces, so we carefully chose the applied heat flux to the working fluid to minimize these forces when compared to the inertia forces at the fluid velocity values examined here. To assess whether the natural convection effects were significant in comparison to the forced convection effects, we calculated the Grashof-to-Reynolds number ratio, denoted as Gr/Re2 [30]. Since this ratio is considerably smaller than 1 for all the experiments conducted, we could conclude that the buoyancy forces can be regarded as negligible when compared to inertial forces. Consequently, the measurements obtained in a single section can be considered representative of the thermally developed conditions for forced convection flows.

2.2. Test Circuit

The initial focus of this investigation was to measure the performance of the corrugated pipes from an average point of view in terms of heat transfer effects and fluid-dynamic penalties. The pipes were horizontally placed in a specifically designed setup, as depicted in Figure 2. In Figure 3, a detail of the inlet section of the corrugated portion of the studied tubes is reported. This figure is also representative of the outlet section since the two sections are specular. Water was used as the fluid, which was pumped from a holding tank to a heat exchanger wherein the service section was fed with city water. This setup maintained a constant inlet temperature for the fluid entering the tested pipes. To measure the temperatures, forty T-type thermocouples were calibrated and connected to an ice multipoint reference (type KAYE K170-50C). These thermocouples were positioned at different axial and circumferential locations on the outer side of the pipe in the heated zone. For each axial distance, two thermocouples were placed diametrically opposite each other, with one on the top and one on the bottom of the tube’s cross-section. To calculate the temperature of the internal side of the wall, the problem related to the heat generation in the pipe wall of the steady-state heat conduction was solved [10]. The temperature of the fluid at the inlet and outlet section was measured by probes placed on the pipe’s wall before and after the heated section, respectively.
The product temperature along the heat transfer area of the pipe was obtained based on the power generated in the pipe wall, assuming it was uniformly distributed along the total length of the section. Volumetric flow rates were calculated by weighing the quantity of product exiting the test section and relating it to the time taken. Data acquisition was performed using a high-precision multimeter controlled by a laptop. Pressure drops across the corrugated pipes were measured using a Emerson (Italy) Rosemount 3051S pressure transducer based on the differential signal under isothermal conditions. Temperature data were acquired for a duration of 5 min at a frequency of 0.33 Hz after reaching a steady state for Reynolds number values ranging from 4 × 10³ to 16 × 103. The heat transfer performances were determined using the Nusselt number, defined as:
N u = h z · D i k f
where kf represents the thermal conductivity of the fluid at the local fluid temperature and hz is the local convective heat transfer coefficient averaged on the circumference. The latter was calculated using the formula:
h z = q T ¯ w T b
Emerson where T ¯ w and Tb are the wall temperatures averaged on the circumference and the local bulk fluid temperature, respectively; T ¯ w was obtained by averaging the values obtained by the two thermocouples located along the top and bottom axial extremities of the cylindrical external surface at each position of measurement. To evaluate the heat exchanged in the unitary area (q), the surface of the heat exchange of the pipe was considered to correspond to the one of a cylinder with the same diameter. The fluid properties were estimated using the previously described method to compute the local fluid bulk temperature based on the energy balance.
The friction factor of Darcy, evaluated as reported in Equation (3), was adopted for the evaluation of the pressure drops in the pipes studied:
f = Δ p ρ D i L 2 w 2
where Δp is the pressure drop over the test section with length L, Di is the internal tube diameter, ρ and w are the density and the velocity of the working fluid, respectively.
For the evaluation of the pressure drops induced by the corrugation and assessing the improvements and potential drawbacks, two dimensionless quantities commonly used in the evaluation of enhanced geometries were considered [31], the friction factor enhancement and heat transfer enhancement, calculated with the following definitions:
ε f = f e f o
ε h = N u e N u o
where e and o refer to the enhanced and reference tubes, respectively. As for the reference geometry, a straight and smooth pipe was used, as commonly assumed in the literature [30], and the correlation of Dittus–Boelter for smooth wall pipes in turbulent regimes was considered valid [32]. Moreover, the efficiency of the enhancement was evaluated following one of the most adopted definitions [28,31]:
η = ε h ε f 1 / 3
For the local heat transfer estimation, the thermal insulation layer was completely removed along an approximately 14 cm portion of the external pipe wall, making the external surface of the pipe wall accessible to the infrared camera. This portion was painted with a thin film of opaque acrylic color with a known and uniform emissivity (i.e., 0.95). The adopted camera was a FLIR SC7000 with a 640 × 512 pixel sensor, a sensitivity of 20 mK at 303 K, and an accuracy of ±1 K. By moving the IR camera around the axis of the section painted, multiple images were collected to obtain a temperature map of the entire external wall of the tube. A support, created to keep the optical axis of the camera in a perpendicular position with respect to the tube axis in all the shots, was used for reducing the perspective artifacts during the acquisition (Figure 4). In this setup, the angle of view was lower than ±30°, considering the pipe surface was like a diffuse grey emitter [33,34]. The image processing procedure utilized in a previous study [35] was employed to rectify the optical deformations caused by the surface curvature of the observed target surface.
The captured images (as shown in Figure 5a) were processed to generate a continuous temperature distribution on the external pipe wall (Figure 5b) by using appropriate references, fixed on the tube wall, for the correct positioning of every shot. These visual references were placed at the ends of the surface captured by the camera and served to identify the specific areas of interest in each obtained image. Each image provided 1/6 of the total surface under investigation.
In Figure 6, an example of a reconstructed external surface after the merging operation is reported.

3. Estimation Procedure

To determine the local coefficient of convection based on the obtained temperature distribution image from the IR camera, the inverse heat conduction problem (IHCP) within the domain of the tube wall was solved. The physical problem involves the heat conduction in the wall of a cylindrical pipe (as depicted in Figure 7), and the steady-state energy balance equation in this domain is given by:
k 2 T + q g = 0
where qg represents the heat provided at unitary volume inside the pipe wall, T is the temperature of the pipe wall, and k is the thermal conductivity of the wall material. The energy balance equation is complemented by two boundary conditions:
k T r = T T e n v R e n v ,   r = r e x t
k T r = h i n t T T b ,   r = r i n t
where Tenv is the surrounding environment temperature, Renv is the global heat transfer resistance between the environment and the tube wall, and Tb is the local product fluid temperature.
Assuming the approximation of the thin-wall condition, the outer surface temperature is considered to be equal to that of the internal one:
T α , r , z T α , r i n t , z T   α , r e x t , z
This approximation can be considered valid when the number of Biot, defined as the product of the convection coefficient and tube thickness, divided by the tube wall thermal conductivity, is less than 0.1. In this case, this condition was absolved.
Referring to a cylindrical sector of infinitesimal volume, as shown in Figure 8, the equation of the energy balance condition in the steady-state situation can be expressed as:
Q α + d α + Q α + Q r i n t + Q r e x t + Q z + d z + Q z + Q g = 0
By expressing all the terms in Equation (11) and simplifying [32], we arrive at the expression for determining the local coefficient of convection at the inner wall–fluid surface:
h i n t = k · ln r e x t r i n t · 2 T α 2 + k 2 r e x t 2 r i n t 2 · 2 T z 2 r e x t R e n v T T e n v + q g 2 r e x t 2 r i n t 2 r i n t · T T b
However, due to the noise present in the raw images of the surface temperature distribution, Equation (12) may yield unreliable results [27]. Its second derivative operator makes it highly sensitive to small perturbations caused by noise in the input data, leading to inaccurate outcomes [35]. To address this issue, a Gaussian filtering procedure was applied to the raw temperature data to eliminate high-frequency components, effectively acting as a regularization function. The efficacy of Gaussian filtering in this type of approach has been demonstrated by several researchers [22,27], as described in detail in the introduction section. The filter function in the two-dimensional frequency domain can be written as follows:
H u , v = e u 2 + v 2 / 2 u c 2
where uc is the frequency of cutoff, assumed to be equal along the coordinates u and v.
In real situations, the optimal frequency value for performing the cutoff operation is unknown, and a selection criterion is necessary to successfully perform the regularization step. In this study, the discrepancy criterion proposed by Morozov [36] was used. According to it, the inverse problem solution can be considered accurate enough when the difference between the measured temperatures T and the filtered temperatures Tf is like the standard deviation of the measured temperatures T. Hence, the appropriate cutoff frequency can be determined once the following condition is satisfied:
T f T 2 2 N · M = σ T 2
The measured quantities’ inherent uncertainties are documented in Table 2. By employing the error propagation method as outlined in [37], the level of uncertainty is associated with the primary parameter employed in this investigation. The upper bounds of uncertainty for the friction factor, convective heat transfer coefficient, Nusselt number, and Reynolds number were determined to be approximately ±6%, ±8%, ±9%, and ±3%, respectively.

4. Results

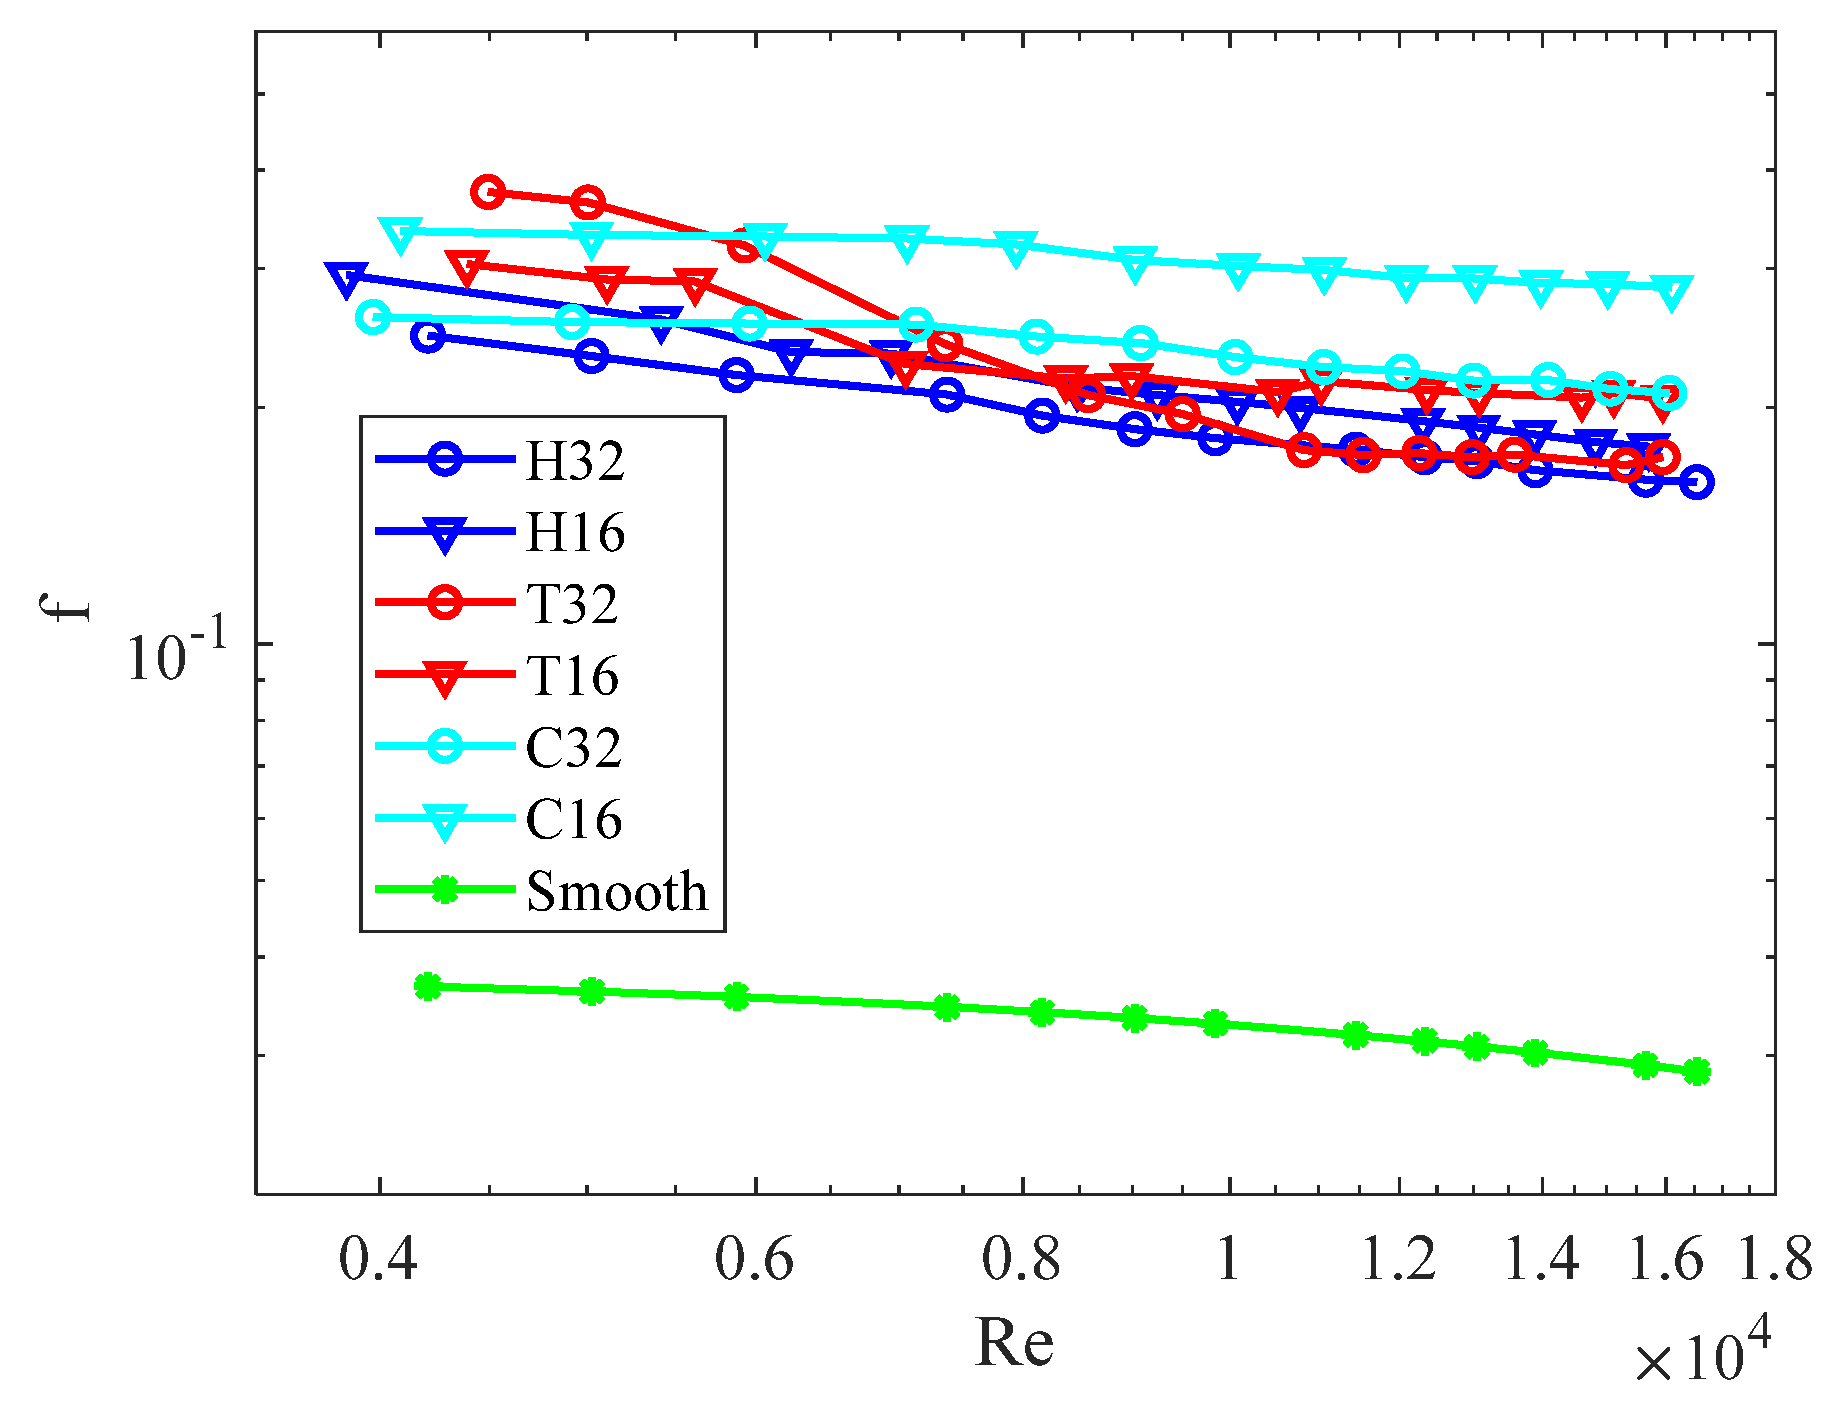
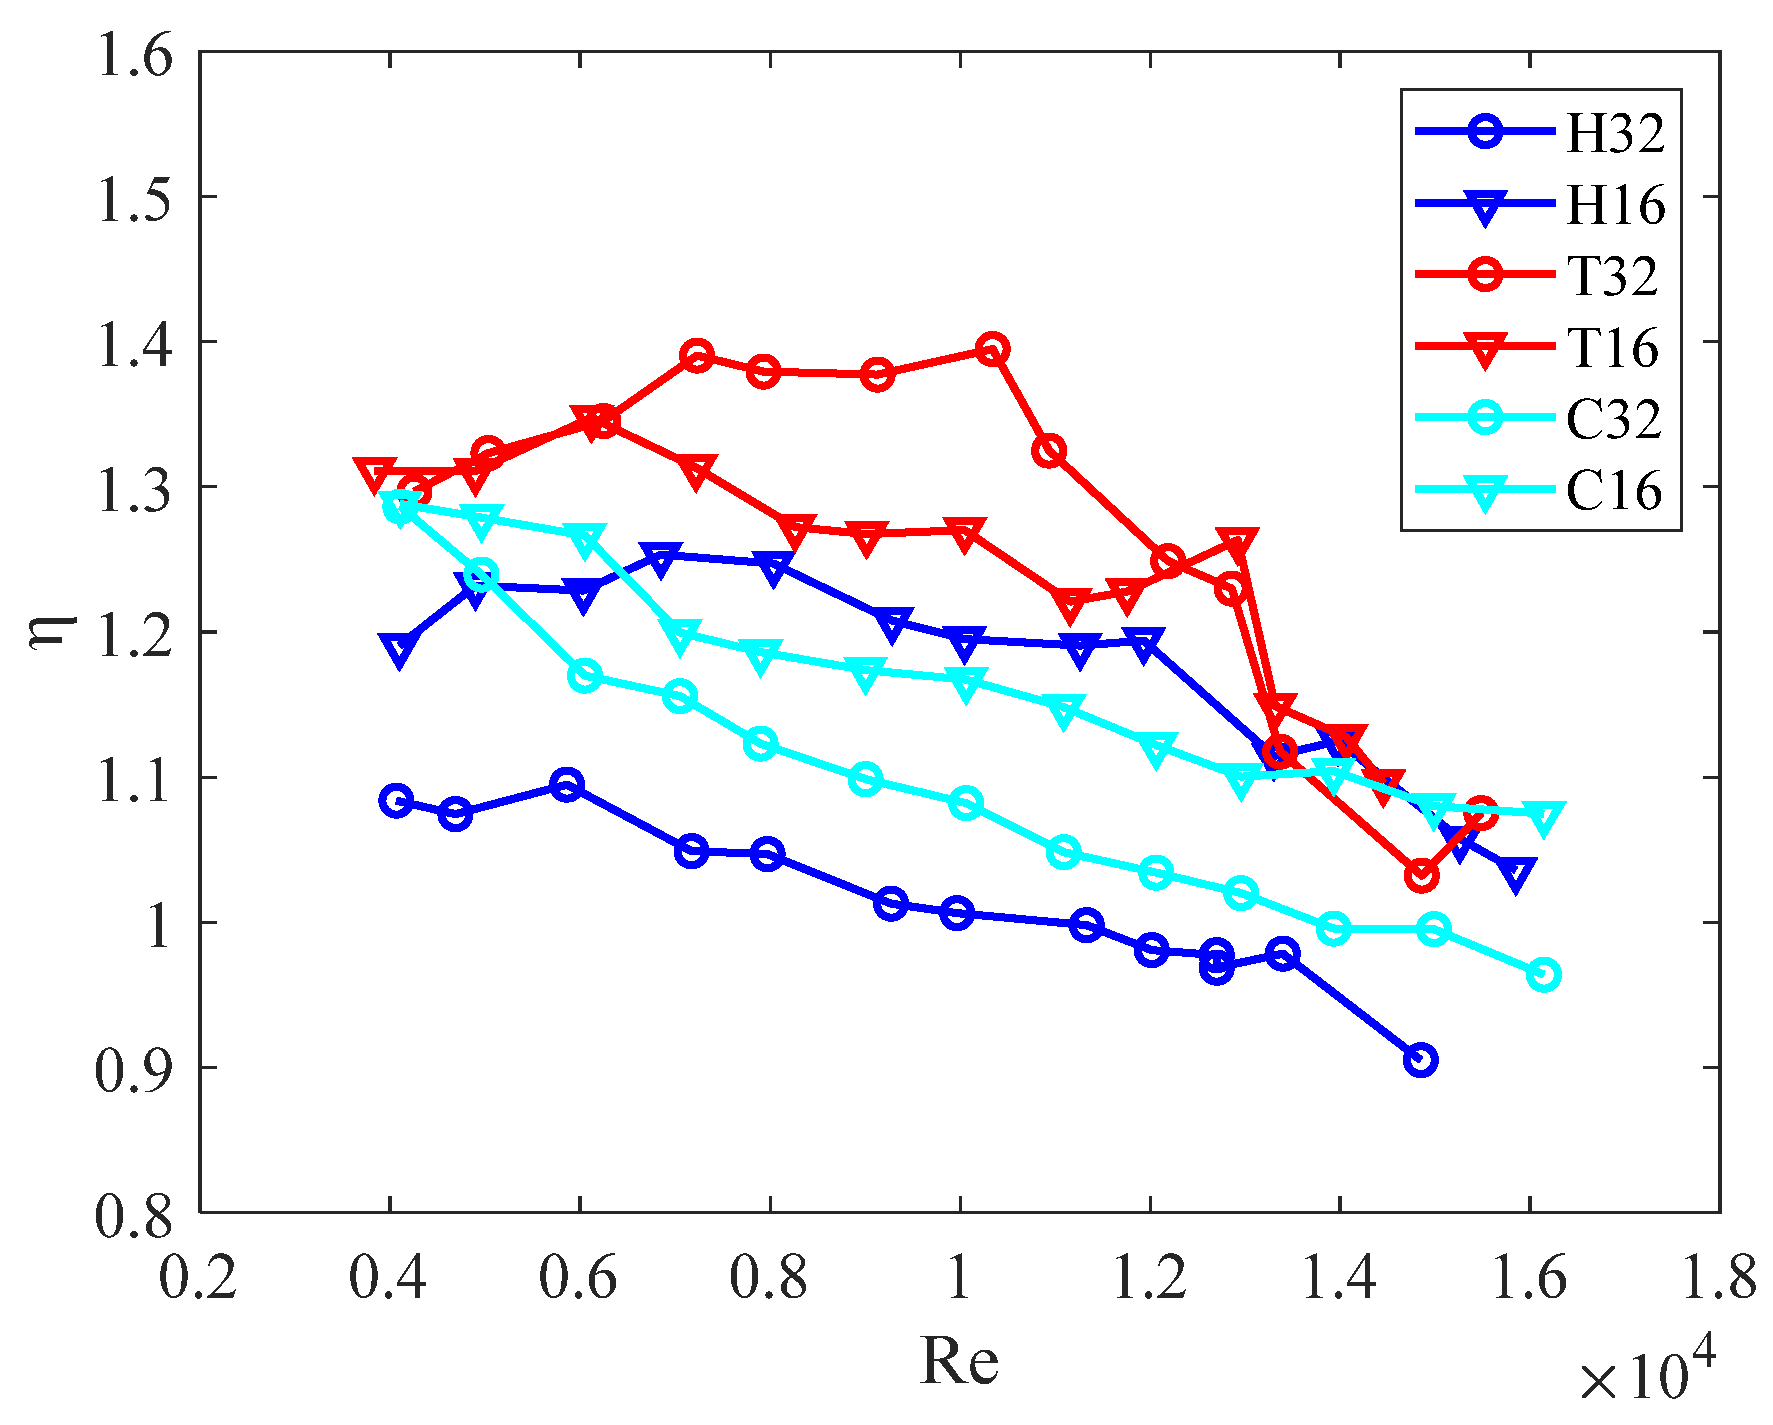
4.1. Average Results
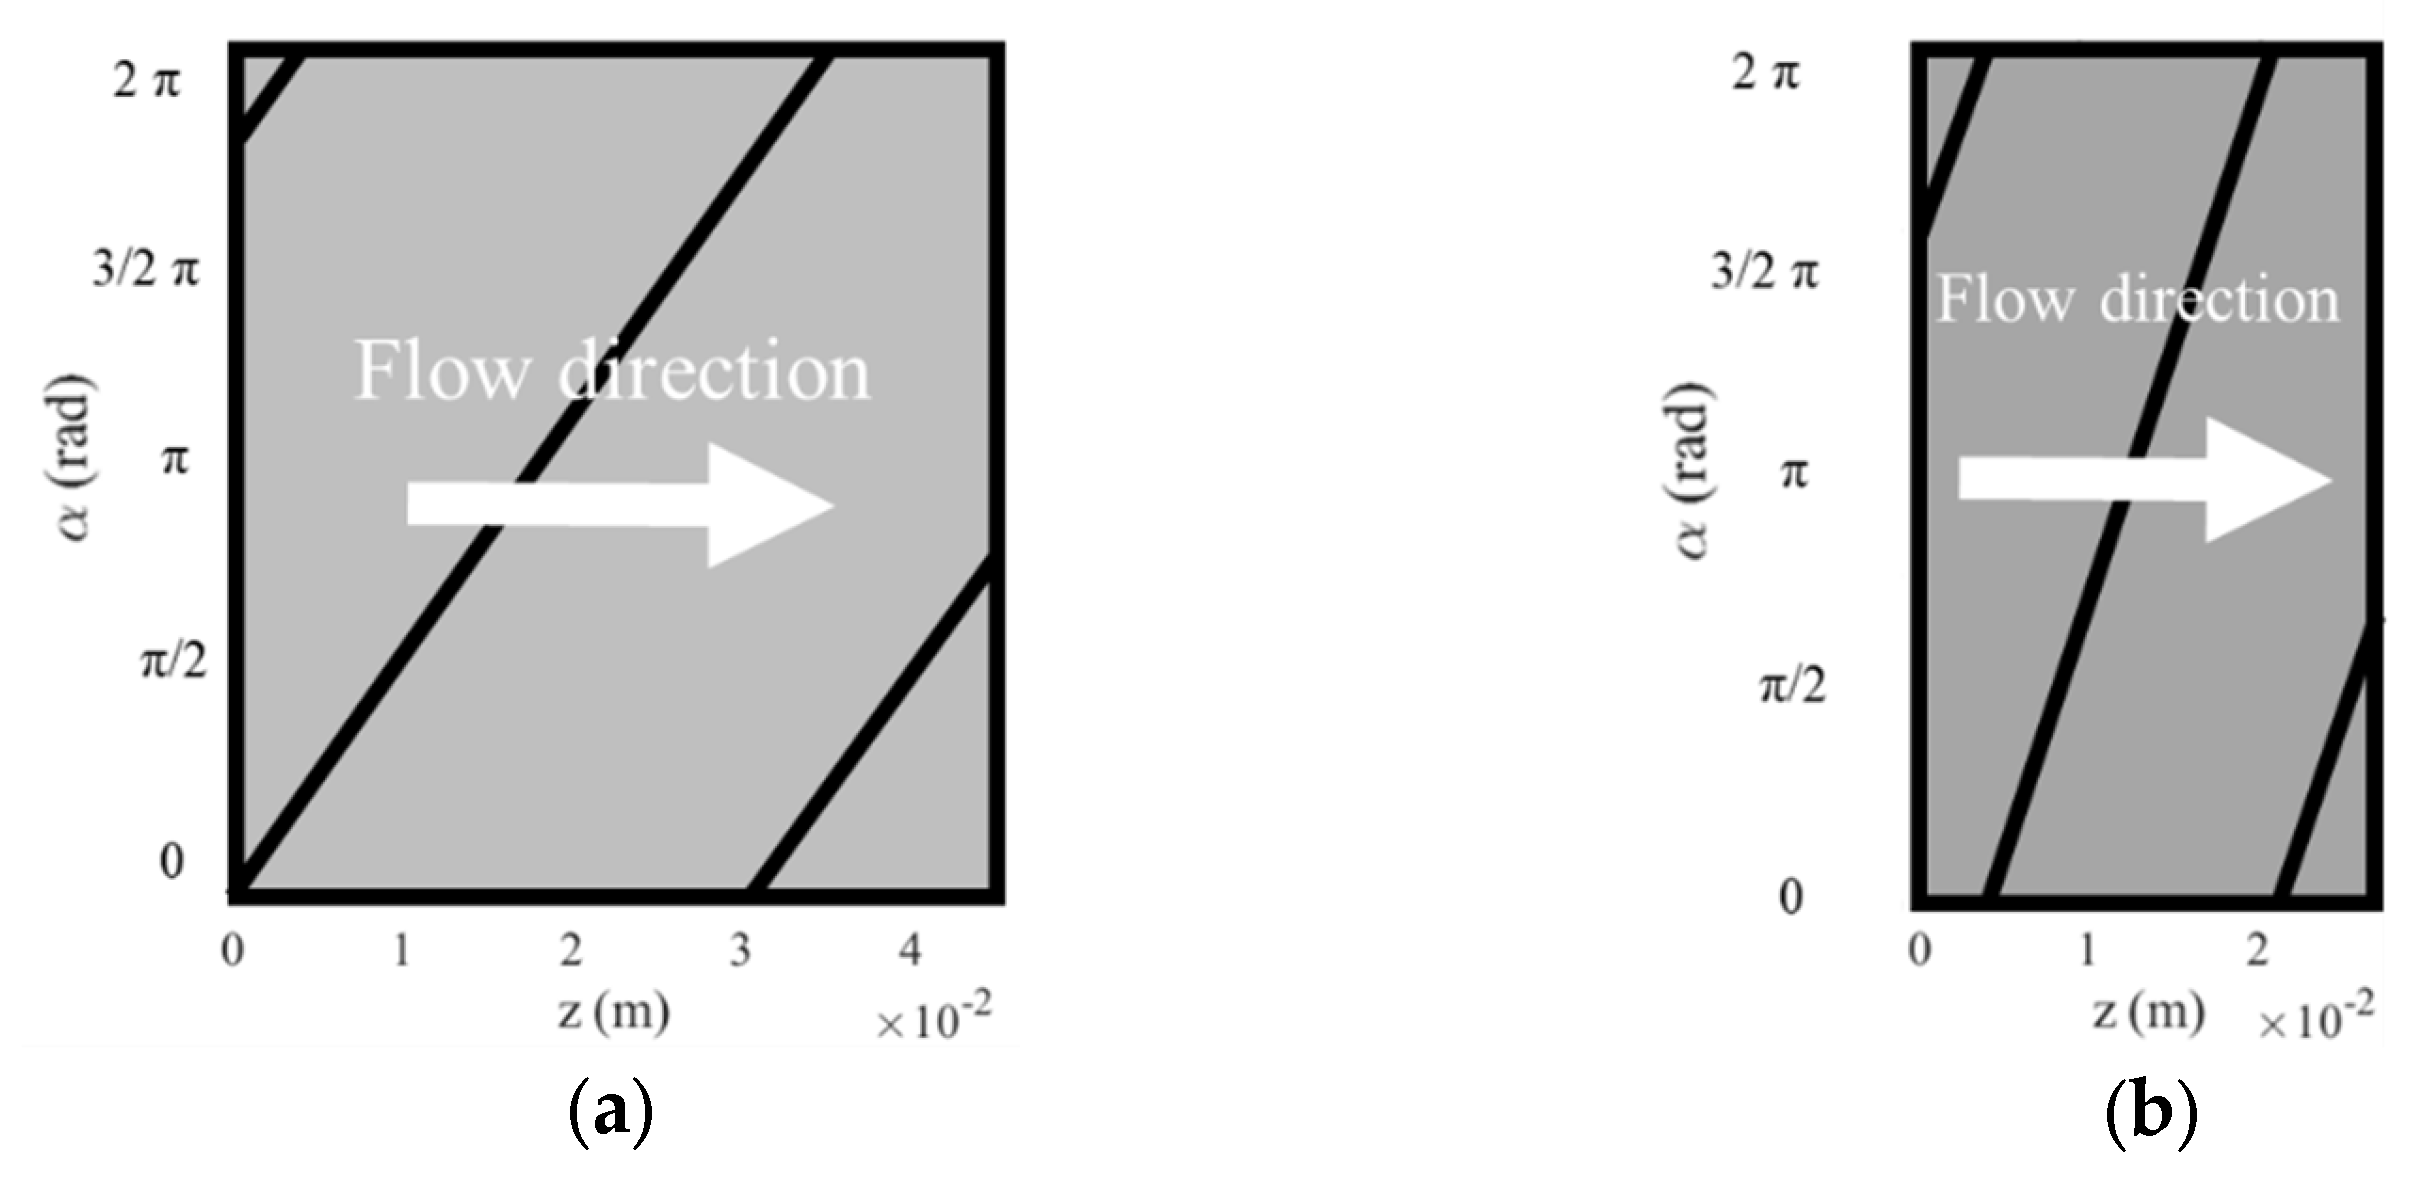
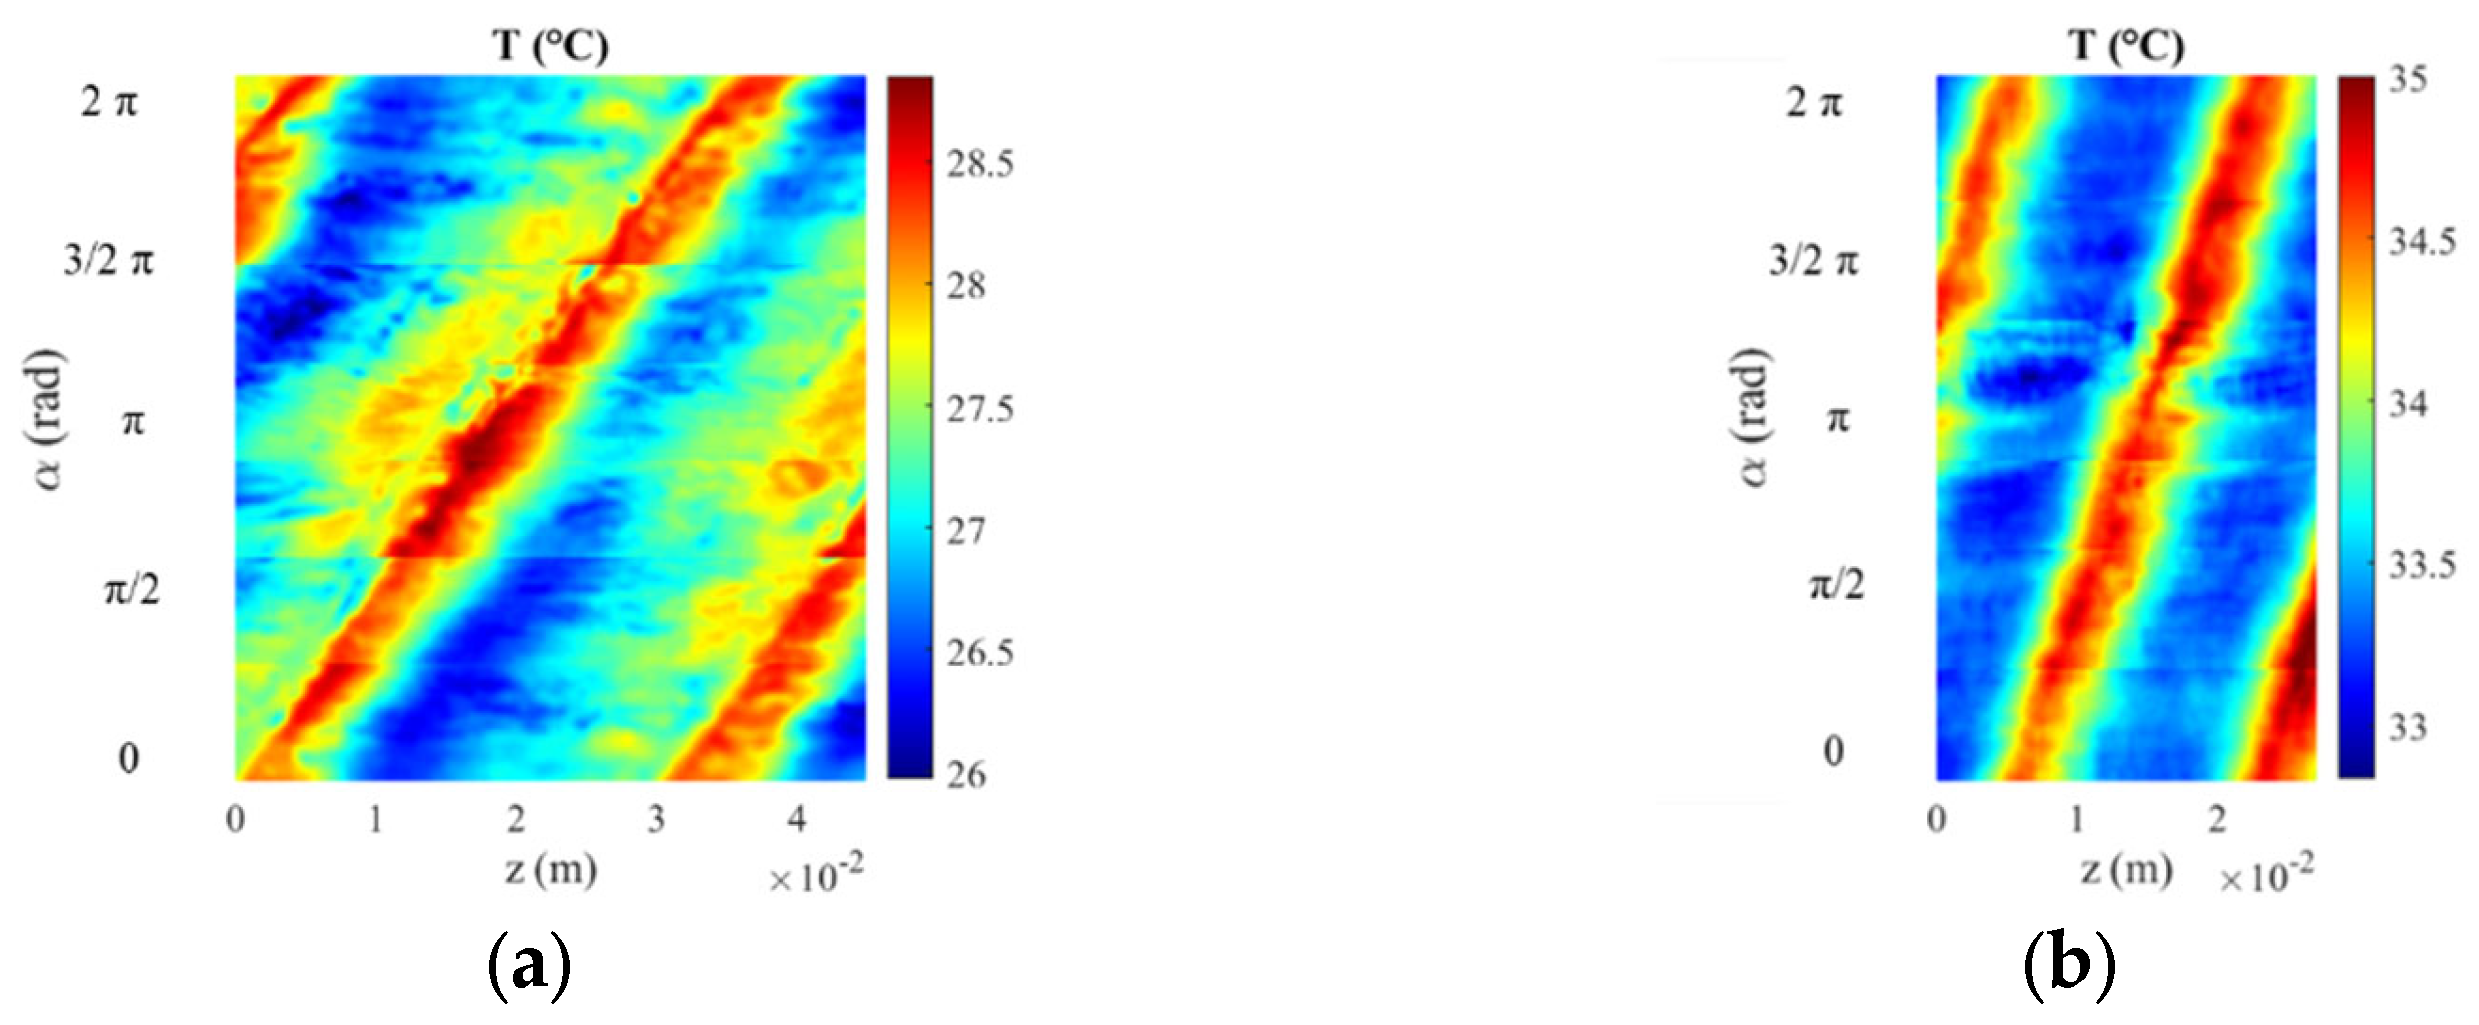
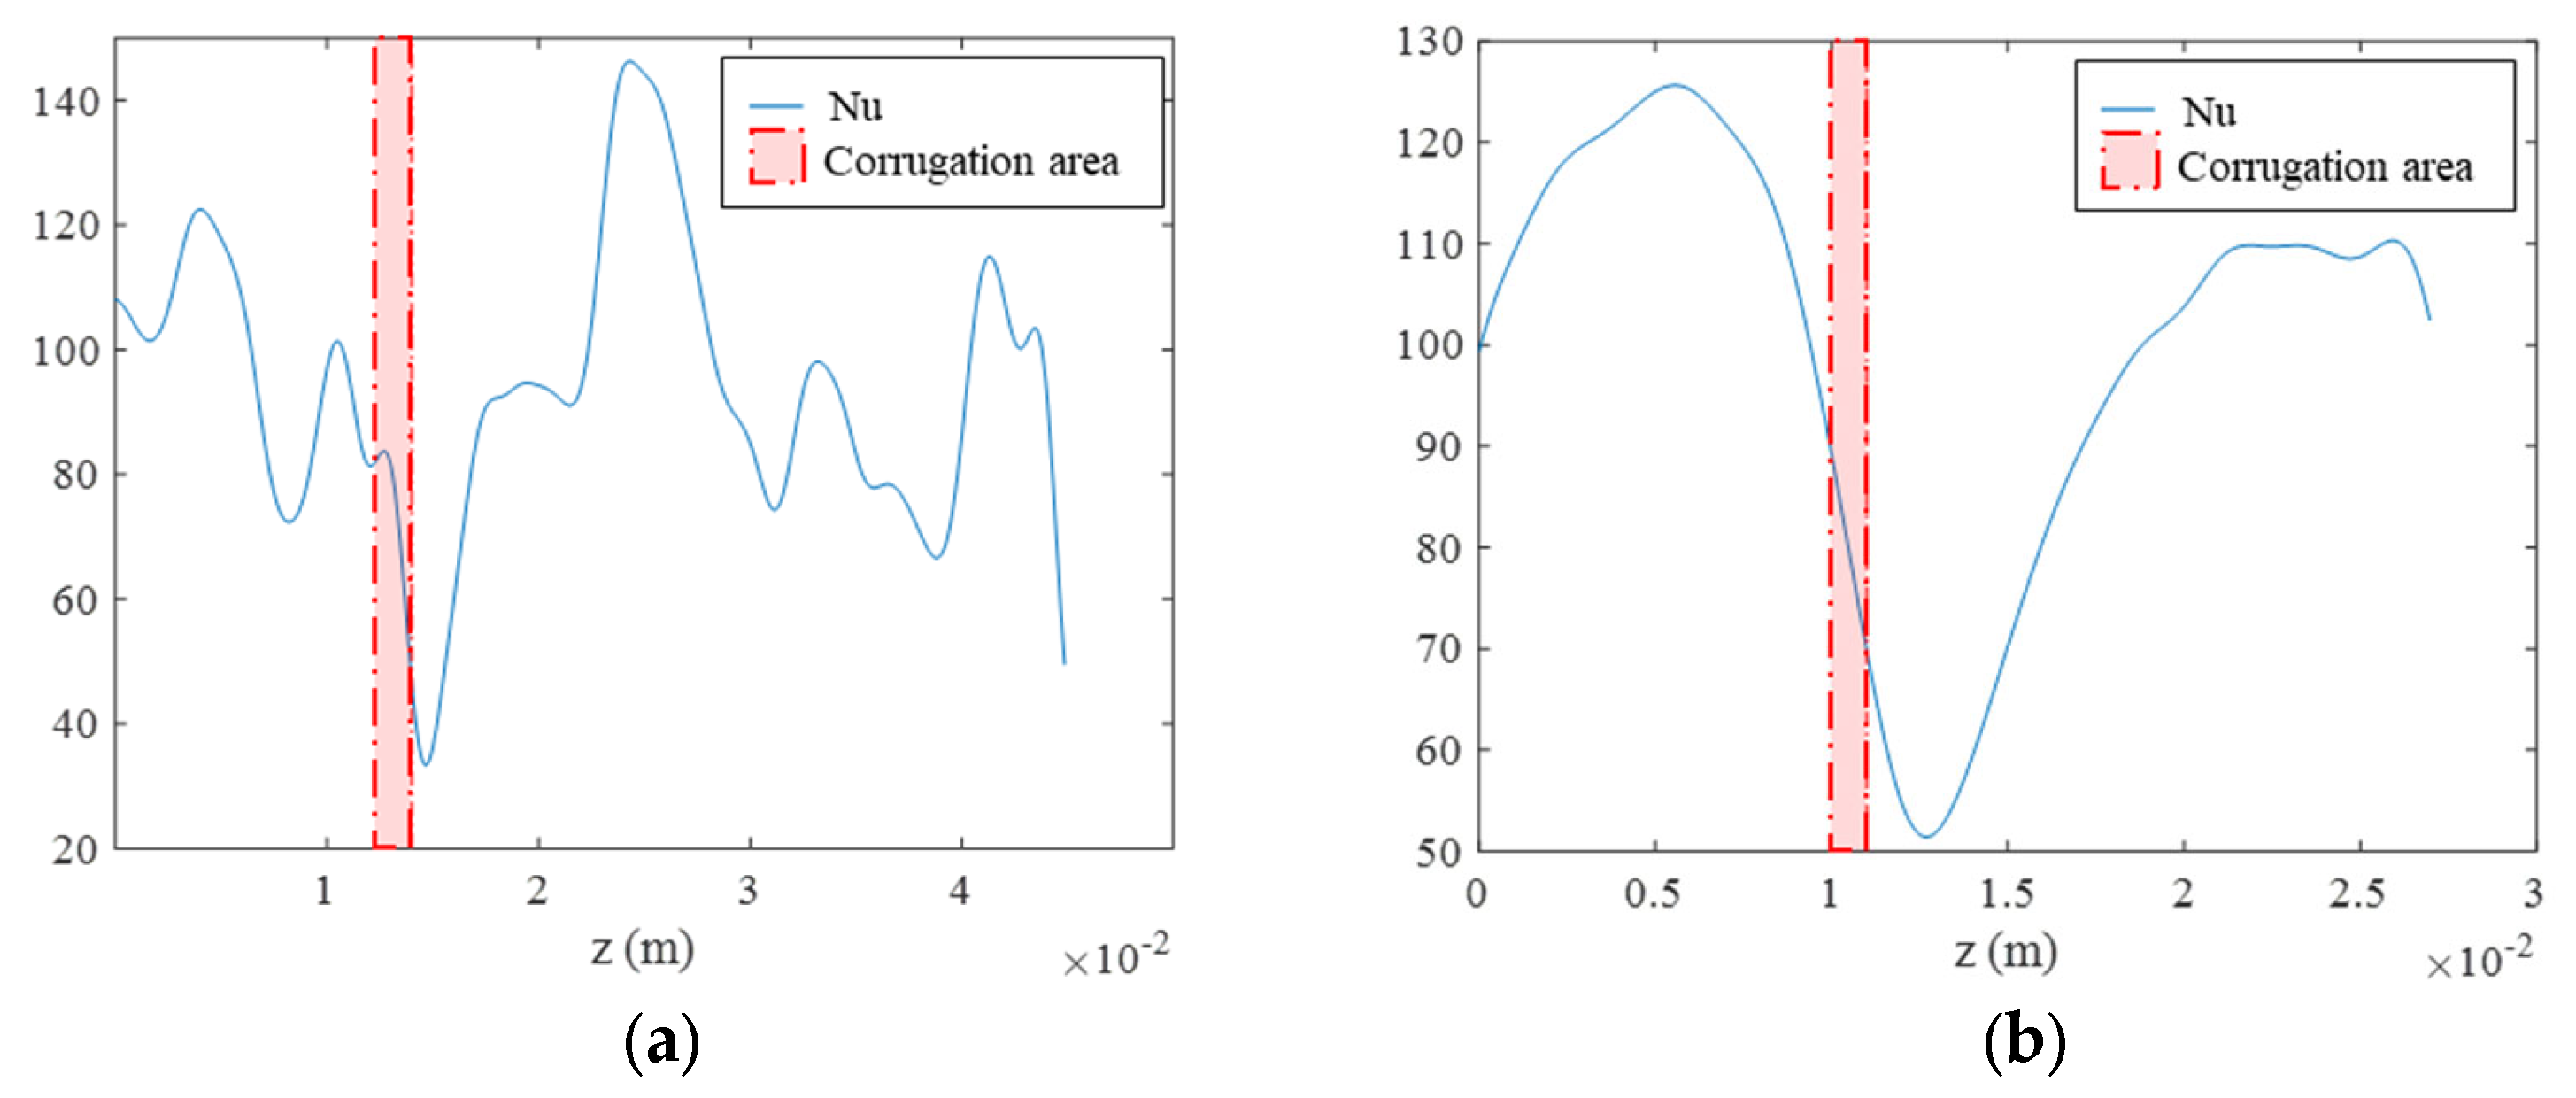
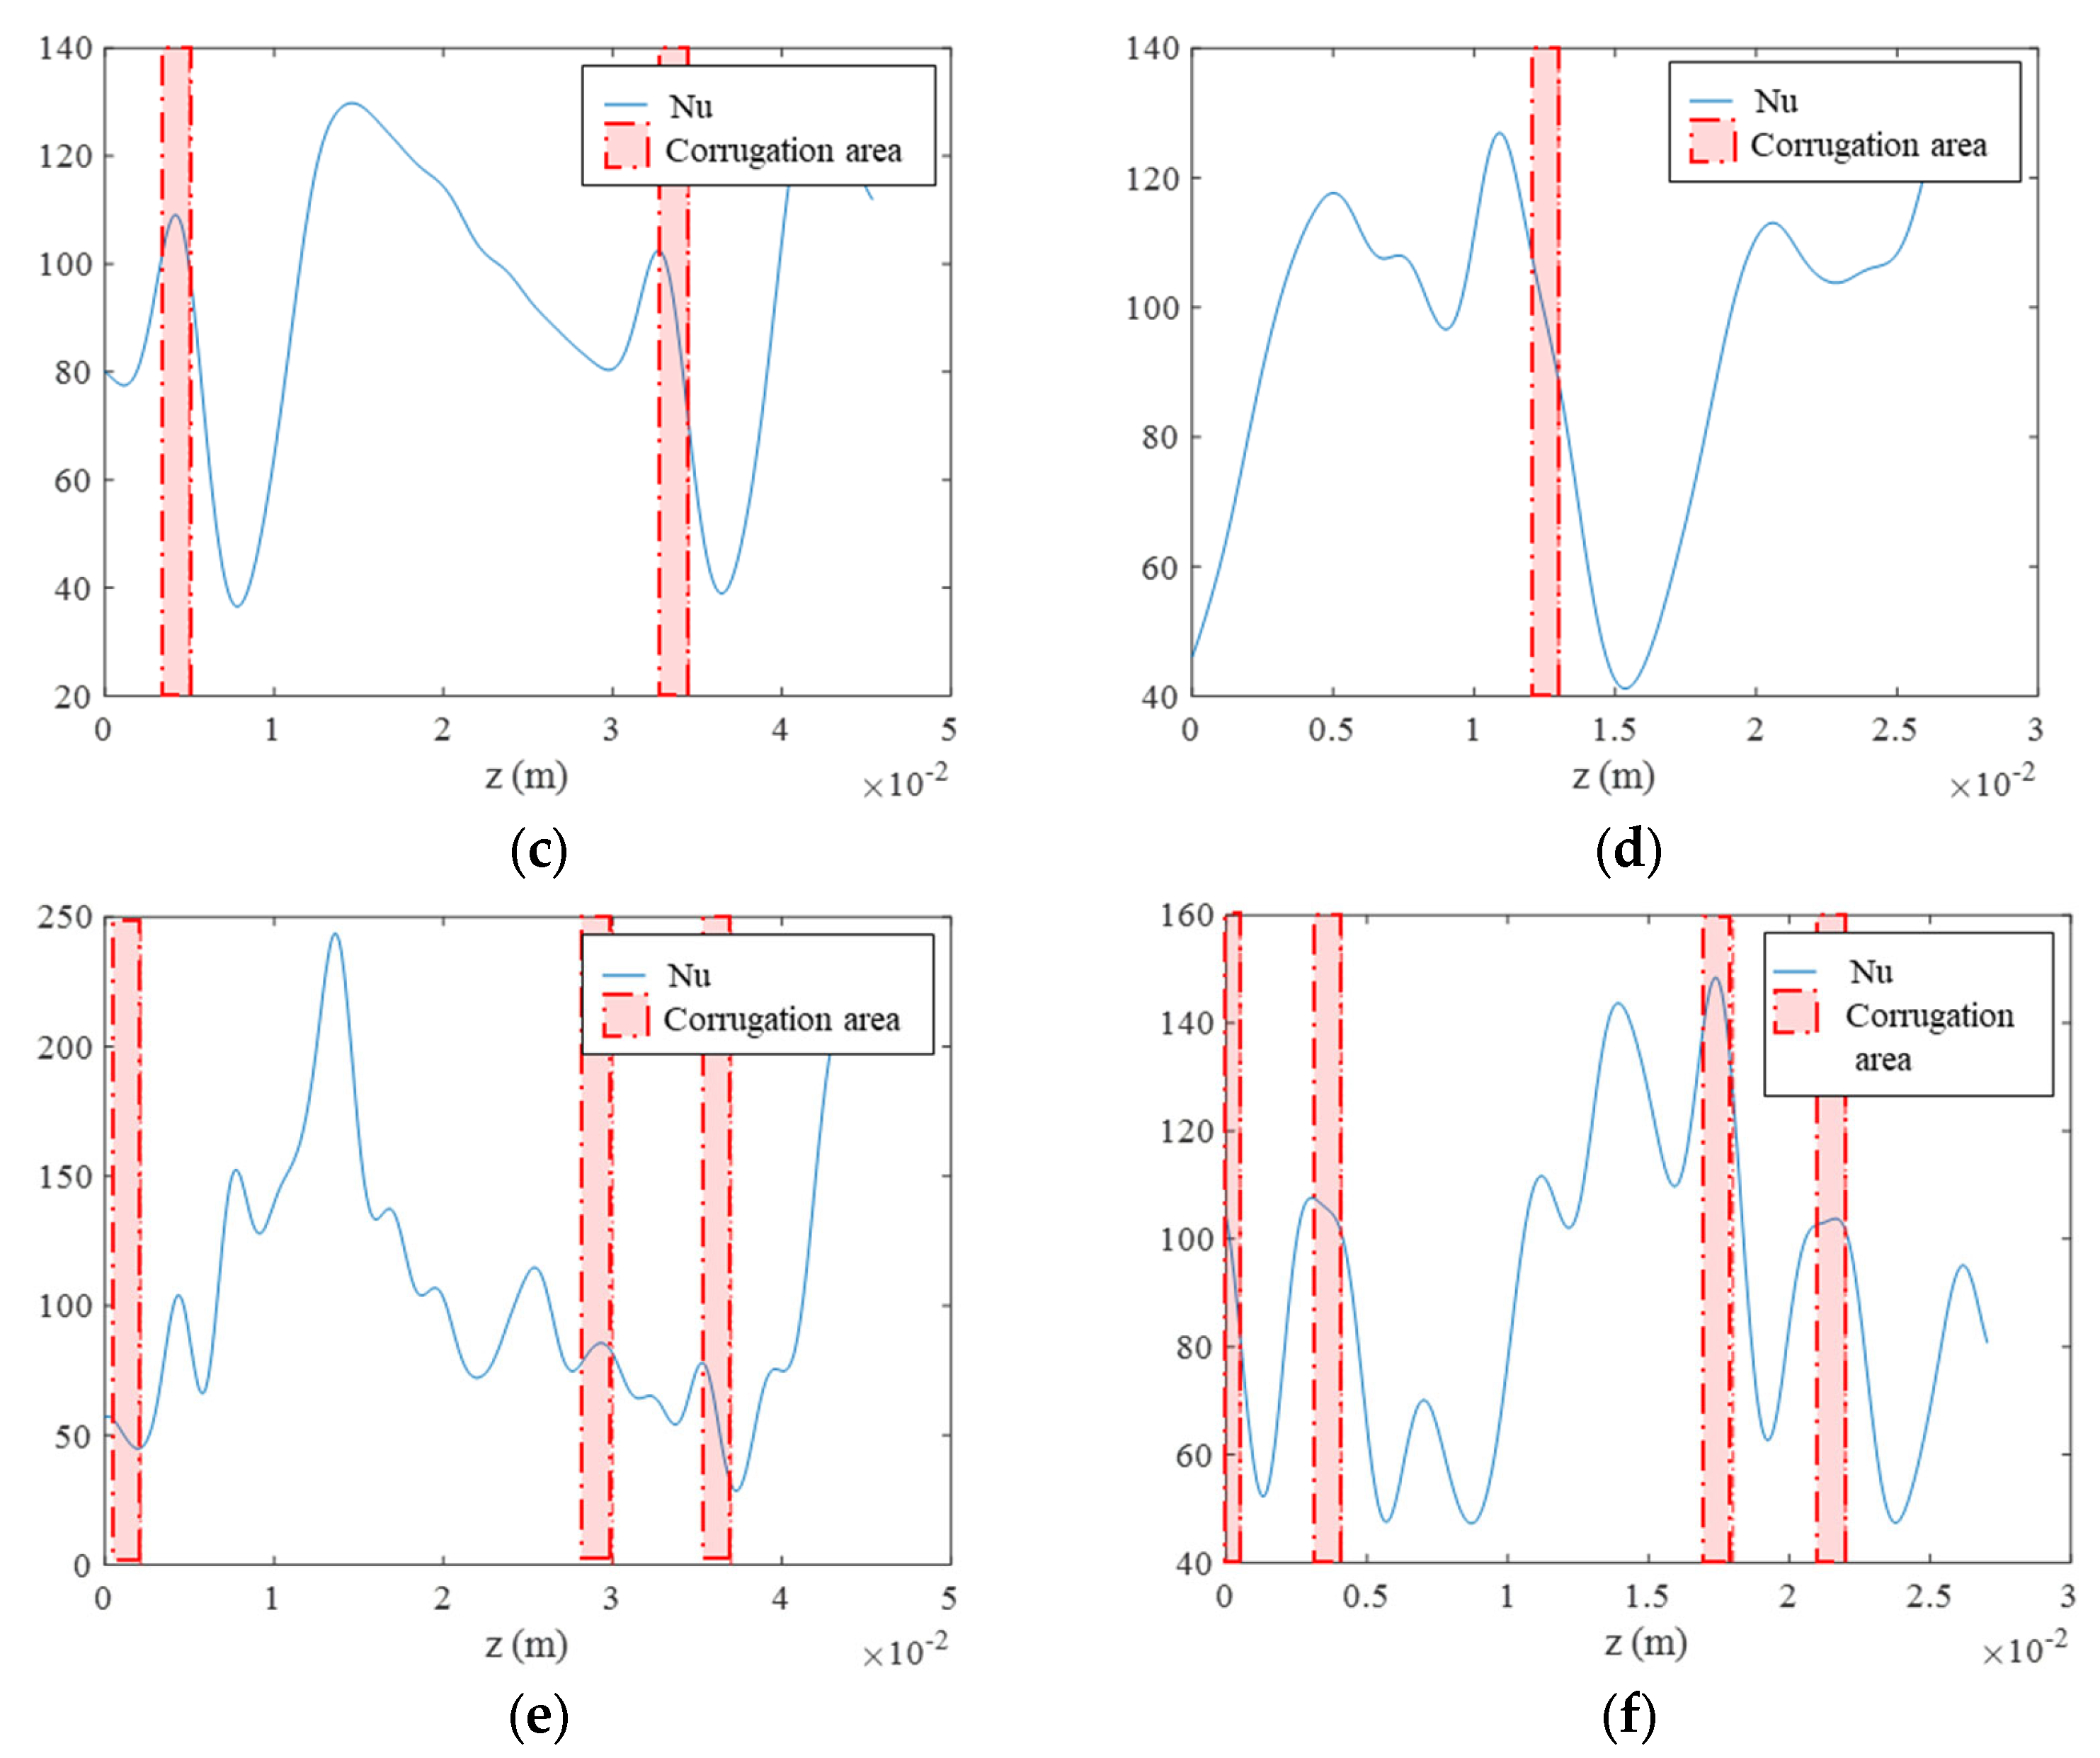
The initial phase of the investigation aimed to assess the average heat transfer capabilities of the tested corrugated pipes and examine the associated pressure drops. The thermal performance of the pipes was evaluated by plotting the Nusselt number against the Reynolds number for each design, as depicted in Figure 9. The plot also included the Nusselt number distribution for a smooth tube, obtained through experimental means, as well as the Dittus–Boelter correlation for smooth pipe operating in turbulent conditions [32]. The good agreement observed between the measured values for the smooth tube and the Dittus–Boelter correlation confirms the reliability of the experimental setup: the experimental values of the Nusselt number obtained for the smooth pipe can be considered in good accordance with the ones calculated with the Dittus–Boelter correlation since the difference is within ±15% which is reported in figure.
From Figure 9, it can be observed that the transverse corrugations T16 and T32, with the cross-helix corrugation C16 with the smaller pitch, exhibited the best thermal performance, achieving Nusselt numbers approximately three times higher than that of the smooth tube and 1.5 times higher than that of the H32 corrugation. Additionally, it can be noted that the pitch size seems to have a significant influence on the thermal performance, mainly in the case of helical geometries, where the smaller pitches (H16 and C16) enhance the thermal effect to a greater extent compared to the larger pitches (H32 and C32), especially at higher Reynolds number values. Overall, all the studied corrugation profiles demonstrated superior heat transfer rates compared to the smooth pipe, highlighting their effectiveness in enhancing thermal performance.
These findings align with the observations made by Rainieri and Pagliarini [10] in laminar conditions where transverse corrugation achieved the best thermal results, demonstrating excellent thermal enhancement capabilities in straight pipes. Regarding the helical corrugation, it was observed that the lower the pitch, the higher the thermal enhancement.
Moreover, the results are consistent with those obtained by Vicente et al. [38] for helical corrugation, by Mohammed et al. [39] for transversal corrugation, and by Bozzoli et al. [40] for cross-helical corrugation, as reported in Figure 10.
Furthermore, Figure 11 illustrates the evaluation of the pressure drop in terms of the Darcy friction factor (f) as a function of the Reynolds number for all the pipes. It can be observed that for Re < 8 × 10³, the helically corrugated pipes exhibited a lower pressure drop compared to the transverse ones. However, for Re > 8 × 10³, the profiles behaved similarly. The cross-helix corrugation C32 showed similar behavior to the helical ones, while the C16 profile demonstrated the worst performance. As expected, all the corrugated pipes had higher values of f compared to the smooth pipe. To assess the effect of the different profiles, the efficiency of the geometry (η) is presented in Figure 12.
It can be observed that, in terms of efficiency (η), for Re < 104, the transverse geometry consistently outperformed the helical profiles, including both the single and cross-helix corrugations. Hence, it can be concluded that although transverse corrugation leads to higher friction factors, its ability to enhance thermal performance makes it more efficient. On the other hand, the H32 geometry exhibited the lowest efficiency across the entire range of tested Reynolds numbers. For Re > 104, the efficiency (η) of all the pipes did not show significant differences, except for the H32 geometry, which remains the least efficient geometry.

4.2. Local Results

To aid in the understanding of the results obtained from the infrared (IR) analysis, Figure 13 provides a schematic representation of the analyzed section of the pipes captured by the IR camera, indicating the position of the corrugations for each tested pipe and the direction of the flow. The portion analyzed to determine the coefficient corresponds to a complete pitch of the corrugation, ensuring a comparable analysis domain for the different corrugation profiles studied.
By analyzing the temperature distribution on the external surface of the tested pipes, an example of which is shown in Figure 14 for the case of Re = 4000, it is evident that the corrugations had a significant influence on the temperature distribution along the pipe wall. For instance, taking the H32 case as an example, it can be observed that immediately after the corrugation, in the direction of flow (as shown in Figure 13), the wall temperature reached a peak. This indicates a reduction in the rate of thermal exchange between the fluid and the wall due to the disruption of the boundary layer caused by the roughness of the corrugation. As the fluid continued along the pipe, the wall temperature suddenly decreased, indicating an increase in the rate of thermal exchange. This phenomenon can be attributed to the reattachment of the fluid to the inner wall of the pipe, leading to increased turbulence. Subsequently, the wall temperature gradually increased until the next corrugation, where the process repeated.
This gradual temperature rise could be attributed to the re-establishment of the fluid’s original turbulent state, with the smooth pipe section acting as a stabilizer for the flow. Similar behavior was observed for the T32 case. However, when examining the temperature distribution for smaller pitches (H16 and T16), the stabilizing effect between the corrugations seemed to diminish. This could be due to the insufficient distance between the corrugations preventing the stabilization effect and resulting in lower and more homogeneous temperatures. These lower and more homogeneous temperatures indicate an increased heat exchange ability in the pipe wall, confirming their superior thermal performance compared to pipes with larger pitch, which is consistent with the average analysis results.
The pipes with cross-helix corrugations (C32 and C16) exhibited more complex temperature distributions due to the combined effect of the two helical corrugations that evolve in opposite directions, promoting a chaotic flow pattern.
Figure 15 presents the restored internal convective heat transfer coefficient (h) at Re = 4 × 10³ for all the pipes. The behavior of h confirms the observations made for the temperature distributions of pipes with transverse and helical corrugations. Immediately after the corrugation, following the flow stream, the value of h reached a minimum and then a maximum. In corrugations with a pitch of 32 mm, h tended to decrease until the next corrugation after reaching a maximum, consistent with the temperature behavior previously observed for these cases. This phenomenon was particularly pronounced in the T32 case.
However, it is important to note that even immediately after the corrugation, the convective heat transfer coefficient was still greater than what can be achieved in a smooth tube. Therefore, it is more appropriate to describe this region as having a lower effect of corrugation on the h values compared to subsequent areas. In the pipes with corrugation pitches of 16 mm (H16 and T16), this intermediate decrease in h between corrugations was not observed (consistent with the temperature distributions), allowing for higher values of h throughout the surface between corrugations and a more homogeneous distribution of convective heat transfer. Regarding homogeneity, the best solution appears to be the pipes with helical and transverse corrugation. In the cross-helically corrugated pipes the chaotic flow distribution caused by the presence of a double helix rib promoted mass transfer in the transversal direction relative to the fluid flow, producing an increase in turbulence that generated higher peaks of h values. For further analysis, Figure 16 presents the local Nusselt number distribution for one angular coordinate (α = π).
Comparing these images with the positions of the corrugations shown in Figure 13, it can be observed that, for all cases, the local Nusselt number suddenly decreased after the corrugation crest (reported in red in Figure 16) and it reached its maximum value in the areas between the corrugations, where the tube wall is still smooth. The comparable homogeneity between helical and transverse corrugation was also confirmed in this case, showing an equivalent ratio between the maximum and minimum values of Nu.
This trend held true for the cases at Re = 104 (Figure 17) and Re = 1.6 × 10⁴ (Figure 18) as well. In conclusion, transverse corrugation seems to outperform helical and cross-helical corrugations in terms of enhancing thermal performance. When comparing the internal convective heat transfer coefficient (h) obtained at the same Re and corrugation pitch, the transverse geometry showed higher values. For a pitch of 32 mm, h values of transverse corrugations showed an average increase of 20% with respect to the helical ones and 10% with respect to the cross helical ones, while for a pitch of 16 mm, there was an average increase of about 22% with respect to the helical ones and 9% with respect to the cross helical ones.
On the other side, the distribution of the local heat transfer coefficient seems to be more uniform in the case of helical corrugation. To provide quantitative data regarding the homogeneity of the h distribution, the standard deviation of all the distributions reported in Figure 14, Figure 16 and Figure 17 was computed. For a pitch of 32 mm, the standard deviation of the h distribution of helical corrugations had an average of 60% and 65% lower than the transversally and cross-helically corrugated pipes, respectively, while for a pitch of 16 mm, it was about 10% lower than transversal one and 30% lower than the cross helical one.
Therefore, in those situations where achieving the highest possible convective heat transfer is the primary requirement, transversally corrugated or cross-helically corrugated ducts with a small pitch will be preferred. On the other hand, helically corrugated pipes are the ideal choice for applications where heating uniformity is crucial. This is particularly relevant in certain food industry applications such as food pasteurization, where an excessively uneven temperature distribution could hinder effective bacteria heat killing or cause localized overheating of the product.
Furthermore, both local and average measurements showed that corrugation, regardless of the specific geometry tested, can effectively enhance the heat transfer capacity of the heat exchanger even under turbulent conditions. As a result, corrugated pipes can also be considered suitable when the food fluid is flowing turbulently and there is a need to increase the heat transfer capability of the process. Additionally, their ease of implementation and affordability make corrugated pipes a valuable tool for both food manufacturers seeking to improve the performance of their existing units and machinery manufacturers aiming to optimize energy and thermal efficiency.

5. Conclusions

In this study, we conducted experimental investigations to analyze the thermal performance of tubes with transversal, helical, and cross-helical corrugation profiles, considering both average and local perspectives. Our analysis of overall performance revealed that transversal and cross-helical corrugations offer the highest enhancement in heat transfer. However, cross-helical profiles demonstrate increased pressure drops and lower overall efficiency. On the other hand, transversal and cross-helical corrugation leads to a more irregular distribution of the convective heat transfer coefficient compared to helical corrugation profiles. Transversally corrugated or cross-helically corrugated ducts with small pitch are the preferred choices when the sole objective is to achieve the highest possible convective heat transfer. Helically corrugated pipes, on the other hand, are suitable for applications where heating uniformity is crucial.
The experimental results obtained from the present investigation are valuable for designing innovative heat exchangers incorporating these types of tubes, especially when the local thermal behavior of the fluid process cannot be ignored; for instance, in the sterilization or pasteurization processes of food products or pharmaceutical applications. In these cases, the knowledge of the local effect of the corrugation on the heat transfer could represent an important tool for reducing the risk of the undertreatment or overtreatment of the product, enhancing its final quality and safety. Moreover, considering the constant rise of energy costs and environmental pollution, the deepened knowledge of the promoting mechanism of the convective heat transfer enhancement allowed by local analysis can be a very useful tool also for improving the energy efficiency of many industrial processes.
Additionally, the results obtained can be utilized to validate numerical models. Another significant outcome of this study is the implementation and testing of a robust experimental approach that can be successfully applied to optimize wall corrugation in critical thermal processes.
Given the interesting results obtained in this work with local IR analysis, the future step to extend this work will be the definition of optimal corrugation geometries to obtain the combined maximization of heat transfer enhancement and homogeneity of the heat flux distribution.

Author Contributions

Conceptualization, M.M. and L.C.; methodology, F.B.; software, L.C. and M.M.; validation, M.W.A.; investigation, M.W.A. and M.M.; data curation, M.M. and L.C.; writing—original draft preparation, L.C., M.M. and M.W.A.; writing—review and editing, F.B. and L.C.; supervision, F.B. All authors have read and agreed to the published version of the manuscript.

Funding

The work was funded under the National Recovery and Resilience Plan (NRRP): Mission 4 Component 2 Investment 1.5—Call for tender No. 3277 of 30/12/2021 of the Italian Ministry of University and Research funded by the European Union—NextGenerationEU (Award Number: Project code ECS00000033, Concession Decree No. 1052 of 23/06/2022 adopted by the Italian Ministry of, CUP D922000460001, “Ecosystem for Sustainable Transition in Emilia-Romagna” (Ecosister)). Mission 4 Component 2 Investment 3.1—Call for tender No. 3264 of 28/12/2021 of the Italian Ministry of University and Research funded by the European Union—NextGenerationEU. Award Number: Project code IR0000033, Concession Decree No. 120 of 21/06/2022 adopted by the Italian Ministry of University and Research, CUP I83C22001040006, Project title “Strengthening of the Italian Research Infrastructure for Metrology and Open Access Data in support to the Agrifood” (METROFOOD-IT). Muhammad Waheed Azam has a PhD fellowship in the framework of PON R&I 2014/2020 (CCI 2014IT16M2OP005), Action IV.5-“PhD on green issues”, funded by the Ministry of University and Research (MUR), Italy, FSE-REACT-EU.

Data Availability Statement

The data presented in this study are available on request from the corresponding author.

Acknowledgments

The authors would also like to thank MBS S.r.l. for its support in the realization of the experimental setup.

Conflicts of Interest

The authors declare no conflict of interest.

Nomenclature

cpFluid specific heat at constant pressureJ·kg−1 K−1
DoTube outer diameterm
DiTube internal diameterm
eCorrugation depthm
fDarcy friction factor-
hConvective heat transfer coefficientW·m−2K−1
lCorrugation pitchm
LLength of pipem
NuNusselt number-
pPressurePa
rRadial coordinatem
PrPrandlt number, Pr = (cp·μ)/λ-
qHeat flux exchanged per unit surfaceW·m−2
qgInternal heat generation per unit volumeW·m−3
ReReynolds number-
RenvOverall heat transfer resistance between the external wall tube and the surrounding environment-
tWall thicknessm
TTemperature
xAxial coordinatem
wMean fluid axial velocitym/s
Greek Symbols
αAngular coordinaterad
εfFriction factor enhancement-
εhHeat transfer enhancement-
ηEnhancement efficiency-
λThermal conductivityW·m−1·K−1
μDynamic viscosityPa·s
νKinematic viscosityms−1
ρDensitykg·m−3
Subscripts
bBulk
eEnhanced geometry
envEnvironment
iInlet section
wWall
xLocal value along the curvilinear coordinate x
0Reference geometry
Superscripts
  ¯ Averaged

References

  1. Shank, K.; Tiari, S. A Review on Active Heat Transfer Enhancement Techniques within Latent Heat Ther-mal Energy Storage Systems. Energies 2023, 16, 4165. [Google Scholar] [CrossRef]
  2. Ajarostaghi, S.S.M.; Zaboli, M.; Javadi, H.; Badenes, B.; Urchueguia, J.F. A Review of Recent Passive Heat Transfer Enhancement Methods. Energies 2022, 15, 986. [Google Scholar] [CrossRef]
  3. Webb, R.L. Principles of Enhanced Heat Transfer; Routledge: London, UK, 1994. [Google Scholar]
  4. Thulukkanam, K. Heat Exchanger Design Handbook; CRC Press: Boca Raton, FL, USA, 2013. [Google Scholar]
  5. Kareem, Z.S.; Jaafar, M.M.; Lazim, T.M.; Abdullah, S.; Abdulwahid, A.F. Passive heat transfer enhancement review in corrugation. Exp. Therm. Fluid Sci. 2015, 68, 22–38. [Google Scholar] [CrossRef]
  6. Hong, K.-B.; Kim, D.-W.; Kwark, J.; Nam, J.-S.; Ryou, H.-S. Numerical Study on the Effect of the Pipe Groove Height and Pitch on the Flow Characteristics of Corrugated Pipe. Energies 2021, 14, 2614. [Google Scholar] [CrossRef]
  7. Chen, C.; Wu, Y.-T.; Wang, S.-T.; Ma, C.-F. Experimental investigation on enhanced heat transfer in transversally corrugated tube with molten salt. Exp. Therm. Fluid Sci. 2013, 47, 108–116. [Google Scholar] [CrossRef]
  8. Bozzoli, F.; Pagliarini, S.R.G.; Vocale, P.; Mocerino, A. Second principal approach to the analysis of un-steady flow and heat transfer in a tube with arc- shaped corrugation. J. Phys. Conf. Ser. 2016, 755, 011001. [Google Scholar] [CrossRef]
  9. Ahmad, F.; Mahmud, S.; Ehsan, M.M.; Salehin, M. Thermo-hydrodynamic performance evaluation of double-dimpled corrugated tube using single and hybrid nanofluids. Int. J. Thermofluids 2023, 17, 100283. [Google Scholar] [CrossRef]
  10. Qin, S.-Y.; Xiao, H.; Xiao, Y.; Liu, P.; Zhou, F.-Y.; Liu, W.; Liu, Z.-C.; Shan, F. Experimental investigation of the coherent struc-tures in a spirally corrugated pipe. Int. J. Heat Fluid Flow 2020, 84, 108601. [Google Scholar] [CrossRef]
  11. Li, X.; Liu, S.; Mo, X.; Sun, Z.; Tian, G.; Xin, Y.; Zhu, D. Investigation on Convection Heat Transfer Augment in Spirally Corrugated Pipe. Energies 2023, 16, 1063. [Google Scholar] [CrossRef]
  12. Bilen, K.; Cetin, M.; Gul, H.; Balta, T. The investigation of groove geometry effect on heat transfer for internally grooved tubes. Appl. Therm. Eng. 2009, 29, 753–761. [Google Scholar] [CrossRef]
  13. Zhang, L.; Duan, R.; Che, Y.; Lu, Z.; Cui, X.; Wei, L.; Jin, L. A numerical analysis of fluid flow and heat transfer in wavy and curved wavy channels. Int. J. Therm. Sci. 2021, 171, 107248. [Google Scholar] [CrossRef]
  14. Mateo-Gabín, A.; Chávez, M.; Garicano-Mena, J.; Valero, E. Wavy walls, a passive way to control the transi-tion to turbulence. detailed simulation and physical explanation. Energies 2021, 14, 3937. [Google Scholar] [CrossRef]
  15. Al-Obaidi, A.R.; Alhamid, J. Investigation of flow pattern, thermohydraulic performance and heat transfer improvement in 3D corrugated circular pipe under varying structure configuration parameters with development different correlations. Int. Commun. Heat Mass Transf. 2021, 126, 105394. [Google Scholar] [CrossRef]
  16. Al-Obaidi, A.R. Investigation on effects of varying geometrical configurations on thermal hydraulics flow in a 3D corrugated pipe. Int. J. Therm. Sci. 2022, 171, 107237. [Google Scholar] [CrossRef]
  17. Rinaldi, M.; Malavasi, M.; Cordioli, M.; Barbanti, D. Computation fluid dynamics design of a plate fin heat exchanger with different transverse vortex generators for food processing. J. Food Process. Eng. 2019, 42, e13140. [Google Scholar] [CrossRef]
  18. Duda, P. Heat Transfer Coefficient Distribution—A Review of Calculation Methods. Energies 2023, 16, 3683. [Google Scholar] [CrossRef]
  19. Beck, J.V.; Balckwell, B.; Clair, C.R., Jr. Inverse Heat Conduction—Ill-Posed Problems; John Wiley & Sons Inc.: New York, NY, USA, 1985. [Google Scholar]
  20. Rogalski, A. Recent progress in infrared detector technologies. Infrared Phys. Technol. 2011, 54, 136–154. [Google Scholar] [CrossRef]
  21. Rainieri, S.; Bozzoli, F.; Pagliarini, G. Characterization of an uncooled infrared thermographic system suitable for the solution of the 2-D inverse heat conduction problem. Exp. Therm. Fluid Sci. 2008, 32, 1492–1498. [Google Scholar] [CrossRef]
  22. Murio, A.D. The Mollification Method and the Numerical Solution of Ill-Posed Problems; John Wiley and Sons: New York, NY, USA, 1993. [Google Scholar]
  23. Cattani, L.; Maillet, D.; Bozzoli, F.; Rainieri, S. Estimation of the local convective heat transfer coefficient in pipe flow using a 2D thermal Quadrupole model and Truncated Singular Value Decomposition. Int. J. Heat Mass Transf. 2015, 91, 1034–1045. [Google Scholar] [CrossRef]
  24. Xiong, P.; Qiu, Z.; Lu, Q.; Lu, T.; Deng, J.; Liu, Y.; Zhang, Y. Simultaneous estimation of fluid temperature and convective heat transfer coefficient by sequential function specification method. Prog. Nucl. Energy 2020, 131, 103588. [Google Scholar] [CrossRef]
  25. Delpueyo, D.; Balandraud, X.; Grédiac, M. Heat source reconstruction from noisy temperature fields using an opti-mised derivative Gaussian filter. Infrared Phys. Technol. 2013, 60, 312–322. [Google Scholar] [CrossRef]
  26. Colaço, M.J.; Alves, C.J.; Bozzoli, F. The reciprocity function approach applied to the non-intrusive estimation of spatially varying internal heat transfer coefficients in ducts: Numerical and experimental results. Int. J. Heat Mass Transf. 2015, 90, 1221–1231. [Google Scholar] [CrossRef]
  27. Ngendahayo, J.P.; Niyobuhungiro, J.; Berntsson, F. Estimation of surface temperatures from interior measurements using Tikhonov regularization. Results Appl. Math. 2021, 9, 100140. [Google Scholar] [CrossRef]
  28. Bozzoli, F.; Cattani, L.; Pagliarini, G.; Rainieri, S. Infrared image filtering applied to the restoration of the convective heat transfer coefficient distribution in coiled tubes. Opto-Electron. Rev. 2015, 23, 107–115. [Google Scholar] [CrossRef]
  29. Carlomagno, G.M.; Cardone, G. Infrared thermography for convective heat transfer measurements. Exp. Fluids 2010, 49, 1187–1218. [Google Scholar] [CrossRef]
  30. Bergman, T.L.; Incropera, F.P.; DeWitt, D.P.; Lavine, A.S. Fundamentals of Heat and Mass Transfer; John Wiley & Sons: Hoboken, NJ, USA, 2011. [Google Scholar]
  31. Zimparov, V. Extended performance evaluation criteria for enhanced heat transfer surfaces: Heat transfer through ducts with constant heat flux. Int. J. Heat Mass Transf. 2001, 44, 169–180. [Google Scholar] [CrossRef]
  32. Yilmaz, M.; Sara, O.; Karsli, S. Performance evaluation criteria for heat exchangers based on second law analysis. Exergy Int. J. 2001, 1, 278–294. [Google Scholar] [CrossRef]
  33. Astarita, T.; Carlomagno, G.M. Infrared Thermography for Thermo-Fluid-Dynamics; Springer: Berlin/Heidelberg, Germany, 2013; ISBN 9783642295072. [Google Scholar]
  34. Bozzoli, F.; Cattani, L.; Rainieri, S. Effect of wall corrugation on local convective heat transfer in coiled tubes. Int. J. Heat Mass Transf. 2016, 101, 76–90. [Google Scholar] [CrossRef]
  35. Beck, J. Inverse Heat Conduction Ill-Posed Problems; John Wiley & Sons: Hoboken, NJ, USA, 2011; pp. 137–157, 179–180, 198–211. [Google Scholar]
  36. Morozov, V.A. Methods for Solving Incorrectly Posed Problems; Springer: Berlin/Heidelberg, Germany, 1984; ISBN 9780387960593. [Google Scholar]
  37. Bevington, P.R. Data Reduction and Error Analysis for the Physical Sciences; McGraw-Hill: New York, NY, USA, 1969. [Google Scholar]
  38. Vicente, P.G.; Garcıa, A.; Viedma, A. Experimental investigation on heat transfer and frictional characteristics of spirally corrugated tubes in turbulent flow at different Prandtl numbers. Int. J. Heat Mass Transf. 2004, 47, 671–681. [Google Scholar] [CrossRef]
  39. Mohammed, H.; Abbas, A.K.; Sheriff, J. Influence of geometrical parameters and forced convective heat transfer in transversely corrugated circular tubes. Int. Commun. Heat Mass Transf. 2013, 44, 116–126. [Google Scholar] [CrossRef]
  40. Bozzoli, F.; Cattani, L.; Rainieri, S. Cross-helix corrugation: The optimal geometry for effective food thermal processing. Int. J. Heat Mass Transf. 2020, 147, 118874. [Google Scholar] [CrossRef]
Figure 1. Photo of the tested corrugated pipes: (a) T32, (b) T16, (c) H32, (d) H16, (e) C32, and (f) C16.
Energies 16 07181 g001aEnergies 16 07181 g001b
Figure 2. Schematic representation of the experimental setup.
Energies 16 07181 g002
Figure 3. Detail of the corrugated pipe inlet (and outlet) section.
Energies 16 07181 g003
Figure 4. Sketch of the infrared thermographic system arrangement.
Energies 16 07181 g004
Figure 5. A representative infrared image of one of the six pictures (labelled A–F) captured around the external surface of the test section (a) and scheme of the unwrapped six images, with references for reconstructing the external surface of the corrugated pipe (b).
Energies 16 07181 g005
Figure 6. Example of a reconstructed external surface after the merging operation.
Energies 16 07181 g006
Figure 7. Geometrical domain with a coordinate system.
Energies 16 07181 g007
Figure 8. Sketch of a portion of the test section.
Energies 16 07181 g008
Figure 9. Nusselt number vs. Reynolds number.
Energies 16 07181 g009
Figure 10. Comparison of the experimental results with those previously obtained in the literature for helical (a), transversal (b), and cross-helical corrugations (c).
Energies 16 07181 g010aEnergies 16 07181 g010b
Figure 11. Friction factor vs. Reynolds number.
Energies 16 07181 g011
Figure 12. Efficiency η vs. Reynolds number.
Energies 16 07181 g012
Figure 13. Corrugation position and flow direction in tested pipes: (a) H32, (b) H16, (c) T32, (d) T16, (e) C32, and (f) C16.
Energies 16 07181 g013aEnergies 16 07181 g013b
Figure 14. Non-filtered temperature distributions at Re = 4000: (a) H32, (b) H16, (c) T32, (d) T16, (e) C32, and (f) C16.
Energies 16 07181 g014aEnergies 16 07181 g014b
Figure 15. Convective heat transfer distribution (h) at Re = 4000. (a) H32, (b) H16, (c) T32, (d) T16, (e) C32, and (f) C16.
Energies 16 07181 g015aEnergies 16 07181 g015b
Figure 16. Nu at α = π as a function of z at Re = 4000. (a) H32, (b) H16, (c) T32, (d) T16, (e) C32, and (f) C16.
Energies 16 07181 g016aEnergies 16 07181 g016b
Figure 17. Convective heat transfer distribution (h) at Re= 10000. (a) T32, (b) T16, (c) H32, (d) H16, (e) C32, and (f) C16.
Energies 16 07181 g017
Figure 18. Convective heat transfer distribution (h) at Re = 16,000. (a) T32, (b) T16, (c) H32, (d) H16, (e) C32, and (f) C16.
Energies 16 07181 g018
Table 1. Dimensions of the studied corrugated pipes.
Pipe
Name
Corrugation ProfilePitch (p)
(mm)
Depth (e)
(mm)
Di (mm)Do (mm)
T32Transversal3211416
T16Transversal1611416
H32Helical3211416
H16Helical1611416
C32Cross-helix3211416
C16Cross-helix1611416
Table 2. The uncertainty of the main physical quantities involved in the estimation procedure.
T {K}ΔT {K}ρ {kg/m3}µ {Pa·s}Di {m}qg {W/m3} V ˙ {m3/s}Δp {Pa}
±0.1±0.2±1%±1%±2%±3% ± 1 % ±3%
Disclaimer/Publisher’s Note: The statements, opinions and data contained in all publications are solely those of the individual author(s) and contributor(s) and not of MDPI and/or the editor(s). MDPI and/or the editor(s) disclaim responsibility for any injury to people or property resulting from any ideas, methods, instructions or products referred to in the content.

