Abstract
This study, conducted as part of the ROCCS project, investigates the potential of coal seams for CO2 sequestration through in situ tests. The in situ tests, performed at Experimental Mine Barbara in Mikołów, Poland, involved injecting CO2 through a horizontal well into a coal seam, with variable well lengths and injection parameters. The experiments included monitoring for CO2 leakage and migration within the coal seam. The objective was to examine the correlation between the CO2 injection rate and the coal–CO2 contact area, monitoring for any potential leakage. The total mass of CO2 injected was about 7700 kg. Significant leakage, probably due to the formation of preferential pathways, prevented pressure buildup in the injection well. The results provide insights into challenges regarding CO2 injection into coal seams, with implications for the design of commercial-scale CO2 storage installations.
1. Introduction
Climate change has become an increasingly pressing concern, with human activities emitting large amounts of greenhouse gases, leading to global warming and its associated consequences [1]. Governments and organizations worldwide have recognized the necessity for action to mitigate climate change. The European Union, for instance, has developed the EU Green Deal to make Europe climate neutral by 2050 [2]. One of the essential methods to reduce the amount of CO2 in the atmosphere involves carbon capture and storage (CCS) [3]. This method incorporates the capture of carbon dioxide from sources such as power plants, followed by its transportation and storage underground [4].
CCS mainly targets geological formations such as depleted oil and gas reservoirs, unmineable coal seams or in abandoned coal mines, basalt formations, and deep saline aquifers [5,6]. Among these, coal seams are considered to be particularly promising due to their adsorptive storage mechanisms. The potential for CO2 storage in unmineable coal seams was recognized in the early 2000s [7] and has been proven to be economically feasible under specific conditions. In coal seams, gas storage occurs through sorption within the coal matrix, in contrast to saline formations where gas is stored in pore spaces [8]. Transport mechanisms in coal comprise advective flow through cleats and diffusion through the bulk coal matrix [9,10]. According to Palmer and Mansoori [11], coal shrinks and swells as gases are produced or adsorbed and as effective stresses act on the coal matrix. Deep coal seams usually contain large quantities of adsorbed methane, which can be economically recovered under specific conditions. Efficient storage of CO2 requires a porous and/or fractured rock at a depth of at least 800 m [12]. At this depth, the prevailing hydrostatic pressure greatly reduces the volume of the injected CO2 compared to that at atmospheric pressure. The geologic properties of the target formation determine how efficiently CO2 can be stored, and this in turn determines the number of wells required for injection or the total amount of CO2 which can be stored, consequently determining the costs of CO2 storage. In the CO2-ECBM processes, injected CO2 flows through the coal cleats, diffuses into the coal matrix, and is adsorbed. Consequently, desorbed methane diffuses from the matrix into the cleats and flows to the production wells [9,13]. By injecting CO2 into coal seams, methane can be displaced, allowing for its capture and utilization as a relatively clean energy source [14]. This method offers the double benefit of preventing CO2 from entering the atmosphere, as well as producing energy with a lower carbon content than conventional coal [15].
Some studies have assessed the capacity for geological storage of carbon dioxide in Europe [5,16], while others have focused on specific regions, such as the Silesian Coal Basin in Poland [15]. There has also been extensive research in other parts of the world. For instance, Japan conducted CO2-ECBM field tests in the Ishikari Coal Basin [13]. In the United States, researchers investigated the San Juan Basin’s Pump Canyon test site [17]. Furthermore, China has conducted a series of field experiments on CO2 storage in coal to enhance coalbed methane recovery [18]. Several pilot and demonstration projects were conducted in different countries to explore the feasibility of CO2 storage in coal seams. The RECOPOL project in Poland was one of the early demonstrations that focused on CO2 storage in coal seams [19,20,21]. The experiment, spanning several months, entailed injecting 760 tons of CO2 into a coal seam via a vertical well. The primary research objective was to discern whether the injected CO2 was adsorbed by the coal or if it lingered as free gas. While results demonstrated CO2 adsorption onto the coal, it was observed that the requisite injection pressures surpassed initial projections, rendering CO2 injection feasible only through cyclic pressure elevations and declines. The coal seam’s permeability diminished over time, which is attributable to CO2 sorption-induced swelling, necessitating the implementation of hydraulic fracturing to sustain continuous injection. Guided by RECOPOL’s recommendation, ROCCS advocates further research into alternative well completions, such as horizontal or “fishbone” drilling, to evaluate their influence on injectivity and productivity.
Another notable project is the Ketzin project, which has provided valuable insights into the drilling, completion, and abandonment of CO2 wells since 2004 [22]. Over five years (2008–2013), 67 kilotons of CO2 were safely injected into the Stuttgart Formation’s sandstone units, situated 630–650 m underground. Key takeaways from the project include critical guidance regarding the drilling, completion, and methodical termination of CO2 wells. Post-injection activities were focused on long-term site behavior and a phased abandonment of all wells, offering continuous monitoring and analysis of material impacts due to the CO2-rich environment.
An integral aspect of CCS in coal seams is understanding the geomechanical properties of coal and how they change during CO2 injection [23]. CO2 injection can cause swelling or shrinkage of the coal matrix and alter its permeability [24]. The swelling and alteration in permeability are critical factors that must be considered when assessing the viability of CO2 sequestration in coal seams [25,26]. Moreover, it is important to take into account the pore-fracture alteration in coals of different ranks [27]. Chen et al. (2020) conducted numerical analyses on improvements to CO2 injectivity in coal seams through stimulated fracture connection to the injection well [28].
Due to a number of geomechanical risks associated with the commercial-scale storage of CO2, it is important to assesses potential site-specific hydromechanical impacts of CO2 storage. Wetzel et al. presented work that evaluated the potential hydromechanical effects of CO2 storage in coal seams at a prospective storage site in the Upper Silesian Coal Basin in Poland [29].
Although these early projects demonstrated that coal seams could be used for CO2 storage, issues such as low injectivity were identified as challenges to the commercial viability of this technology. The low permeability of coal seams typically limits the rate at which CO2 can be injected. To address this challenge, horizontal wells have been proposed as an approach to increase injectivity by providing more extensive contact with the coal seam while avoiding the creation of hydraulic fractures [30].
While numerical simulations often explore horizontal wells for coal bed methane recovery [31,32,33,34], field applications, especially those solely focusing on CO2 injection and storage without methane recovery, are rarely reported, indicating a literature gap. Consequently, there is a crucial need to develop the technological aspects of a new CCS strategy in coal, addressing the identified issues. In their study, Zhang et al. observed that a multi-fractured horizontal well significantly outperformed hydraulically fractured vertical wells in terms of depressurization efficiency, gas production, and the ultimate recovery factor, with a peak gas rate more than five times higher for the horizontal wells when compared to the vertical wells [35]. In terms of gas production, a lower coal seam thickness, permeability, and desorption pressure correlated with a higher degree of outperformance noted for the horizontal wells.
This study, as a part of the ROCCS project, builds upon previous work by investigating the potential of coal seams for CO2 sequestration through in situ tests at the Experimental Mine Barbara in Mikołów, Poland. The study focused on the utilization of horizontal injection wells to optimize the coal–CO2 contact area and analyzing how varying well lengths and injection parameters can enhance sequestration rates. The results obtained from these in situ tests contribute significantly to an understanding of the practical challenges and potential solutions for large-scale CO2 storage in coal seams.
The research aims to bridge the gap between theoretical considerations and practical applications and to provide valuable insights for the development and design of commercial-scale CO2 storage installations.
2. Materials and Methods
2.1. Site Characterization
Experimental Mine Barbara (EMB) is a scientific research facility of the Central Mining Institute in Katowice, located in the northeast section of Mikołów, Poland. The mine is used for research regarding innovative technologies for underground mining, safety in mining work, research on gas and dust hazard mitigation, certificates for the equipment allowed to operate in potentially explosive atmospheres, explosives, and the testing of blasting agents for civil use.
2.1.1. Geological Data
The EMB is geologically located south of the Kłodnica fault and features geological structures from the Quaternary and Carboniferous periods. The Quaternary formations consist of sand, gravel, and clay, with a thickness ranging from 4 to 6 m, exposing the Carboniferous top in some areas. The Carboniferous structures, present up to a depth of 1000 m, comprises Orzeskie and Łaziska beds, which contain alternating fine- and medium-grained sandstones, conglomerate, clay shales, and 308, 310 and 318 coal seams.
Hydrogeological studies in the EMB area reveal two aquifers, one in the Quaternary sand and gravel sediments and another in the Carboniferous sandstones. The Quaternary aquifer, fed by rainwater, varies in depth from 0.3 m to about 10 m. The Carboniferous aquifers are found above seam 300 and between seams 310 and 312, with thicknesses ranging from 20 m to 40 m and 20 m to 30 m, respectively, and are supplied by rainwater infiltration. Hydrogeological conditions and geological cross sections (based on selected drilling profiles) in the EMB area are presented in Figure 1.
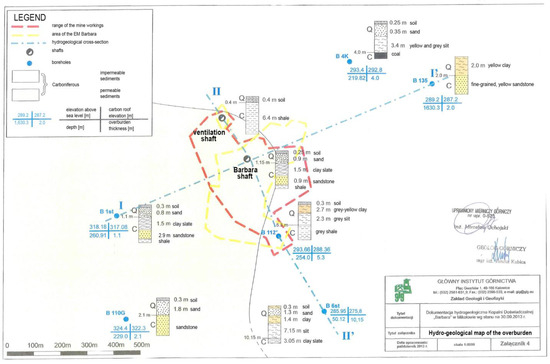
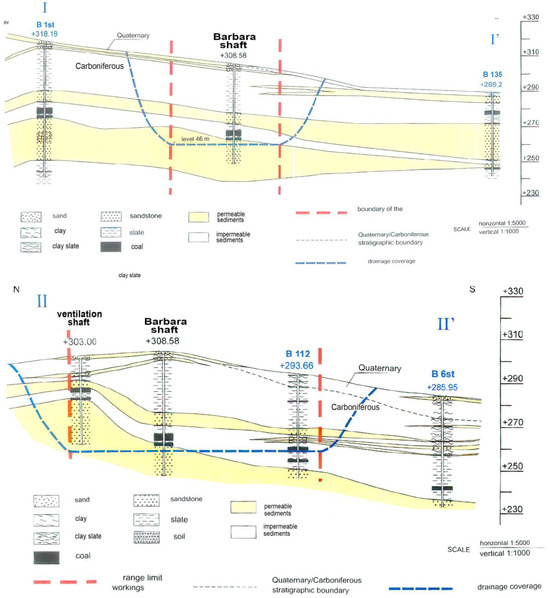
Figure 1.
Hydrological conditions and geological cross sections in the EMB area.
The assessment is based on archival data and observations from neighboring mines. The Orzeskie Beds, which consist of alternating fine and medium-grained sandstones, conglomerates, mudstones, clay, and coal deposits, house the mine workings. The 308, 310, and 318 seams are especially consistent. The roof zones are lithologically heterogeneous and of varying strengths, factors which are influenced by the presence of cracks, differing rock formations, and varying rock strengths. The rock mass strength generally increases with depth and sandiness.
In order to precisely determine the depth and thickness of the coal seam in the area of the injection tests, vertical drilling was partially carried out using core acquisition technology. The 310 coal seam was identified at a depth of 29.9 m, with a 1.7 m thickness. Figure 2 presents a drilling profile acquired during the drilling of the monitoring wells (MW) directly in the region selected for CO2 injection.
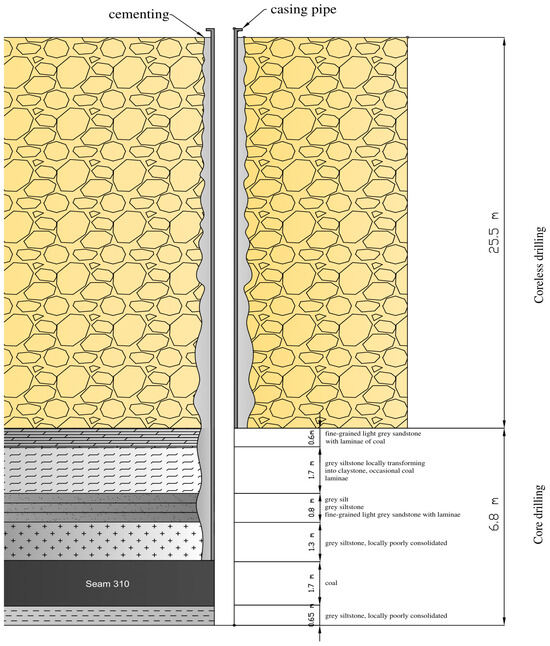
Figure 2.
MW 1 partial cross section.
In this project, the target coal seam’s depth is lower than that of other pilot initiatives, such as MOVECBM [36] and CARBOLAB [37]. Nonetheless, this depth was selected for examining the relationship between CO2 injectivity and the coal–CO2 contact area. This selection is part of a broader exploration to determine whether shallower seams might present a more balanced combination of storage capacity, injectivity, storage security, and cost. While a reduction in storage capacity is anticipated, adsorption still secures the storage, eliminating the need for over-pressurization or permeability enhancement to maintain a consistent injection rate, significantly reducing facility expenses. This suggests the possibility of developing smaller, more replicable facilities, particularly as the decline in coal mining makes shallow seams increasingly available for low-carbon developments.
Pilot tests employing horizontal injection wells at such shallow coal seams are seldom documented. In this study, the potential of shallow coal seams for secure CO2 storage is explored, with the goal of developing a set of site-specific design recommendations that ensure safe and continuous gas injection during the in situ test. This approach avoids the need for over-pressurization or hydraulic fracturing and minimizes gas leakage.
2.1.2. Coal Properties
To successfully run the CO2 injection process, the coal seam had to be identified in a detailed manner. Coal characterization included proximate and ultimate analyses, as well as the determination of coal density. The coal rank and petrographic properties were determined and are presented in Table 1 (for a full lab test report, see File S1). The coal samples have been taken from the seam near the area of the planned tests. The data were also incorporated into the development of a numerical model, which was used to enhance the design of the injection system for the in situ tests.

Table 1.
Proximate and ultimate characteristics of EMB coal (unit is % by weight, if not indicated otherwise).
The selected transport and textural properties, including coal porosity, pore size distribution, and specific surface area, have been investigated using an ASAP 2010 Micromeritics apparatus.
Carbon dioxide sorption tests were carried out in the gauge pressure range of 0–0.1 MPa, at the temperature of 298 K. On the basis of the carbon dioxide sorption isotherm, the pore surface volumes were determined according to the Dubinin–Astakhov model. The results are as follows:
- specific surface area according to D-A—130.89 m2/g;
- pores volume—0.049 cm3/g;
- porosity—7.6%;
- pore size distribution—see File S1.
2.1.3. Establishing Background CO2 Concentration in Soil Gas
Atmogeochemical measurements of background CO2 concentrations in the subsurface soil gas were carried out to establish a reference point for future CO2 monitoring to properly assess the level of potential gas leakage from the coal seam during and after injection. The monitoring was performed with the use of piezometers drilled directly above the coal seam selected for the experiments—42 piezometers, 2.0 m deep, placed approximately 20 m apart.
The measurements were performed by means of the ECOPROBE 5.0 instrument, which allows for the in situ measurement of organic contaminants, with selective analyses of methane, common petroleum hydrocarbons, CO2, O2, atmospheric pressure, sampling vacuum, and soil temperature using the time-integrated photo-ionization analyzer (PID) and the 6-channel selective infra-red analyzer (IR). The photo-ionization analyzer (PID) measures the total level of volatile organic compounds (VOCs) and other toxic gases, including chlorinated hydrocarbons, to sub-ppb levels. The infra-red analyzer (IR) comprises four independent channels for the selective analyses of methane, petroleum hydrocarbons, and CO2, with ppm resolution and the following characteristic for carbon dioxide—range: 0–500,000 ppm; detection limit: 20 ppm. The combination of analyzers provides a set of data designed for soil contamination survey and various environmental tasks. With the very high sensitivity of the PID, the instrument has a capability that reaches well beyond the standard soil contamination surveys. The effectiveness in the detection and monitoring of contaminant spills and plume migration is substantially enhanced by the incorporation of ancillary data. The extremely high zero stability, combined with the suppression of methane by the PID analyzer, provides a detection capability undiminished by natural hydrocarbon occurrence, ensuring the application of optimum sensitivity levels. The underground storage tank (UST) system and pipeline leakage detection and localization are further extensions of the soil contaminant application, such as for use in the tracking of contamination from agricultural waste. Less obvious applications are to be found in the detection and monitoring of organic toxins in industrial fields. Minute traces of gas can be an indication of the approaching breakdown of a shaft seal or packing in a process vessel with externally driven components. The real time continuous display mode makes the localization of leakage, with pinpoint accuracy, a reality. Further applications incorporating the IR, oxygen, and temperature detection are found in the in situ monitoring of bio-remediation, where bacteria consume oxygen and generate heat, along with methane and carbon dioxide. Routine periodic repetition of sampling at fixed locations can track both the progress and health or effectiveness of the process, as the results provide a clear indication of bacterial activity, as well as contaminant concentration [43].
The measurements took place between January and May 2021, and the average CO2 and O2 concentrations for each month were calculated. The maps of average concentrations of CO2 and O2 in the soil gas for the individual months serve as a basis for determining the possible migration of CO2 to the surface during the in situ CO2 injection tests carried out. The map showing the locations of the piezometers is shown in Figure 3; each square on the map represents 10,000 m2 on (under) the surface of the earth. An example of background monitoring results is presented in Figure 4 in the form of contour maps of the averaged gas concentrations for each month. The full data, including tables with recorded values and contour maps of gas concentrations for each measurement day, are presented as part of File S1.
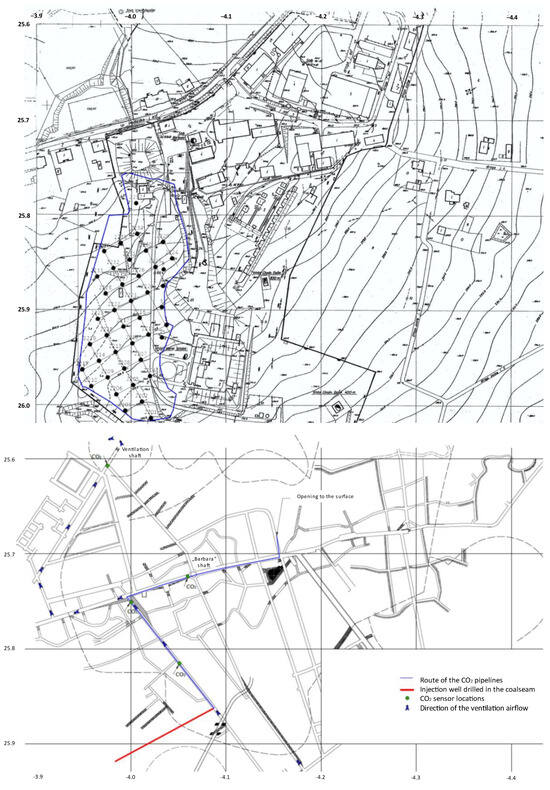
Figure 3.
Maps showing the location of the experiment (KDB). Top—map of the surface, with location of piezometers marked for leakage monitoring; Bottom—map of the underground workings.
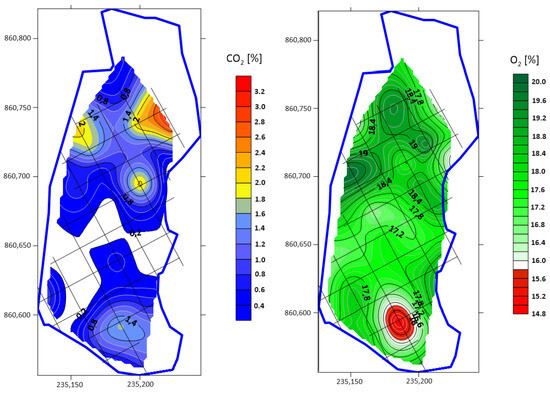
Figure 4.
Maps of average CO2 and O2 concentrations—May 2021.
2.2. Experimental Procedure
The test was carried out in three injection stages, each characterized by a different coal-CO2 contact area or MWs placement. Prior to these stages, the preparation of experimental infrastructure, i.e., borehole drilling, installation of surface monitoring instruments, etc., was realised. Coal characterization in terms of proximate and ultimate analyses, as well as the determination of coal density and porosity, which are essential for the injection processes and the interpretation of the experimental results, were analyzed in this pre-injection phase. Through a comparison of the two stages, the injectivity and the relevance of the coal–CO2 contact area were assessed.
2.2.1. Carbon Dioxide Injection—Stage I
Stage I of the in situ experiment took place between 30 May 2022 and 14 June 2022. The aim of this stage was to establish the injection pressure buildup and to monitor the gas flow rate. To this end, the injection was carried out at a constant inlet pressure. CO2 migration in the coal seam was monitored via CO2 sensors placed inside the vertical MWs.
Three distinct settings have been implemented to assess the influence of pressure on the injection process. The pressure was set at the reducer of the CO2 cylinder bundle:
- Setting 1—1.5 bar;
- Setting 2—3.0 bar;
- Setting 3—10.5 bar.
The injection was ongoing for 24 h/day in the respective time period. After two weeks of operation, it was decided to pause the operation due to lack of pressure buildup in the injection well (IW).
2.2.2. Carbon Dioxide Injection—Stage II
The results of the first stage indicated that preferential pathways may likely exist in the coal seam. Another possible explanation was the lack of hermeticity of MW 2. In order to disambiguate the results, it was decided to seal MW 2 and drill a new MW in its vicinity, described as MW 2_bis.
Stage II, therefore, was carried out with the same injection well length and pressure settings as in the previous stage to replicate the stage I injection conditions for better comparison. The only change was in the placement of MWs. Stage II of the in situ experiment took place between the 8 and 17 September 2022. The injection was ongoing for 24 h/day.
2.2.3. Carbon Dioxide Injection—Stage III
The last stage of injection was preceded by drilling an additional 18 m of the injection well and two more MWs (3 and 4). The horizontal drilling trajectory was successfully maintained in the coal seam with the cross section of the injection well, including the positioning of the MWs at this stage.
For a proper assessment of the coal–CO2 contact area influence on the injection process, the experiment at this stage was carried out using pressure settings similar to those used in the previous stages.
Stage III of the in situ experiment took place between 21 November and 2 December 2022. The injection was also ongoing for 24 h/day.
2.3. Monitoring System
2.3.1. Near-Surface Monitoring
The system was needed to assess the level of potential gas leakage from the coal seam during and after on-site operation. It consisted of 54 piezometers, each about 2 m deep—42 remaining after baseline site characterization (Figure 5a) and 12 in close vicinity of the IW installed directly before the injection tests (Figure 5b). The CO2 concentration in the piezometers was measured manually. Figure 5 shows the map of the piezometers, with horizontal IW marked.
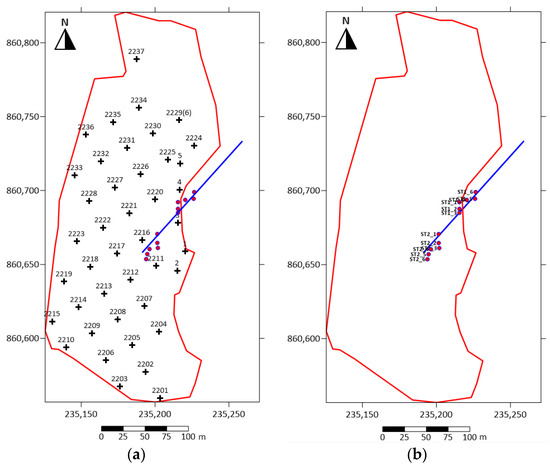
Figure 5.
Locations and numbering of the monitoring points at the test site: (a) 42 piezometers remaining after baseline site characterization, (b) 12 piezometers installed directly before the injection tests. The blue line represents the horizontal injection well.
From the background monitoring conducted in May 2021, it was determined that the background gas concentration of CO2 in the subsurface exhibited a maximum of 2% CO2. The methodology of the measurements was the same as that used in the case of background monitoring.
During the last stage of the in situ injection tests, additional measurements were performed to determine the gas flow rates. From these measurements, the gas fluxes resulting from diffusion and convection were determined using an accumulation chamber. The gas fluxes were determined by using the following equation [44]:
where:
- E—gas flux [kg m−2s−1]
- dm—mass of gas flowing through the surface F over time dt [kg]
- ρ—CO2 density under measurement conditions [kg m−3]
- ρn—CO2 density under normal conditions [1.977 kg mn−3]
- Vk—active volume of the accumulation chamber [m3]
- F—surface area through which gas flows into the accumulation chamber [m2]
- P—atmospheric pressure during gas measurement [bar]
- Pn—normal pressure [1.01325 bar]
- Tn—normal temperature [273.15 K]
- T—temperature during gas measurement [K]
- dc—change in the volumetric concentration of gas in the chamber over time dt [%vol]
- dt—time increment [s]
The detailed methodology of gas flux calculations is presented in File S1.
2.3.2. Deep Monitoring Wells
Active gas flow monitoring was carried out to improve the understanding of CO2 and coal bed methane flow behavior in the coal seam. CO2 migration was measured via sensors placed in four vertical MWs, drilled in close proximity to the IW, 30 m deep each, i.e., penetrating the coal seam. Monitoring well sections drilled in the overburden were cemented and their tops sealed to avoid CO2 migration to the surface. The well sections drilled into the coal seam were maintained as open-hole completions so that the gas monitoring sensors were able to detect any CO2 flow through the coal seam (see Figure 1). Each MW was equipped with CO2 (range of 0–100%) and pressure (range from 0 to 4 bar) sensors, placed at a depth of 29 m, directly above the coal seam.
MWs 1 and 2 were drilled at a distance of 5.1 m and 3.7 m from the horizontal well, respectively. MW 2_bis was drilled before stage II of the injection, 4.0 m from the horizontal IW. Two more MWs (3 and 4) were drilled before the last stage of the experiment, at a distance of 7.5 m and 2.8 m from the IW. The exact positions of the MWs are presented in Figure 6.
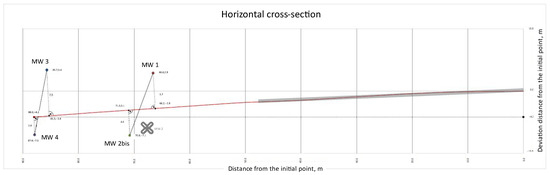
Figure 6.
Horizontal cross section of the IW with position of the MWs marked (final configuration).
2.3.3. Mine Monitoring
In view of research safety, a CO2 and CH4 sensor system was designed and implemented to detect potential gas leakages from the coal seam into the drift area in the mine. Analysis of ventilation for the potential occurrence of leaks in the supplying CO2 installation or a sudden outflow of CO2 into the mine workings was performed using the existing system of insulating dams and gauge doors in the mine. Continuous monitoring of CO2 and CH4 was performed throughout all the injection stages.
2.4. Injection System
The results of the laboratory tests and numerical modeling activities [45,46,47,48,49,50,51,52,53] provided useful insights into potential scenarios of the in situ CO2 injection operation. These helped to determine the final location and position of the wells, and the results suggested that the maximum migration of the injected CO2 during the experiment was approximately a dozen meters.
The design of the horizontal IW is presented in Figure 7. The horizontal IW was designed in terms of parameters such as the position, length, and angle of the drilling. The horizontal IW was drilled in the southwestern area of the mine, with a total length of about 88 m, of which about 50 m were incorporated as the coal–CO2 contact area (32.5 m in the first and second stage; 50 m total in the last stage). The casing pipe (first 6 m) had a diameter of 150 mm, while the cemented section (next 31.5 m) had a diameter of 101 mm. The injection borehole had a diameter of 76 mm.
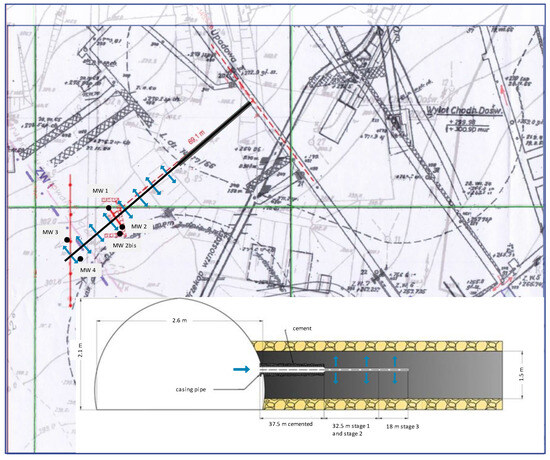
Figure 7.
Locations of the horizontal well and vertical MWs. The design of the horizontal IW divided into stages.
The initial section of the injection well has been cemented to ensure that CO2 does not migrate into the drift area. Another factor that had to be taken into account was the landform in the area. There is a terrain elevation directly above the planned drilling area, which could negatively impact the near-surface leakage monitoring. Therefore, it was decided to seal a section of the injection well (about 37.5 m) and use 32.5 m of borehole length as the injection section for stage I of the experiment. Figure 7 shows the originally planned horizontal well trajectory (dashed red line), the final trajectory (black line), and the MW positioning (black dots).
The monitoring equipment for gas flow and composition control inside the pipelines was specifically designed and developed. The installation for measuring the amount of CO2 adsorbed in the coal seam consisted of both surface and underground sections. A schematic of the installation is shown in Figure 8.
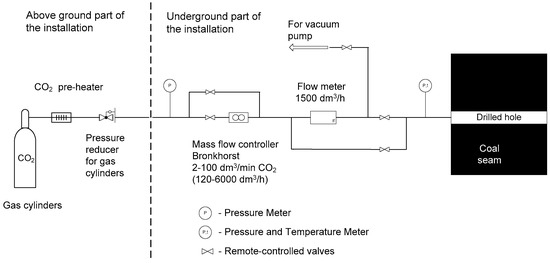
Figure 8.
Diagram of a measurement system for measuring CO2 sorption in a coal seam.
In the surface portion, CO2 gas cylinders were equipped with a pre-heater and a valve for setting the initial injection pressure. Carbon dioxide was delivered from the surface to the underground area via a flexible pipe made of synthetic gum, of approximately 700 m length. The equipment for dosing and measuring the amount of CO2 flow was located in the underground portion. It consisted of a mass flow controller, a flow meter, a vacuum pump, five remote valves, three pressure sensors, and one thermocouple. The setup allowed for performing the experiment at either constant pressure or constant mass flow.
The temperature was measured at the inlet of the installation. The pressure was measured at three points:
- Inlet of the installation (P1);
- Before the main valve of the injection well (P2);
- After the main valve, inside the injection well (P2_2).
Here, P2_2 was the most relevant pressure gauge of the three. While P1 and P2 were used to monitor the performance of the installation itself, P2_2 recorded the pressure buildup in the well, which is one of the key parameters describing the CO2 injection and adsorption process.
When connected to the installation, the CO2 bundle was equipped with a heater to prevent gas liquefaction due to the high degree of decompression. However, at each stage, the low ambient temperatures made this task more difficult.
The mass flow was measured in normal liters per hour (NL/h). It was determined that for CO2, each normal liter corresponded to approximately 2 g of gas.
A CO2 flow meter, made by the Bronkhorst Company, Ruurlo, Netherlands (F-111AI-50K-XAD-33-E, IN-FLOW Select), with a measuring range of 30–1500 dm3/h, was used. In manual operation mode, i.e., with the CO2 flow rate set by the operator, the Bronkhorst CO2 mass flow rate controller (F-122M-RAD-44-V, valve type M172113H), with a flow control range of 1200–6000 dm3/h, was used. The installation was sealed in two hermetic cases and placed in the mine workings, directly in front of the IW inlet.
3. Results
3.1. Stage I
The injection started with a pressure of 1.5 bar at the reducer (described as “setting 1”). A steady CO2 flow into the coal seam was observed, together with an increase in CO2 concentrations in MW 2. The pressure in the IW reached 0.12 bar, and 0.10 bar in MW 2. When the CO2 concentration leveled out at about 15%, the pressure at the reducer was increased to 3.0 bar (“setting 2”), and kept constant for next five days. The CO2 concentration recorded in MW 2 during this time period varied in a range of 17–22%, with occasional spikes due to erratic sensor operation. The maximum achieved pressure in the IW reached 0.14 bar, while in MW 2, it reached 0.12 bar.
For the following two days, the pressure at the reducer was limited to 1.5 bar at the reducer, and the CO2 concentration decreased back to 15%. For the last five days of stage I, the pressure at the reducer was set to 10.5 bar. This led to a significant increase in CO2 concentrations in MW 2 of up to 30–35%. Simultaneously, the maximum pressure in the IW increased to 0.24 bar, and the pressure in MW 2 increased up to 0.18 bar.
Throughout the entire experiment, the CO2 concentration and the pressure increase in MW 1 were zero. The changes in mass flow and pressure are presented in Figure 9.
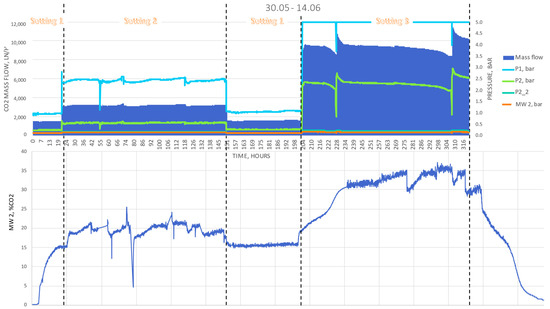
Figure 9.
Injection system and MW 2 measurements—Stage I.
Table 2 shows the maximum values of the IW and MW parameters measured in the installation for each setting.
Table 2.
Maximum values of IW and MWs parameters measured in the installation—Stage I.
There is a significant difference in the pressure before and after the main valve of the IW. The pressure buildup in the IW seems to be hindered by the coal seam’s integrity. At the same time, the CO2 concentration in MW 2 responded relatively quickly to changes in the injection procedure. After each change of the injection rate, the CO2 concentration gradually increased or decreased accordingly, reaching its new range within a day. It was concluded that MW 2 was probably not hermetic, and therefore created a preferential pathway for CO2 flow to the surface. It was decided that MW 2 should be sealed in an attempt to restore the tightness of the system. The total mass of CO2 injected in this stage was about 3300 kg.
Maps of the differences between the background CO2 concentrations in the soil gas and the results of the measurement series carried out from 31 May 2022 to 14 June 2022 are shown in Figure 10, Figure 11 and Figure 12. The data are presented in Tables S1–S4 (File S2).
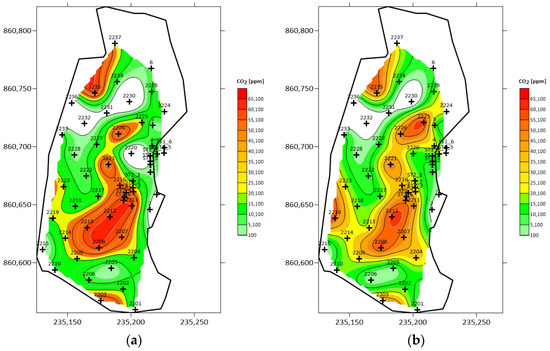
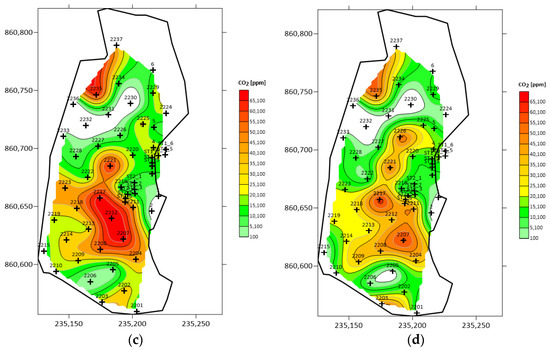
Figure 10.
Maps of the differences between the background CO2 concentrations in the soil gas and the results of the measurement series performed in May and June 2022: (a) 31 May 2022; (b) 1 June 2022; (c) 2 June 2022; and (d) 3 June 2022.
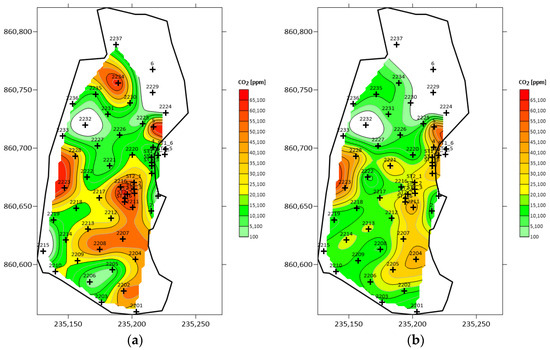
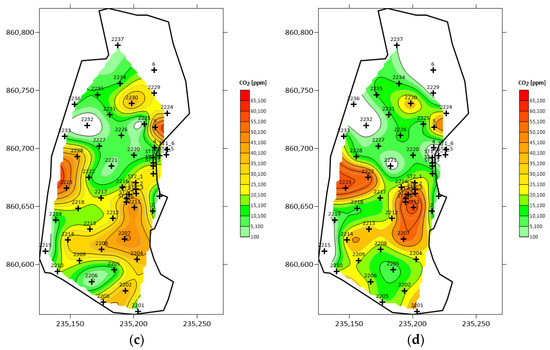
Figure 11.
Maps of the differences between the background CO2 concentrations in the soil gas and the results of the measurement series performed in May and June 2022: (a) 6 June 2022; (b) 7 June 2022; (c) 8 June 2022; and (d) 9 June 2022.
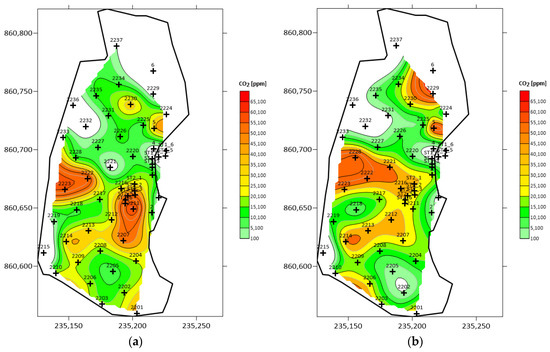
Figure 12.
Maps of the differences between the background CO2 concentrations in the soil gas and the results of the measurement series performed in May and June 2022: (a) 10 June 2022 and (b) 14 June 2022.
It can be seen that the highest CO2 concentration was detected in the central and western parts of the monitoring area. In the last five days, the maximum concentrations noticeably increased—from about 4.5% up to 6.5%. This result directly corresponds to the higher injection rate in this period (setting 3).
The zones with the highest average CO2 concentrations in the soil gas, based on the measurements carried out from 31 May to 3 June 2022 (stage I), were located in the central and northern parts of the area, i.e., gas piezometers 2211, 2212, ST2_6, and 2235 (Figure 10). As the injection continued between 6 June 2022 and 14 June 2022, the highest average CO2 concentrations were measured in the central and western parts of the area, i.e., gas piezometers 2204, 2211, 2212, ST2_6, 2202, and 2223 (Figure 11 and Figure 12).
The analysis of the above maps shows that the injected CO2 migrates towards the surface. The maximum differences between the background CO2 concentration in the soil gas established in May 2021 and the results of the measurement series performed in May and June 2022 amount to 5% CO2 recorded at points 2212 (2 June 2022), 2207 (3 June 2022), 2223 (6 June 2022–8 June 2022), and 2211, 2223 (9 June 2022–10 June 2022).
3.2. Stage II
The injection started with a pressure of 1.5 bar at the reducer. A steady flow of CO2 into the coal seam was observed. After two days, the pressure at the reducer was increased to 3.0 bar, and then to about 9.5 bar over the next three days. Due to low ambient temperatures, it was not possible to maintain a constant CO2 outflow from the gas cylinder bundles.
At this stage, MW 2 was removed and replaced by MW 2_bis. However, there was still no evidence of a pressure buildup in the IW. Neither MW 1 nor MW 2_bis detected any increased CO2 concentrations.
The changes in mass flow and pressure are presented in Figure 13.
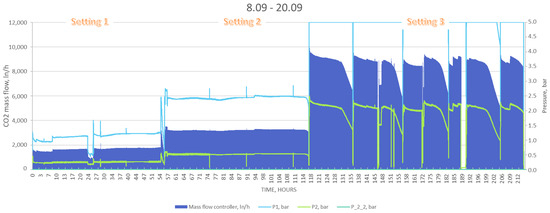
Figure 13.
Injection system measurements—Stage II.
Table 3 presents the maximum values of all parameters measured in the installation IW and MW, with the use of different settings.
Table 3.
Maximum values of IW and MWs parameters measured in the installation—Stage II.
The total mass of CO2 injected in this stage was about 2100 kg.
Maps of the differences between the background CO2 concentration in the soil gas and the results of the measurement series carried out from 7 September 2022 to 16 September 2022 are shown in Figure 14 and Figure 15. The data is also presented in Tables S5–S8 (File S2). It can be seen that, similar to the results from the previous stage, the highest CO2 concentrations were detected in the central and western parts of the monitoring area.
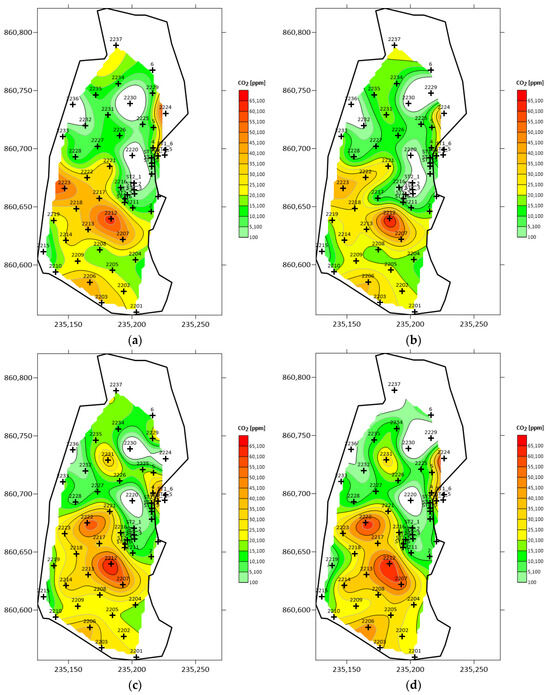
Figure 14.
Maps of the differences between the background CO2 concentrations in the soil gas and the results of the measurement series performed in September 2022: (a) 7 September 2022; (b) 8 September 2022; (c) 9 September 2022; and (d) 10 September 2022.
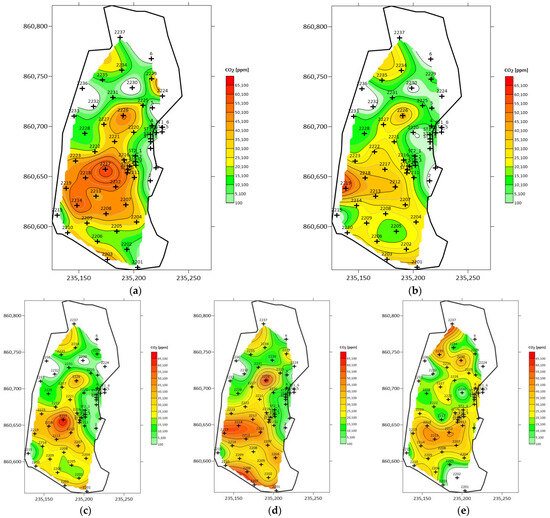
Figure 15.
Maps of the differences between the background CO2 concentrations in the soil gas and the results of the measurement series performed in September 2022: (a) 12 September 2022; (b) 13 September 2022; (c) 14 September 2022; (d) 15 September 2022; and (e) 16 September 2022.
From the analysis of the above maps of CO2 concentrations in the soil gas, based on the measurements carried out from 7 September to 17 September 2022 (stage II), it appears that the injected CO2 is still migrating towards the surface. The maximum differences between the background CO2 concentrations in the soil gas established in May 2021 and the results of the measurement series performed in September 2022 amount to more than 5% CO2 at points 2224, 2223, and 2212 on 7 September 2022 (Figure 14a) and at point 2212 on 8 September 2022 (Figure 14b). The maximum differences recorded between 9 September 2022 and 15 September 2022 amount to more than 5% CO2 at points 2212, 2217, 2218, 2219, and 2022 (Figure 14c,d and Figure 15).
The above analysis shows that the concentrations of CO2 in the soil gas are increasing at the test site, which likely indicates CO2 migration from the injection site, probably due to the hydrogeological properties of the Carboniferous overburden and its variable thickness.
On the basis of the performed tests and analyses, it was concluded that CO2 was migrating towards the surface from the coal seam. It is supposed that carbon dioxide is migrating via the coal fracture network, and it reaches the overburden soil, where there are discontinuities in the low-permeable layers. Migration is determined by the hydrogeological properties and thickness of the overburden layers.
The findings show that there are zones with increased CO2 concentrations in the soil gas reaching up to 6% CO2, the larger surface contours exhibit CO2 concentrations of approximately 5%, and fairly large areas show >3% CO2 concentrations.
3.3. Stage III
The previous results indicated that preferential pathways likely existed in the coal seam and overburden layer, which led to CO2 leakage and prevented a pressure buildup in the IW. It was decided not to abandon the experiment, but to shift the research focus to leakage detection and monitoring at the surface. It was assumed that performing one more stage of injection with an extended IW length would be beneficial to assess the impact of the increased injection CO2–coal contact area on the measured leakage.
Similarly, as in stage II, each pressure setting was implemented for a few days at a time. Due to very low ambient temperatures, it was impossible to maintain a constant CO2 outflow from the gas cylinder bundles.
Stage III was performed with a CO2–coal contact area about 50% larger than that obtained in the previous stages. Assuming that gas flows through the cleat system, the CO2 flow should increase accordingly. This was not the case, however. The mass flow, similar to the rest of the parameters, remained at the same level as that noted in previous stages, (Table 4). The findings suggest that additional exposition to natural occurring cleats through increasing the coal–CO2 contact area did not enhance the injection rate. This result confirms the assumptions regarding the pre-existing preferential fluid flow pathways in the area of the injection well, most probably in the region of the sealed MW 2.
Table 4.
Maximum values of IW and MWs parameters measured in the installation—Stage III.
After increasing the pressure at the reducer to about 10 bar, on the sixth day of operation, the CO2 concentration in MW 2_bis suddenly spiked to 8% and remained in the range of 8–10% (Figure 16). This sudden change suggests the development of a preferential flow path, either newly created or extended from an existing path, due to the applied pressure. Other evidence that support this conclusion includes the results from the previous stages. In the stage II of the experiment, the CO2 concentration in MW 2_bis remained at 0% throughout the injection process, with similar injection rates applied. Moreover, in stage I, it can be seen that the CO2 concentration in MW 2 increased gradually, proportional to the injection rate. The sudden spike in CO2 concentration stands in stark contrast to previous results; hence, the presented conclusion. The CO2 concentration in MW 2_bis remained elevated for weeks, even after the experiment had been terminated. The CO2 concentration in the remaining MWs (1, 3 and 4) remained at 0. The total mass of CO2 injected here was about 2300 kg.
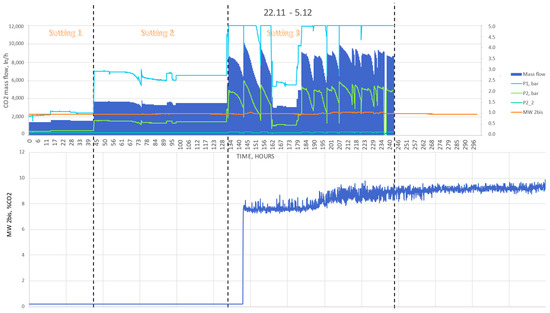
Figure 16.
Injection system and MW 2“ measurements—Stage III.
Maps of the differences between the background CO2 concentration in the soil gas and the results of the measurement series carried out from 21 November 2022 to 2 December 2022 are shown in Figure 17, Figure 18 and Figure 19. The data is also presented in Tables S9–S12 (File S2).
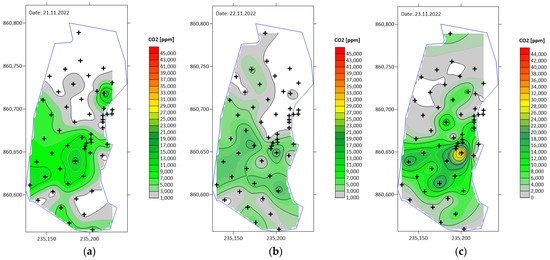
Figure 17.
Maps of the differences between the background CO2 concentrations in the soil gas and the results of the measurement series performed in November and December 2022: (a) 21 November 2022; (b) 22 November 2022; and (c) 23 November 2022.
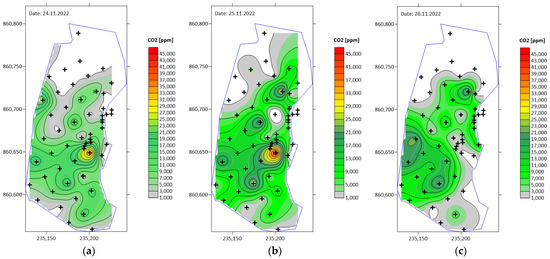
Figure 18.
Maps of the differences between the background CO2 concentrations in the soil gas and the results of the measurement series performed in November and December 2022: (a) 24 November 2022; (b) 25 November 2022; and (c) 26 November 2022.
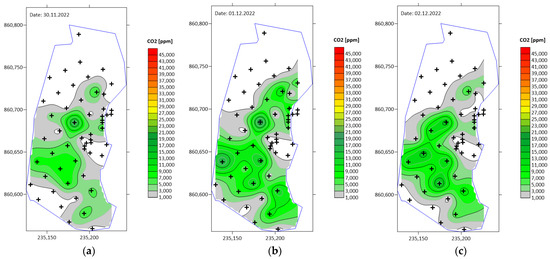
Figure 19.
Maps of the differences between the background CO2 concentrations in the soil gas and the results of the measurement series performed in November and December 2022: (a) 30 November 2022; (b) 1 December 2022; and (c) 2 December 2022.
As the main focus of the investigation shifted, additional monitoring techniques were implemented during stage III to assess the CO2 flux at the surface. The measurement was performed by means of an accumulation chamber at five chosen points (Figure 20).
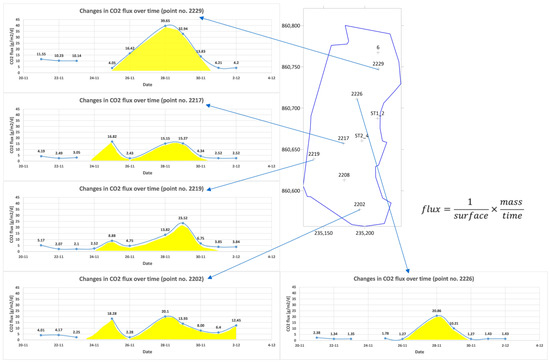
Figure 20.
CO2 flux assessment at five selected measurement points during stage III. The charts present changes in the total CO2 flux over time, based on the measurement series performed using an accumulation chamber between 21 November 2022 and 2 December 2022.
Stage III of CO2 injection into the coal seam consisted of drilling an additional 18 m further in the horizontal IW. The process of CO2 injection started on 21 November 2022 and lasted until 2 December 2022.; measurements of CO2 concentrations in the soil gas began at the same time. In addition, measurements of the CO2 flux were carried out using the accumulation chamber at selected points.
In the first two days of the third stage of the experiment (Figure 17a,b), the CO2 concentrations were in the range of the background CO2 concentrations in the soil gas (0–2%), while on the third day, higher concentrations of >3% occurred in the area of the injection well and the northeastern portion of the test site (Figure 17c). The following days of soil gas measurements outlined the migration process by increasing anomalous areas, where higher concentrations of CO2 of up to 4% were observed near the injection well and in the area of points ST2/P4P and 2211 (Figure 18).
In the period of the following days, from 26 November 2022 to 2 December 2022 (Figure 18c and Figure 19), the extent and the zone of the anomaly areas in the area of the injection well disappeared, while the zone in the area of point 2229 increased. This may prove the horizontal migration of CO2 flow towards the old mining excavations, caused by the pressure gradients in the underburden. In the following days, the NE zone developed in the northern part of the test site; additionally, a small zone of anomalous higher CO2 content formed in the area of the injection well. The plotted maps show that in the first week, there were two zones of anomalous CO2 concentrations, with the first located at a short distance from the injection well, with average concentrations of 2.7% CO2, and the second in the northeastern part of the research area, with average concentrations of 1.7% CO2.
Changes in the average CO2 concentrations were caused by dynamic changes in CO2 migration in the vertical and horizontal directions, where in the northern part of the test site, a network of fractures over the mining excavations developed (which was confirmed by geophysical surveys carried out in this area), and thus changes in the hydrogeological parameters of the overburden rocks were observed.
It should be noted that the measured CO2 concentrations within the scope of stage III were significantly lower than those obtained in the other stages. The overall lower CO2 concentration values in stage III can be attributed to different atmospheric conditions during the measurements (the temperature during the measurement period ranged from 0 to 4 °C) and to the increased soil moisture in the ground following rainfall. The moisture may also have prevented CO2 migration at specific locations, or redirected the flow to other (drier) soils. Nevertheless, even under such conditions, the process of CO2 migration towards the surface is visible, which is also evidenced by the calculated total CO2 flux.
Even though the nominal measured values were relatively lower, it can be seen that the concentration contours maintained a shape similar to those found in previous stages, with the highest CO2 concentrations in the central part of the monitoring area. Combined with the fact that the injection rate did not increase, it can be inferred that extending the IW length had no further impact on leakage flow. This is because extending the injection well could only have resulted in either an increase in the overall leakage, or no influence at all, but not in a reduction in leakage. Lower CO2 concentrations should be attributed to atmospheric conditions that differed from those in previous stages, as mentioned above. Therefore, it can be concluded that the preferential pathways identified near MW 2 and MW 2_bis were the main cause of the system’s lack of hermeticity. Since the pathways remained in place throughout the experiment, the recorded CO2 concentrations exhibited similar values and patterns across all stages.
The total CO2 flux on the measurement day was calculated according to Equation (1), taking into account the atmospheric conditions at the time of the measurement, i.e., temperature, pressure, and the constant values of the volume and area of the accumulation chamber. The results are presented in Tables S15–S16 (File S2). The daily changes in the total CO2 flux calculated from the measurements in the accumulation chamber are shown in Figure 20. In the first few days, a stable value of gas flow was observed in the range of 2.25–4.17 g/m2/d, but at the fifth day, an increase in the flux up to 18.28 g/m2/d at point 2202 was visible, increasing to 20.1 g/m2/d at the seventh day of measurement. In the following days, a decrease to 6.4 g/m2/d, and then an increase to 12.45 g/m2/d, was observed. Similar changes in the CO2 flux were observed at points 2217, 2219, 2226, and 2229. The above calculations show that CO2 migrated towards the surface, as evidenced by the contour maps and charts regarding CO2 concentration in the soil gas and the total CO2 flux. The total CO2 fluxes indicate CO2 migration towards the surface, although the horizontal range changes dynamically in time and space.
These values are relatively low (maximum value equal to 39.65 g/m2/d at point 2229) in relation to the CO2 concentrations observed in stages I and II. Due to the weather conditions being significantly different from those prevailing during the measurements of CO2 concentrations in the soil gas in June and September 2022 (temperatures from 0 to 3 °C and pressures from 0.968 to 0.985 bar), the soil was saturated with water, and CO2 migration was most likely hindered by relative phase permeabilities and capillary entry pressures, explaining the low CO2 concentrations in the soil gas during this time period.
In the northern part of the test site, measurement points 2229 and 6 are located above the old mining excavations in seam 310, into which CO2 was injected. Increased values of CO2 concentration observed at measurement points 2229 and 6 may indicate CO2 migration in this area: CO2 can easily migrate through these mining excavations exhibiting higher hydraulic conductivities in the northern direction. This also proves the horizontal migration of CO2 towards the old mining excavations, which is triggered by pressure gradients.
An average CO2 flux of approximately 5.8 and 25.3 g/m2/day was calculated for the first and second halves of stage III, respectively. During this period, the average injection flow was measured at about 2600 NL/h in the first half, and 7200 NL/h in the second, which equates to roughly 5.2 and 14.4 kg/h, respectively. Assuming an emission area of 10,000 m2 (based on the contour maps shown in Figure 17, Figure 18 and Figure 19), the measured values would need to fall within the range of 12.5 and 34.6 g/m2/day, respectively, to fully account for the injected amount. Therefore, it can be concluded that while most of the injected CO2 quickly migrated to the surface, a portion remained underground for an extended period.
To assess the amount of CO2 remaining underground, the CO2 loss due to leakage should be subtracted from the injected amount. Considering the calculated average CO2 flux values, it is derived that the total amount of CO2 leaked into the atmosphere during stage III was about 1613 kg. Therefore, about 29.9% of the injected CO2 remained underground at the end of the injection process. As noted, the CO2 concentration in MW 2_bis remained elevated for about four weeks before gradually decreasing to zero. Considering an average flux of 1.5 g/m2/day during that period, this amounts to an additional 420 kg of CO2. In total, it can be inferred that about 267 kg of CO2, or roughly 11.6% of the injected amount, was retained underground
Figure 21 displays measurements taken between stages I and II. After completing the injection, the CO2 concentration in the soil gas remained elevated for up to 20 days. The anomalous CO2 concentrations only dissipated 22 to 24 days after the injection ended. This observation aligns with the conclusion from the previous paragraphs, indicating that a portion of the CO2 remained underground for an extended period after the injection, reaching a new equilibrium after three to four weeks.
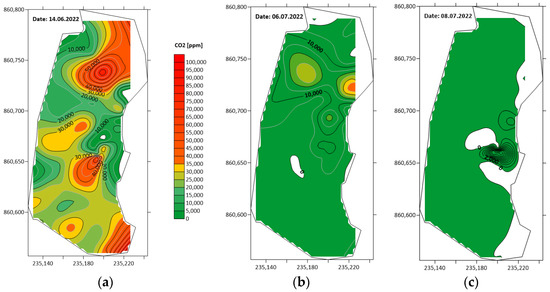
Figure 21.
Maps of CO2 concentrations in soil gas after the injection process was completed: (a) 14 June 2022; (b) 6 July 2022; and (c) 8 July 2022.
4. Discussion
The interpretation of all atmogeochemical monitoring studies, including measurements of CO2 concentrations in the soil gas during the three stages of CO2 injection into coal seam 310 from June to November 2022, proves the migration of carbon dioxide towards the surface. Measurements indicate the CO2 migration from the injection well towards the surface and in the lateral direction.
Taking into account the geological structure of the analyzed area, the thickness of the Carboniferous overburden is relatively low, reaching about 2 m. The overburden formations are made up of layers of sands, loams, and permeable and impermeable clays. The clays occur lenticularly, hindering CO2 migration, which extends the time required for the CO2 to arrive at the surface. The Carboniferous area is represented by layers of claystone, mudstone, and sandstone, with coal beds. Due to the fact that there are various types of former mining excavations in the study area, fractures may have developed in the rock mass above them, creating various types of smaller and larger fissures that allow gas to migrate to other locations in the rock mass towards the surface.
The average overburden sandstone porosity for the analyzed depth range is 16.87%, with maximum values of 24.47%, and the average permeability is 92.12 mD, with maximum values of 326 mD.
Due to the fact that sandstone, mudstone, and claystone are all present in the overburden, and the rocks above coal seam 310 are largely fractured as a result of drilling the old mining excavations, for the calculations of the gas migration time, a porosity of 12% and a permeability of 80 mD resulting from field and lab data were considered.
It was assumed that the rocks forming the overburden layers (sand, clay, loam) are hydraulically permeable formations. During the assessment of gas migration through the Carboniferous rock mass and its overburden, an analysis was carried out using the basic laws related to gas migration in porous media, described by the relationships presented in Equation (2).
The velocity of the gas, with its gravitational movement in the vertical direction, is [54]:
where:
- —change in brine and gas density at reservoir conditions, kg/m3;
- —velocity in a porous medium, m/s;
- —gravitational acceleration, m/s2;
- —vertical permeability of the rock, m2;
- —coefficient of dynamic viscosity, Pa∗s.
The migration time through the considered layer is [54]:
where:
- —thickness of the layer, m;
- —coefficient of effective porosity, [-].
Based on Equations (2) and (3), the calculated CO2 migration time from seam 310 to the top of the Carboniferous area is 28.06 h (1.17 days), and its time-dependent development is shown in Figure 22.
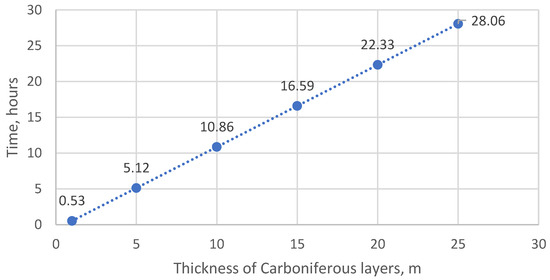
Figure 22.
Time of gas migration from seam 310 to the top of the Carboniferous area.
The assessment of gas migration through the overburden of the Carboniferous area was carried out based on the analysis of the lithological and hydrogeological data.
The time of gas migration through the Quaternary formations in the interval of the Quaternary overburden thickness up to 5 m is shown in Figure 23. The migration time through the Quaternary formations in the analyzed research area (from the Carboniferous top to the surface, i.e., about 2 m) is 11 min (0.19 h).
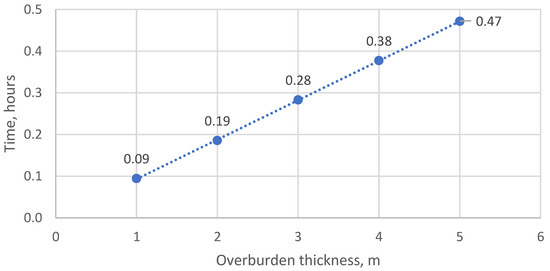
Figure 23.
Time of gas migration through the Quaternary overburden.
According to the calculations, the time of gas migration through the Carboniferous layers above seam 310 is about 28 h, while for the overburden layers with a thickness of about 2 m, this time is reduced to 11 min, yielding a total time for the gas to reach the surface of about 28.19 h.
It should be noted that in the case of the presence of fractures, the migration time may be significantly reduced. For example, the estimation of the gas migration time as a function of the vertical distance from the injection site for a vertical fracture aperture in the order of 1 mm is shown in Figure 24.
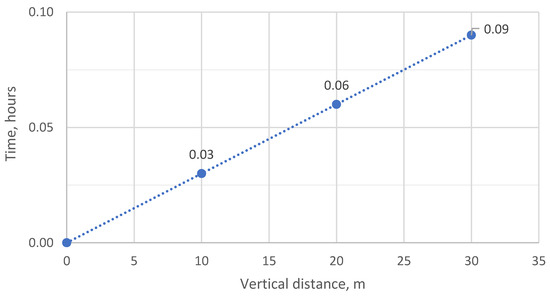
Figure 24.
Time of gas migration as a function of the vertical distance from the injection site (for a vertical fracture of the order of 1 mm) [54,55].
The above considerations show that assuming the presence of various rock layers (sandstone, claystone, sand, and clay) in the geological profile, the rate of migration in the Quaternary formations will be significantly reduced.
In the case of general assumptions, assuming average values of porosity and permeability for the Carboniferous and overburden formations, the injected gas can reach the ground surface within one day, as shown by the time-dependent increase in CO2 concentrations in the soil gas.
Daily changes in CO2 concentrations are observed, which proves the migration of CO2 in the rock mass, which is determined by the different hydraulic conditions in the overburden. At the same time, this phenomenon informs us about the horizontal CO2 migration.
The atmogeochemical tests the and calculated CO2 fluxes show that CO2 migration and leakage occur in the study area through the rock formations towards the surface. It is difficult to calculate the exact amount of leaked CO2 mass, due to the fact that the CO2 fluxes measured by the accumulation chamber method were only available for the last stage of CO2 injection, as well as only at selected points in the study area. The presented assessment indicates that about 11.6% of the injected amount remained underground.
5. Conclusions
The in-situ tests, performed at Experimental Mine Barbara in Mikołów, Poland, consisted of injecting CO2 into a coal seam through a horizontal well, utilizing variable well lengths and injection parameters across three stages. The experiments included monitoring for CO2 leakage and migration within the coal seam. The initial objective was to examine the correlation between the CO2 injection rate and the coal–CO2 contact area. This focus later shifted to more detailed leakage monitoring. The total mass of CO2 injected was about 7700 kg.
CO2 leakage monitoring techniques included using a 2 m deep piezometer grid and conducting measurements with an accumulation chamber. Elevated CO2 concentrations, up to 5% higher than the established background values, were measured in the piezometers during the injection process. Measurements using the accumulation chamber enabled a quantitative assessment of CO2 fluxes. The combination of these techniques assisted in evaluating the extent of CO2 leakage.
Due to CO2 leakage, the CO2 mass injected during the experiment was significantly higher than that originally planned. Nevertheless, the injection system has been flexibly designed. Therefore, it was still possible to carry out the experiment at elevated mass flow rates. The implementation of vertical monitoring wells allowed for the monitoring of CO2 concentrations in the coal seam during the injection.
The findings of this study indicate that significant preferential fluid flow pathways must exist in the vicinity of the injection well, most likely in the area of MW 2. This fact prevented establishing any relevant pressure buildup during the injection. It is not clear whether this hydraulic heterogeneity in the coal seam existed before the project started, or if it was generated by the drilling of the horizontal IW.
The experiments at the EMB demonstrated that shallow coal seams of low thickness may retain a specific amount of CO2, preventing its leakage to the surface. The results showed that about 11.6% of the CO2 injected remained within the geological formation after the experiment was concluded (including post-injection gradual emission). A portion of this CO2 was absorbed by the coal, while the remainder persisted in the fractures and pores. Considering the cascading effect of multiple seams, as is the case in the Upper Silesian Coal Basin, it can be concluded that, in the event of CO2 leakage during injection into one of the deeper seams (e.g., at 1000 m depth), the coal seams above it may act as additional insulating layers. These layers could adsorb the CO2 migrating to the surface, thereby preventing it from leaking into the atmosphere.
It is worth noting that CO2 injection at a 30 m depth is not viable for commercial operations. The project’s objectives were solely scientific, aimed at deepening the understanding of the injection process as it moves toward commercialization. The injection was carried out under very specific conditions, namely relatively low pressure. Given that most existing research has focused on vertical injection wells and higher injection pressure, the results presented here are scarcely comparable with existing data.
Practical recommendations for future in situ tests or commercial implementation can be derived based on the present findings:
- Implementations should be preceded by extensive geological studies to support the proper design of the injection installation. With well-known geological information, it is possible to further enhance the design by supportive numerical modeling, which allows for the simulation of the injection process and obtaining insights on the feasible process conditions, including maximum pressures, injection rates, the total injected yield, etc.
- The designed installation should allow for high flexibility in terms of the potential process conditions. Even if properly geologically researched and simulated, the final injection parameters may differ significantly from what was originally expected. The predicted values of process pressure, temperature, gas mass flow, etc., should constitute the basis for designing the nominal parameters of the installation’ components, but each sensor and controller should allow for the highest available range of measurement and control, respectively.
- The installation should allow for the monitoring of the most significant parameters, such as pressure, temperature, and the mass flow of the CO2 injected. These parameters are crucial for monitoring and quantifying the processes, including the operational safety (e.g., spotting leakage from the pipelines in the mine workings).
- Depending on the circumstances, the horizontal injection well can be drilled either from the surface, with the use of directional drilling, or from existing mining workings (as was the case in the ROCCS project). In the latter case, it is important to seal the first few dozen meters of the borehole (via a casing pipe and cementing) to ensure that the injected CO2 does not migrate into the mine workings.
- The drilling process needs to be carried out cautiously to mitigate coal seam fracturing, potentially resulting in reduced caprock integrity, especially in the case of low-thickness coal seams. Such fractures can promote the creation of preferential pathways or enlarge existing ones. This can lead to CO2 leakage into the overburden and to the surface.
- If there is no steady pressure buildup during injection, it could be an indicator of potential CO2 leakage. A preferential horizontal migration pathway could exist without any surface leakage. However, if the monitoring system also supports the leakage scenario, the injection process in the specific well should be terminated, as there are no countermeasures to fix a compromised injection well/coal seam area.
- Typically, to prevent gas leakage, CO2 should be injected at a pressure proportional to the hydrostatic pressure found in the coal seam, which is approximately 1 bar for every 10 m of depth. In the case of a water-saturated coal seam, other factors come into play, such as overcoming capillary entry pressures and managing pressure buildup due to variations in permeability. Consequently, the required injection pressure will need to be significantly higher.
Supplementary Materials
The following supporting information can be downloaded at: https://www.mdpi.com/article/10.3390/en16207217/s1, File S1: This file is an extension to Section 2. Materials and Methods, containing documentation, laboratory results, and detailed methodology of the CO2 flux measurements; File S2: This file serves as an extension to Section 3. Results, and contains tables with data used to develop the contour maps.
Author Contributions
Conceptualization, K.S., R.H., J.C., T.U., M.W., S.M., S.S., T.K., C.O., P.E. and H.R.T.; methodology, K.S., R.H., J.C., T.U. and M.W.; investigation, K.S., R.H., J.C., T.U. and M.W.; validation, K.S., S.M., T.K. and H.R.T.; formal analysis, K.S., S.M., T.K. and H.R.T.; writing—original draft preparation, K.S.; writing—review and editing, K.S., R.H., J.C., T.U., M.W., S.M., S.S., T.K., C.O., P.E. and H.R.T.; visualization, K.S., R.H., J.C., T.U. and M.W.; supervision, K.S.; project administration, K.S., S.M., T.K. and H.R.T.; funding acquisition, K.S., T.K. and H.R.T. All authors have read and agreed to the published version of the manuscript.
Funding
The research was conducted as part of the “Establishing a Research Observatory to Unlock European Coal Seams for Carbon Dioxide Storage (ROCCS)” project and co-financed by the program of the Minister of Science and Higher Education, entitled “PMW”, in the years 2020–2023; (agreement No. 5144/FBWiS/2020/2). The ROCCS project has received funding from the Research Fund for Coal and Steel under Grant Agreement No. 899336. This financial support is gratefully acknowledged.
Data Availability Statement
The data presented in this study are available on request from the corresponding author.
Conflicts of Interest
The authors declare no conflict of interest. The funders had no role in the design of the study; in the collection, analyses, or interpretation of data; in the writing of the manuscript; or in the decision to publish the results.
References
- IPCC. Summary for Policymakers. In Global Warming of 1.5 °C; An IPCC Special Report; IPCC: Geneva, Switzerland; World Meteorological Organization: Geneva, Switzerland, 2018; p. 32. ISBN 978-92-9169-151-7. [Google Scholar]
- EU Green Deal. Communication from the Commission to the European Parliament, the European Council, the Council, the European Economic and Social Committee and the Committee of the Regions, 2019. Available online: https://ec.europa.eu/info/strategy/priorities-2019-2024/european-green-deal_en#documents (accessed on 15 August 2023).
- Bruhn, T.H.; Naims, H.; Olfe-Kräutlein, B. Separating the debate on CO2 utilisation from carbon capture and storage. Environ. Sci. Policy 2016, 60, 38–43. [Google Scholar] [CrossRef]
- CCS Institute. Targeting Climate Change. The Global Status of CCS: 2019; CCS Institute: Melbourne, Australia, 2019. [Google Scholar]
- Vangkilde-Pedersen, T.; Anthonsen, K.L.; Smith, N.; Kirk, K.; Neele, F.; van der Meer, B.; Le Gallo, Y.; Bossie-Codreanu, D.; Wojcicki, A.; Le Nindre, Y.-M.; et al. Assessing European capacity for geological storage of carbon dioxide–the EU GeoCapacity project. Energy Procedia 2009, 1, 2663–2670. [Google Scholar] [CrossRef]
- Bachu, S. Screening and Ranking Sedimentary Basins for Sequestration of CO2 in Geological Media in Response to Climate Change. Environ. Earth Sci. 2003, 44, 277–289. [Google Scholar] [CrossRef]
- Stevens, S.H.; Spector, D.; Riemer, P. Enhanced Coalbed Methane Recovery and CO2 Sequestration. J. Pet. Technol. 2001, 53, 84–89. [Google Scholar] [CrossRef]
- Bromhal, G.; Sams, W.N.; Jikich, S.A.; Ertekin, T.; Smith, D.H. Simulation of CO2 Sequestration in Coal Beds: The Effects of Sorption Isotherms. Chem. Geol. 2005, 217, 201–211. [Google Scholar] [CrossRef]
- Sams, W.N.; Bromhal, G.; Jikich, S.A.; Ertekin, T.; Smith, D.H. Field Project Designs for Carbon Dioxide Sequestration and Enhanced Coalbed Methane Production. Energy Fuels 2005, 19, 2287. [Google Scholar] [CrossRef]
- Remner, D.J.; Ertekin, T.; Sung, W.; King, G.R. A parametric study of the effects of coal seam properties on gas drainage efficiency. SPE Reserv. Eng. 1986, 1, 633–646. [Google Scholar] [CrossRef]
- Palmer, I.; Mansoori, J. How Permeability Depends on Stress and Pore Pressure in Coalbeds: A New Model. SPE Res. Eval. Eng. 1998, 1, 539–544, SPE-52607-PA. [Google Scholar] [CrossRef]
- Anderson, J.; Bachu, S.; Nimir, H.B.; Basu, B.; Bradshaw, J.; Deguchi, G.; Gale, J.; von Goerne, G.; Heidug, W.; Holloway, S.; et al. Underground Geological Storage; Cambridge University Press: Cambridge, UK, 2005. [Google Scholar]
- Fujioka, M.; Yamaguchi, S.; Nako, M. CO2-ECBM field tests in the Ishikari Coal Basin of Japan. Int. J. Coal Geol. 2010, 82, 287–298. [Google Scholar] [CrossRef]
- White, C.M.; Smith, D.H.; Jones, K.L.; Goodman, A.L.; Jikich, S.A.; LaCount, R.B.; DuBose, S.B.; Ozdemir, E.; Morsi, B.I.; Schroeder, K.T. Sequestration of carbon dioxide in coal with enhanced coalbed methane recovery—A review. Energy Fuels 2005, 19, 659–724. [Google Scholar] [CrossRef]
- Pagnier, H.; van Bergen, F.; Krzystolik, P.; Skiba, J.; Jura, B.; Hadro, J.; Wentink, P.; De-Smedt, G.; Kretzschmar, H.-J.; Fröbel, J.; et al. Reduction of CO2 Emission by Means of CO2 Storage in Coal Seams in the Silesian Coal Basin of Poland, in TNO, RECOPOL Final Report; CORDIS: Hialeah, FL, USA, 2006. [Google Scholar]
- EU GeoCapacity. Project no. SES-518318, EU GeoCapacity, Assessing European Capacity for Geological Storage of Carbon Dioxide. Final Report; Česká Geologická služba: Staré Brno, Czech Republic, 2008. [Google Scholar]
- Koperna, G.J., Jr.; Oudinot, A.; McColpin, G.R.; Liu, N.; Heath, J.E.; Wells, A.W.; Young, G.B.C. CO2-ECBM/storage activities at the San Juan Basin’s pump Canyon test site. In Proceedings of the SPE Annual Technical Conference and Exhibition, New Orleans, LA, USA, 4–7 October 2009; Society of Petroleum Engineers: Richardson, TX, USA, 2009. [Google Scholar]
- Pan, Z.; Ye, J.; Zhou, F.; Tan, Y.; Connell, L.D.; Fan, J. CO2 storage in coal to enhance coalbed methane recovery: A review of field experiments in China. Int. Geol. Rev. 2017, 60, 754–776. [Google Scholar] [CrossRef]
- Pagnier, H.J.M.; van Bergen, F.; David, P. Results of the RECOPOL Project: Enhanced Coalbed Methane and CO2 Storage in Poland. Environ. Geosci. 2006, 13, 85–96. [Google Scholar] [CrossRef]
- van Bergen, F.; Winthaegen, P.; Pagnier, H.; Krzystolik, P.; Jura, B.; Skiba, J.; van Wageningen, N. Assessment of CO2 storage performance of the Enhanced Coalbed Methane pilot site in Kaniow. Energy Procedia 2009, 1, 3407–3414. [Google Scholar] [CrossRef][Green Version]
- van Bergen, F.; Krzystolik, P.; van Wageningen, N.; Pagnier, H.; Jura, B.; Skiba, J.; Winthaegen, P.; Kobiela, Z. Production of gas from coal seams in the Upper Silesian Coal Basin in Poland in the post-injection period of an ECBM pilot site. Int. J. Coal Geol. 2009, 77, 175–187. [Google Scholar] [CrossRef]
- Prevedel, B.; Martens, S.; Norden, B.; Henninges, J.; Freifeld, B.M. Drilling and Abandonment Preparation of CO2 storage wells—Experience from the Ketzin pilot site. Energy Procedia 2014, 63, 6067–6078. [Google Scholar] [CrossRef]
- Masoudian, M.S. Multiphysics of carbon dioxide sequestration in coalbeds: A review with a focus on geomechanical characteristics of coal. J. Rock Mech. Geotech. Eng. 2016, 8, 93–112. [Google Scholar] [CrossRef]
- Busch, A.; Gensterblum, Y. CBM and CO2-ECBM related sorption processes in coal: A review. Int. J. Coal Geol. 2011, 87, 49–71. [Google Scholar] [CrossRef]
- Harpalani, S.; Chen, G. Observations of permeability changes in coal during gas production and its effect on production behavior. In Proceedings of the SPE Eastern Regional Meeting, Lexington, KY, USA, 22–24 October 1997; Society of Petroleum Engineers: Richardson, TX, USA, 1997. [Google Scholar]
- Shi, J.Q.; Durucan, S.; Daltaban, T.S. A Numerical Study of the Mechanisms of Openhole Cavity Completions in Coalbed Methane Wells. In Proceedings of the 2nd North American Rock Mechanics Symposium, Montreal, QC, Canada, 19–21 June 1996. [Google Scholar]
- Zhang, G.; Ranjith, P.G.; Fu, X.; Li, X. Pore-fracture alteration of different rank coals: Implications for CO2 sequestration in coal. Fuel 2021, 289, 119801. [Google Scholar] [CrossRef]
- Chen, M.; Hosking, L.J.; Sandford, R.J.; Thomas, H.R. Numerical Analysis of Improvements to CO2 Injectivity in Coal Seams Through Stimulated Fracture Connection to the Injection Well. Rock Mech. Rock Eng. 2020, 53, 2887–2906. [Google Scholar] [CrossRef]
- Wetzel, M.; Otto, C.; Chen, M.; Masum, S.; Thomas, H.; Urych, T.; Bezak, B.; Kempka, T. Hydromechanical Impacts of CO2 Storage in Coal Seams of the Upper Silesian Coal Basin (Poland). Energies 2023, 16, 3279. [Google Scholar] [CrossRef]
- Karacan, C.Ö.; Okandan, E. Optimization of horizontal well patterns for improved methane recovery from coal beds. Fuel 2000, 79, 1417–1436. [Google Scholar] [CrossRef]
- Gentzis, T.; Bolen, D. The use of numerical simulation in predicting coalbed methane producibility from the Gates coals, Alberta inner Foothills, Canada: Comparison with Mannville coal CBM production in the Alberta Syncline. Int. J. Coal. Geol. 2008, 74, 215–236. [Google Scholar] [CrossRef]
- Connell, L.; Pan, Z.; Camilleri, M.; Shangzhi, M.; Down, D.; Carras, J.; Wenzhong, Z.; Xiaokang, F.; Benguang, G.; Briggs, C.; et al. Description of a CO2 enhanced coal bed methane field trial using a multi-lateral horizontal well. Int. J. Greenh. Gas Control. 2014, 26, 204–219. [Google Scholar] [CrossRef]
- Sheng, J.J. Optimization of huff-n-puff gas injection in shale oil reservoirs. Petroleum 2017, 3, 431–437. [Google Scholar] [CrossRef]
- Ren, J.; Ren, J.; Zhang, L.; Ren, S.; Lin, J.; Meng, S.; Ren, G.; Gentzis, T. Multi-branched horizontal wells for coalbed methane production: Field performance and well structure analysis. Int. J. Coal. Geol. 2014, 131, 52–64. [Google Scholar] [CrossRef]
- Zhang, J.; Feng, Q.; Zhang, X.; Hu, Q.; Wen, S.; Chen, D.; Zhai, Y.; Yan, X. Multi-fractured horizontal well for improved coalbed methane production in eastern Ordos basi, China: Field observations and numerical simulations. J. Pet. Sci. Eng. 2020, 194, 107488. [Google Scholar] [CrossRef]
- van Wageningen, W.F.; Wentinck, H.M.; Otto, C. Report and modeling of the MOVECBM field tests in Poland and Slovenia. Energy Procedia 2009, 1, 2071–2078. [Google Scholar] [CrossRef][Green Version]
- Lafortune, S.; Adelise, F.; Bentivegna, G.; Didier, C.; Farret, R.; Gombert, P.; Lagny, C.; Pokryszka, Z.; Toimil, N.C. An experimental approach to adsorption of CO2 + CH4 gas mixtures onto coal (European RFCS CARBOLAB research project). Energy Procedia 2014, 63, 5870–5878. [Google Scholar] [CrossRef]
- PN-G-04560:1998 Standard; Paliwa Stałe—Oznaczanie Zawartości Wilgoci, Części Lotnych Oraz Popiołu Analizatorem Automatycznym. Solid Fuels—Determination of Moisture, Volatile Matter and Ash by Automatic Analyzer. Polish Committee for Standardization: Warsaw, Poland, 1998. (In Polish)
- PN-G-04516:1998 Standard; Paliwa Stałe—Oznaczanie Zawartości Części Lotnych Metodą Wagową. Solid Fuels—Gravimetric Determination of Volatile Matter. Polish Committee for Standardization: Warsaw, Poland, 1998. (In Polish)
- PN-G-04584:2001 Standard; Paliwa Stałe—Oznaczanie Zawartości Siarki Całkowitej i Popiołowej Automatycznymi Analizatorami. Solid Fuels—Determination of Total and Ash Sulfur Content with Automatic Analyzers. Polish Committee for Standardization: Warsaw, Poland, 2001. (In Polish)
- PN-G-04513:1981 Standard; Paliwa Stałe—Oznaczanie Ciepła Spalania i Obliczanie Wartości Opałowej. Solid Fuels—Determination of the Calorific Value and Calorific Value Calculation. Polish Committee for Standardization: Warsaw, Poland, 1991. (In Polish)
- PN-G-04571:1998 Standard; Paliwa Stałe—Oznaczanie Zawartości Węgla, Wodoru i Azotu Automatycznymi Analizatorami—Metoda Makro. Solid Fuels—Determination of Carbon, Hydrogen and Nitrogen Content with Automatic Analyzers—Macro Method. Polish Committee for Standardization: Warsaw, Poland, 1998. (In Polish)
- RS DYNAMICS. ECOPROBE5 Specifications. 2023. Available online: https://www.rsdynamics.com/products/environmental/ecoprobe/ (accessed on 12 September 2023).
- Atkins, P. Chemia Fizyczna; Wydawnictwo PWN: Stryków, Poland, 2001. [Google Scholar]
- Chen, M.; Masum, S.; Thomas, H.R. Three-dimensional cleat scale modelling of gas transport processes in deformable fractured coal reservoirs. Gas Sci. Eng. 2023, 110, 204901. [Google Scholar] [CrossRef]
- Masum, S.A.; Sadasivam, S.; Chen, M.; Thomas, H.R. Low subcritical CO2 adsorption-desorption behavior of intact bituminous coal cores extracted from a shallow coal seam. Langmuir 2023, 39, 1548–1561. [Google Scholar] [CrossRef]
- Chen, M.; Masum, S.A.; Sadasivam, S.; Thomas, H.R.; Mitchell, A.C. Modeling gas adsorption-desorption hysteresis in energetically heterogeneous coal and shale. Energy Fuels 2023, 37, 2149–2163. [Google Scholar] [CrossRef]
- Chen, M.; Masum, S.; Thomas, H. 3D hybrid coupled dual continuum and discrete fracture model for simulation of CO2 injection into stimulated coal reservoirs with parallel implementation. Int. J. Coal Geol. 2022, 262, 104103. [Google Scholar] [CrossRef]
- Sadasivam, S.; Masum, S.; Chen, M.; Stanczyk, K.; Thomas, H. Kinetics of gas phase CO2 adsorption on bituminous coal from a shallow coal seam. Energy Fuels 2022, 36, 8360–8370. [Google Scholar] [CrossRef]
- Masum, S.; Chen, M.; Hosking, L.; Stanczyk, K.; Kapusta, K.; Thomas, H. A numerical modelling study to support design of an in-situ CO2 injection test facility using horizontal injection well in a shallow-depth coal seam. Int. J. Greenh. Gas Contol 2022, 119, 103725. [Google Scholar] [CrossRef]
- Chen, M.; Masum, S.; Sadasivam, S.; Thomas, H. Modeling Anisotropic Adsorption-Induced Coal Swelling and Stress-Dependent Anisotropic Permeability. Int. J. Rock Mech. Min. Sci. 2022, 153, 105107. [Google Scholar] [CrossRef]
- Chen, M.; Masum, S.; Thomas, H. Modeling Adsorption and Transport behavior of Gases in Moist Coal Matrix. Energy Fuels 2021, 35, 13200–13214. [Google Scholar] [CrossRef]
- Chen, M.; Masum, S.; Thomas, H. Modelling Non-isothermal Transport Behavior of Real Gas in Deformable Coal Matrix. Energy Fuels 2021, 35, 1605–1619. [Google Scholar] [CrossRef]
- Nagy, S.; Zawisza, L. Prognoza zagrożeń metanem i gazami toksycznymi w wytypowanych rejonach likwidowanych kopalń na podstawie badań modelowych. In Raport Projektu “Prognoza Skutków Wpływu Elementów Środowiska Geologicznego na Środowisko Naturalne w Związku z Likwidacją Kopalń Węgla Kamiennego”; Unpublished project report; 2004. (In Polish) [Google Scholar]
- Chećko, J. Geologiczne Aspekty Migracji Gazów Kopalnianych na Powierzchnię w Przypadku Likwidacji Kopalń Węgla Kamiennego. Unpublished Doctoral Dissertation, Główny Instytut Górnictwa, Katowice, Poland, 2007. (In Polish). [Google Scholar]


Disclaimer/Publisher’s Note: The statements, opinions and data contained in all publications are solely those of the individual author(s) and contributor(s) and not of MDPI and/or the editor(s). MDPI and/or the editor(s) disclaim responsibility for any injury to people or property resulting from any ideas, methods, instructions or products referred to in the content. |
© 2023 by the authors. Licensee MDPI, Basel, Switzerland. This article is an open access article distributed under the terms and conditions of the Creative Commons Attribution (CC BY) license (https://creativecommons.org/licenses/by/4.0/).