Article

Exploration of Oil/Water/Gas Occurrence State in Shale Reservoir by Molecular Dynamics Simulation

1
Research Institute of Petroleum Exploration & Development, Beijing 100083, China
2
School of Materials Science and Engineering, China University of Petroleum, Qingdao 266580, China
*
Authors to whom correspondence should be addressed.
Energies 2023, 16(21), 7253; https://doi.org/10.3390/en16217253
Submission received: 1 September 2023 / Revised: 4 October 2023 / Accepted: 23 October 2023 / Published: 25 October 2023
(This article belongs to the Section H: Geo-Energy)

Abstract

:
The occurrence state of oil, gas, and water plays a crucial role in exploring shale reservoirs. In this study, molecular dynamics simulations were used to investigate the occurrence states of these fluids in shale nanopores. The results showed that when the alkane is light oil, in narrow pores with a width less than 3 nm, oil molecules exist only in an adsorbed state, whereas both adsorbed and free states exist in larger pores. Due to the stronger interaction of water with the rock surface, the adsorption of oil molecules near the rock is severely prohibited. Oil/water/gas occurrence characteristics in the water-containing pore study indicate that CO2 gas can drive free oil molecules out of the pore, break water bridges, and change the occurrence state of water. During displacement, the gas type affects the oil/gas occurrence state. CO2 has strong adsorption capacity, forming a 1.45 g/cm3 adsorption layer on the rock surface, higher than oil’s density peak of 1.29 g/cm3. Octane solubility in injected gases is CO2 (88.1%) > CH4 (76.8%) > N2 (75.4%), with N2 and CH4 having weak competitive adsorption on the rock. The investigation of different shale reservoir conditions suggests that at high temperature or low pressure, oil/gas molecules are more easily displaced, while at low temperature or high pressure, they are tightly adsorbed to the reservoir rock. These findings contribute to the understanding of fundamental mechanisms governing fluid behavior in shale reservoirs, which could help to develop proper hydrocarbon recovery methods from different oil reservoirs.

1. Introduction

Due to the increasing demand for energy and depletion of traditional reservoirs, unconventional oil and gas that cannot be extracted using regular technologies have emerged as the most crucial alternatives [1,2,3]. These oil and gas resources require the use of new technologies to improve reservoir permeability or fluid properties in order to achieve economic recovery of oil and gas resources [4]. Since the 21st century, significant breakthroughs have been made in the exploration of unconventional oil and gas [5]. Among them, shale reservoirs with micro–nanopores have received great attention, and their position in the energy pattern is becoming increasingly prominent [6]. However, due to the widely distributed nanopores with different types and pore sizes [7,8,9], shale reservoirs generally have low permeability, small porosity, and complex fluid occurrence states [10,11]. Therefore, studying their fluid behavior has important theoretical and practical value.
Studies have revealed that the molecular structure of shale oil generated in its early stages is similar to that of the source rock [12]. The resemblance leads to a strong adsorption affinity between them [13,14], for which shale oil typically adsorbs on the surfaces of microfractures in organic and inorganic pores as oil film [15]. As the generation for hydrocarbon increases, the amount of shale oil may exceed the maximum capacity of current sites and migrate into larger adjacent pores and microcracks [16]. In this stage, shale oil can exist in both free and adsorbed states, and the lighter shale oil that is in a free state can easily migrate into microcracks. Meanwhile, the microcracks are often filled with groundwater, which can impact the distribution and occurrence of the fluids in the shale reservoirs. Moreover, both capillary and surface adsorption forces coexist in the nanopores to influence the occurrence of the retained water and oil [17,18,19], thus contributing to the complexity of the shale oil reservoir. Therefore, it is essential to investigate the occurrence state of the fluids in the shale pores for the oil production.
Currently, diverse methods have been applied to study the occurrence state for the crude oil in unconventional reservoirs. Some characterization techniques have achieved many successful research results, such as scanning electron microscopy, micro–nano CT, and nuclear magnetic resonance [20,21,22]. The combination of geological techniques, like the fluorescence method, pyrolysis gas chromatography, and laser microanalytical technique [23,24,25], along with experimental measurements, like mercury injection experiments and high-speed centrifugation [26,27], enables qualitative and quantitative characterization of the original oil occurrence state. However, achieving precise mechanism study in the occurrence state of the shale reservoir remains challenging due to limitations in the accuracy of the experimental methods. To overcome the barrier and enhance the understanding of the occurrence mechanism at the molecular level, theoretical simulations have been suggested as the most effective method [28,29,30].
This study reveals the basic mechanism of fluid behavior in shale reservoirs by exploring the effects of pore size, gas injection method, reservoir temperature, and pressure on the occurrence state of fluids, which provides theoretical guidance for improving the oil and gas recovery rate of these resources.

2. Models and Methodology

2.1. Modeling

As one of the most widespread minerals on Earth, quartz is the key ingredient of shale [31]. It serves as a significant site for adsorbing oil molecules due to its high surface activity [32]. The main component of quartz is silicon dioxide [31]. Therefore, silicon dioxide was used to represent the mineral component of rock in this study. Rationalization of the rock surface is verified in the supporting information in Figure S1. The α-quartz was obtained from the Materials Studio 2018 (MS) software database and cut along the (01̅0) crystal direction to form a rock surface [33,34,35]. The size of the rock is 200.0 Å × 29.5 Å × 14.1 Å. Hydroxylation of the rock surface was achieved by attaching an H atom to each O atom on the surface [36], making it hydrophilic and consistent with actual shale pore conditions. The surface density of hydroxyl groups after hydroxylation was 9.6 nm−2, which is similar to the result determined by crystal chemistry (5.9–18.8 nm−2) [37].
Medium and shallow reservoirs refer to reservoirs located in the depth range of less than 4500 m underground [38]. In general, the temperature range of medium and shallow reservoirs is between 323 K and 423 K, and the pressure range is between 10 MPa and 50 MPa [39,40,41]. Consequently, a displacement system with a temperature of 333 K and a pressure of 20 MPa was chosen for modeling based on the real reservoir conditions. The initial structure of gas flooding is shown in Figure 1a, with the injecting gas phase on the left and the silicon dioxide nanopores containing oil phase on the right. The oil phase is represented by octane and placed in the hydroxylated silicon dioxide nanopores with flexible molecular bonds. A 3 ns equilibrium molecular dynamics (EMD) simulation was performed using the NVT ensemble to obtain a reasonable oil density. The specific implementation details are shown in the supporting information in Figure S2. CO2 (0.725 g/cm3), N2 (0.188 g/cm3), and CH4 (0.129 g/cm3) are used as the gas phase in the initial model. According to the data from the National Institute of Standards and Technology (NIST), under reservoir conditions of 20 MPa and 333 K, CO2, N2, and CH4 were all in a supercritical state. He plates were positioned on the left and right sides of the structure for gas injection during the simulation of gas flooding. To enable gas injection into the pore, a pressure of 25 MPa was applied to the He plate on the left, and a pressure of 20 MPa was applied to the He plate on the right. In addition to the pore with pure oil phase, Figure 1b depicts a water-containing nanopore of silicon dioxide. The initial structure of miscible simulation is depicted in Figure 1c. The supporting materials in Figure S3 display the precise modeling details.

2.2. Simulation Details

In this study, all simulations were carried out using the Large-scale Atomic/Molecular Massively Parallel Simulator/29Oct20-intelmpi-2020 (LAMMPS) software [42]. All models were simulated using periodic boundary conditions with a time step of 1 fs. All MD simulations were performed in the NVT system. The Nose–Hoover thermostat [43] was set to 333 K to regulate temperature. Both the He plate and the rock surface were considered as rigid bodies. The CO2 model was described by the Elementary Physical Model (EPM2) force field [44,45], while the other fluid molecules were modeled using the Optimized Potentials for Liquid Simulations All-Atom (OPLS-AA) force field [46]. The quartz surface model was based on the Clay Force Field (ClayFF) [47]. The Coulomb potential was employed to describe the long-range electrostatic interaction [48]
E = q i q j 4 π ε 0 r i j
where q i and q j represent the charges of atoms i and j, respectively; ε 0 represents the dielectric constant of the vacuum; and r i j represents the distance between atoms i and j. In this simulation, the non-bonded interactions are based on the Lennard-Jones (LJ) potential [49]
U i j = 4 ε i j σ i j r i j 12 σ i j r i j 6
where ε i j represents the depth of the Lennard-Jones well between atoms i and j, and σ i j represents the zero-potential distance. The cutoff radius is set to be 10 Å. For different types of atoms, the Lorentz–Berthelot mixing rule dictates how they interact with each other [50]
σ i j = 1 2 ( σ i i + σ j j )
ε i j = ( ε i i ε j j ) 1 2
The detailed parameters of the force field are listed in supporting information in Table S1.

3. Results and Discussion

3.1. Oil Occurrence Characteristics in Shale Pores

Shale oil reservoir rocks are characterized to be extremely small pores with pore-throat sizes at the nano-meter scale [51]. Kuila and Prasad have highlighted that the shale matrix primarily consists of micropores with diameters below 2 nm, accompanied by mesopores ranging from 2 to 50 nm in diameter [52]. Furthermore, numerous studies have indicated the significant presence of mesopores in shale reservoirs [53,54,55], which exhibit a distinct slit-like geometry, as observed in scanning electron microscope (SEM) images [56,57,58]. Therefore, to investigate the occurrence of crude oil in shale nanopores, CO2 flooding in slit-shaped pores of 3 nm and 8 nm was simulated. Octane was used as the oil phase for the convenience of calculation. The key feature of oil occurrence in fractured pores is the formation of dense and ordered adsorption layers, which are usually in the range of a few angstroms to tens of angstroms in thickness. As shown in Figure 2a,b, the density distribution of oil in the pores before CO2 injection was calculated to analyze the oil in the adsorption state. According to the calculation, three obvious peaks can be observed close to both surfaces of the shale rock. The result indicates that the oil near the rock is arranged in a tight and orderly way, forming three adsorption oil layers of 5 Å in thickness.
Apart from the adsorbed oil near the pore wall, a large proportion of crude oil can flow freely in the pore space, the ratio of which mainly depends on the width of the pore. The narrow pore of 3 nm is entirely occupied by the oil in the adsorption state. In comparison, the arrangement of oil molecules in the 8 nm pore gradually becomes disordered with the increase in the distance from the rock in Figure 2c, indicating that the oil in the middle area is in a free state. This difference indicates that the presence of free oil mainly depends on the width of the pores. Moreover, since the adsorption layer occupies the pore space of 3 nm, it can be inferred that there are only orderly arranged adsorbed oil films in the pore of smaller than 3 nm. On the other hand, when the pore width is larger than 3 nm, adsorbed and free states of oil coexist in the pore.
To further study the occurrence state of crude oil during displacement, we plotted the velocity distribution curve of the oil phase in the z-direction (perpendicular to the displacement direction) in Figure 3. The curve showed that the migration velocity of oil near the surface is significantly slower than that of oil in a free state in the middle of pores. This proves that the mobility of oil in the free state is considerably higher than that of the adsorbed part, which is due to the tight adsorption of oil on the rock.
The occurrence state of crude oil may also be affected by the length of the alkane carbon chain in the oil phase. To investigate this influence, we modeled the oil phases with C6, C8, C15, and C18. Figure 4 illustrates the density of the four oil phases in the pores, as well as the interaction energy between oil and the rock surface. The density distributions reveal that, except for C18, three obvious adsorption layers are formed by oil molecules close to the rock surface, while free oil exists in the middle of the pore. Upon the increase in the chain length, the interaction energy between the oil and rock turns greater, and the density peak of the adsorption layer grows higher. The phenomenon indicates that larger oil molecules can lead to a more obvious adsorption layer and stronger oil adsorption on the rock. At the same time, the density of the free oil becomes higher along with the longer carbon chain. However, when the oil phase is C18, all oil molecules are arranged in order in the pores due to the strong interaction between C18 and the rock surface. As a result, no free oil molecules are observed, and multiple adsorption layers of the oil phase occupy the whole volume of the pore. In addition, it can be seen from the snapshot of the oil molecules near the rock surface in Figure 5 that the longer the carbon chain is, the easier it is for oil molecules to curl up.
When the oil phase consists of C6, C8, or C15 during the CO2 flooding process, the free oil can be effectively displaced from the pores by CO2. However, when it comes to C18, the oil molecules tend to arrange closely to each other, resulting in stronger interactions among them. Therefore, it becomes challenging for CO2 to displace the oil molecules from the pores. In the simulation, the displacement time is as long as 15 ns when the oil phase is C18; only a small part of the oil phase is displaced, which cannot be compared with other complete displaced oil phases. Therefore, the displacement process of oil phase C18 will not be discussed in the following paragraphs. To gain better understanding of the changes in the occurrence state of oil molecules during the displacement, resident autocorrelation function C R t was utilized to analyse the residence time of oil molecules within the adsorption layer. C R t was calculated by [59]
C R t = O w t O w 0 O w 0 O w 0
where O w t indicates whether a molecule is in the adsorption layer at time t. O w t = 1 indicates a molecule in the adsorption layer, while O w t = 0 indicates that the molecule is removed from the adsorption layer [59,60]. The < > indicate the overall average. The value of C R t is the probability of the target molecule appearing in the statistical region. The value is 1 if the molecule stays in the given statistical region from the initial time to the subsequent time t. A slower decay rate of C R t from 1 to 0 indicates a longer residence time and a greater adsorption strength of the molecule on the pore surface.
The C R t analysis was present in Figure 6 to illustrate the residence time of different oil molecules during the displacement process. The results indicate that oil molecules with shorter carbon chains exhibit a more rapid decline rate of C R t from 1 to 0. This suggests that smaller oil molecules have a shorter residence time in the adsorption layer and are more easily detached from the rock to turn into free oil. Conversely, larger oil molecules exhibit a stronger adhesion force, which causes the firm attachment to the adsorption layer and longer residence time on the surface.

3.2. Water Occurrence Characteristics in Shale Pores

Hydraulic fracturing is commonly used during oil exploration, which will result in residue water in the shale nanopores. The existence of water in pores will affect the occurrence state of oil and the displacement process. Xu et al. [28] found that when the mass fraction of water is 50%, the adsorption of oil molecules on the quartz wall is blocked, and all oil molecules appear in the form of free shale oil. The study by Xu et al. only considered the situation where the mass fraction of water was 50%, but the amount of water in the pores would also influence the state of each phase’s occurrence there. To investigate this effect, we constructed pores containing water of 55% and 80% and conducted equilibrium molecular dynamics simulations for a duration of 3 ns. The optimized structural configurations of both models are shown in Figure 7, which reveals that water molecules were more likely to be drawn together in the 80%-water-containing pore due to the higher capillary forces. The rearrangement of water has resulted in the formation of water bridges connecting the upper and lower surfaces of the pore. In contrast, the thin films formed by water molecules in the 55%-water-containing pore remain separated on the pore surface instead of forming water bridges.
Furthermore, to gain insights into the competing adsorption of oil/gas phases on rock, the interaction between oil/gas and the rock surface was calculated as follows [61,62]:
E o i l r o c k = E o i l + r o c k E o i l + E r o c k
E H 2 O r o c k = E H 2 O + r o c k E H 2 O + E r o c k
where E o i l r o c k and E H 2 O r o c k are the interaction energies between oil/water molecules and the rock surface, and E o i l + r o c k and E H 2 O + r o c k are the energies of the system including oil/water molecules and rock surface. E o i l , E r o c k , and E H 2 O represent the energy of oil molecules, rock surface, and water molecules, respectively. The results of the calculations are shown in Table 1.
The interaction between oil/water and rock suggests that the adsorption of water molecules on rock is stronger than the adsorption of oil molecules. And water molecules occupy all the adsorption sites near the rock, which leads to a reduction of the adsorbed oil molecules, making it impossible for oil to contact rock directly. Thereby, the oil phases in both models are in a free state in the pore, with minimal interaction with the rock. The result also indicates that water has stronger competitive adsorption at the rock surface compared to oil.
During flooding, the injection of CO2 will affect the occurrence state of the oil and water phase in the pore. As shown in Table 1, the high E H 2 O r o c k makes it difficult for CO2 to displace tightly attached water film from the rock surface. Therefore, the occurrence state of the water phase in the pores without a water bridge barely changes during CO2 flooding. On the contrary, CO2 molecules can effectively displace the free oil out of the pore, resulting in changes in the occurrence state of the oil phase. On the other hand, when a water bridge is formed, as seen in the 80%-water-containing pore, CO2 molecules are able to break the H-bond between water molecules, causing the water bridge to collapse from the center and change the occurrence state of water, as shown in Figure 8a. This is mainly due to the fact that when CO2 molecules enter the pores and interact with water molecules, the stronger van der Waals forces between CO2 and water molecules will surpass the interactions between the water molecules, thus replacing the water–water hydrogen bonds. This disruption can lead to weaker linkages between water molecules and the breaking of water bridges. Also, as a result, the number of H-bonds between water molecules decreases gradually with the entry of CO2 into the pores in Figure 8b. This phenomenon was also reflected in a previous study by Liu et al. [19].

3.3. Gas Occurrence Characteristics in Shale Pores

The occurrence state of gas plays an important role in oil displacement during gas flooding-enhanced oil recovery (EOR). Currently, CO2, N2, and hydrocarbon were commonly utilized in gas EOR technology [63,64,65]. However, in previous studies [28,29,66], injected gas was not discussed or only the change of the oil occurrence state when the injected gas was CO2 was explored. Therefore, the effects of CO2, N2, and CH4 on the occurrence state of oil are studied here. Figure 9 shows the gas occurrence state of CO2/N2/CH4 in reservoir pores after the miscible process with oil. The simulation reveals that a portion of the oil molecules will dissolve in CO2 when the gas enters the pore and mixes with oil. CO2 will then replace the oil molecules and appear near the rock surface, forming an adsorption layer. In comparison, fewer oil molecules are dissolved in N2 and CH4, which can be reflected by the calculated solubility shown in Figure 10. The solubility values of oil molecules in different injected gases are in the order of CO2 (88.1%) > CH4 (76.8%) > N2 (75.4%).
Figure 11 shows the variation of the interaction energy with time during the mixing of CO2/N2/CH4 with oil. It can be seen that E O i l C O 2 is much larger than E O i l N 2 and E O i l C H 4 , indicating that CO2 has a stronger adsorption capacity and is easier to peel off oil from the rock surface. Therefore, E O i l R o c k (CO2 flooding) is small because the CO2 molecules occupy the sites near the surface and block the contact between rock and oil. Competitive adsorption also exists between CH4 and alkane molecules. However, only a small portion of CH4 can be adsorbed on the rock because of the short carbon chain of CH4, which has less contact with the rock and weaker interaction with the long-chain oil. The E O i l R o c k (CH4 flooding) is higher, with large numbers of oil molecules remaining attaching to the rock. Comparatively, N2 has weaker competitive adsorption on the rock, and almost no N2 is adsorbed on the rock. Therefore, the adsorption layer on the rock is still oil phase with the largest E O i l R o c k   (N2 flooding). And the oil molecules are clustered together due to the low E O i l N 2 .
Additionally, upon the gas injection, the oil/gas occurrence state will change during the displacement process. There will be competitive adsorption between CO2 and oil during the CO2 flooding process, so that the intertwined oil molecules will be separated and peel off from the rock surface. The destruction of the oil film can be seen from the decrease in the oil density peak in Figure 2. Finally, all the oil near the rock will be stripped by CO2 into a free state. Based on the distribution of CO2 density, it can be observed that the density peak of CO2 gradually appears on the rock surface. This suggests that after oil has been stripped, CO2 is adsorbed on the rock surface, creating an adsorption layer of CO2 on the rock surface. During the process of displacement, compared to the density peak of oil, which is 1.29 g/cm3, the highest adsorption peak of CO2 can reach 1.45 g/cm3. Therefore, the competitive adsorption of CO2 in hydrophilic shale is stronger than that of petroleum.
Due to the good elasticity and expansion ability, N2 will not be adsorbed on shale rock, but will form a gas channel in the oil phase instead. A large number of free oil molecules will be driven out of the pores by N2, but some oil molecules remain, existing in the adsorption layer during displacement. In the case of CH4 flooding, the solubility of CH4 in the oil phase is low, so that it is easier to form a CH4 gas channel than CO2. Due to the competitive adsorption between CH4 and crude oil on the rock, part of the oil will be adsorbed to the rock again after being peeled off by CH4 and thus re-form an oil adsorption layer. Therefore, both CH4 and oil phases exist in the adsorption layer during CH4 flooding.

3.4. Effect of Different Shale Reservoir Conditions

The reservoir environment is complex because the formation temperature and pressure change rapidly at different depths. The state of oil/gas occurrence is frequently altered by the diversification of the reservoir environment. When the temperature in the reservoir increases or the pressure decreases, the oil molecules will be more closely adsorbed on the rock surface. Therefore, the peak value of the oil adsorption layer and the density of the free state will be higher. As shown in Figure 12, the higher temperature or lower pressure in the reservoir will cause the average kinetic energy of molecules to increase, enabling oil molecules to dissolve more effectively in CO2. As a result, oil molecules will be more easily dissolved in CO2. Furthermore, the density of the adsorbed layer and the free oil will drop faster during the entire CO2 displacement process.

4. Conclusions

The occurrence state of oil/gas/water in the shale reservoir is investigated in this research by molecular dynamics simulation. The main conclusions are as follows:
(1)
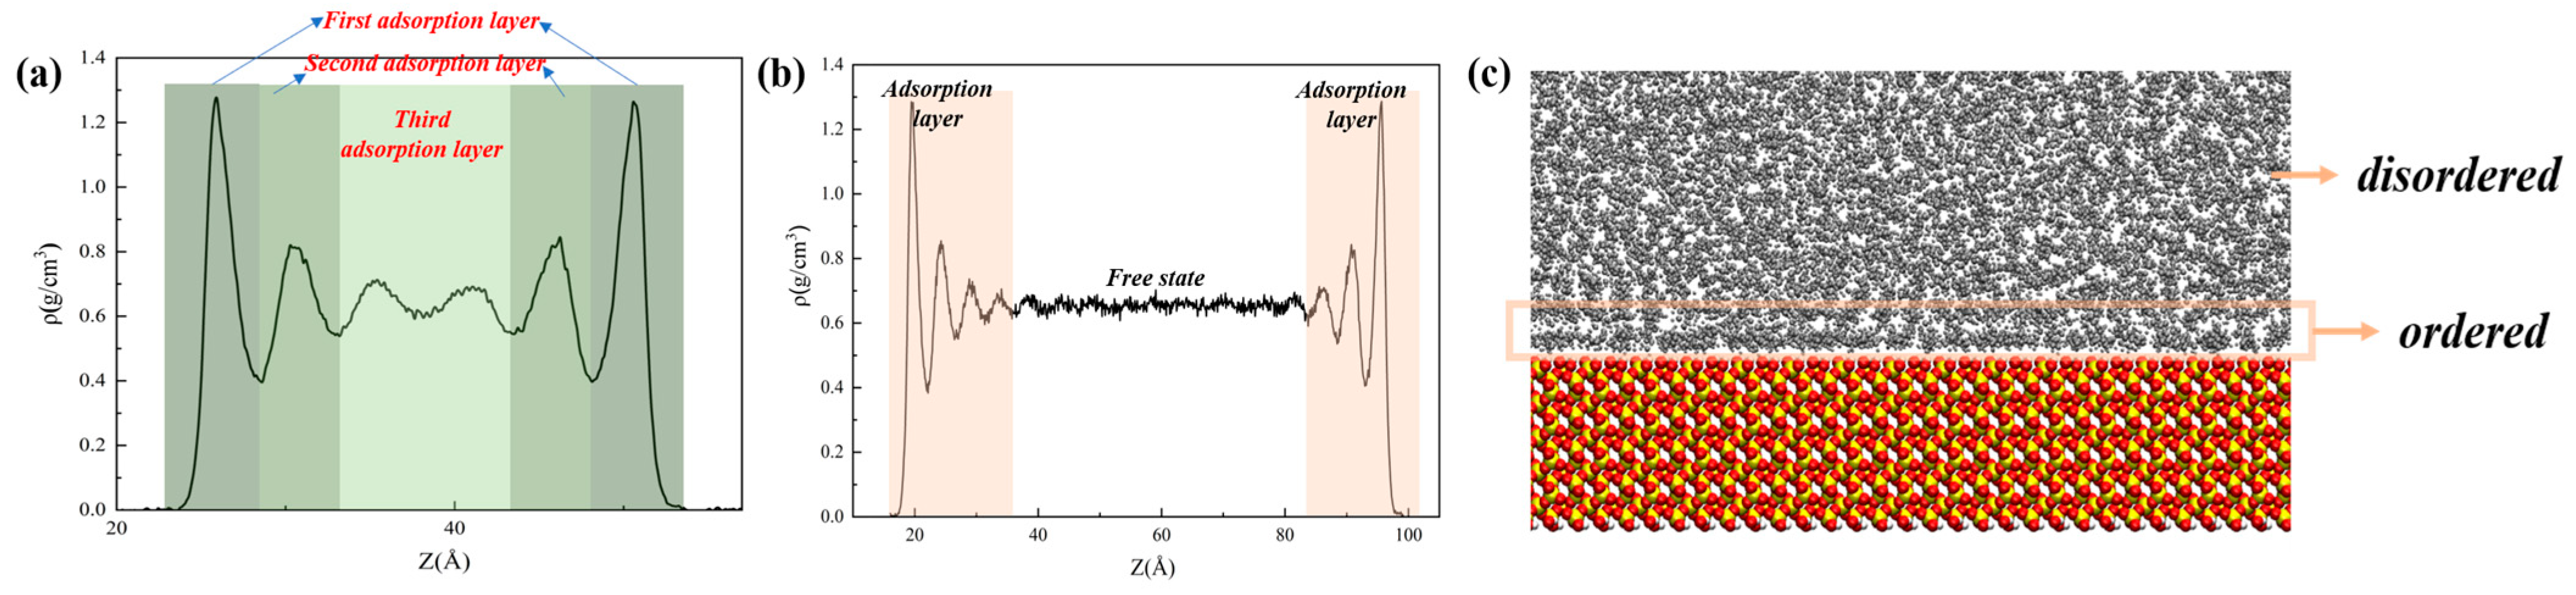
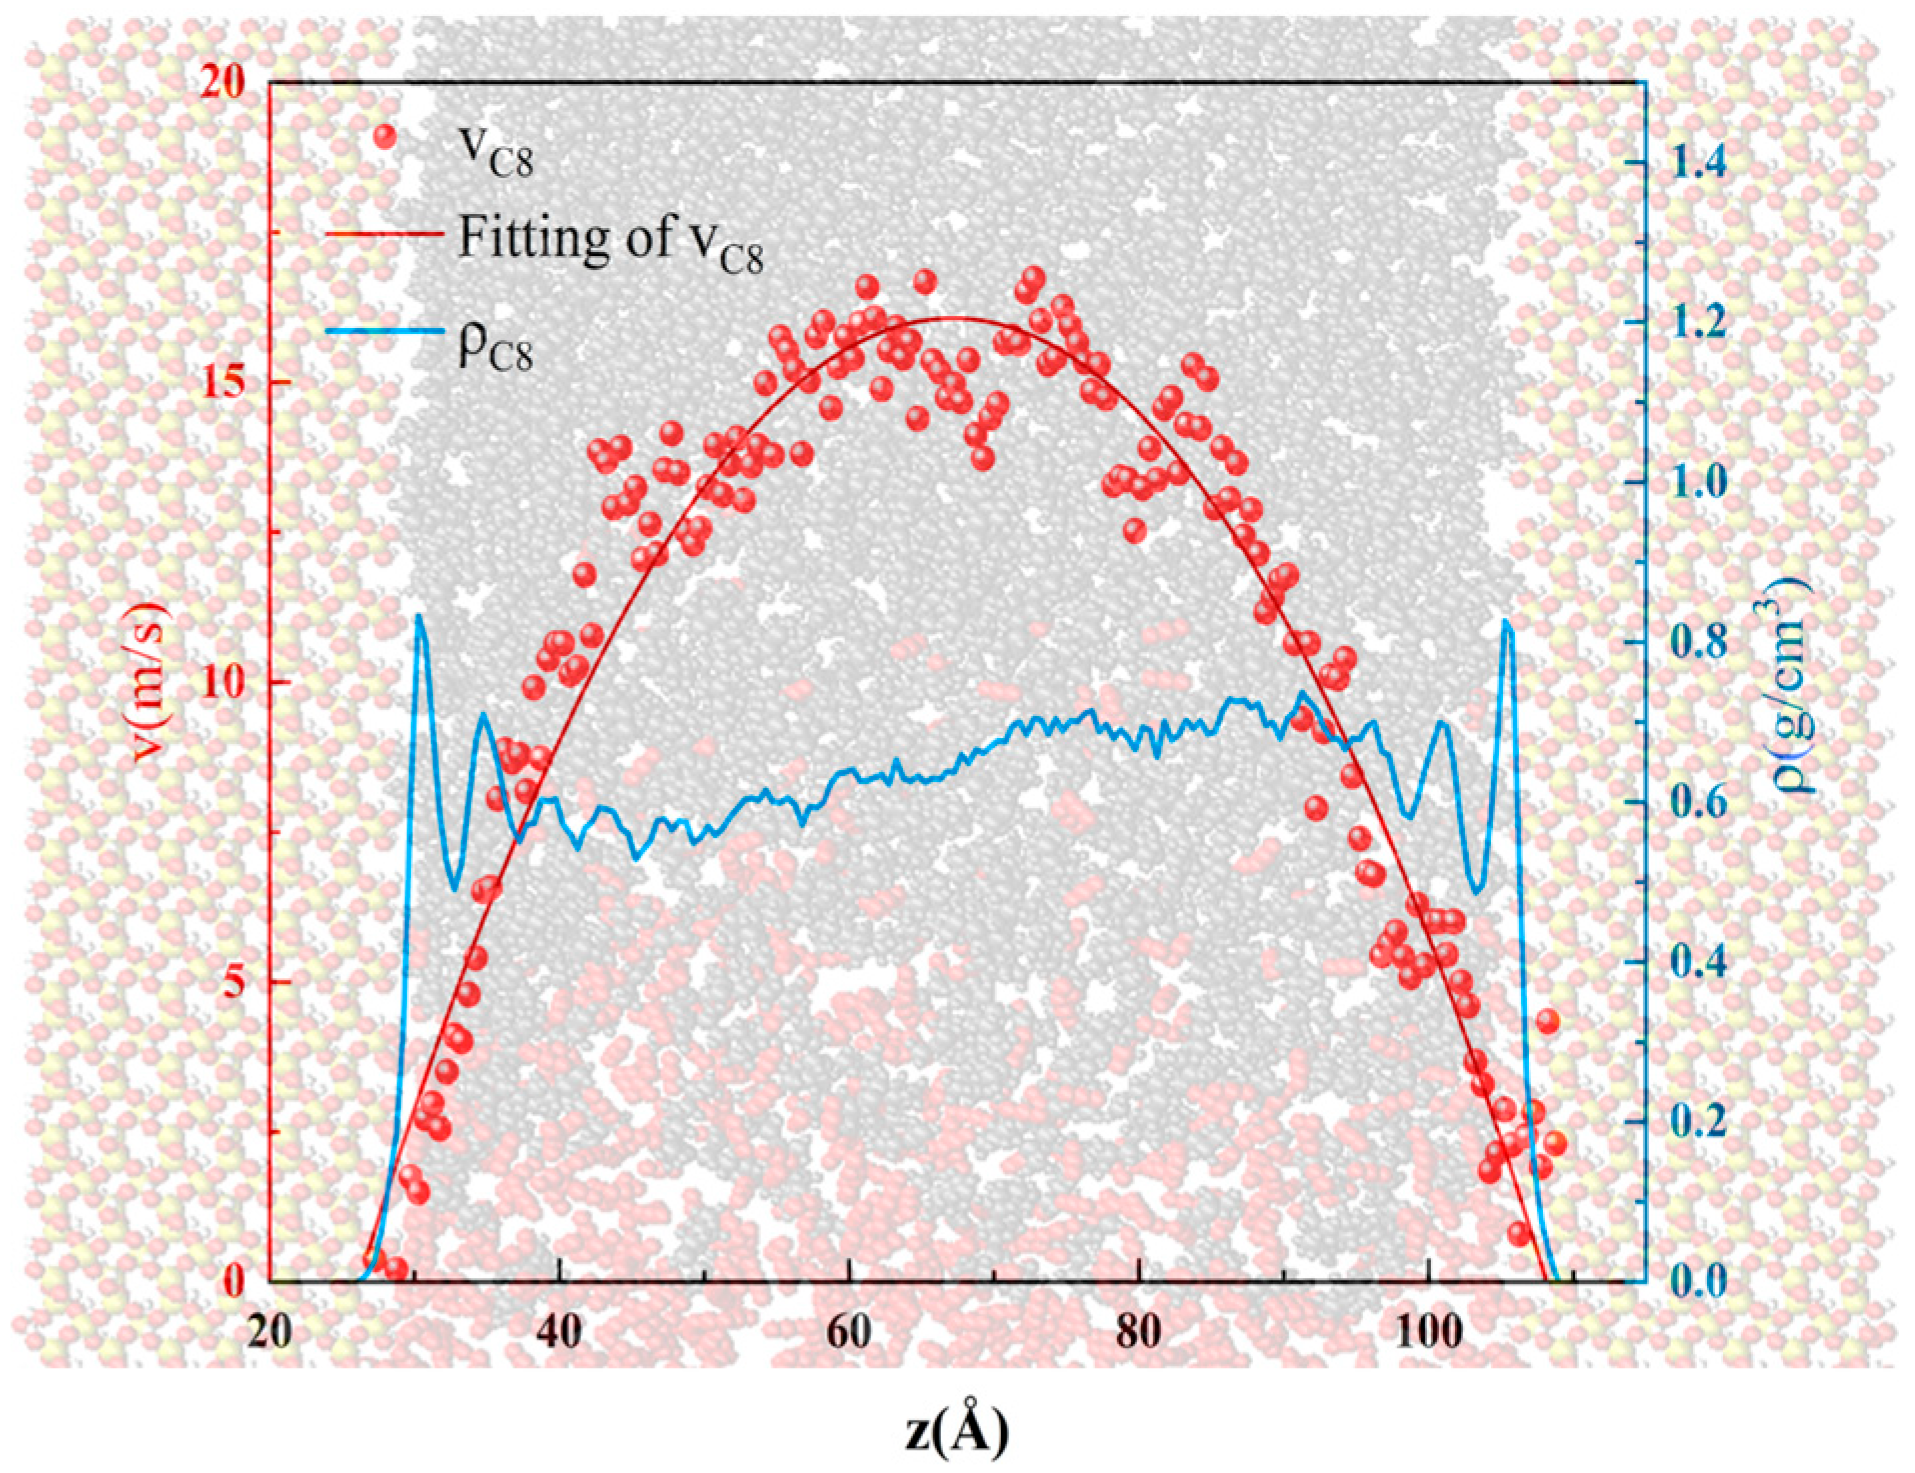
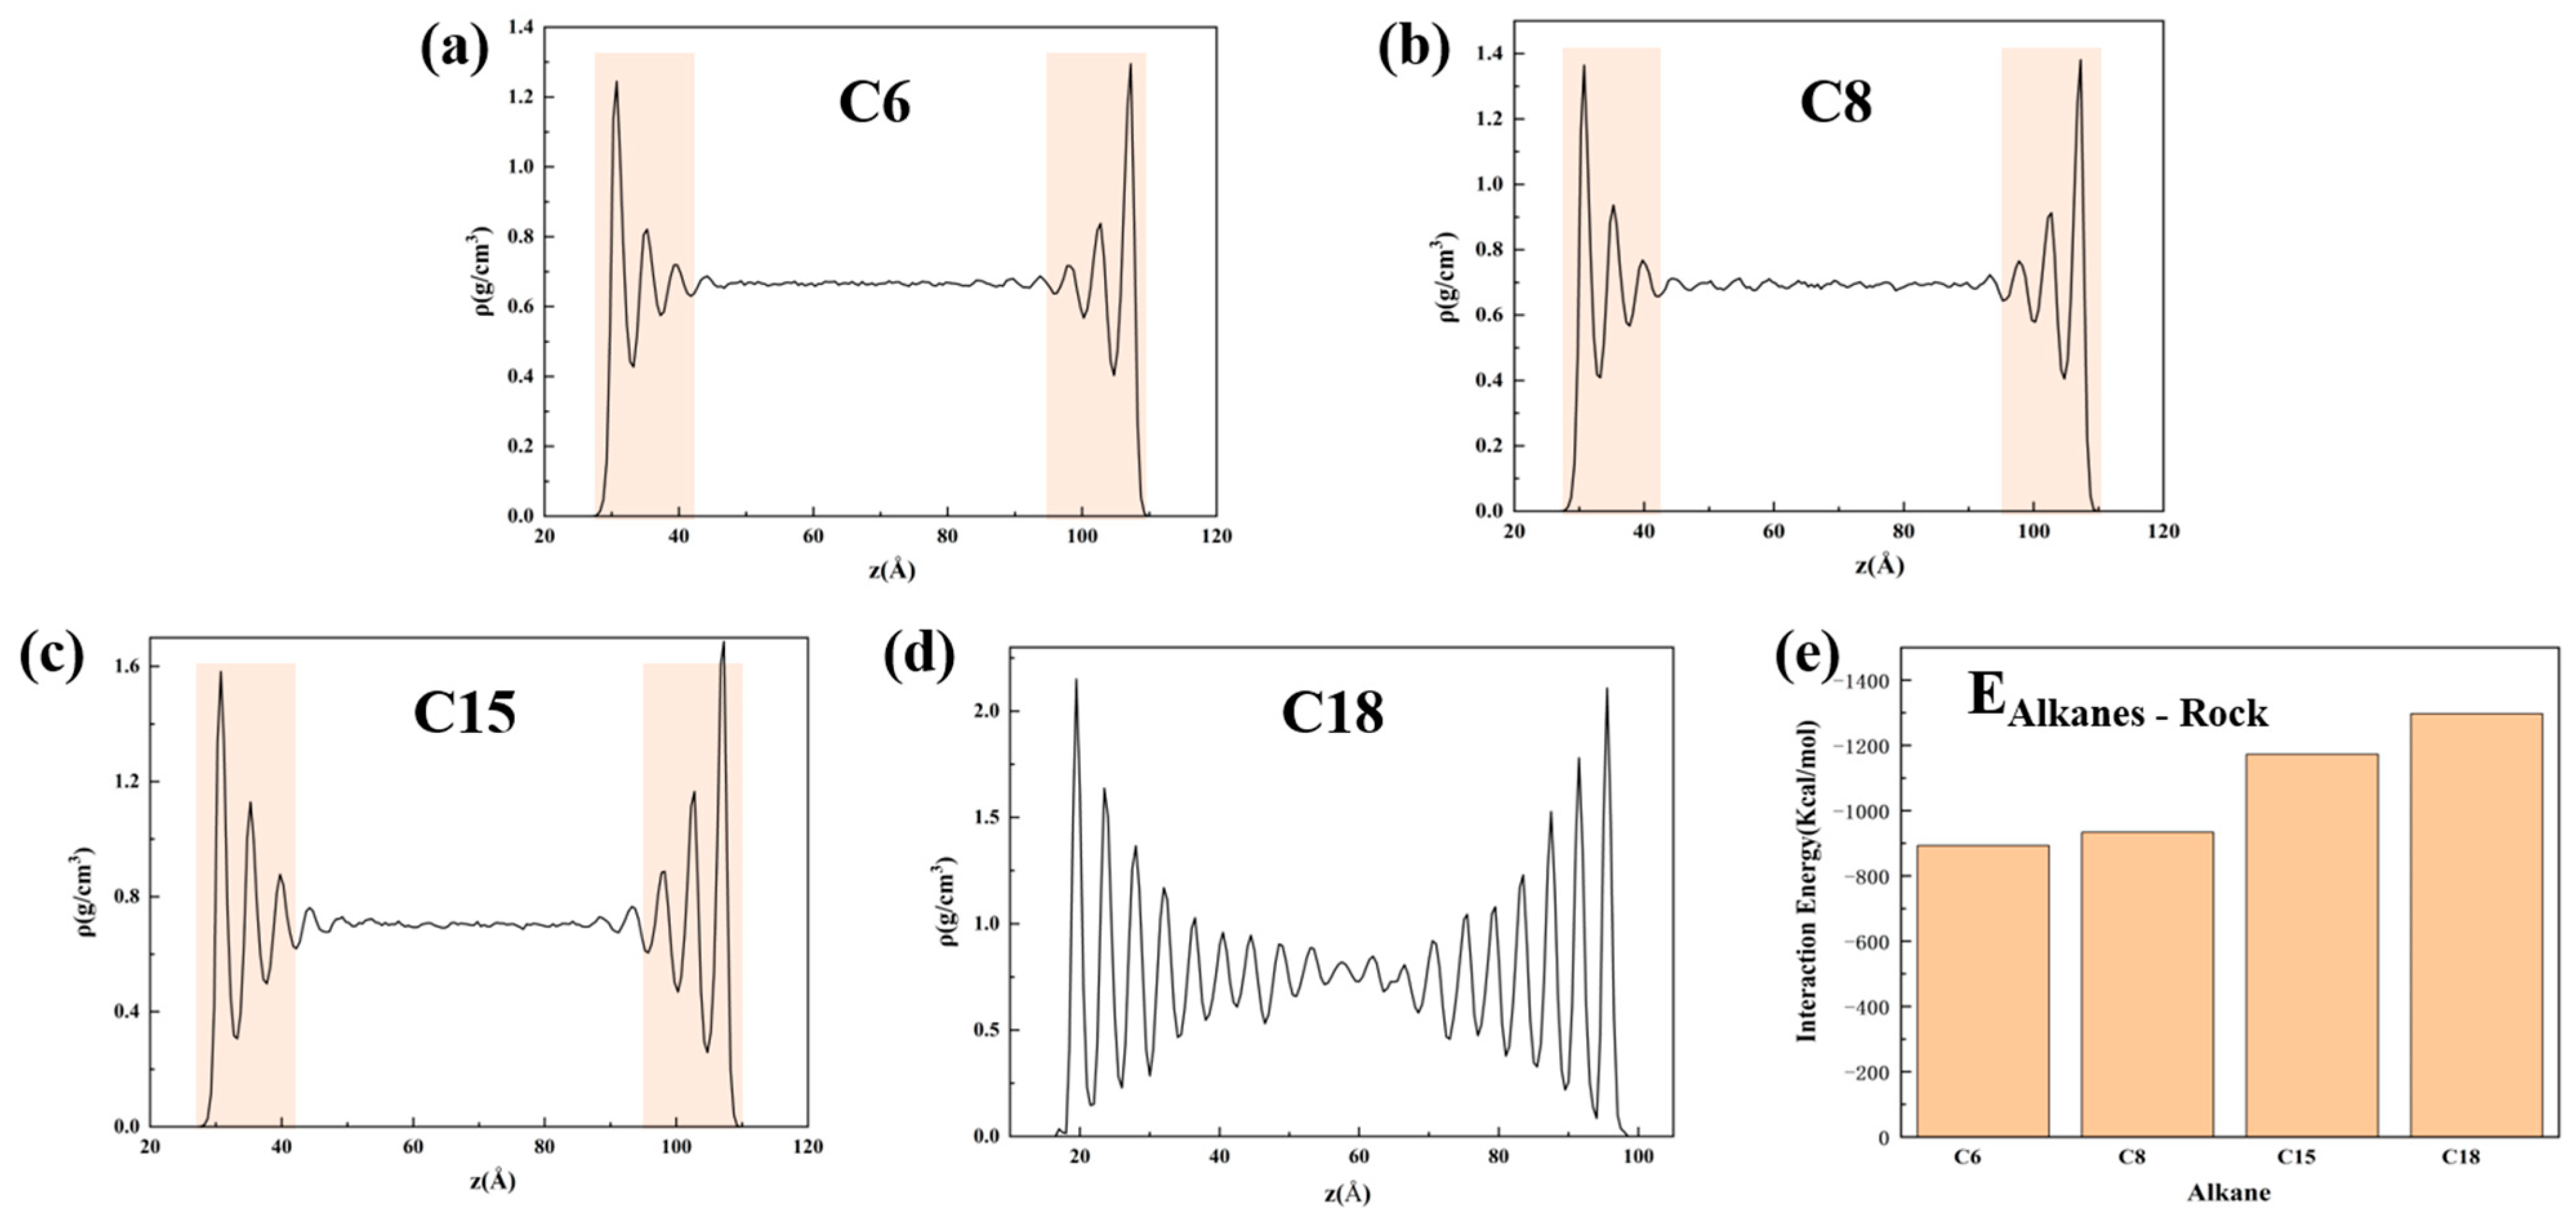
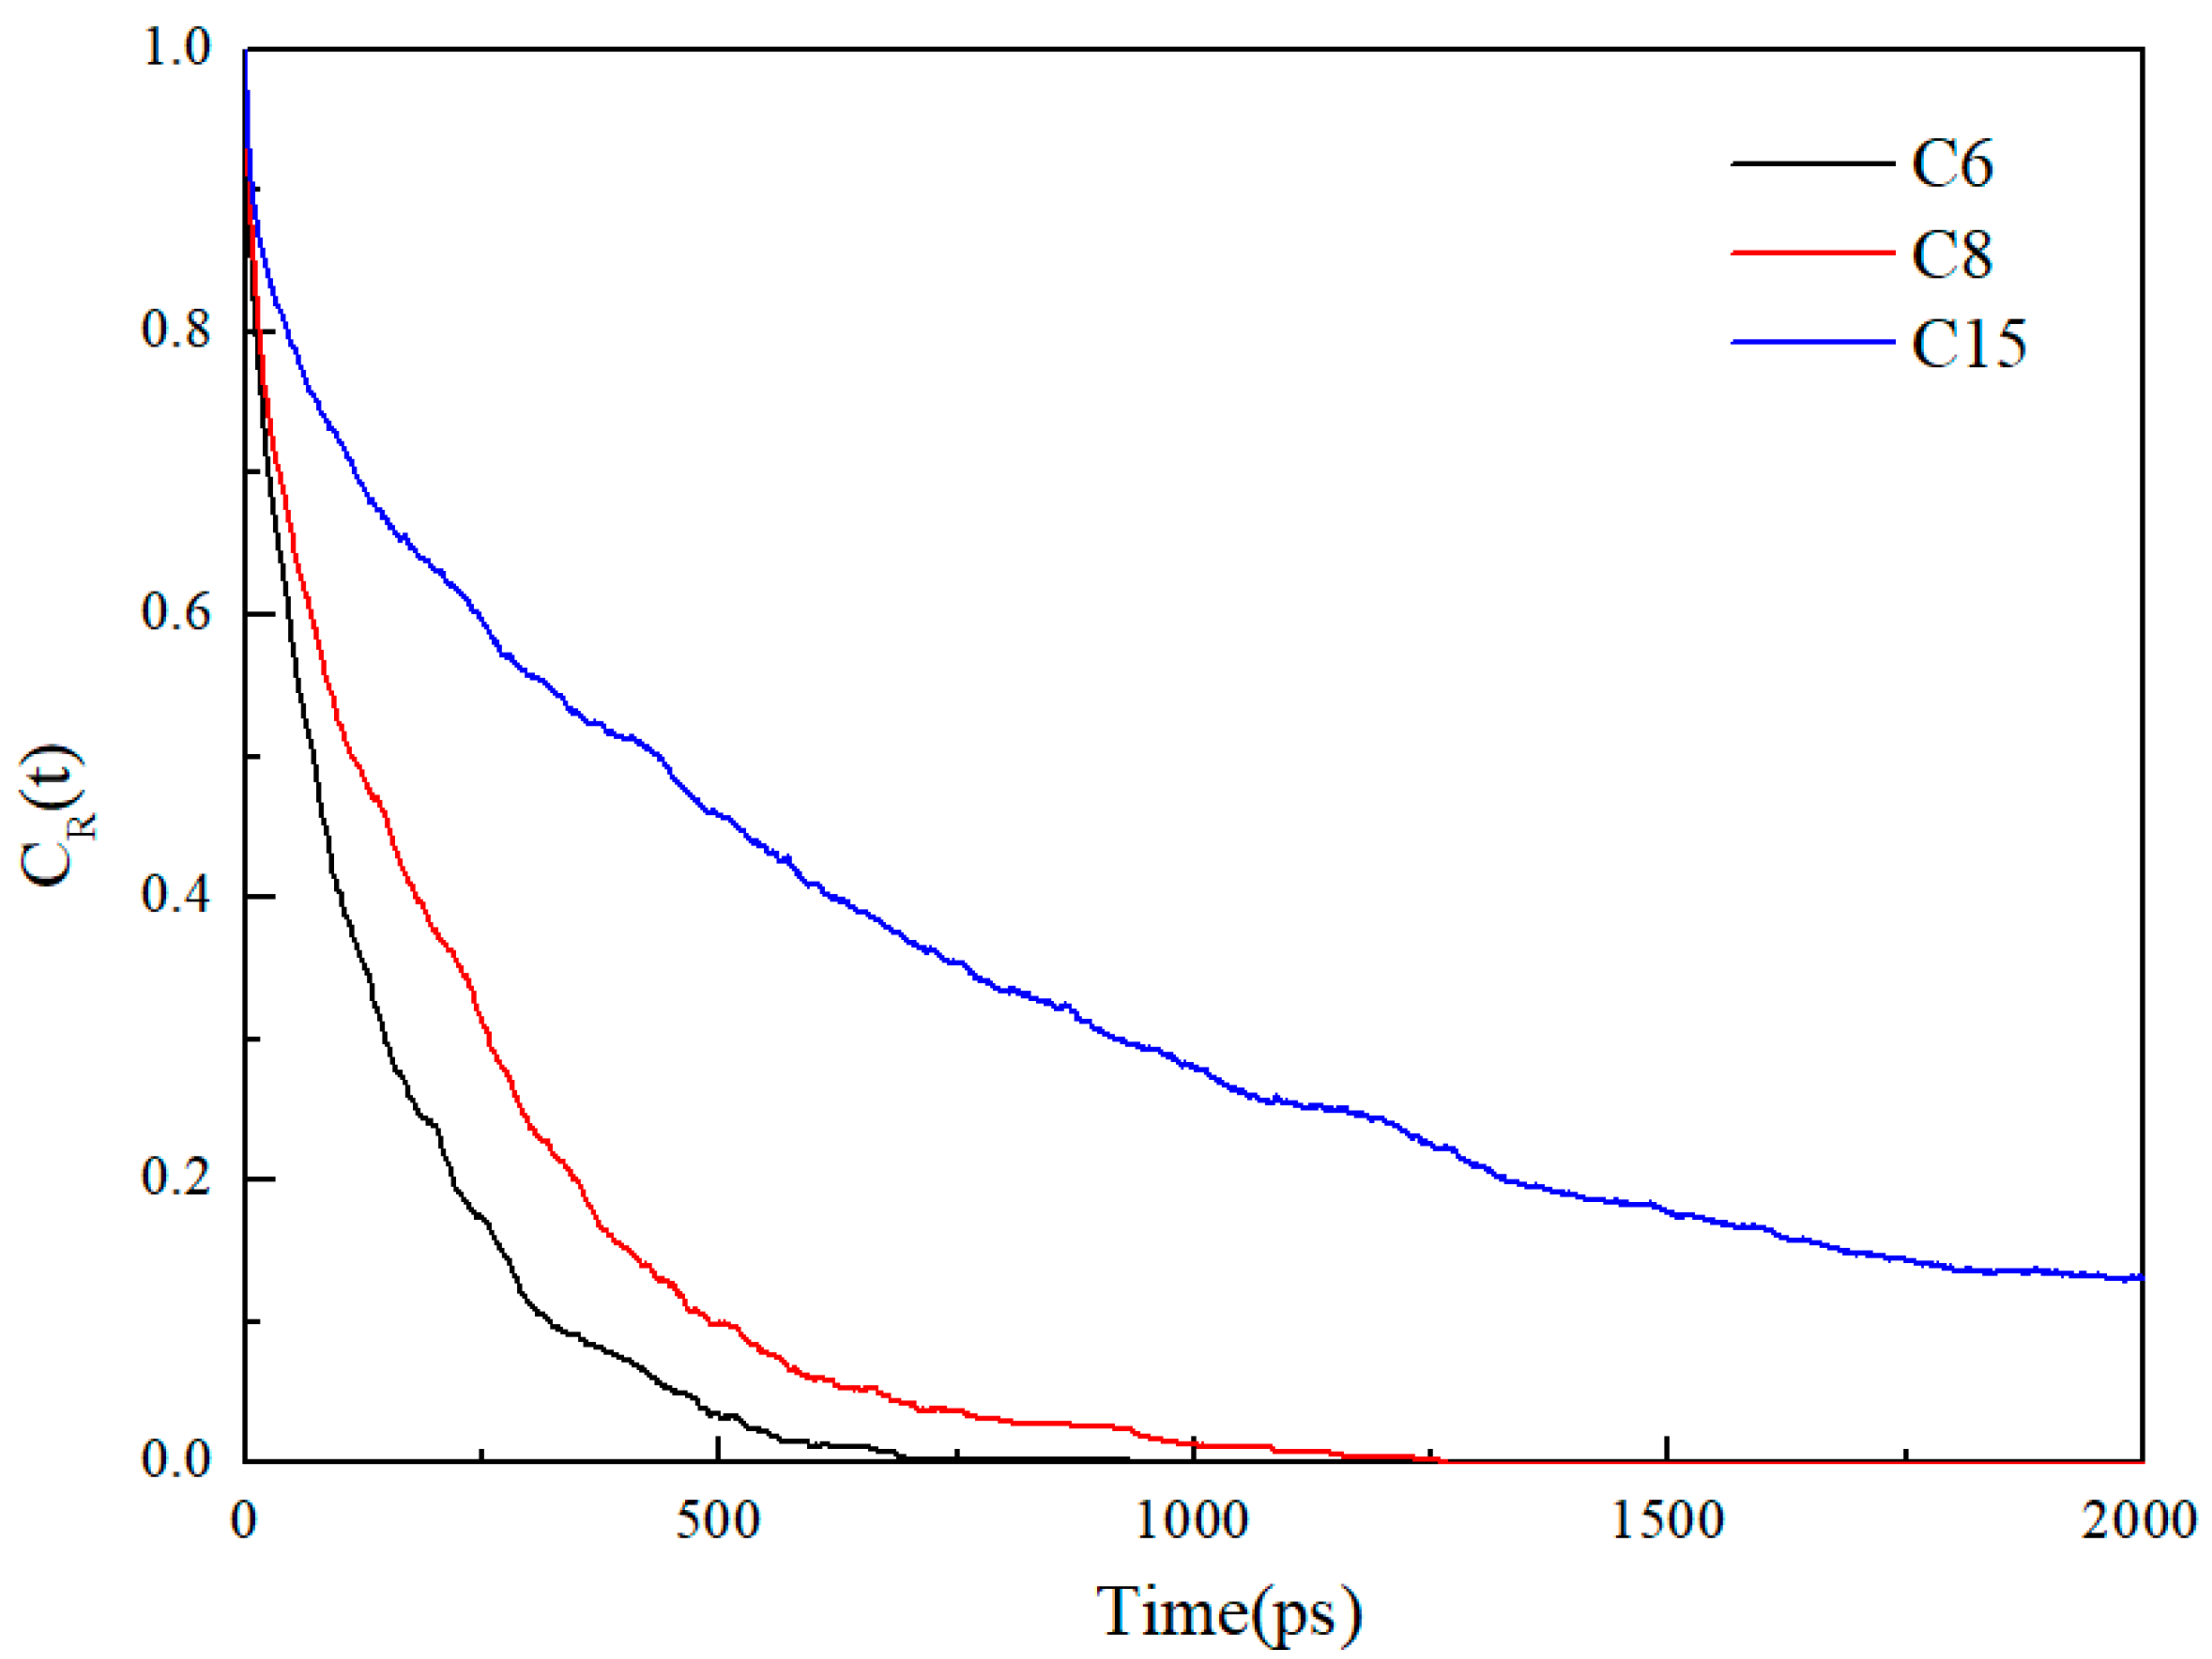
When the alkane is light oil, in narrow pores with width of less than 3 nm, the space is occupied by the oil adsorption layer, with almost none in a free state. In pores larger than 3 nm, the oil is in both adsorbed and free states. The oil molecules in the free state have significantly higher mobility than those in the adsorbed layer due to the strong interaction with the pore wall. In addition, oil molecules with longer carbon chains tend to stay in the adsorption layer, and those with shorter chains are more likely to be peeled off from the surface to form free oil.
(2)
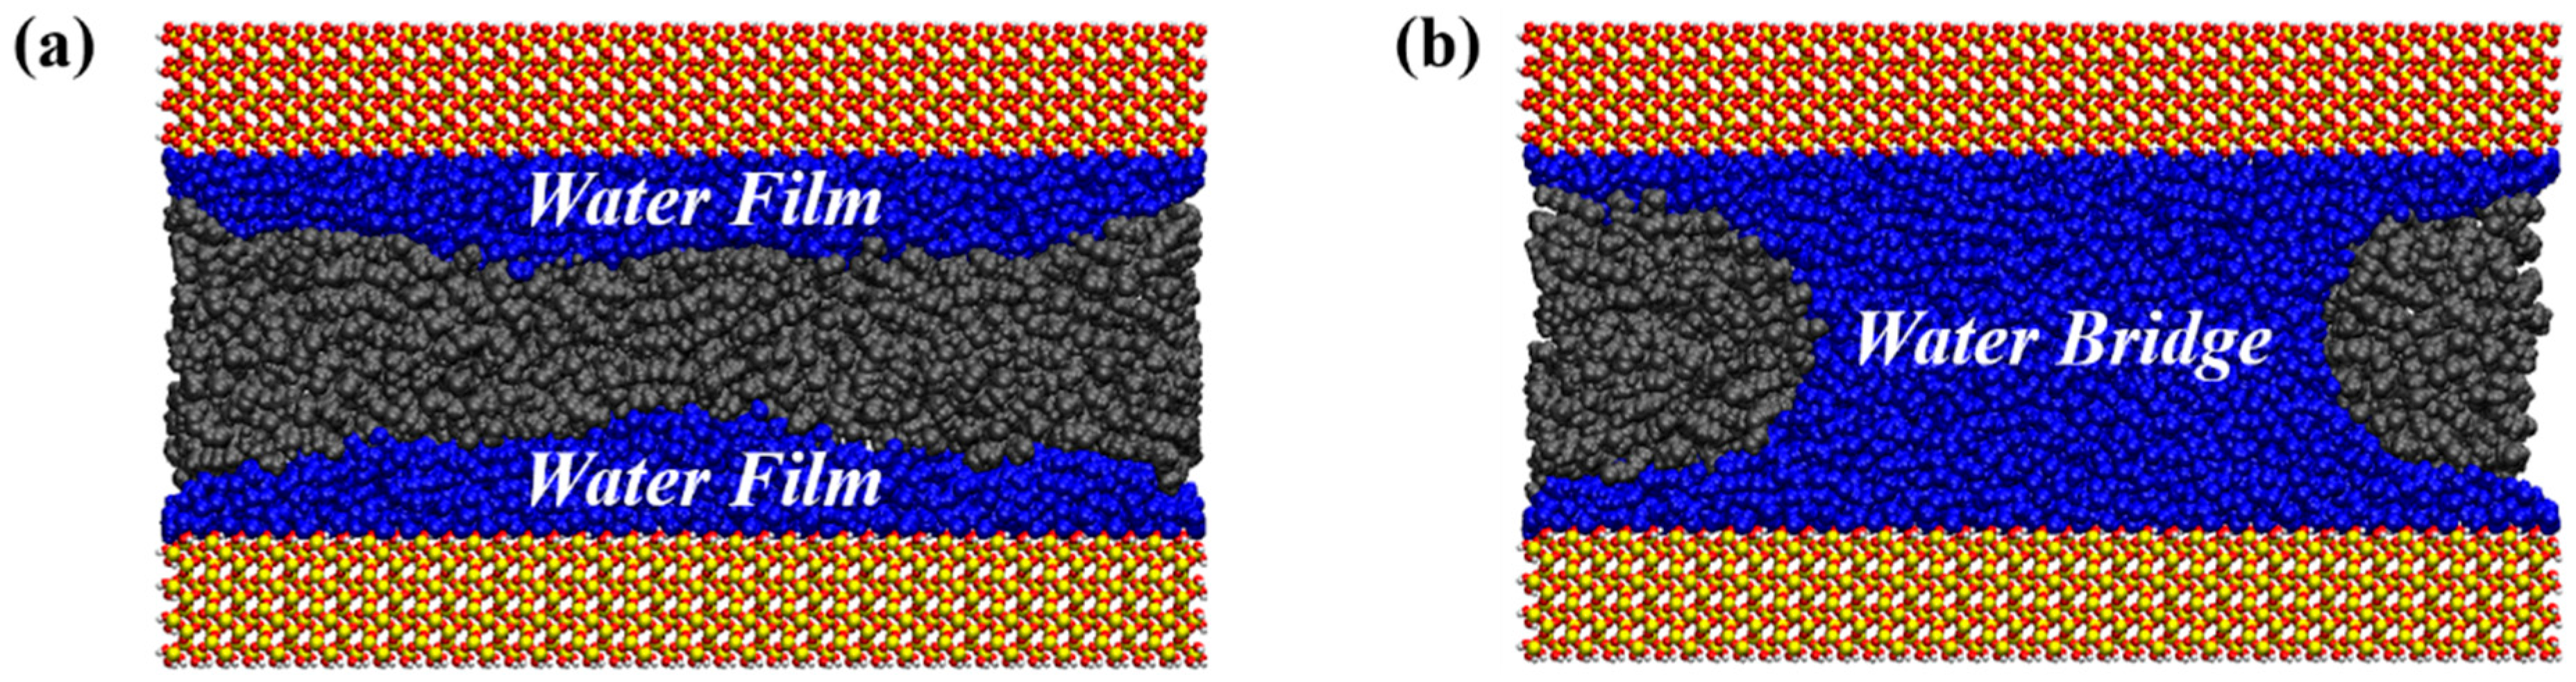
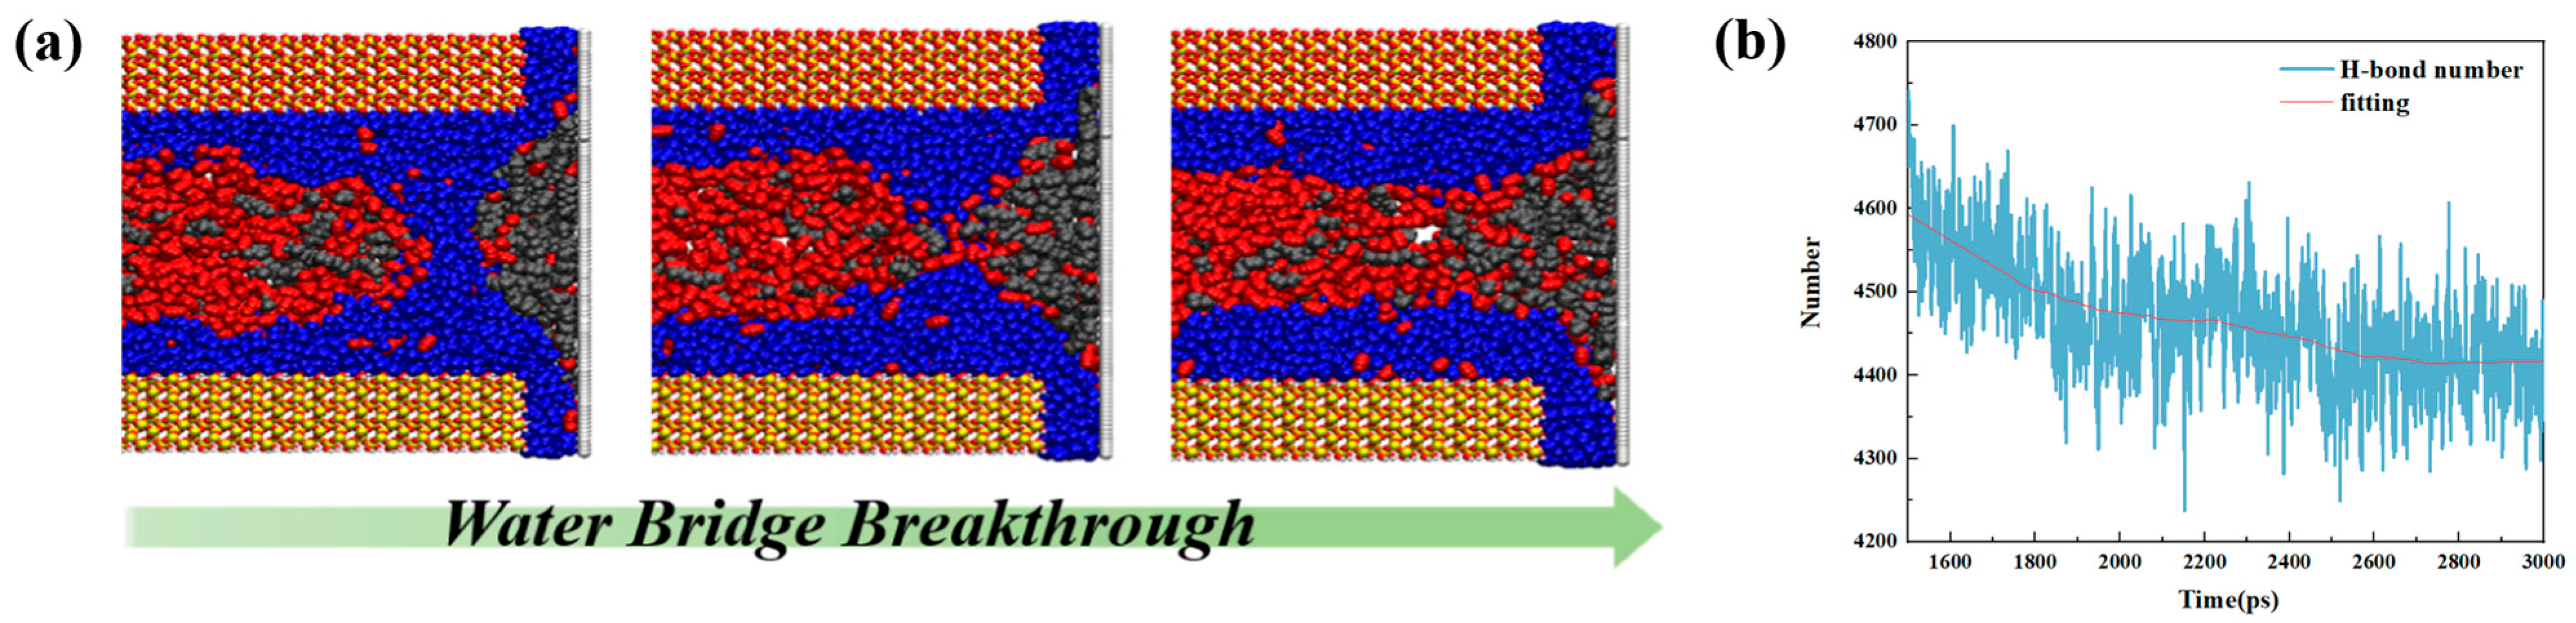
The presence of water in shale nanopores affects the adsorption behavior of oil and water on the surface. Due to the stronger competitive adsorption with the rock surface than oil, water tends to occupy the adsorption sites near the rock, reducing the adsorbed oil molecules. The content of water in the pore determines whether it exists in the form of water film or water bridge. The injection of CO2 gas can displace free oil molecules out of the pore and affect the occurrence state of the oil phase, as well as breaking water bridges and changing the occurrence state of water.
(3)
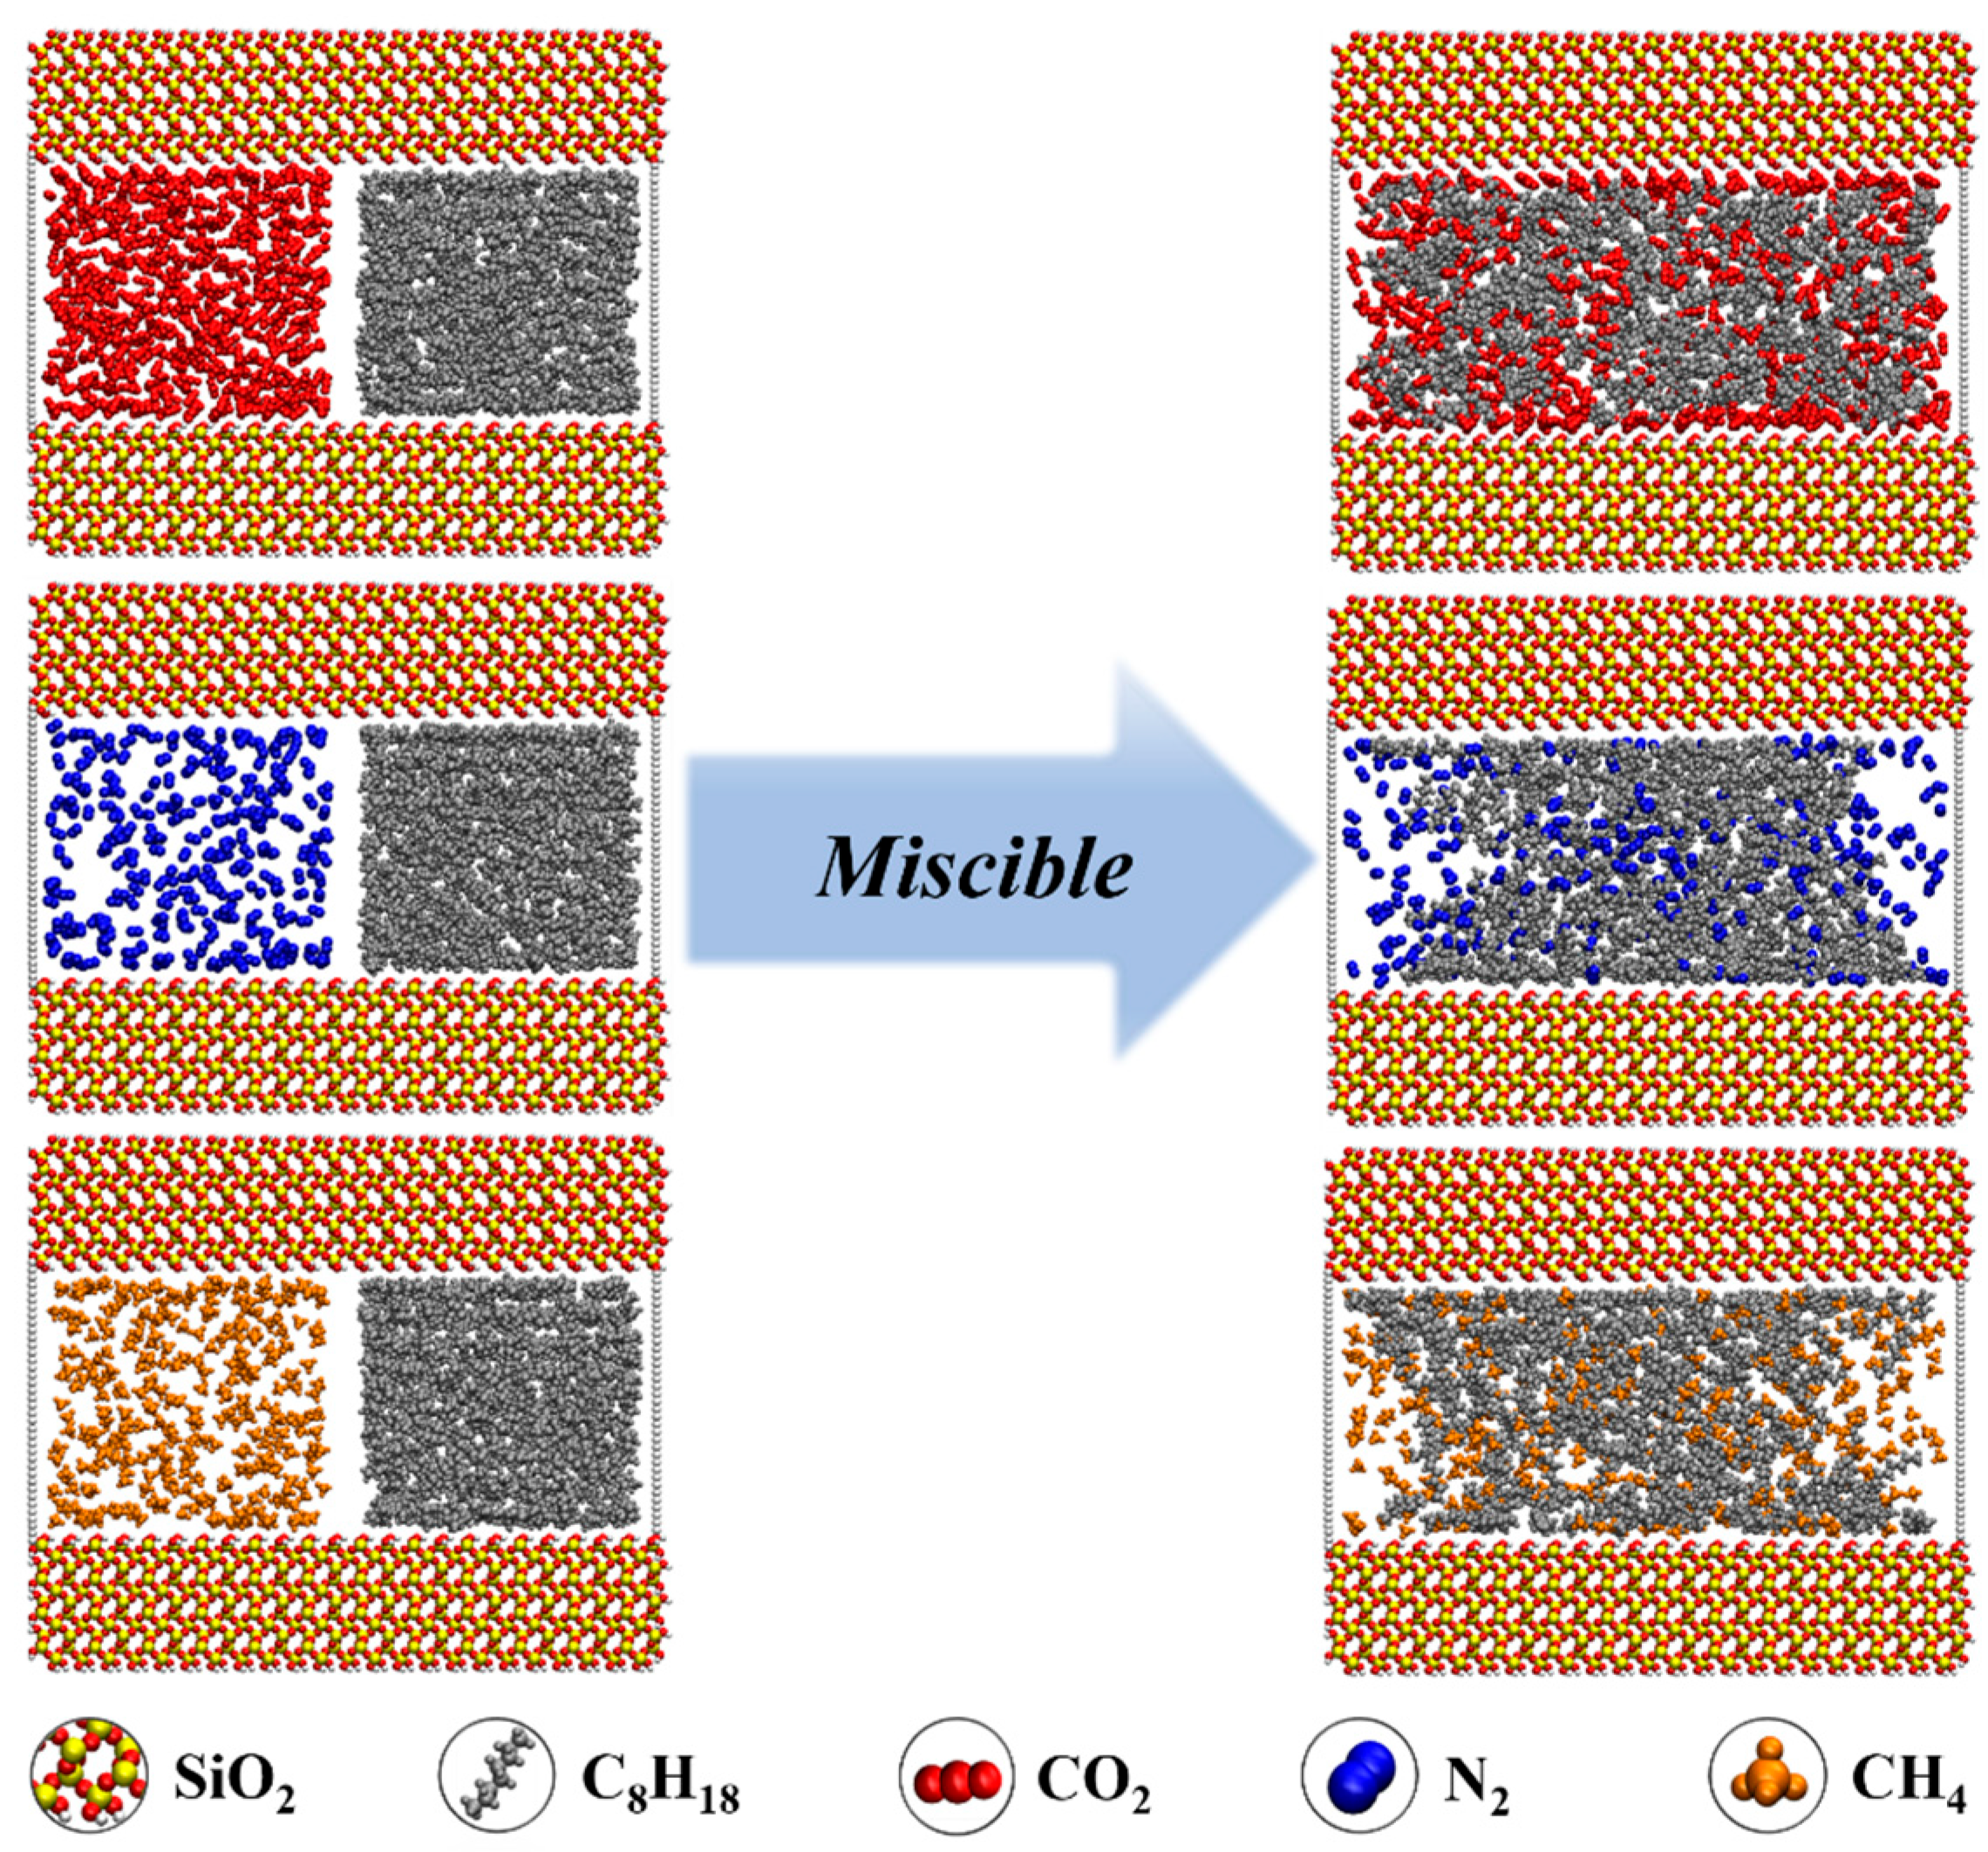
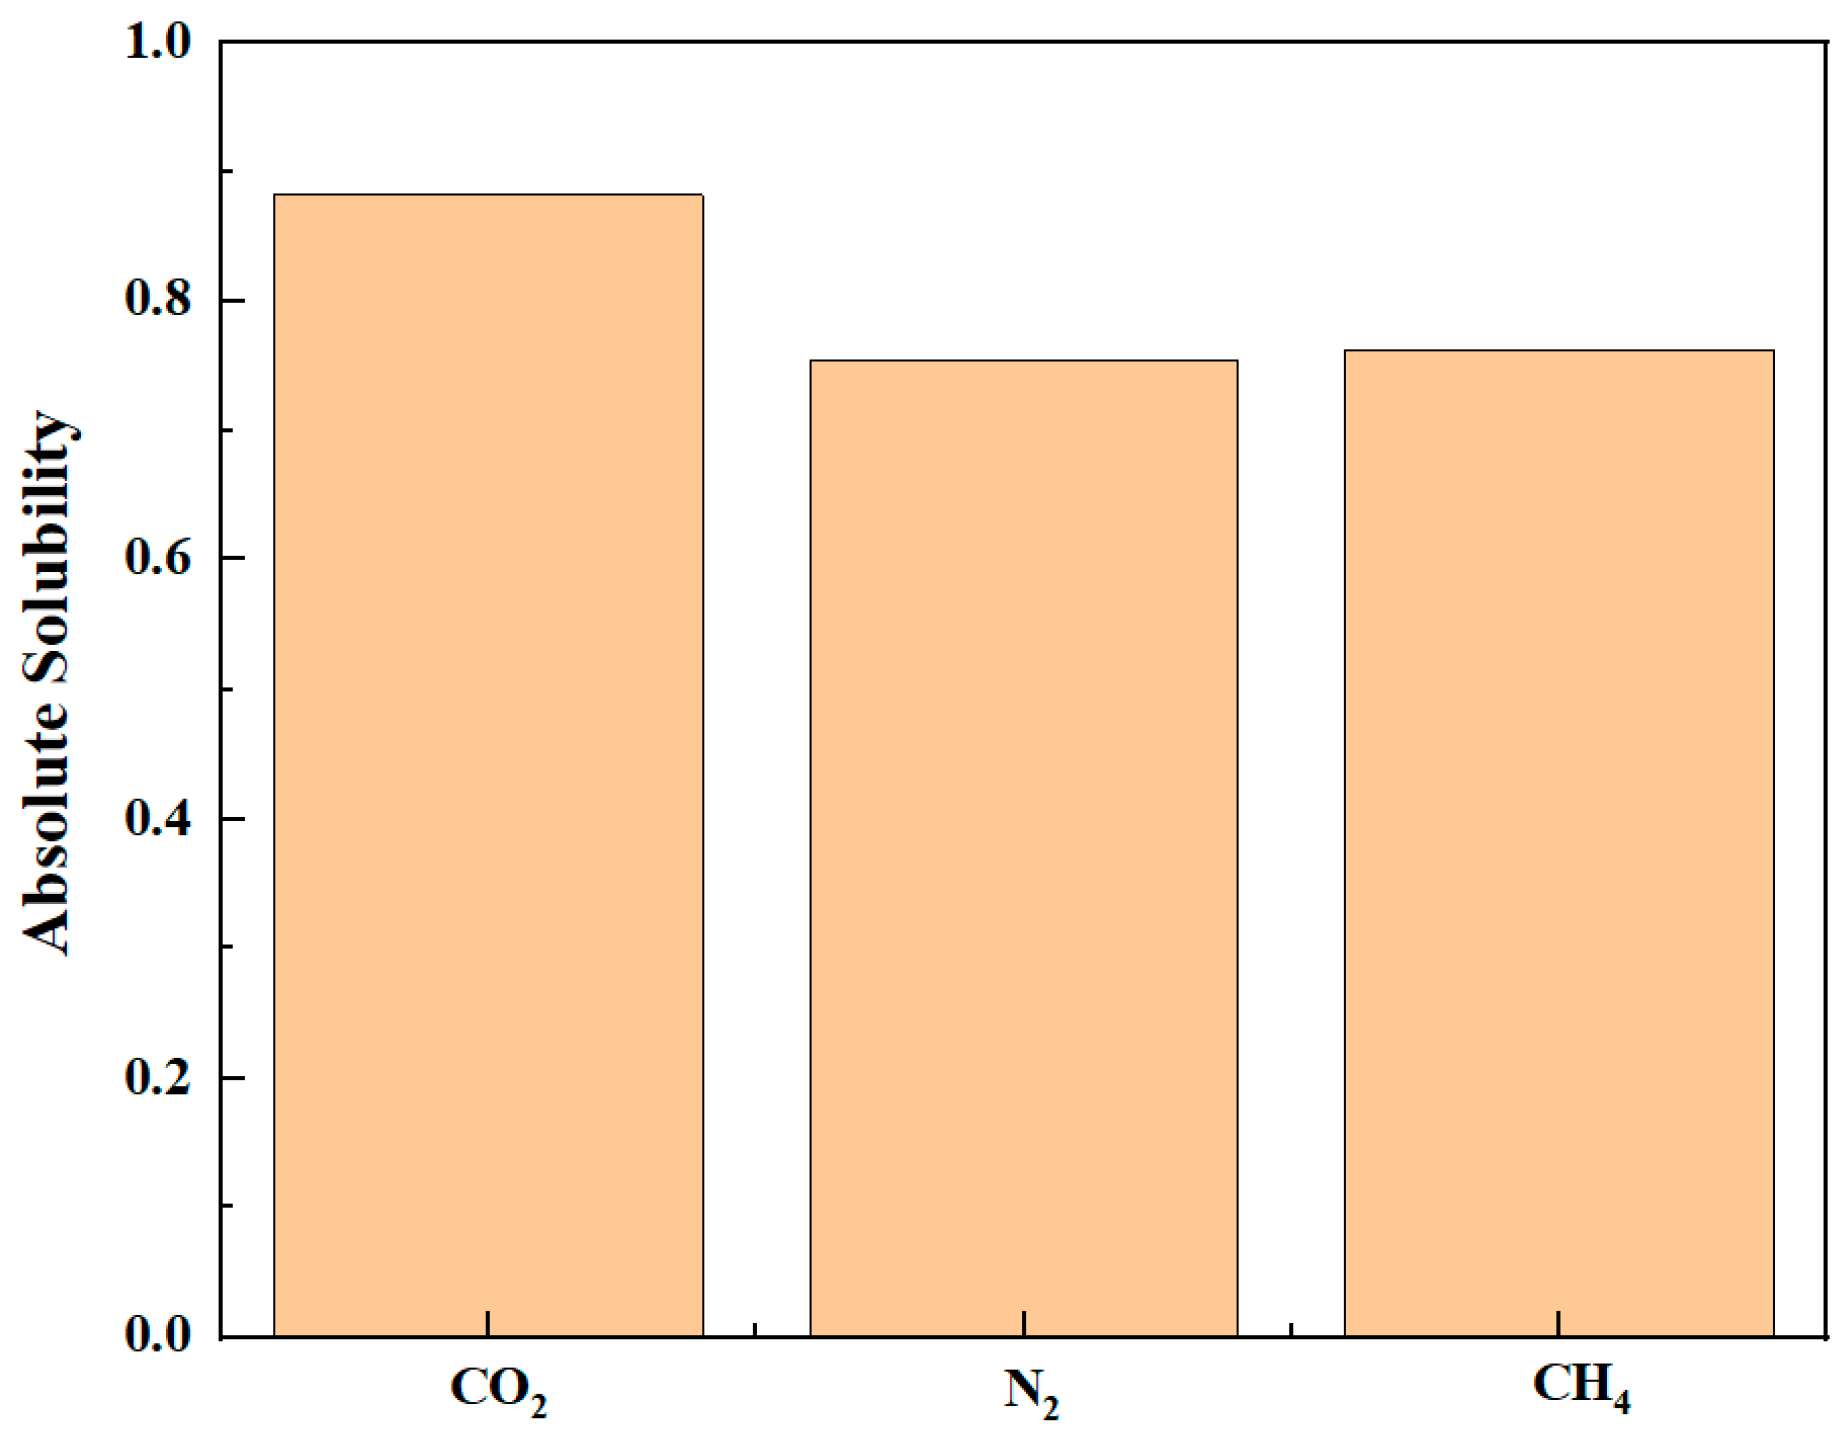
During the displacement process, the oil/gas occurrence state is influenced by the type of gas. Due to the strong adsorption capacity, CO2 can separate the intertwined oil molecules to peels them from the rock and form a CO2 adsorption layer on the rock surface; the maximum adsorption peak of CO2 can reach 1.45 g/cm3, which is higher than the density peak of oil (1.29 g/cm3). The simulation results show that the solubility of octane molecules in different injected gases is in the following order: CO2 (88.1%) > CH4 (76.8%) > N2 (75.4%). Comparatively, N2 and CH4 have weak competitive adsorption on the rock. N2 forms a gas channel between oil molecules, and CH4 forms an oil adsorption layer again after peeling off the oil.
(4)
At high temperature or low pressure, oil/gas molecules can enter the free state or be displaced more easily, whereas at low temperature or high pressure, oil/gas molecules are more tightly adsorbed on the reservoir rock surface.

Supplementary Materials

The following supporting information can be downloaded at: https://www.mdpi.com/article/10.3390/en16217253/s1, Figure S1: Contact angle in the quartz system; Figure S2: Density distribution of octane in equilibrium volume phase; Figure S3: Initial structure of miscible simulation; Table S1: Force field parameters for oil, gas, and quartz. Reference [67] cited in Supplementary Materials.

Author Contributions

Writing—original draft, writing—review and editing, conceptualization, L.S.; writing—original draft, methodology, conceptualization, N.J.; data curation, formal analysis, C.F.; supervision, L.W.; writing—review and editing, S.L.; validation and software, W.L. All authors have read and agreed to the published version of the manuscript.

Funding

This research was funded by The National Natural Science Foundation of China (22101300), Shandong Natural Science Foundation (ZR2020ME053, ZR2020QB027, ZR2022ME105, and ZR2023ME004), Qingdao Natural Science Foundation (23-2-1-232-zyyd-jch), State Key Laboratory of Enhanced Oil Recovery of Open Fund Funded Project (2022-KFKT-28), Major Special Projects of CNPC (2021ZZ01-03 and 2021ZZ01-05), and the Fundamental Research Funds for the Central Universities (22CX03010A, 20CX06007A, and 22CX01002A-1).

Data Availability Statement

Not applicable.

Acknowledgments

The support given by The National Natural Science Foundation of China, Shandong Natural Science Foundation, Qingdao Natural Science Foundation, State Key Laboratory of Enhanced Oil Recovery of Open Fund Funded Project, Major Special Projects of CNPC, and the Fundamental Research Funds for the Central Universities is acknowledged.

Conflicts of Interest

The authors declare no conflict of interest.

References

  1. Zou, C.; Qiu, Z.; Zhang, J.; Li, Z.; Wei, H.; Liu, B.; Zhao, J.; Yang, T.; Zhu, S.; Tao, H.; et al. Unconventional petroleum sedimentology: A key to understanding unconventional hydrocarbon accumulation. Engineering 2022, 18, 62–78. [Google Scholar] [CrossRef]
  2. Demirbas, A.; Bafail, A.; Zytoon, A.M.; Al Sayed, N. Unconventional energy sources: Safety impacts, opportunities, and economic challenges. Energy Sources Part B Econ. Plan. Policy 2017, 12, 387–393. [Google Scholar] [CrossRef]
  3. Rana, A.; Arfaj, M.K.; Saleh, T.A. Advanced developments in shale inhibitors for oil production with low environmental footprints—A review. Fuel 2019, 247, 237–249. [Google Scholar] [CrossRef]
  4. Kang, W.L.; Zhou, B.B.; Issakhov, M.; Gabdullin, M. Advances in enhanced oil recovery technologies for low permeability reservoirs. Pet. Sci. 2022, 19, 1622–1640. [Google Scholar] [CrossRef]
  5. Caineng, Z.; Guangya, Z.; Shizhen, T.; Suyun, H.; Xiaodi, L.; Jianzhong, L.; Dazhong, D.; Rukai, Z.; Xuanjun, Y.; Lianhua, H.; et al. Geological features, major discoveries and unconventional petroleum geology in the global petroleum exploration. Pet. Explor. Dev. 2010, 37, 129–145. [Google Scholar] [CrossRef]
  6. Zhao, J.; Wang, J.; Zhang, G.; Zhou, D.; Chen, L.; Viswanathan, H.; Kang, Q. Minireview on Lattice Boltzmann Modeling of Gas Flow and Adsorption in Shale Porous Media: Progress and Future Direction. Energy Fuels 2023, 37, 1511–1524. [Google Scholar] [CrossRef]
  7. Lu, L.; Li, Y.; Zhang, X. Effects of cracks and geometric parameters on the flow in shale. ACS Omega 2021, 6, 4619–4629. [Google Scholar] [CrossRef]
  8. Zha, X.; Lai, F.; Gao, X.; Gao, Y.; Jiang, N.; Luo, L.; Li, Y.; Wang, J.; Peng, S.; Luo, X.; et al. Characteristics and Genetic Mechanism of Pore Throat Structure of Shale Oil Reservoir in Saline Lake—A Case Study of Shale Oil of the Lucaogou Formation in Jimsar Sag, Junggar Basin. Energies 2021, 14, 8450. [Google Scholar] [CrossRef]
  9. Zang, Q.; Liu, C.; Awan, R.S.; Yang, X.; Lu, Z.; Li, G.; Wu, Y.; Feng, D.; Ran, Y. Comparison of Pore Size Distribution, Heterogeneity and Occurrence Characteristics of Movable Fluids of Tight Oil Reservoirs Formed in Different Sedimentary Environments: A Case Study of the Chang 7 Member of Ordos Basin, China. Nat. Resour. Res. 2022, 31, 415–442. [Google Scholar] [CrossRef]
  10. Yu, H.; Xu, H.Y.; Fan, J.C.; Zhu, Y.-B.; Wang, F.; Wu, H. Transport of shale gas in microporous/nanoporous media: Molecular to pore-scale simulations. Energy Fuels 2020, 35, 911–943. [Google Scholar] [CrossRef]
  11. Alfi, M.; Barrufet, M.; Killough, J. Effect of pore sizes on composition distribution and enhance recovery from liquid shale—Molecular sieving in low permeability reservoirs. Fuel 2019, 235, 1555–1564. [Google Scholar] [CrossRef]
  12. Li, Q.; Yang, Z.; Zou, C. Shale Oil Geological Characteristics and Resource Potential of Mesozoic Yanchang Formation in Ordos Basin, North-Central China. In Proceedings of the International Conference and Exhibition, Melbourne, Australia, 13–16 September 2015; Society of Exploration Geophysicists and American Association of Petroleum Geologists: Tulsa, OK, USA, 2015; Volume 89, p. 333. [Google Scholar]
  13. Dong, H.; Zhu, Q.; Wang, L.; Yue, X.; Fang, H.; Wang, Z.; Liu, S.; Wei, S.; Lu, X. Effects of Shale Pore Size and Connectivity on scCO2 Enhanced Oil Recovery: A Molecular Dynamics Simulation Investigation. Langmuir 2023, 39, 6287–6299. [Google Scholar] [CrossRef] [PubMed]
  14. Yang, G.; Zeng, J.; Qiao, J.; Liu, Y.; Liu, S.; Jia, W.; Cao, W.; Wang, C.; Geng, F.; Wei, W. Role of Organic Matter, Mineral, and Rock Fabric in the Full-Scale Pore and Fracture Network Development in the Mixed Lacustrine Source Rock System. Energy Fuels 2022, 36, 8161–8179. [Google Scholar] [CrossRef]
  15. Yang, Y.; Wang, K.; Zhang, L.; Sun, H.; Zhang, K.; Ma, J. Pore-scale simulation of shale oil flow based on pore network model. Fuel 2019, 251, 683–692. [Google Scholar] [CrossRef]
  16. Xu, Y.; Lun, Z.; Pan, Z.; Wang, H.; Zhou, X.; Zhao, C.; Zhang, D. Occurrence space and state of shale oil: A review. J. Pet. Sci. Eng. 2022, 211, 110183. [Google Scholar] [CrossRef]
  17. Gu, Z.; Lu, T.; Li, Z.; Li, B.; Du, L.; Zhang, C. Analysis on the mechanism and characteristics of nanofluid imbibition in low permeability sandstone core pore surface: Application in reservoir development engineering. Colloids Surf. A Physicochem. Eng. Asp. 2023, 659, 130774. [Google Scholar] [CrossRef]
  18. Huang, K.; Yu, F.; Zhang, W.; Tong, K.; Guo, J.; Li, S.; Chen, S.; Dai, Z. Relationship between capillary water absorption mechanism and pore structure and microfracture of red-layer mudstone in central Sichuan. Bull. Eng. Geol. Environ. 2023, 82, 100. [Google Scholar] [CrossRef]
  19. Liu, B.; Liu, W.; Pan, Z.; Yu, L.; Xie, Z.; Lv, G.; Zhao, P.; Chen, D.; Fang, W. Supercritical CO2 breaking through a water bridge and enhancing shale oil recovery: A molecular dynamics simulation study. Energy Fuels 2022, 36, 7558–7568. [Google Scholar] [CrossRef]
  20. Dai, C.; Sun, X.; Sun, Y.; Zhao, M.; Du, M.; Zou, C.; Guan, B. The effect of supercritical CO2 fracturing fluid retention-induced permeability alteration of tight oil reservoir. J. Pet. Sci. Eng. 2018, 171, 1123–1132. [Google Scholar] [CrossRef]
  21. Ma, C.; Lin, C.; Dong, C.; Elsworth, D.; Wu, S.; Wang, X.; Sun, X. Determination of the critical flow pore diameter of shale caprock. Mar. Pet. Geol. 2020, 112, 104042. [Google Scholar] [CrossRef]
  22. Zhang, D.; Han, M.; Zhou, Q.; Ye, T.; Zhou, Y.; Chang, J.; Lin, X. The Micro-Occurrence Mechanisms of Tight Oil: Fluid–Rock Interactions at Microscale Pores, Nanoscale Pores, and Mineral Surfaces. Energies 2023, 16, 3917. [Google Scholar] [CrossRef]
  23. Zhang, C.; Jiang, F.; Hu, T.; Chen, D.; Huang, L.; Jiang, Z.; Wang, X.; Liu, Z.; Wu, Y.; Lv, J.; et al. Oil occurrence state and quantity in alkaline lacustrine shale using a high-frequency NMR technique. Mar. Pet. Geol. 2023, 154, 106302. [Google Scholar] [CrossRef]
  24. Wu, Y.; Liu, C.; Jiang, F.; Hu, T.; Awan, R.S.; Chen, Z.; Lv, J.; Zhang, C.; Hu, M.; Huang, R.; et al. Occurrence Space and State of Petroleum in Lacustrine Shale: Insights from Two-Step Pyrolysis and the N2 Adsorption Experiment. Energy Fuels 2022, 36, 10920–10933. [Google Scholar] [CrossRef]
  25. Nikolaev, M.Y.; Kazak, A.V. Liquid saturation evaluation in organic-rich unconventional reservoirs: A comprehensive review. Earth-Sci. Rev. 2019, 194, 327–349. [Google Scholar] [CrossRef]
  26. Zhang, W.; Shi, Z.; Tian, Y. An improved method to characterize the pore-throat structures in tight sandstone reservoirs: Combined high-pressure and rate-controlled mercury injection techniques. Energy Explor. Exploit. 2020, 38, 2389–2412. [Google Scholar] [CrossRef]
  27. Zhang, F.; Jiang, Z.; Sun, W.; Li, Y.; Zhang, X.; Zhu, L.; Wen, M. A multiscale comprehensive study on pore structure of tight sandstone reservoir realized by nuclear magnetic resonance, high pressure mercury injection and constant-rate mercury injection penetration test. Mar. Pet. Geol. 2019, 109, 208–222. [Google Scholar] [CrossRef]
  28. Xu, J.; Wang, R.; Zan, L. Shale oil occurrence and slit medium coupling based on a molecular dynamics simulation. J. Pet. Sci. Eng. 2023, 220, 111151. [Google Scholar] [CrossRef]
  29. Luo, Y.; Xiao, H.; Liu, X.; Zheng, T. Occurrence characteristics and influential factors of movable oil in nano-pores by molecular dynamics simulation. Colloids Surf. A Physicochem. Eng. Asp. 2022, 655, 130320. [Google Scholar] [CrossRef]
  30. Wang, S.; Wang, J.; Liu, H.; Liu, F. Impacts of polar molecules of crude oil on spontaneous imbibition in calcite nanoslit: A molecular dynamics simulation study. Energy Fuels 2021, 35, 13671–13686. [Google Scholar] [CrossRef]
  31. Emmings, J.F.; Dowey, P.J.; Taylor, K.G.; Davies, S.J.; Vane, C.H.; Moss-Hayes, V.; Rushton, J.C. Origin and implications of early diagenetic quartz in the Mississippian Bowland Shale Formation, Craven Basin, UK. Mar. Pet. Geol. 2020, 120, 104567. [Google Scholar] [CrossRef]
  32. Xu, K.; Chen, S.; Lu, J.; Li, Y.; Yin, X.; Wu, X.; Li, C. Molecular Simulation Analysis of Methane Adsorption Micromechanisms and the Impact of Water Saturation on Methane Adsorption in Transitional Shale. Lithosphere 2022, 2022, 8195502. [Google Scholar] [CrossRef]
  33. Wang, S.; Javadpour, F.; Feng, Q. Molecular dynamics simulations of oil transport through inorganic nanopores in shale. Fuel 2016, 171, 74–86. [Google Scholar] [CrossRef]
  34. Skelton, A.A.; Fenter, P.; Kubicki, J.D.; Wesolowski, D.J.; Cummings, P.T. Simulations of the quartz (1011)/water interface: A comparison of classical force fields, ab initio molecular dynamics, and X-ray reflectivity experiments. J. Phys. Chem. C 2011, 115, 2076–2088. [Google Scholar] [CrossRef]
  35. Skelton, A.A.; Wesolowski, D.J.; Cummings, P.T. Investigating the quartz (1010)/water interface using classical and ab initio molecular dynamics. Langmuir 2011, 27, 8700–8709. [Google Scholar] [CrossRef]
  36. Wang, L.; Lyu, W.; Ji, Z.; Wang, L.; Liu, S.; Fang, H.; Yue, X.; Wei, S.; Liu, S.; Wang, Z.; et al. Molecular Dynamics Insight into the CO2 Flooding Mechanism in Wedge-Shaped Pores. Molecules 2022, 28, 188. [Google Scholar] [CrossRef]
  37. Koretsky, C.M.; Sverjensky, D.A.; Sahai, N. A model of surface site types on oxide and silicate minerals based on crystal chemistry; implications for site types and densities, multi-site adsorption, surface infrared spectroscopy, and dissolution kinetics. Am. J. Sci. 1998, 298, 349–438. [Google Scholar] [CrossRef]
  38. Jin, Z.; Wang, G.; Liu, G.; Gao, B.; Liu, Q.; Wang, H.; Liang, C.; Wang, R. Research progress and key scientific issues of continental shale oil in China. Acta Pet. Sin. 2021, 42, 821–835. [Google Scholar]
  39. Liu, Z.; Zhu, W.; Sun, Q.; Jian, B.; Xu, X.; Zhang, H. Characteristics of geotemperature-geopressure systems in petroliferous basins of China. Acta Pet. Sin. 2012, 33, 1. [Google Scholar]
  40. Zhang, Y.; Guo, W. Molecular insight into the tight oil movability in nano-pore throat systems. Fuel 2021, 293, 120428. [Google Scholar] [CrossRef]
  41. Sun, P.Z.; Yang, Q.; Kuang, W.J.; Stebunov, Y.V.; Xiong, W.Q.; Yu, J.; Nair, R.R.; Katsnelson, M.I.; Yuan, S.J.; Grigorieva, I.V.; et al. Limits on gas impermeability of graphene. Nature 2020, 579, 229–232. [Google Scholar] [CrossRef]
  42. Plimpton, S. Fast parallel algorithms for short-range molecular dynamics. J. Comput. Phys. 1995, 117, 1–19. [Google Scholar] [CrossRef]
  43. Beckedahl, D.; Obaga, E.O.; Uken, D.A.; Sergi, A.; Ferrario, M. On the configurational temperature Nosè–Hoover thermostat. Phys. A 2016, 461, 19–35. [Google Scholar] [CrossRef]
  44. Harris, J.G.; Yung, K.H. Carbon dioxide’s liquid-vapor coexistence curve and critical properties as predicted by a simple molecular model. J. Phys. Chem. 1995, 99, 12021–12024. [Google Scholar] [CrossRef]
  45. Headen, T.F.; Boek, E.S. Molecular dynamics simulations of asphaltene aggregation in supercritical carbon dioxide with and without limonene. Energy Fuels 2011, 25, 503–508. [Google Scholar] [CrossRef]
  46. Jorgensen, W.L.; Maxwell, D.S.; Tirado-Rives, J. Development and testing of the OPLS all-atom force field on conformational energetics and properties of organic liquids. J. Am. Chem. Soc. 1996, 118, 11225–11236. [Google Scholar] [CrossRef]
  47. Cygan, R.T.; Liang, J.J.; Kalinichev, A.G. Molecular models of hydroxide, oxyhydroxide, and clay phases and the development of a general force field. J. Phys. Chem. B 2004, 108, 1255–1266. [Google Scholar] [CrossRef]
  48. Argüello-Luengo, J.; González-Tudela, A.; Shi, T.; Zoller, P.; Cirac, J.I. Analogue quantum chemistry simulation. Nature 2019, 574, 215–218. [Google Scholar] [CrossRef]
  49. Granados-Bazan, E.L.; Quinones-Cisneros, S.E.; Deiters, U.K. Structure and contact angle in sessile droplets of binary mixtures of Lennard-Jones chains: A molecular dynamics study. Langmuir 2021, 37, 10945–10957. [Google Scholar] [CrossRef]
  50. Forsman, J.; Woodward, C.E. Limitations of the Derjaguin approximation and the Lorentz–Berthelot mixing rule. Langmuir 2010, 26, 4555–4558. [Google Scholar] [CrossRef]
  51. Xiong, Y.; Winterfeld, P.; Wang, C.; Huang, Z.; Wu, Y.-S. Effect of Large Capillary Pressure on Fluid Flow and Transport in Stress-sensitive Tight Oil Reservoirs. In SPE Annual Technical Conference and Exhibition; Society of Petroleum Engineers: Houston, TX, USA, 2015; p. 26. [Google Scholar]
  52. Kuila, U.; Prasad, M. Surface area and pore-size distribution in clays and shales. Geophys. Prospect. 2013, 61, 341–362. [Google Scholar] [CrossRef]
  53. Ross DJ, K.; Bustin, R.M. The importance of shale composition and pore structure upon gas storage potential of shale gas reservoirs. Mar. Pet. Geol. 2009, 26, 916–927. [Google Scholar] [CrossRef]
  54. Wang, S.; Feng, Q.; Javadpour, F.; Hu, Q.; Wu, K. Competitive adsorption of methane and ethane in montmorillonite nanopores of shale at supercritical conditions: A grand canonical Monte Carlo simulation study. Chem. Eng. J. 2019, 355, 76–90. [Google Scholar] [CrossRef]
  55. Chen, G.; Lu, S.; Liu, K.; Xue, Q.; Xu, C.; Tian, S.; Li, J.; Zhang, Y.; Tong, M.; Pang, X.; et al. Investigation of pore size effects on adsorption behavior of shale gas. Mar. Pet. Geol. 2019, 109, 1–8. [Google Scholar] [CrossRef]
  56. Afsharpoor, A.; Javadpour, F. Liquid slip flow in a network of shale noncircular nanopores. Fuel 2016, 180, 580–590. [Google Scholar] [CrossRef]
  57. Zhang, S.; Yan, J.; Hu, Q.; Wang, J.; Tian, T.; Chao, J.; Wang, M. Integrated NMR and FE-SEM methods for pore structure characterization of Shahejie shale from the Dongying Depression, Bohai Bay Basin. Mar. Pet. Geol. 2019, 100, 85–94. [Google Scholar] [CrossRef]
  58. Wu, K.; Chen, Z.; Li, X. Real gas transport through nanopores of varying cross-section type and shape in shale gas reservoirs. Chem. Eng. J. 2015, 281, 813–825. [Google Scholar] [CrossRef]
  59. Liu, B.; Qi, C.; Mai, T.; Zhang, J.; Zhan, K.; Zhang, Z.; He, J. Competitive adsorption and diffusion of CH4/CO2 binary mixture within shale organic nanochannels. J. Nat. Gas Sci. Eng. 2018, 53, 329–336. [Google Scholar] [CrossRef]
  60. Rocchi, C.; Bizzarri, A.R.; Cannistraro, S. Water dynamical anomalies evidenced by molecular-dynamics simulations at the solvent-protein interface. Phys. Rev. E 1998, 57, 3315–3325. [Google Scholar] [CrossRef]
  61. Li, X.; Xue, Q.; Zhu, L.; Jin, Y.; Wu, T.; Guo, Q.; Zheng, H.; Lu, S. How to select an optimal surfactant molecule to speed up the oil-detachment from solid surface: A computational simulation. Chem. Eng. Sci. 2016, 147, 47–53. [Google Scholar] [CrossRef]
  62. Fang, T.; Wang, M.; Wang, C.; Liu, B.; Shen, Y.; Dai, C.; Zhang, J. Oil detachment mechanism in CO2 flooding from silica surface: Molecular dynamics simulation. Chem. Eng. Sci. 2017, 16, 17–22. [Google Scholar] [CrossRef]
  63. Li, Q.; Han, Y.; Liu, X.; Ansari, U.; Cheng, Y.; Yan, C. Hydrate as a by-product in CO2 leakage during the long-term sub-seabed sequestration and its role in preventing further leakage. Environ. Sci. Pollut. Res. 2022, 29, 77737–77754. [Google Scholar] [CrossRef] [PubMed]
  64. Li, Q.; Wang, F.; Wang, Y.; Forson, K.; Cao, L.; Zhang, C.; Zhou, C.; Zhao, B.; Chen, J. Experimental investigation on the high-pressure sand suspension and adsorption capacity of guar gum fracturing fluid in low-permeability shale reservoirs: Factor analysis and mechanism disclosure. Environ. Sci. Pollut. Res. 2022, 29, 53050–53062. [Google Scholar] [CrossRef] [PubMed]
  65. Wang, F.; Xiao, Z.; Liu, X.; Ren, J.; Xing, T.; Li, Z.; Li, X.; Chen, Y. Strategic design of cellulose nanofibers@ zeolitic imidazolate frameworks derived mesoporous carbon-supported nanoscale CoFe2O4/CoFe hybrid composition as trifunctional electrocatalyst for Zn-air battery and self-powered overall water-splitting. J. Power Source 2022, 521, 230925. [Google Scholar] [CrossRef]
  66. Fei, J.; Wang, M.; Li, J.; Zhao, C.; Wang, X.; Zhang, L.; Yu, C.; Li, Y.; Dong, S. Molecular Dynamics Simulation of Adsorption and Absorption Behavior of Shale Oil in Realistic Kerogen Slits. Energy Fuels 2023, 37, 3654–3671. [Google Scholar] [CrossRef]
  67. Wu, C.; Xue, H.; Lu, S.; Tian, S. Measurement and Analysis of Oil-water Contact Angle on Several Common Minerals. Geoscience 2018, 32, 842–849. [Google Scholar]
Figure 1. Initial structure of (a) gas flooding, (b) CO2 flooding in water-bearing pores, and (c) miscible simulation.
Energies 16 07253 g001
Figure 2. (a) Density distribution of oil in 3 nm pore, (b) density distribution of oil in 8 nm pore, and (c) distribution state of crude oil in the pore.
Energies 16 07253 g002
Figure 3. Velocity and density distribution curve of oil.
Energies 16 07253 g003
Figure 4. Density distribution of (a) C6, (b) C8, (c) C15, and (d) C18; (e) interaction energy between oil and rock surface.
Energies 16 07253 g004
Figure 5. Snapshot of adsorption of (a) C6, (b) C8, (c) C15, and (d) C18 molecules on the rock surface. (Gray: carbon atoms; white: hydrogen atoms; red: oxygen atoms; yellow: silicon atoms.)
Energies 16 07253 g005
Figure 6. The residence autocorrelation functions of C6, C8, and C15 molecules in the adsorption layer.
Energies 16 07253 g006
Figure 7. (a) Shows the optimized structural configuration of a reservoir pore with 55% water con-tent and (b) with 80% water content.
Energies 16 07253 g007
Figure 8. (a) The process of CO2 breaking through water bridge. (b) Number of H-bonds formed between water molecules as a function of time in the process of CO2 breaking through the water bridge.
Energies 16 07253 g008
Figure 9. Occurrence state of CO2/N2/CH4 in reservoir pores after miscible process.
Energies 16 07253 g009
Figure 10. At 4 ns, the absolute solubility of C8H18 molecules in different gas (CO2, N2, CH4) phases at 333 K and 20 MPa.
Energies 16 07253 g010
Figure 11. Interaction energy between (a) oil and gas (CO2, N2, CH4) phases, and (b) oil and rock surface during oil displacement.
Energies 16 07253 g011
Figure 12. Density distribution of crude oil in 8 nm pore: (a) Different pressures with a temperature of 333 K, (b) Different temperatures with a pressure of 20 MPa.
Energies 16 07253 g012
Table 1. Oil/gas interactions with rock surfaces in pores with 55% and 80% water content.
Interaction Energy E o i l r o c k (kcal/mol) E H 2 O r o c k (kcal/mol)
Water Content
55 wt%−0.652585−5349.2
80 wt%−3.86542−5234.4
Disclaimer/Publisher’s Note: The statements, opinions and data contained in all publications are solely those of the individual author(s) and contributor(s) and not of MDPI and/or the editor(s). MDPI and/or the editor(s) disclaim responsibility for any injury to people or property resulting from any ideas, methods, instructions or products referred to in the content.

