Article

The Influence of the Type and Condition of Road Surfaces on the Exhaust Emissions and Fuel Consumption in the Transport of Timber

1
Faculty of Civil Engineering and Transport, Poznan University of Technology, ul. Piotrowo 3, 60-695 Poznan, Poland
2
Faculty of Forestry and Wood Technology, Poznan University of Life Sciences, ul. Wojska Polskiego 71C, 60-625 Poznan, Poland
3
Faculty of Cosmetology, University of Education and Therapy, Grabowa 22, 61-473 Poznan, Poland
*
Author to whom correspondence should be addressed.
Energies 2023, 16(21), 7257; https://doi.org/10.3390/en16217257
Submission received: 28 September 2023 / Revised: 23 October 2023 / Accepted: 24 October 2023 / Published: 25 October 2023
(This article belongs to the Special Issue CO2 Emissions from Vehicles (Volume II))

Abstract

:
Owing to society’s growing ecological awareness, researchers and car manufacturers have increasingly been focusing on the adverse impact of transport on the environment. Many scientific publications have been published addressing the influence of a variety of factors on the exhaust emissions generated by vehicles and machinery. In this paper, the authors present an analysis of the exhaust emissions of components such as CO, THC, and NOx in relation to the type and condition of the road surface. The analysis was performed on a heavy-duty truck designed for carriage of timber. The investigations were carried out with the use of the PEMS equipment (portable emission measurement system) on bitumen-paved roads and unpaved forest access roads. The portable measurement system allowed for an accurate determination of the influence of the road conditions on the operating parameters of the vehicle powertrain and its exhaust emissions. Additionally, the authors present the influence of the type of road surface on the vehicle fuel consumption calculated based on the carbon balance method.

1. Introduction

The COVID pandemic has led to a substantial slowdown in economic production. Transport has also found itself among the affected sectors, which was consequential to the imposed lockdown restrictions. According to the EUROSTAT data, in the first months of the pandemic, a significant drop in the use of crude oil-based fuels was observed. It is noteworthy, however, that despite such a drop, in 2020 transport was still the main sector responsible for the consumption of crude oil (approx. 62%), 48% of which was attributed to road transport [1]. The above hints to the fact that transport is one of the most fossil fuel-dependent sectors of the economy.
The main negative effect of the combustion of fuel in vehicle engines are the exhaust emissions. As presented in the report of [2], transport is one of the main factors responsible for air pollution. The exhaust components contributing to the degradation of the Earth’s atmosphere are nitrogen oxides (NOx), carbon monoxide (CO), and hydrocarbons (HCs). These components also have a negative impact on human health, leading to a multitude of health conditions and ailments. Among the exhaust components released to the atmosphere, we can also find highly hazardous particulate matter (PM) [3]. Particles of a small size, 30% of the emission of which is attributed to transport, are especially hazardous to human health. As has been confirmed, these components deeply penetrate the lungs, contributing to the occurrence of cardio-pulmonary disorders. PM is also considered to be carcinogenic [4]. When analyzing the impact of transport on the natural environment, one should not neglect the emission of carbon dioxide. According to the data obtained from the European Environment Agency, in 2020 the transport sector generated over 700 million tons of CO2. It is noteworthy that 77% of these emissions were attributed to road transport. However, as the EEA suggests, the share of the CO2 emissions from transport in the EU will continually drop, provided the member states continue to implement efficient actions aiming at their reduction [5].
When taking a closer look at the problem of reduction in vehicle exhaust emissions, one should consider the complexity of the factors determining their amount. There are many publications whose main topic is the identification of the main factors determining the level of emissions of individual exhaust components [6,7,8,9]. The investigations presented in the papers [10,11] discuss the problem of the influence of the engine thermal state on the formation of the emission components and exhaust emissions. In the analysis found in [12], the authors analyzed the exhaust emissions from vehicles during cold starts at low ambient temperatures. The main topic of article [13] was the influence of the vehicle air conditioning system on its exhaust emissions and fuel consumption (and in the case of an electric vehicle, on its range). In review [14], the influence of the SCR system on the formation of particulate matter was estimated. In the work by Giechaskiel et al., the authors undertook the objective to determine the influence of extreme ambient temperatures (−30–50 °C) on the emission of carbon dioxide and fuel consumption. An important part of the said investigations was also the influence of the road gradient on the exhaust emissions. In this case, the investigations clearly showed a linear proportionality of 12–14% increase in the emission of CO2 for each gradient degree. The literature studies allow for the conclusion that researchers present a multitude of approaches toward estimating the emission level from vehicles.
Currently, the most accurate method of determination of exhaust emissions from road vehicles is the measurement of the concentration of exhaust components using analyzers while the vehicle is in operation. Advanced PEMS equipment (portable emission measurement systems) allows this to happen under almost any type of conditions of operation and almost any type of machinery fitted with a combustion engine. Therefore, portable analyzers are the most useful group of research equipment serving the purpose of determining the relations between the exhaust emissions and external factors and are widely applied in scientific research, as explained further in this section.
In paper [15], the authors attempted to estimate the influence of the driving style on the vehicle exhaust emissions. Investigations of such a complex factor such as driving style were carried out using the above-mentioned equipment. The analysis performed by the authors confirmed the impact of the driving style on the exhaust emissions, particularly on such exhaust components as CO2 and NOx. The significance of the driving style (eco-driving) on the emissions and fuel consumption was also confirmed in [16].
The authors of the work [17] attempted to determine the relation between real-world traffic and the emission of nitrogen oxides, carbon dioxide, PM number, and DPF active regeneration performed in laboratory tests. The investigations performed on eight Euro 5 and Euro 6 vehicles showed a significant influence of the DPF regeneration on the level of exhaust emissions of the above-mentioned exhaust components, confirming, inter alia, the elevated emission of CO2. The problem of the influence of DPF regeneration on the vehicle exhaust emissions was also discussed in [18]. The investigations of an LDV vehicle in real-world traffic conditions has shown that the DPF regeneration process may contribute to the increased emissions of hydrocarbons and carbon monoxide. As the authors of the publication conclude, this is the effect of oxygen deficit during the regeneration process.
In article [19], the authors analyzed the factors influencing the emission of PN and PM from a diesel engine under real-world city traffic conditions. The problem of the emission of particulate matter and factors that have an impact on these emissions was also discussed in [20]. Based on rather extensive research covering HDV (heavy duty vehicle), LDV (light duty vehicle), as well as PC (passenger car) vehicles under laboratory and real-world conditions, the authors observed that sudden accelerations and cold starts result in increased particle number. This is, inter alia, the effect of the too-low temperature of the aftertreatment systems, which contributes to their reduced initial efficiency. Additionally, as is worth noting, the authors compared the results obtained under laboratory and real-world traffic conditions, showing considerable differences between them, which may be the effect of factors such as ambient temperature, driving style, or the dynamometer settings.
In paper [21], the main research topic was the determination of the influence of the DPF support element on the exhaust emissions. The same authors in [22] investigated the influence of the application of GPF in a gasoline engine on the exhaust emissions under real-world traffic conditions. Sarkan et al. [23] compared the exhaust emissions from vehicles fueled with gasoline and LPG. In this case, the real-world tests (RDEs: real driving emissions) showed that, upon changing the fuel type from gasoline to LPG, the vehicle generated less carbon monoxide and carbon dioxide (by approx. 0.03 g/km CO and approx. 3.6 g/km CO2) but more hydrocarbons and nitrogen oxides (0.0003 g/km and 0.02 g/km, respectively). The problem of differences in the exhaust emissions from vehicles fueled with gasoline or LPG under real-world conditions was also discussed in [24].
In review [25], the authors attempted to determine the influence of converting a traffic lights-controlled intersection into a traffic circle. Based on more than 300 exhaust emission trials using PEMS, the authors observed that replacing a conventional intersection with a traffic circle results in a reduction in the emission of CO2 and NOx. This research shows that PEMS is also suitable for studying the impact of infrastructure on exhaust emissions from vehicles of different types.
Owing to the advancement of exhaust emission measurement systems, scientists can accurately determine the impact of transport on the natural environment. As has been proven above, the authors of scientific research investigate a multitude of factors that may affect exhaust emissions. There is, however, an insufficient number of research works determining the influence of the type of road surface on the exhaust emissions. A mere study of the literature allows for the conclusion that all sorts of vehicles are operated not only on bitumen-paved roads but also on unpaved off-road ones [26,27,28].
Among the common features of the said publications is the fact that the operation models described there are characteristic of utility vehicles, including heavy-duty (HDV) ones. Therefore, the authors of this paper decided to assess the influence of the condition and type of road surfaces on the exhaust emissions based on the investigations of a heavy-duty vehicle used in the transport of timber. The investigated vehicle is regularly operated on bitumen-paved roads and forest access roads, the condition of the latter being heavily dependent on the time of year and ambient conditions. In the generally available literature, there are not many similar analyses. The problem was mentioned by the authors in [29] who also drew attention to the question of increased exhaust emissions under conditions diverging from the RDE standards.

2. Materials and Methods

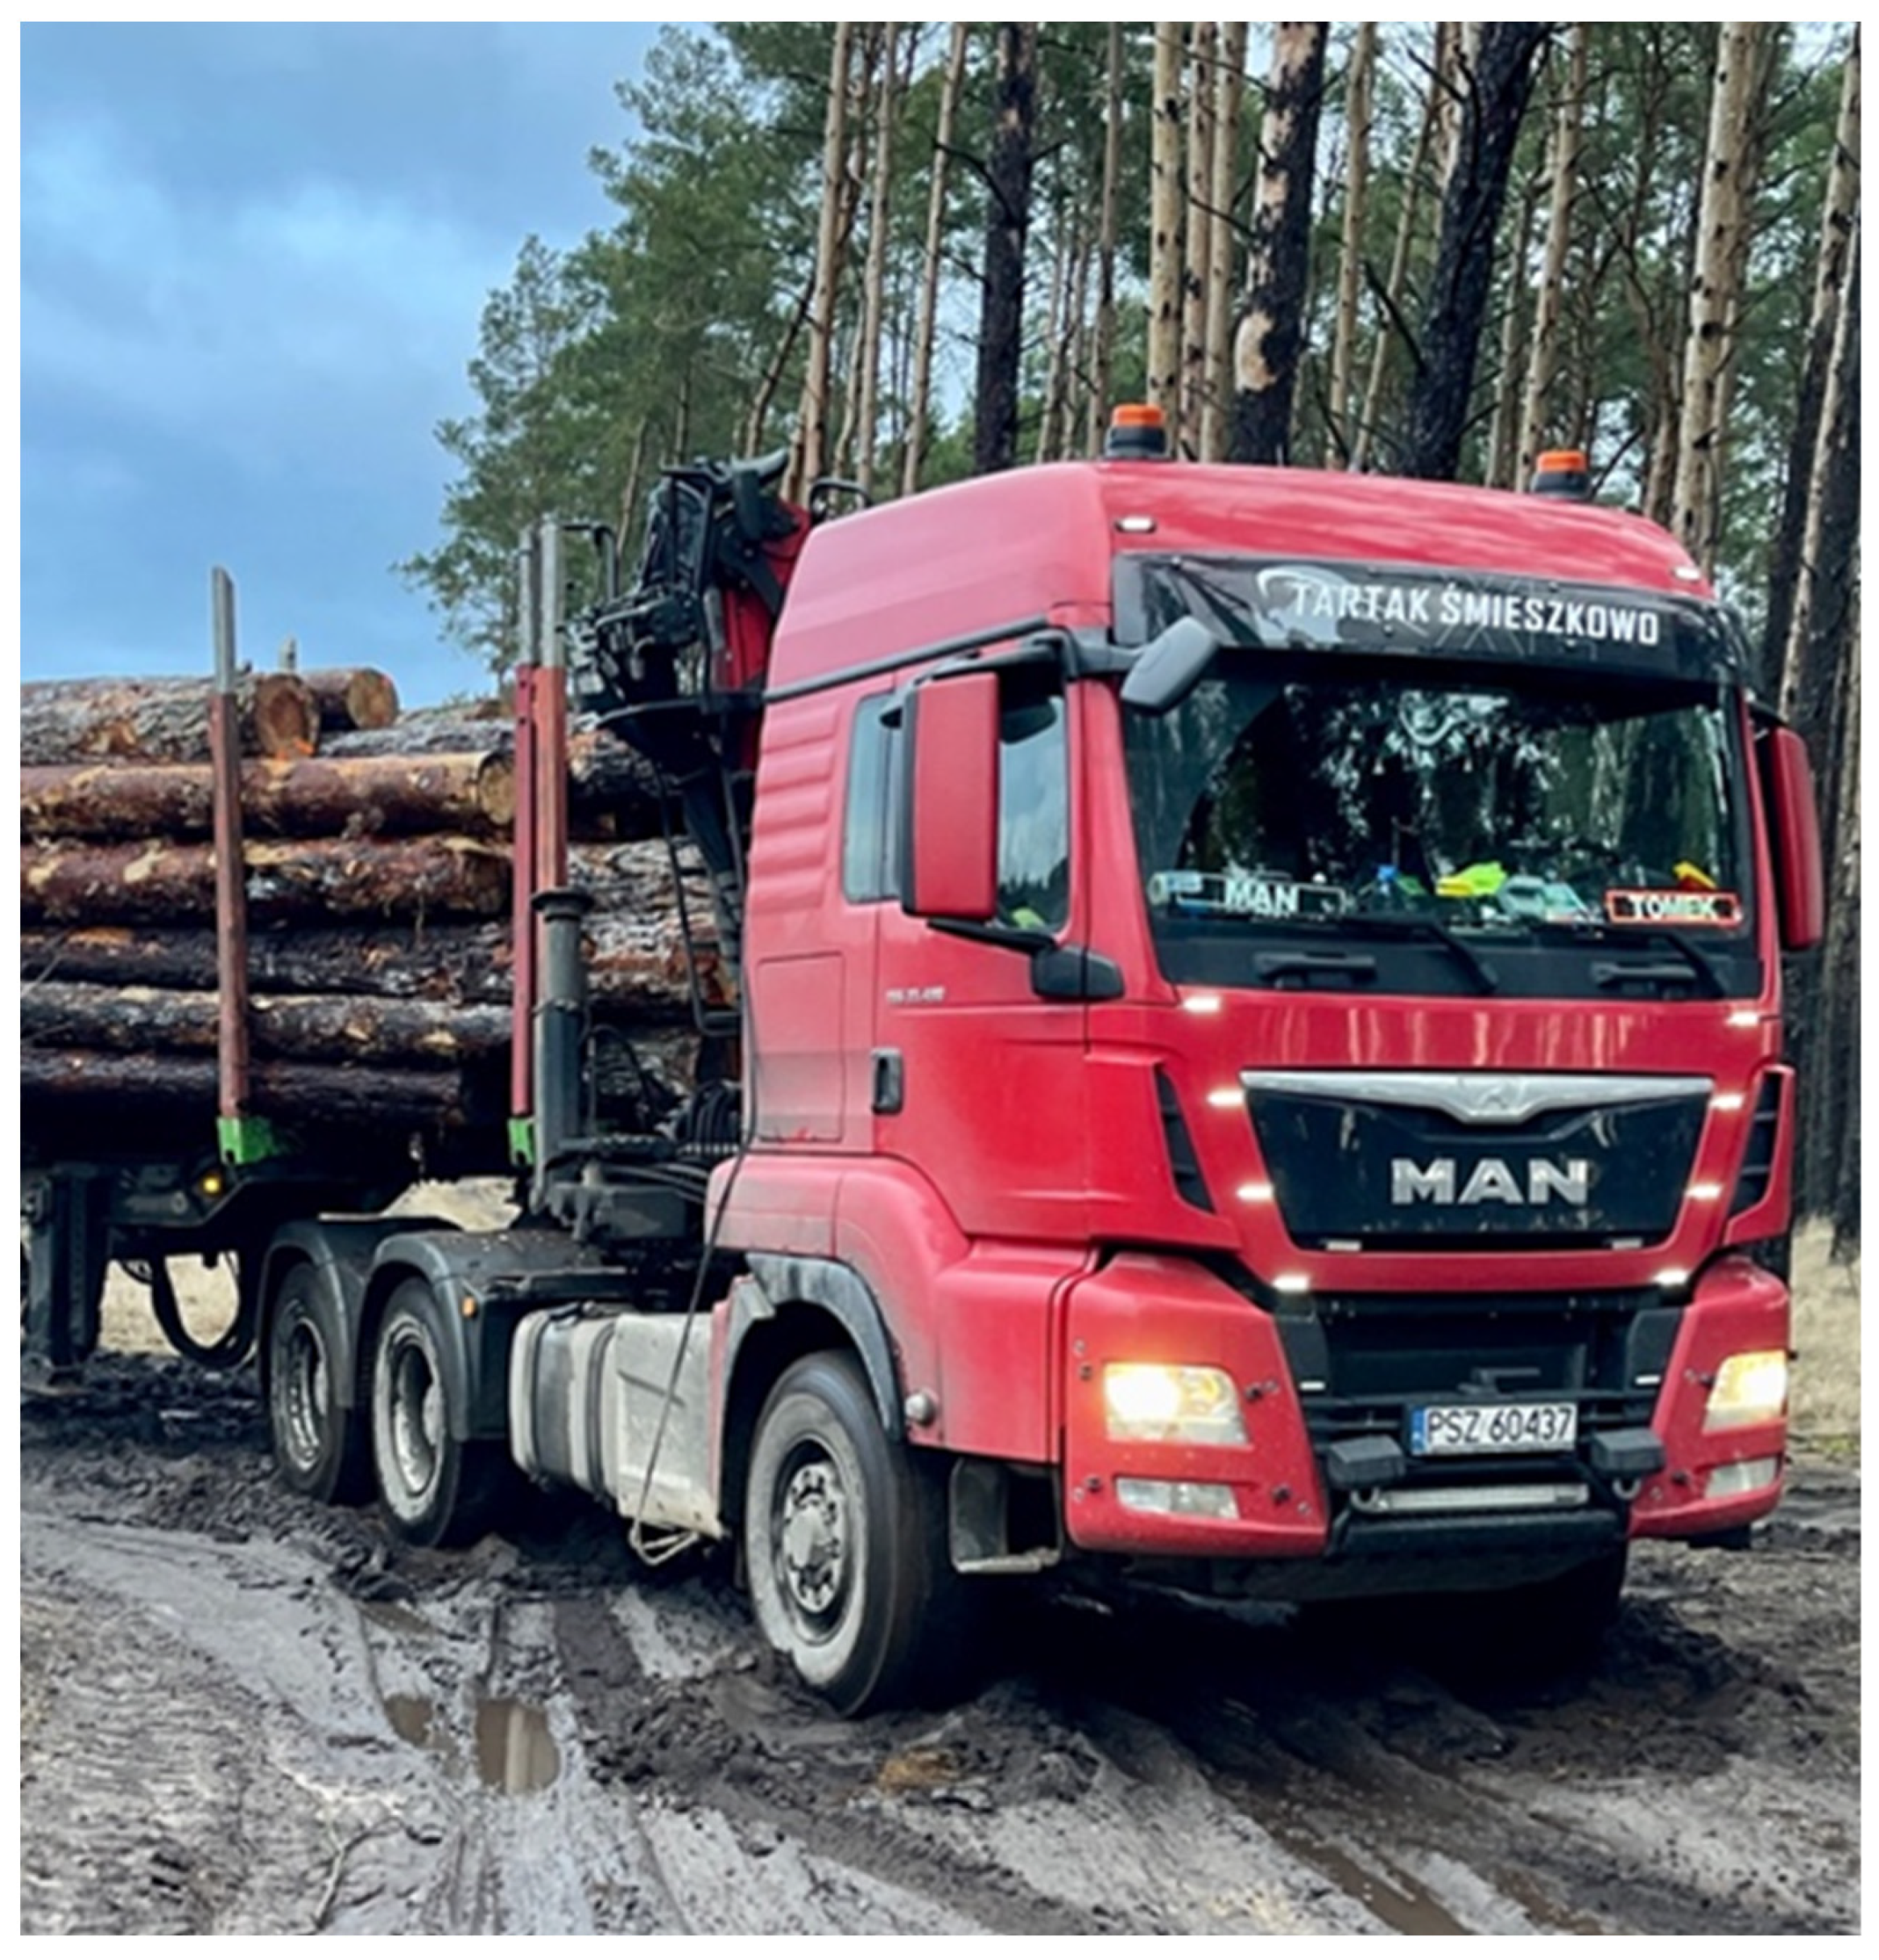
2.1. Research Objects

For the investigations, the authors used a heavy-duty vehicle designed for the carriage of timber (Figure 1). The operating model of the research object is characterized by highly variable operating conditions as the process of timber extraction requires the use of bitumen-paved roads (urban and rural) and unpaved forest access roads. Therefore, the authors consider the vehicle appropriate for the investigations of the influence of the type and condition of the road surface on the exhaust emissions. The investigated object consisted of a tractor unit and a timber trailer. The vehicle was fitted with a Euro VI 353 kW 6-cylinder diesel engine. The combustion engine is manufactured by MAN. The vehicle was fitted with a series of aftertreatment systems (SCR, DPF, DOC). A detailed specification of the investigated object is presented in Table 1.

2.2. Measurement Equipment

For the investigations, the authors used Axion RS+, a portable emission measurement system (PEMS). Axion RS+ (Figure 2) allows for the measurement of the concentrations of gaseous exhaust components and particle emissions. It is equipped with a GPS system, an on-board weather station, and a module pulling data from the on-board diagnostic system. For the measurement of the emissions of carbon monoxide, carbon dioxide, and hydrocarbons, the analyzer utilizes an infrared non-dispersive method (NDIR: non-dispersive infra-red). The electrochemical analyzer is used for the measurement of the content of nitrogen oxides and oxygen in the exhaust gas. Particulate matter is measured based on the phenomenon of laser dispersion [30]. Detailed specifications of the measurement equipment are shown in Table 2.

2.3. The Test Route

The investigations were performed under real-world operating conditions. In order to determine the actual influence of the road condition and type on the exhaust emissions, the authors selected a heavy-duty truck used for the transport of timber. This selection was related to the nature of the transport process of timber, which is characterized by driving on roads of different types. The route on which the tests were carried out is representative of the process of timber extraction. It led through unpaved forest access roads and bitumen-paved public roads (urban and rural). The condition of the unpaved roads is heavily dependent on, inter alia, the ambient conditions. In order to allow for the variability of the road surface and its impact on the fuel consumption and exhaust emissions, the tests were performed in January, shortly after rainfall. This allowed the authors to obtain very arduous and variable conditions on the forest roads. The authors divided the test route into several stages of different arduousness. Stage one was marked blue, stage two magenta, stage three yellow, and stage four (covering the bitumen-paved road) red. The stages were properly marked with colors on the images (Figure 3). The route was divided according to the condition of the dirt road, which are shown in Figure 4. The proposed transport cycle corresponded to a regular timber transport process; hence, the authors could determine the emission level of the entire transport cycle in relation to the road conditions. The test run from point A to point B was realized on unpaved forest roads. Points B–C correspond to the test run on bitumen-paved roads. The length of the timber extraction route was 20.7 km. The unpaved road constituted approx. 20% of the test run.

3. Results and Discussion

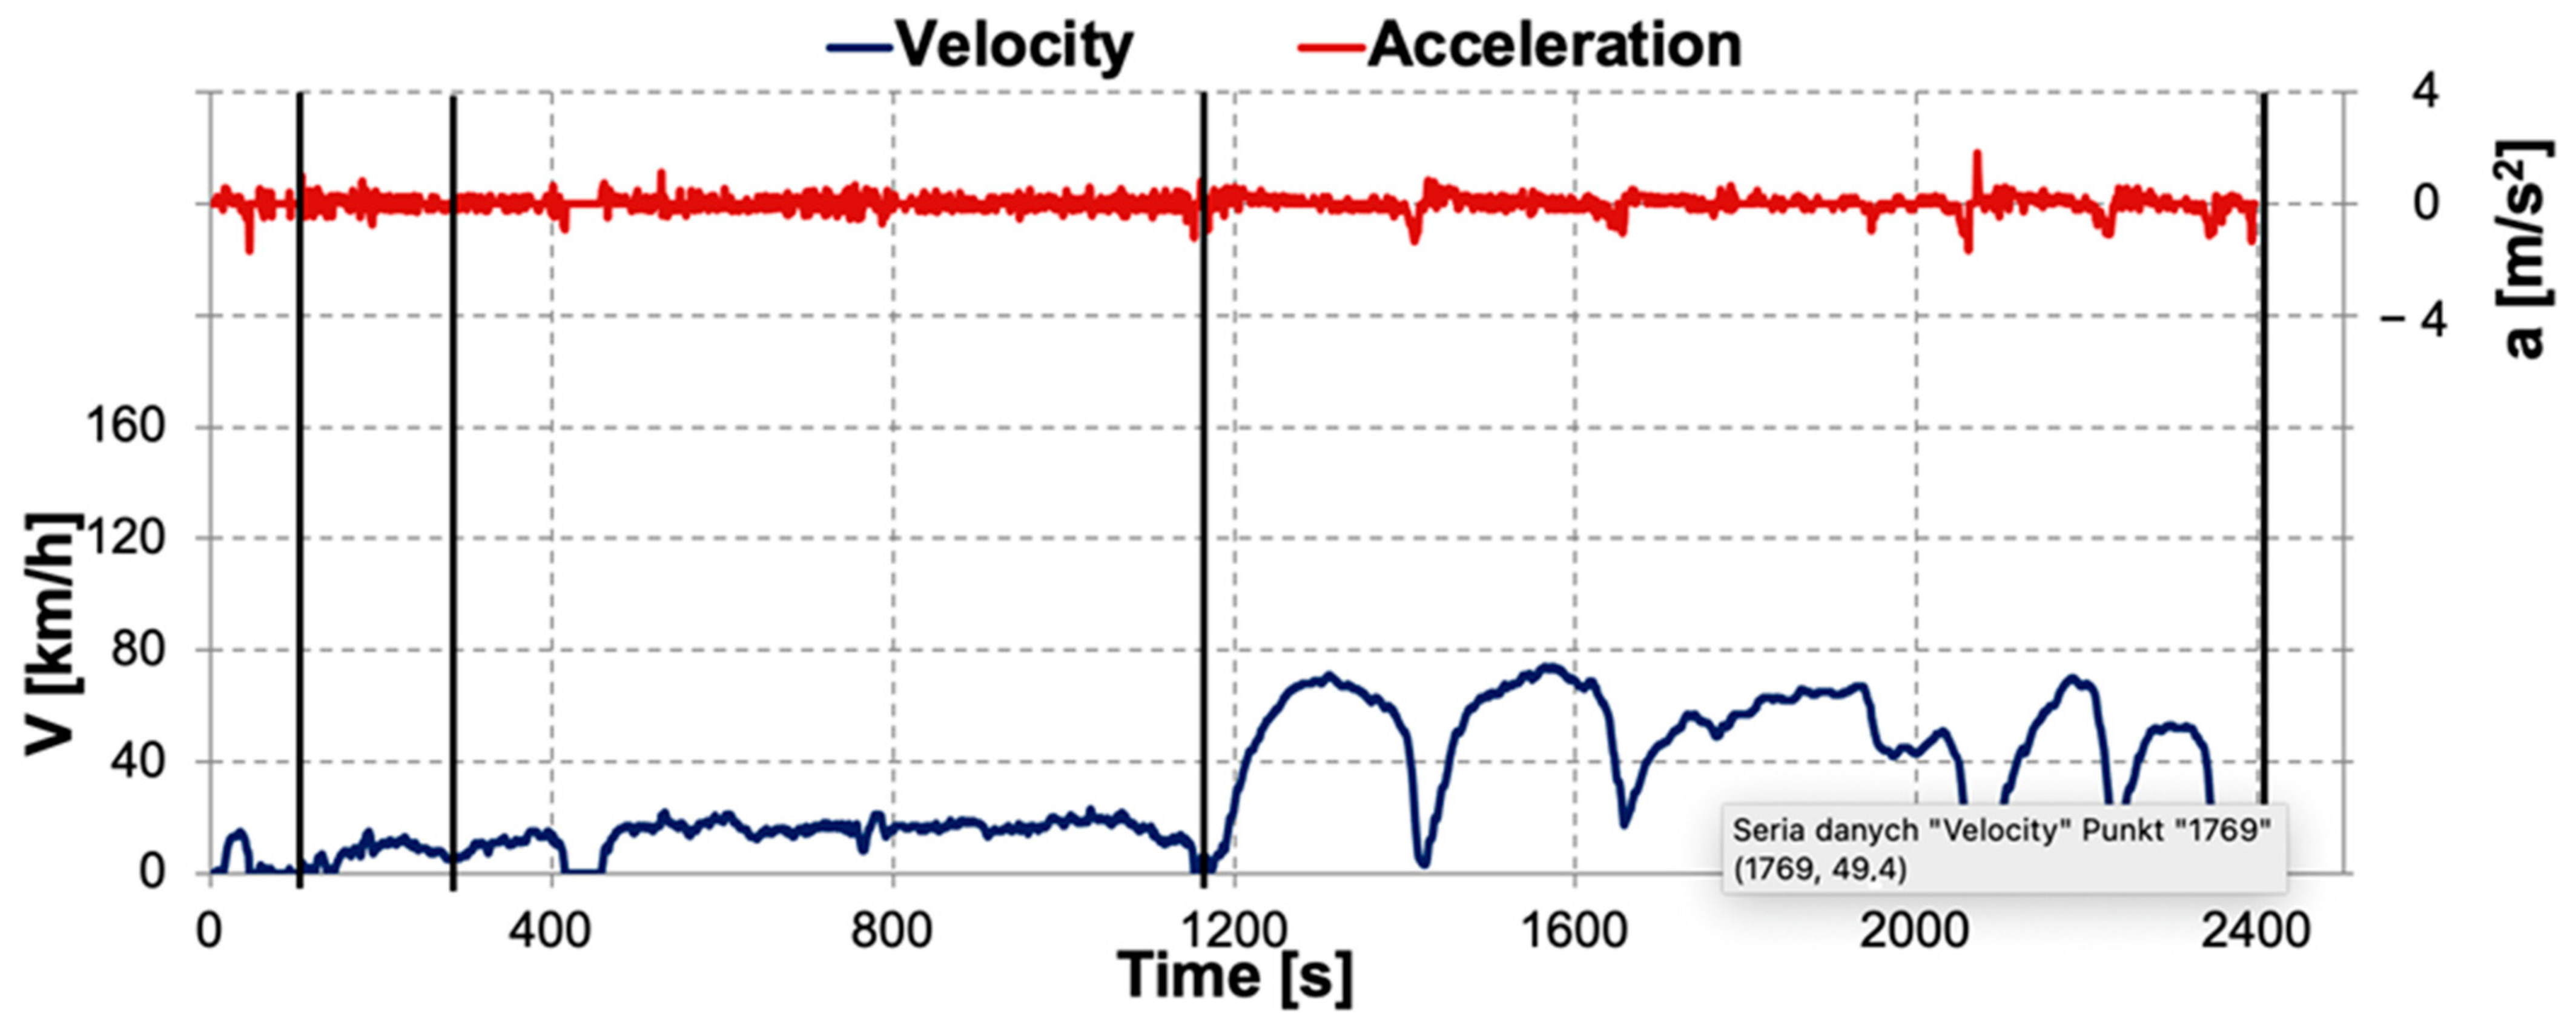
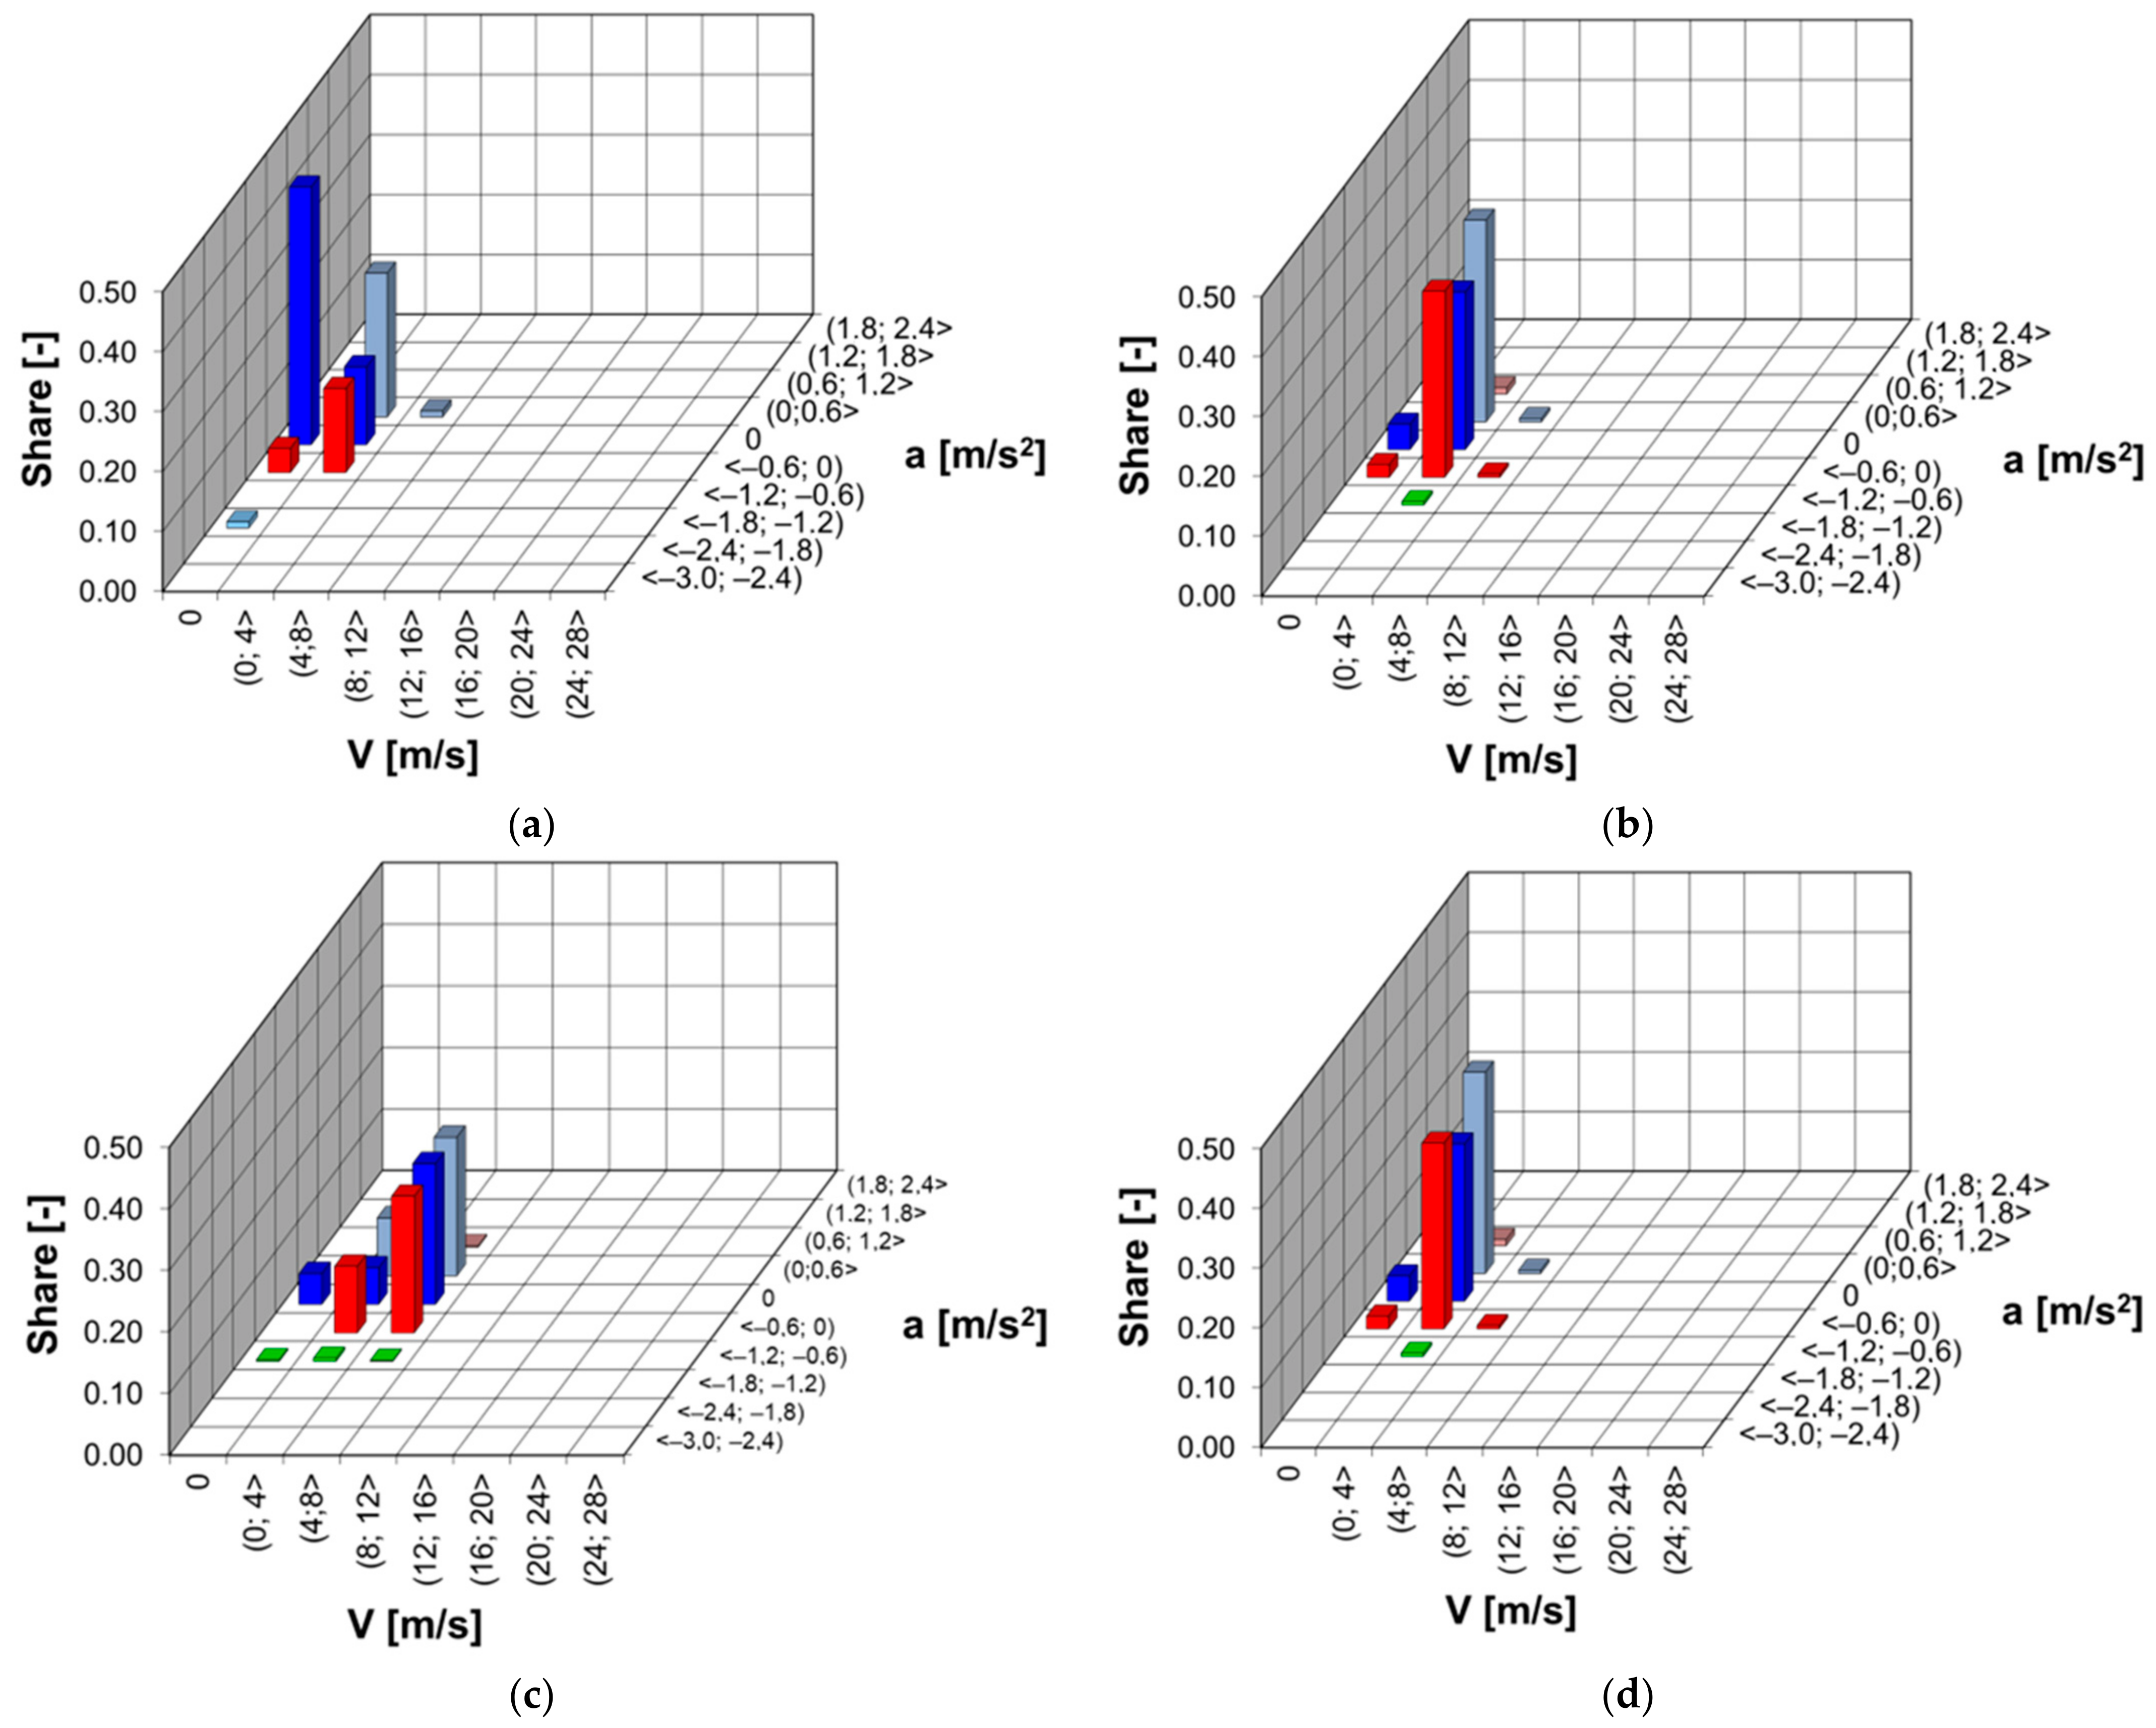
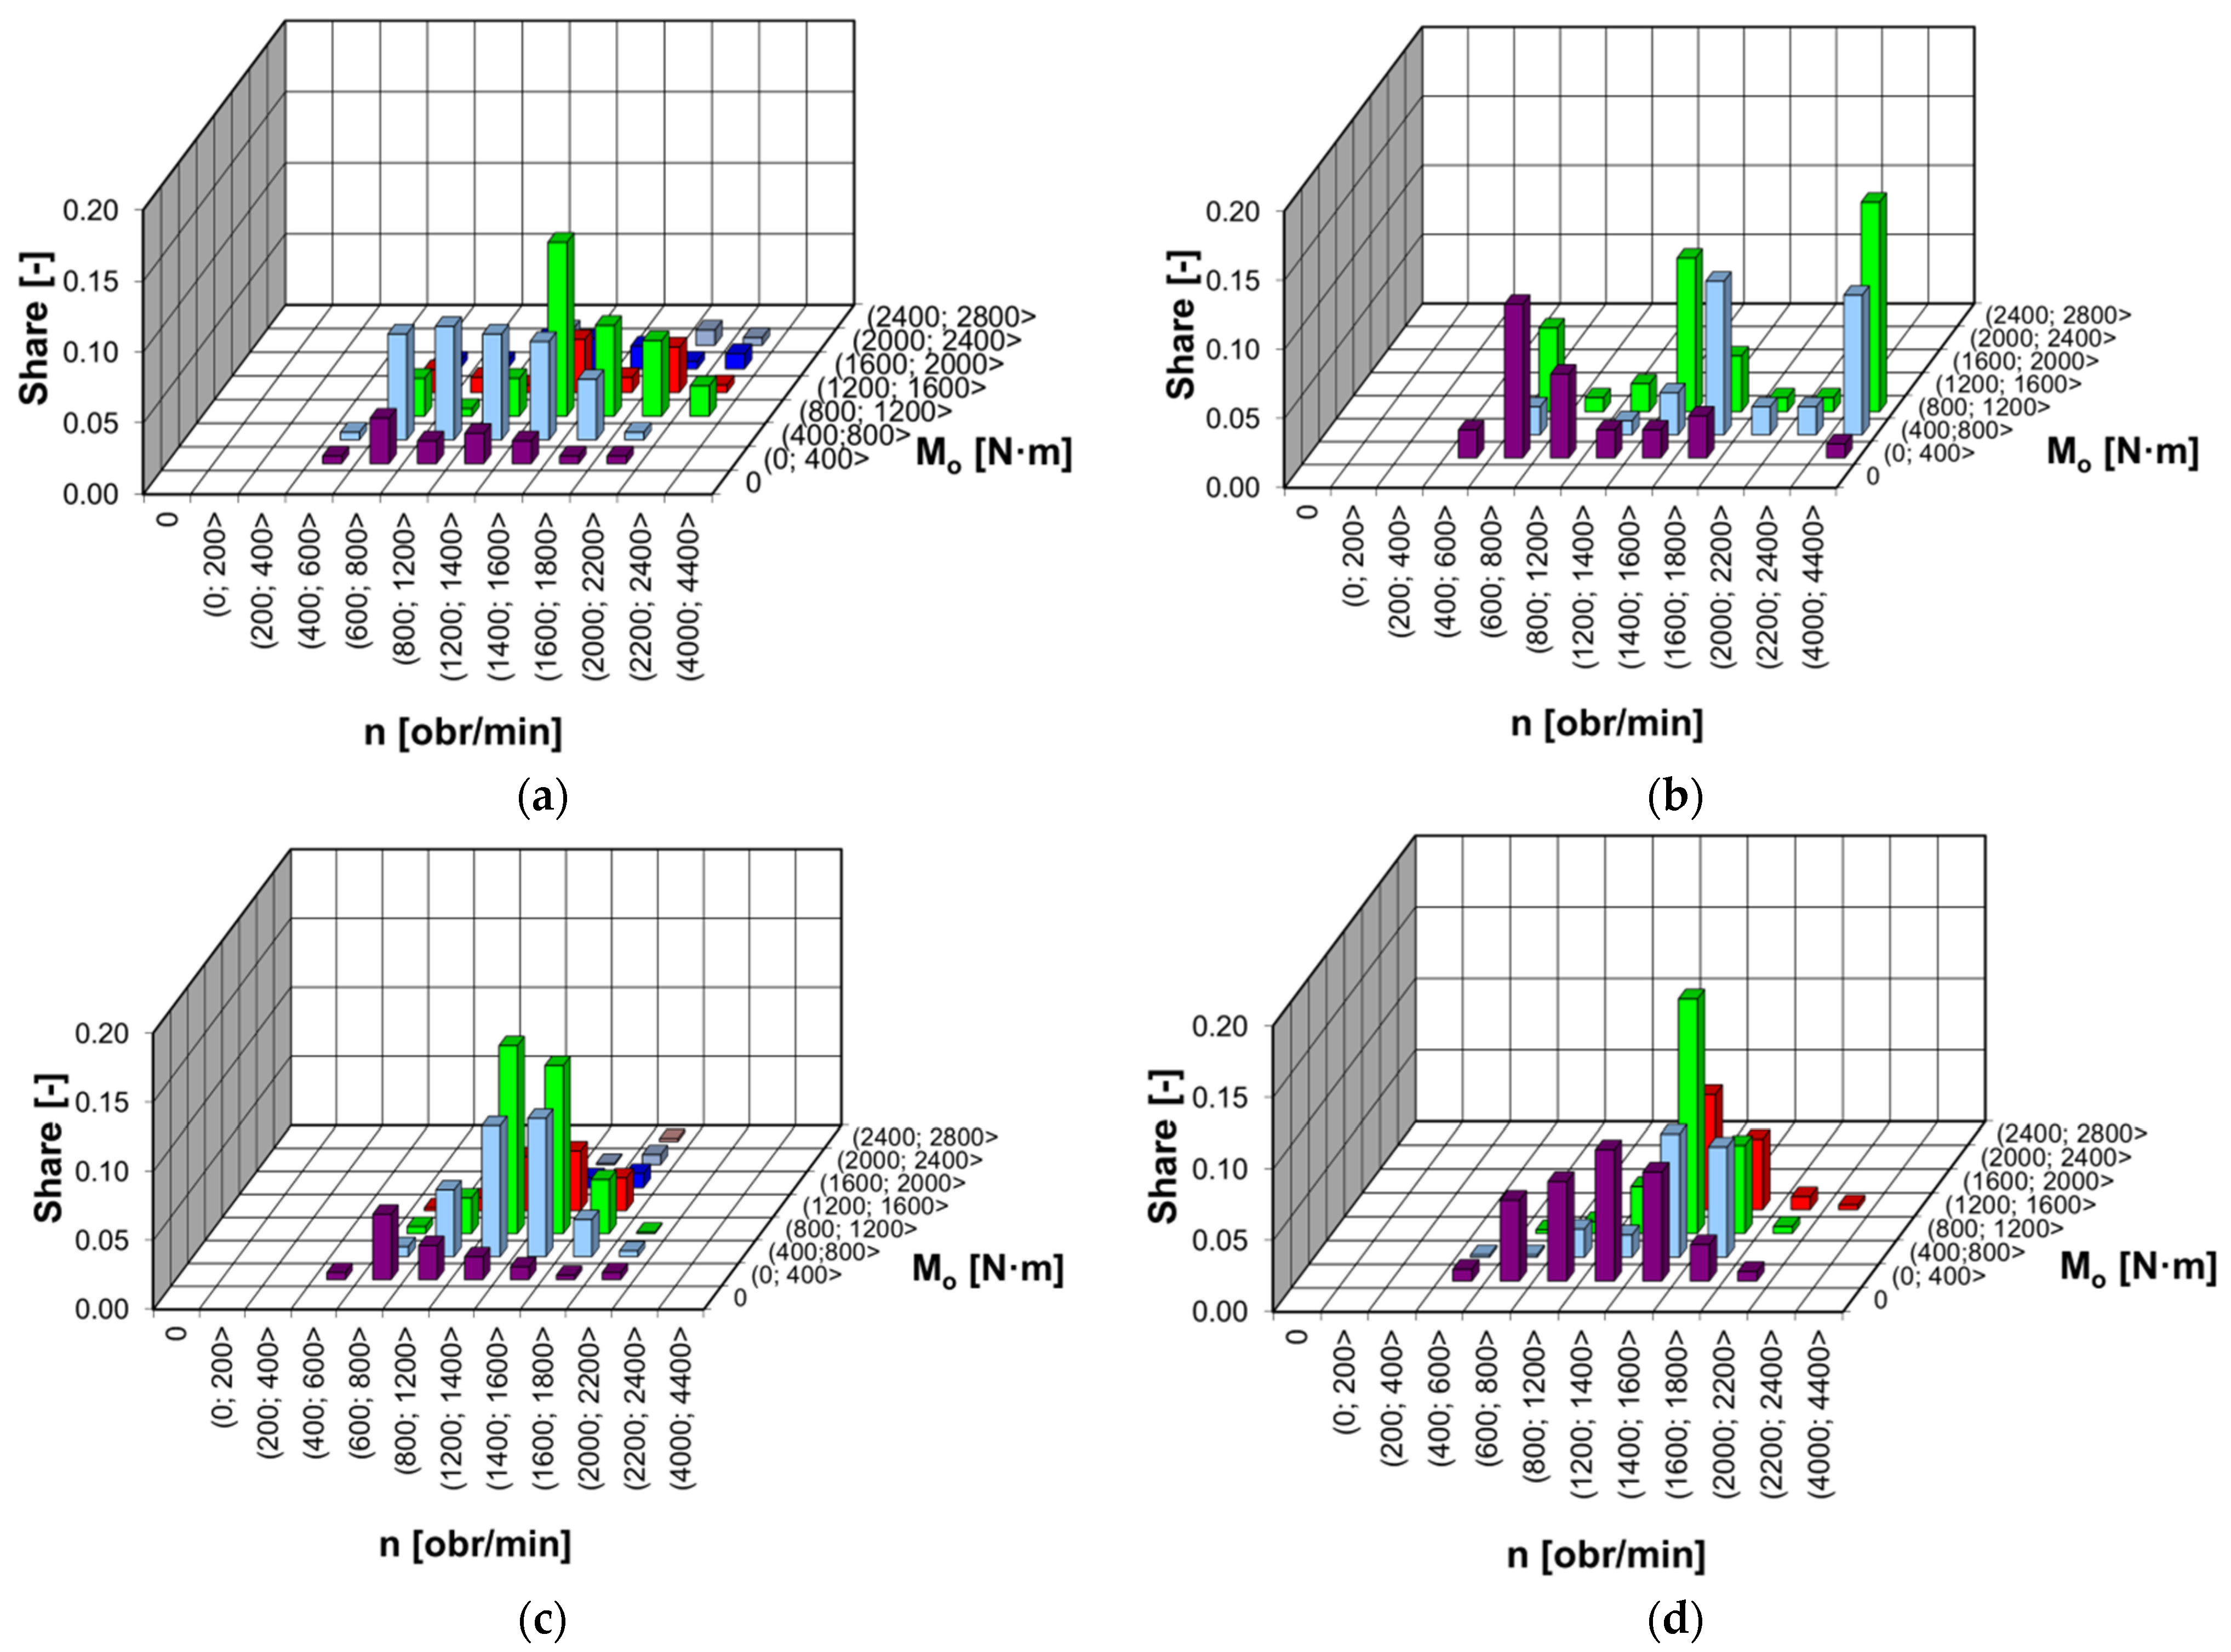
3.1. Analysis of Vehicle Movement and Drive Unit Performance Parameters

Based on the obtained data, the authors carried out an analysis of the vehicle speed on each of the individual stages of the test (Figure 5). The test run on the paved roads was realized with an average speed of approx. 48 km/h. The transport of timber on the forest roads, whose technical condition caused considerable motion resistance, was almost four times slower. This confirms the influence of the road condition on the efficiency of the transport process. This is particularly the case for the unpaved roads. The operation of heavy-duty trucks combined with bad weather conditions renders these roads almost impassable. In the tests performed by the authors, the road portion characterized by the highest variability of the road profile and the occurrence of the deepest ruts (Figure 4a) was covered with the speed of approx. 3 km/h. The portion marked purple (Figure 4b) was covered with the speed of 7 km/h and the portion characterized with the relatively best condition was covered with the speed of 14.6 km/h. Even though the drive on the unpaved roads constituted only 20% of the entire test, it took approx. half of the time for the entire procedure.
In order to visualize the influence of the type and condition of the road surface on the vehicle driving, the authors prepared operating time characteristics of the tested object as a function of speed and acceleration (Figure 6). The test run in the first stage of the test was characterized by a significant an approximative 40% share of stops, which directly resulted from the motion resistance and wheel slippage. The second stage was characterized by the greatest share of the vehicle in motion at the lowest speed values in the range of 4.8 m/s and accelerations from −0.6 m/s2 to 0.6 m/s2. The final stage of the drive on the forest roads was covered in a similar way to the previous one. In that case, the main share of the speed intervals was one order of magnitude higher. The most diverse characteristic was observed for the final part of the entire test, i.e., the test run on the bitumen-paved roads. The main area of operation in this part of the test was described by speeds in the range of 12 m/s; 20 m/s and accelerations in the range of −0.6 m/s2; 0.6 m/s2. When analyzing the obtained characteristics, one may observe a significant share of operation at lower speeds and at the entire range of accelerations. Such a diverse nature of the test run results from driving on the roads in the urban area as well as rural area with greater traffic intensity.
Recording the engine parameters allows for developing the operating time share characteristics as a function of engine load and speed (Figure 7). This allows for observing the main areas of operation in individual stages of the test. When analyzing the obtained graphs, one should observe that stage one of the test had different characteristics (Figure 7a). In this stage, we may distinguish three significant areas of the engine operation in the engine speed intervals of (600 rpm; 1200 rpm), (1400 rpm; 1800 rpm), (4000 rpm; 4400 rpm), and torque in the range of 0–1200 Nm. In this stage, the test run was performed on a highly uneven and slushy road, the effect of which was a significant wheel slippage. In the subsequent stages of the test, when the road condition improved, we may observe a single dominating operating area on the characteristics (Figure 7b,c). During the second stage, the engine operated in the speed range of (600 rpm; 1800 rpm) and torque of up to 800 Nm as well as (1400 rpm–2400 rpm) and torque of 800–1200 Nm. For the test drive on the bitumen-paved roads, we may observe an increase in the operating time share at the lowest load and engine speeds of 600–1800 rpm. The highest operating time shares in this case were observed for the load from 400 Nm to 1600 Nm and engine speed (1400 rpm–1800 rpm).

3.2. Analysis of the Individual Steps in the Timber Transport Process

Based on the parameters obtained from the GPS system, the authors recorded accurate data related to the course of each of the test stages. In the timber extraction process, the greatest share corresponds to the drive on paved roads. In the proposed cycle, this stage constituted approx. 80% of the entire test. The stages of the most difficult conditions constituted only a small part of the investigations, namely −0.5% for stage one and almost 2% for stage two (Figure 8).
The authors performed a similar analysis for the vehicle engine. In the entire research cycle, the vehicle engine performed work of over 67.6 kWh. Stage four of the test had the greatest share in the work performed by the engine. Compared to the share of the covered distance, the difference among the stages is not as significant (Figure 9). The share of the least arduous conditions (stage 3 and 4 of the test) referred to the performed work was 86% collectively. The authors also observed much greater shares of the first two stages of the test in the work performed by the engine (Figure 9).

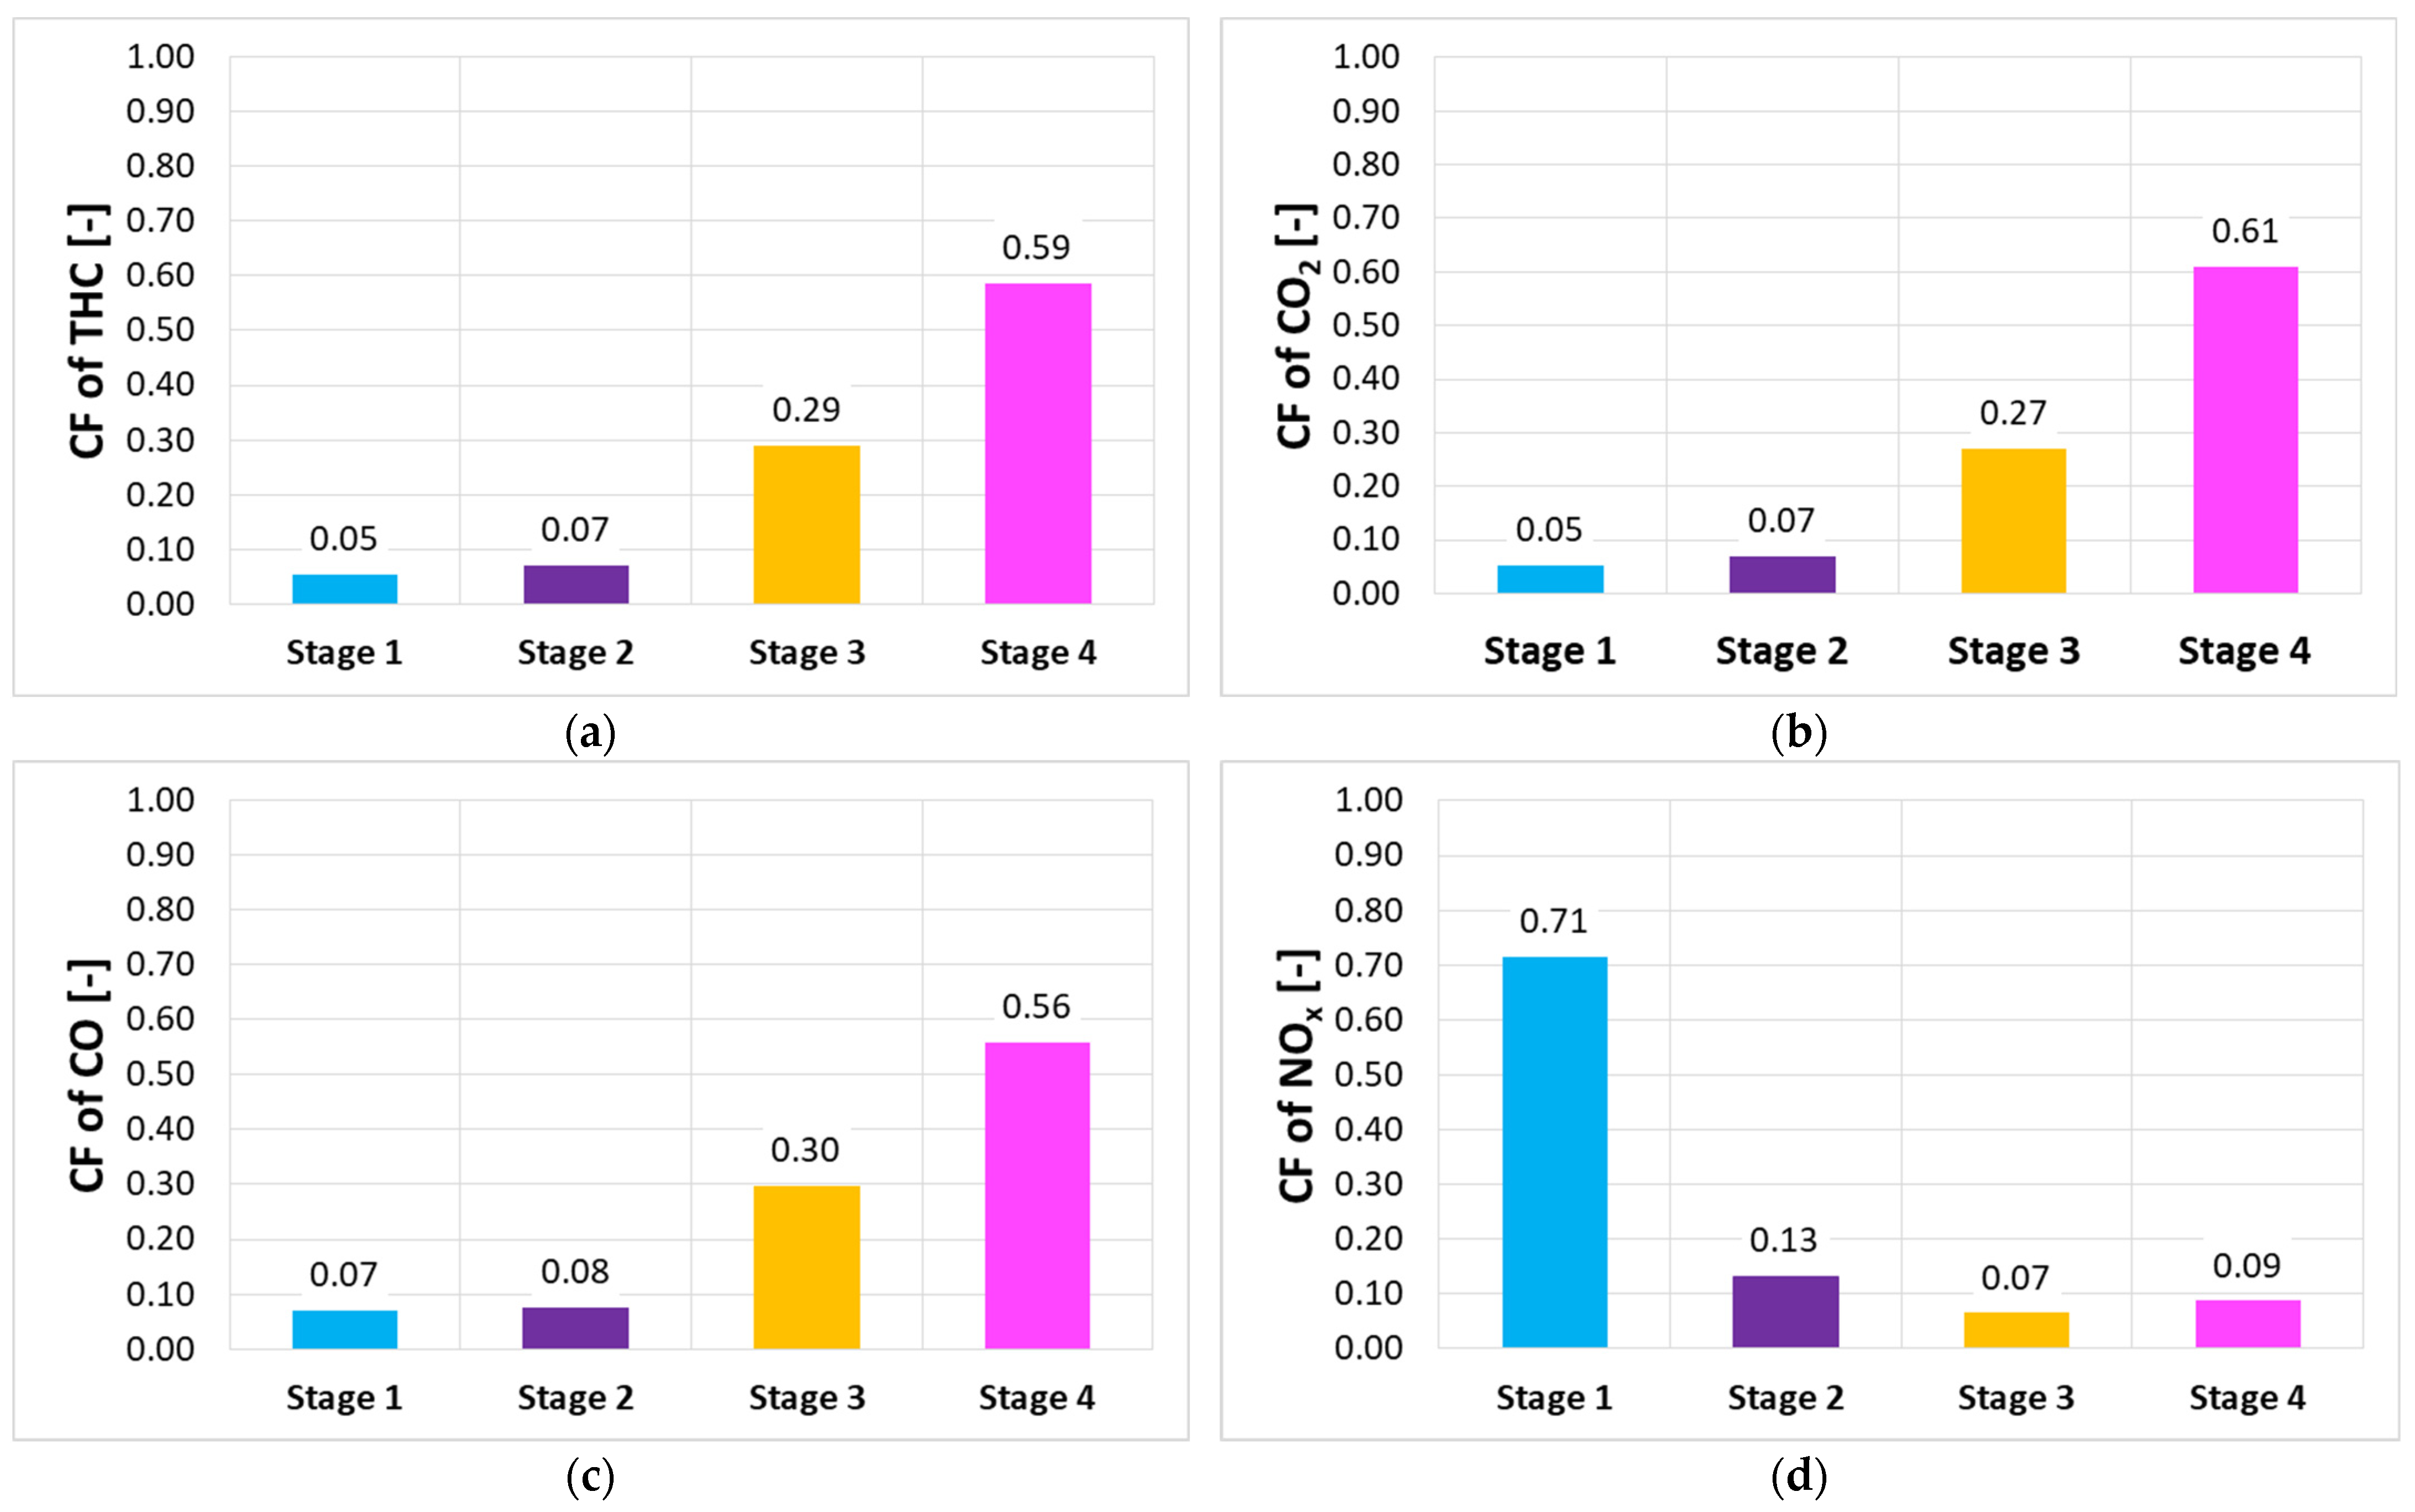
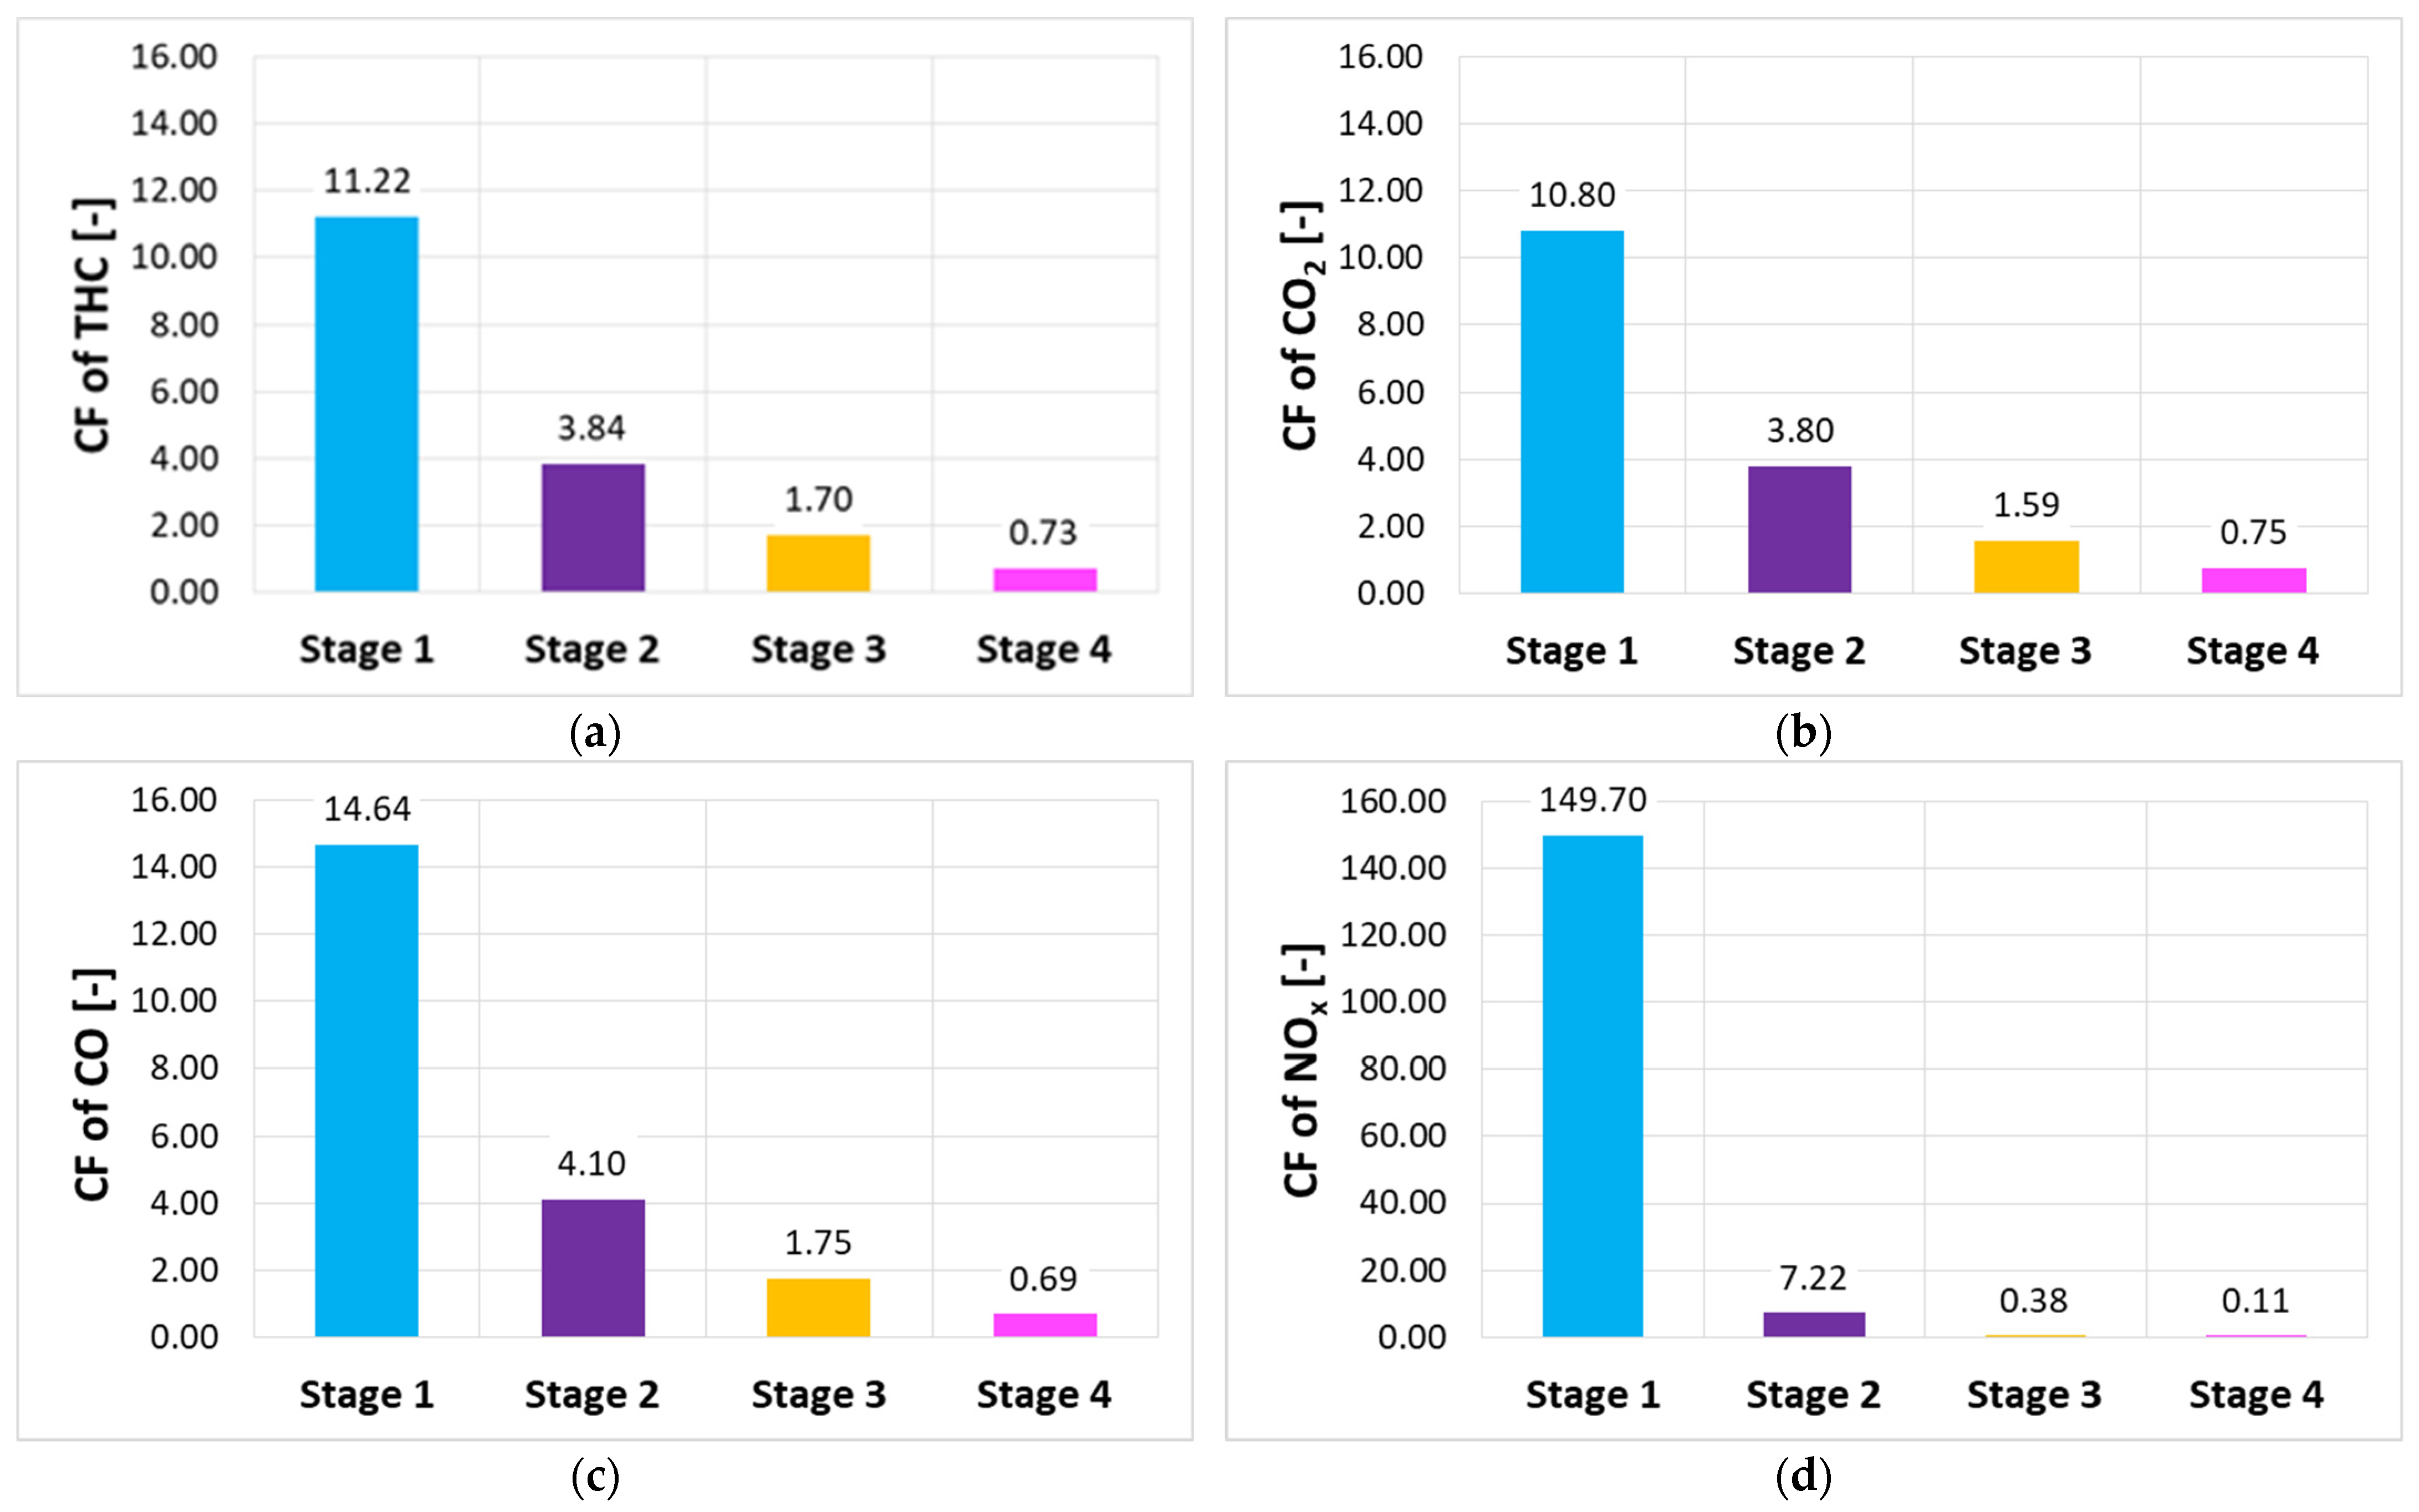
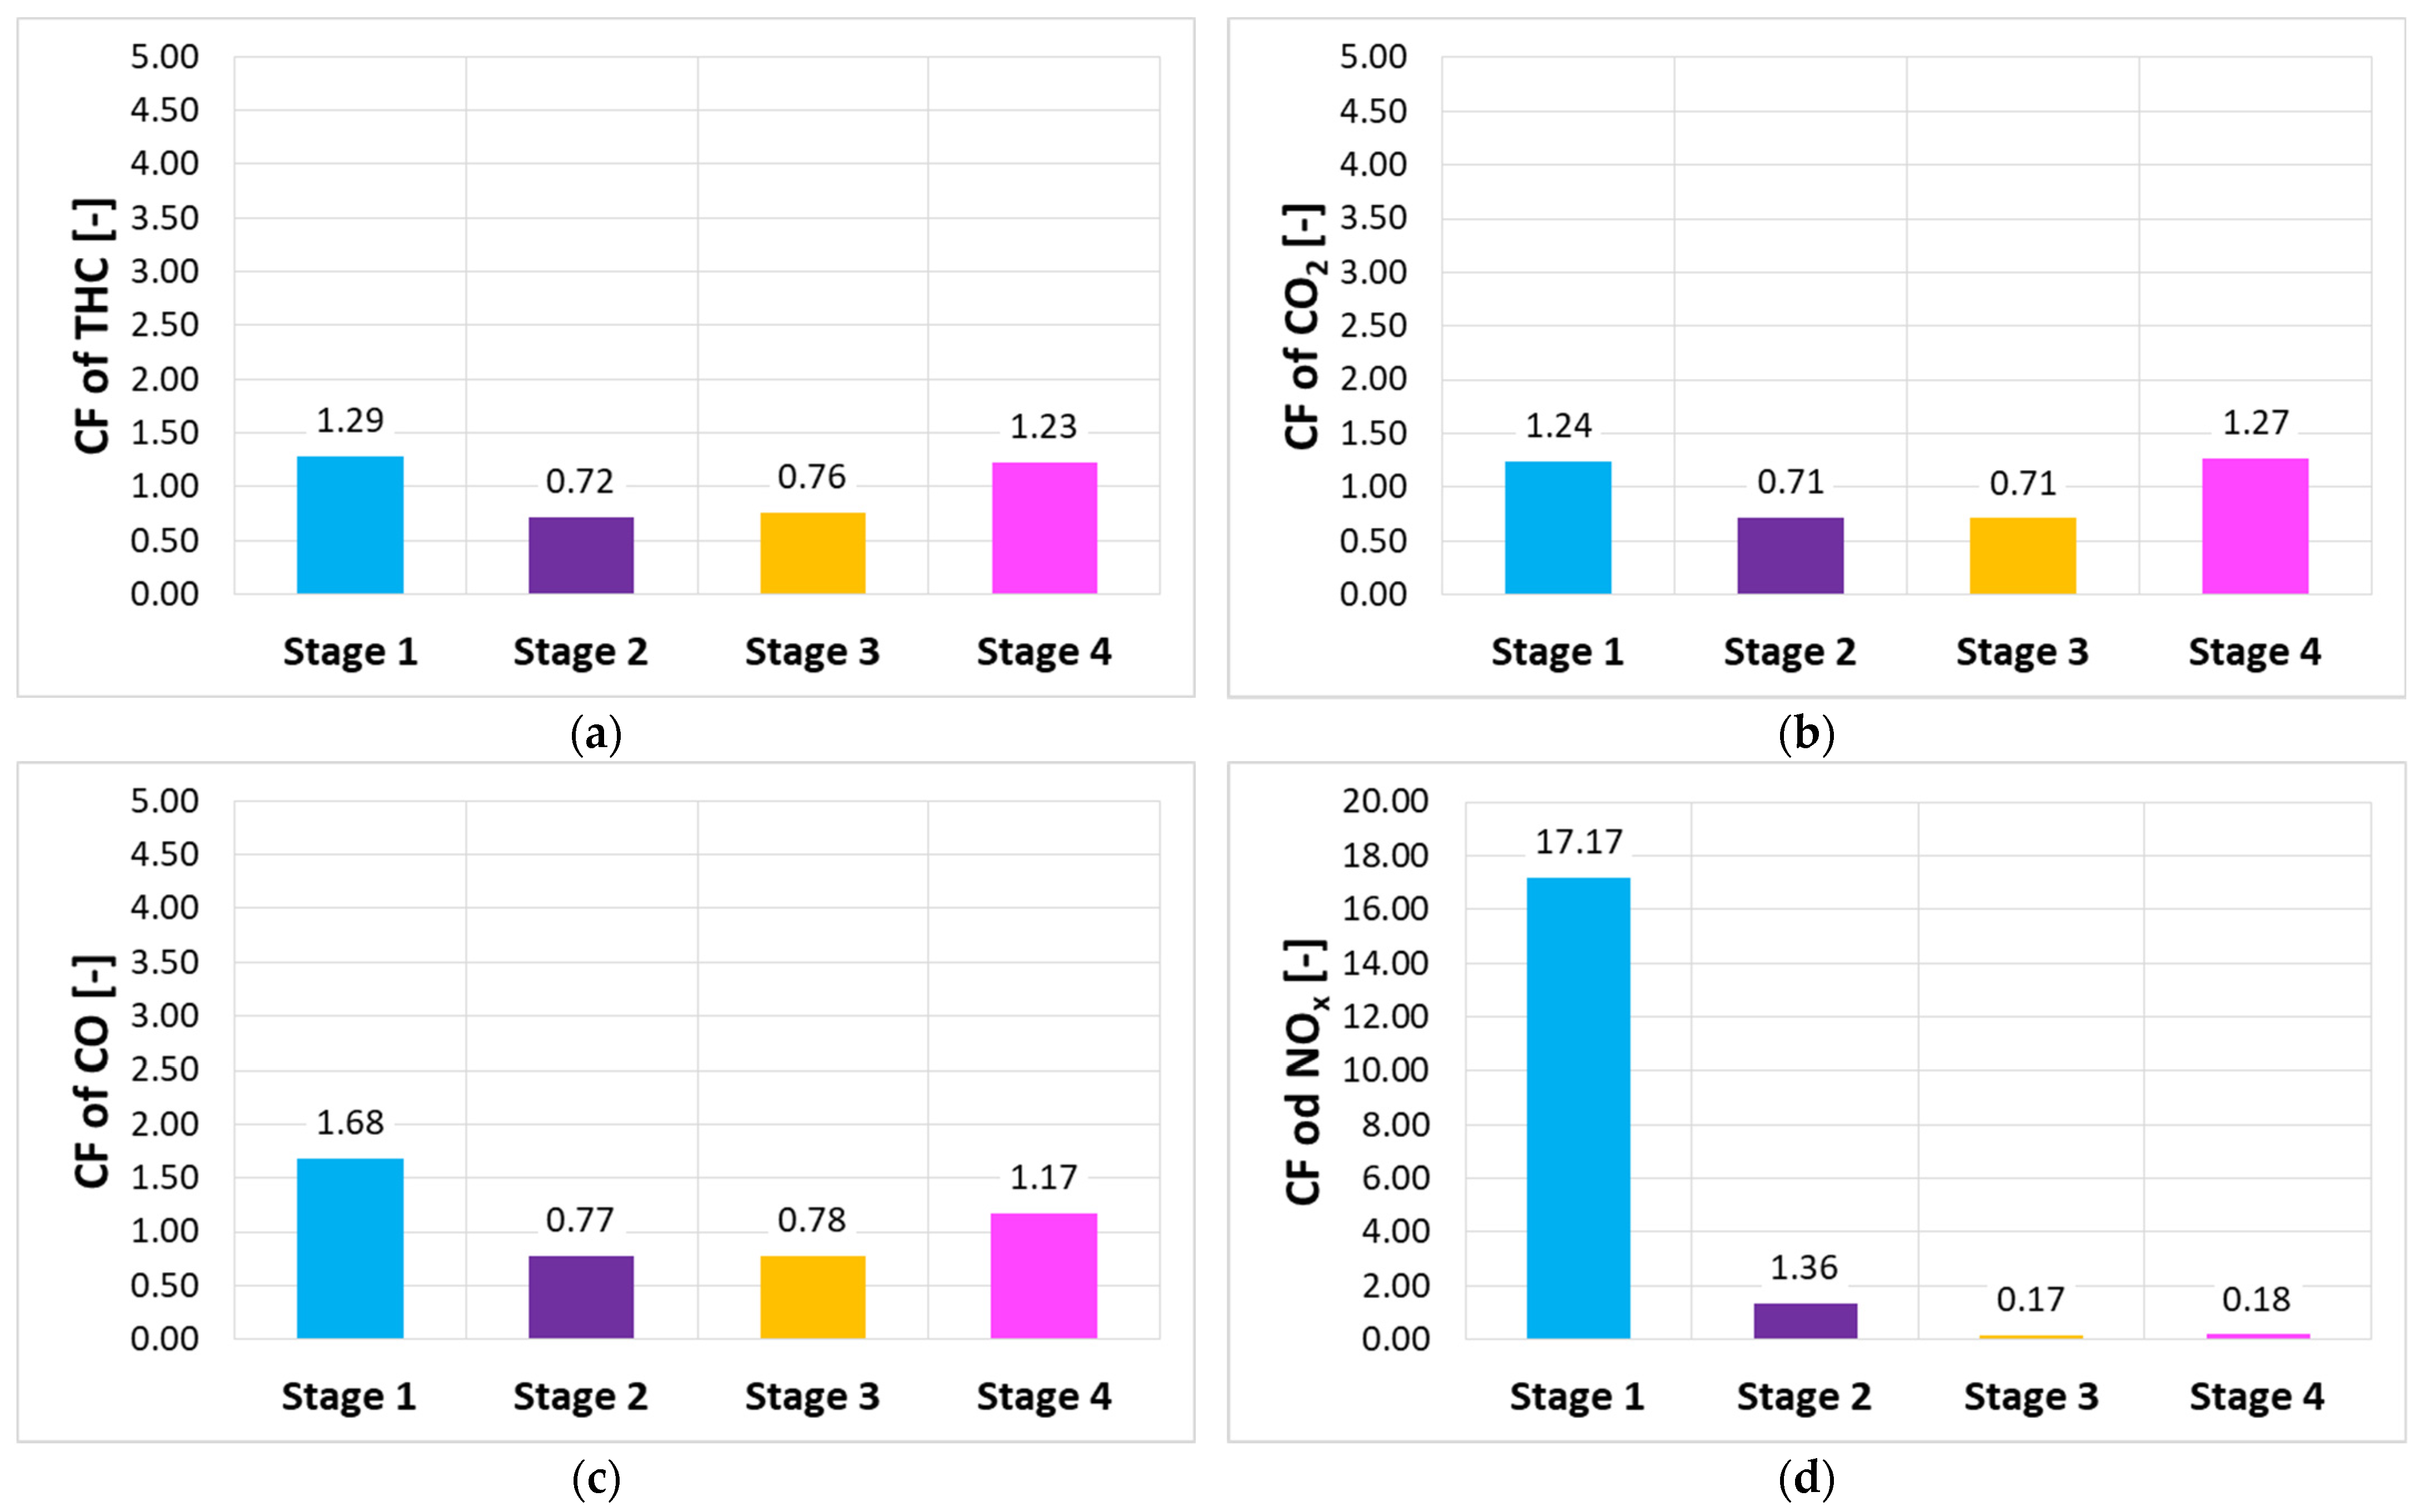
3.3. Analysis of Emissions of Harmful Compounds in the Process of Timber Transport

Tests performed under real-world conditions using the PEMS equipment allow for the recording of detailed emission-related data on each stage of the test. This allowed for calculating the basic values of the exhaust emissions (road and specific emissions—Table 3) and estimating the share that each of the road conditions distinguished in the test had in the emission of individual exhaust components. Therefore, the authors were able to propose a new emission assessment method by defining the contribution factor (CF):
C F = e m i s s i o n s   i n   t h e   s u b s e q u e n t   s t a g e s   o f   t h e   t e s t   g k m   o r   g k W h e m i s s i o n s   i n   t h e   e n t i r e   t e s t   g k m   o r   g k W h
Stage four of the test had the greatest share in the mass of the generated exhaust emissions. The mass of carbon dioxide and unburnt hydrocarbons in this stage was approx. 60% of the entire mass of produced emissions. As for stage three, for the above-mentioned exhaust components, this share was approx. 30%. The first two stages of the tests were responsible for the mass emission of approx. 5% CO2 and THC and 7% CO. The results are directly related to the specificity of the timber transport process. Stages three and four were the longest road portions. An opposite trend was observed for nitrogen oxides (Figure 10). In the case of nitrogen oxides, over 70% of the mass emission occurred in stage one. This is the effect of the low efficiency of the selective catalytic reduction system, which was not yet up to temperature.
Due to the nature of the test route and the varied transport models, the mass of the emitted exhaust components does not constitute a universal indicator providing valuable information regarding the vehicle exhaust emission level. Hence, the authors performed an analysis of the contribution factors of individual test stages for the road and specific emissions. In the case of the road emissions, the greatest share was observed for the first stage of the test. This results from the fact that this stage was the shortest (approx. 100 m.). It is noteworthy that the contribution factor for nitrogen oxides for the first stage significantly diverges from the contribution factors of the other analyzed exhaust components. For the first stage, it reached almost 150. Additionally, for the subsequent stages of the test, it dramatically decreased to reach 0.1 in the final stage. This relation confirms the assumption that, in the beginning of the test, the emission of NOx was high and, as the following test stages took place, the SCR system (selective catalyst reduction) became more efficient, thus reducing the said emission (Figure 11). When analyzing the obtained results, one may observe that the contribution factors of CO, THC, and CO2 for each stage of the test decreased with the progression of the test.
In the homologation tests of heavy-duty vehicles, the exhaust emissions are referred to the work performed by the engine. Therefore, in the case of the tested object, it was more important to determine the specific emission share coefficients for individual stages of the test. The obtained results are shown in Figure 12. As for the emission coefficients for CO2, THC, and CO, it is noteworthy that the greatest values were observed for stage one and stage four. In the case of the first two components, the values of the obtained share coefficients were very similar. The lowest values were recorded for stage two and the last stage. For the above-mentioned exhaust components, the share coefficients were almost the same and amounted to 0.71–0.78. Analogically to the analysis of the road emission share coefficients, in the analysis of the specific emission share coefficients, nitrogen oxides also had a different trend. The greatest share coefficient was recorded for stage one—its value was over 17. The share of the subsequent stages in the specific emission during the test was negligible. The test and the performed analysis confirmed that the greatest share of the emission of nitrogen oxides occurred in stage one. This stage was characterized by the shortest distance and the most arduous conditions. The higher emission was influenced by a high engine load that generated excess NOx. Additionally, the cold start and low exhaust gas temperature may have rendered the SCR system inactive. The influence of the temperature on the operation of the SCR system has been proven in many publications [31,32,33]. The research in paper [34] confirms that the operation of an engine that is not up to temperature increases the emission of nitrogen oxides by over 50%. The investigations presented in work [35] covered the measurement of the emission of nitrogen oxides in a laboratory WHTC test. They confirm an increased emission of nitrogen oxides during the cold phase of the test. The fact that the temperature of this aftertreatment system plays a key role is also confirmed by the research presented in [36]. The authors have proven that the low temperature of the system results in an insufficient injection of the water solution of urea.
The fuel demand was calculated based on the carbon balance method. This method is currently the most accurate way to determine fuel consumption. The transport of timber in the proposed cycle resulted in a fuel consumption of 59 dm3/100 km. Knowing the fuel mileage in individual stages of the test, the authors could calculate the share coefficients presented in Figure 13. The greatest coefficient was recorded for stage one, which directly results from the length of this road portion and the specificity of the test run. This stage included negotiating an extremely requiring turn in terms of the road conditions (Figure 14). A slushy and muddy road surface caused the vehicle to move at a very low speed, interrupted with frequent stops. These factors caused high fuel consumption that translated into a high value of fuel mileage of stage one compared to the entire research cycle. The fact that the condition and type of the road surface plays a key role in the fuel consumption has been proven in many publications presenting both simulations and real-world trials [27,37,38]. Fuel consumption constitutes the main indicator of the economy of a vehicle or a transport process. Hence, many research works focus on this aspect or are supplemented with this particular fuel mileage indicator. For example, during the testing of a heavy-duty truck [39] in real-world traffic on bitumen-paved roads, the fuel mileage reached a little over 28 dm3/100 km.
The test was performed based on a cycle designed so as to reflect the actual timber transport process. The test covered the extraction of 24 m3 pine timber cut in October 2021. The transport process took place in January 2022. The length of timber was from 6.2 to 13.8 m, and its volume was in the range of 0.4–1.05 m3. The density of the transported timber was approx. 1000 kg/m3. Based on the above data, the authors determined the coefficient of energy demand (understood as fuel demand) referred to the amount of transported timber and length of the route depending on the road conditions. The obtained results are shown in Table 4.

4. Conclusions

Currently, a variety of actions are being undertaken to reduce the negative impact of all types of industry on the natural environment. In the case of transport, the majority of the actions focus on the reduction in the exhaust emissions through aftertreatment systems, improvements in the combustion process, or the application of alternative powertrains. However, it is important to note that the emissions are influenced by a variety of factors and one of the methods of their reduction is a skillfully designed transport process and road infrastructure. The transport of timber is a great example of a transport process taking place under varied conditions. The main objective of this article was to find the relationship between the type of road surface and the emission of harmful compounds in the process of timber transport. The real-world investigations using portable emission measurement systems allowed for a detailed analysis of the influence of a given condition on the exhaust emissions and fuel consumption. The authors’ analysis confirmed the fundamental impact of the road conditions on the exhaust emissions. Stage one, characterized by the most arduous road conditions, had the greatest coefficients of both road and specific emissions. As the condition of the unpaved roads improved in the course of the test, the coefficients of emission dropped. The investigations also confirmed the key role of the aftertreatment systems and the technique of realization of the transport process in the vehicle’s environmental performance. This is confirmed by the coefficients related to the emission of nitrogen oxides. The question of fuel consumption is important in the performed analysis. From the investigations, it results that the operation of a vehicle under difficult conditions (significant wheel slippage) heavily influences the fuel consumption. The fuel demand coefficients developed by the authors allow for estimating the fuel consumption for the transport of timber depending on the length of the extraction route and the volume of the cargo, which have a clear impact on both emissions and fuel consumption. The harshest conditions resulted in a more than 14 times higher fuel consumption relative to driving on a paved road despite being the shortest stage in terms of length. Equally significantly, higher specific emissions were observed in the first stage relative to the last stage. For THC, specific emissions were 1.04 times higher, for CO almost 1.4 times higher, and for NOx more than 95 times higher.
The authors of the publication plan to carry out a number of studies in the near future, taking into account other road conditions (including rain, snow). For control purposes, it is planned to test emissions for a process using paved forest roads. These tests will be a continuation of the amalgamation presented in this article.
It is noteworthy that the vehicle used for the investigations belongs to the HDV category. Such vehicles carry out transport processes under varied conditions on construction sites, in forests, or mountainous areas. Importantly, vehicles operating under different conditions are homologated to the same standards, and laboratory and road tests do not allow for such varied conditions, which can significantly affect engine operating range and emissions.

Author Contributions

Conceptualization, A.Z., P.F., P.L., A.J. and M.B.; methodology, A.Z., P.F., P.L., A.J., M.B. and W.K.; software, A.Z., P.F. and W.K.; formal analysis, A.Z., P.F. and A.J.; writing, M.B., A.J. and A.Z.; writing—review and editing, A.Z. and A.J.; visualization, M.B. and J.I.-K.; supervision, A.Z. and P.F.; project administration, A.Z.; funding acquisition, P.F. All authors have read and agreed to the published version of the manuscript.

Funding

The study presented in this article was performed within the statutory research (contract No. 0415/SBAD/0326).

Data Availability Statement

Not applicable.

Acknowledgments

Not applicable.

Conflicts of Interest

The authors declare no conflict of interest.

References

  1. Available online: https://ec.europa.eu/eurostat/web/main/data/database (accessed on 6 December 2022).
  2. Joint Research Centre, European Commission. The Future of Road Transport; EUR 29748 EN; Publications Office of the European Union: Luxembourg, 2019. [Google Scholar] [CrossRef]
  3. Merkisz, J.; Pielecha, J. Emisja Cząstek Stałych ze Źródeł Motoryzacyjnych; Wydawnictwo Politechniki Poznańskiej: Poznań, Poland, 2014. [Google Scholar]
  4. Leikauf, G.D.; Kim, S.H.; Jang, A.S. Mechanizmy skutków zdrowotnych układu oddechowego wywołanych najdrobniejszymi cząstkami. Exp. Mol. Med. 2020, 52, 329–337. [Google Scholar] [CrossRef] [PubMed]
  5. Available online: https://www6.eea.com (accessed on 6 December 2022).
  6. Aminzadegan, S.; Shahriari, M.; Mehranfar, F.; Abramović, B. Factors affecting the emission of pollutants in different types of transportation: A literature review. Energy Rep. 2022, 8, 2508–2529. [Google Scholar] [CrossRef]
  7. Grieshop, A.P.; Lipsky, E.M.; Pekney, N.J.; Takahama, S.; Robinson, A.L. Fine particle emission factors from vehicles in a highway tunnel: Effects of fleet composition and season. Atmos. Environ. 2006, 40 (Suppl. S2), 287–298. [Google Scholar] [CrossRef]
  8. André, M.; Hammarström, U. Driving speeds in Europe for pollutant emissions estimation. Transp. Res. Part D Transp. Environ. 2000, 5, 321–335. [Google Scholar] [CrossRef]
  9. Kean, A.J.; Harley, R.A.; Kendall, G.R. Effects of Vehicle Speed and Engine Load on Motor Vehicle Emissions. Environ. Sci. Technol. 2003, 37, 3739–3746. [Google Scholar] [CrossRef]
  10. Zare, A.; Nabi, M.N.; Bodisco, T.A.; Hossain, F.M.; Rahman, M.M.; Van, T.C.; Ristovski, Z.D.; Brown, R.J. Diesel engine emissions with oxygenated fuels: A comparative study into cold-start and hot-start operation. J. Clean. Prod. 2017, 162, 997–1008. [Google Scholar] [CrossRef]
  11. Leblanc, M.; Noël, L.; R’Mili, B.; Boréave, A.; D’Anna, B.; Raux, S. Impact of Engine Warm-up and DPF Active Regeneration on Regulated & Unregulated Emissions of a Euro 6 Diesel SCR Equipped Vehicle. J. Earth Sci. Geotech. Eng. 2016, 6, 29–50. [Google Scholar]
  12. Weilenmann, M.; Favez, J.-Y.; Alvarez, R. Cold-Start Emissions of Modern Passenger Cars at Different Low Ambient Temperatures and Their Evolution over Vehicle Legislation Categories. Atmos. Environ. 2009, 43, 2419–2429. [Google Scholar] [CrossRef]
  13. Farrington, R.; Rugh, J. Impact of Vehicle Air-Conditioning on Fuel Economy, Tailpipe Emissions, and Electric Vehicle Range; National Renewable Energy Lab. (NREL): Golden, CO, USA, 2000. [Google Scholar]
  14. Amanatidis, S.; Ntziachristos, L.; Giechaskiel, B.; Bergmann, A.; Samaras, Z. Impact of Selective Catalytic Reduction on Exhaust Particle Formation over Excess Ammonia Events. Environ. Sci. Technol. 2014, 48, 11527–11534. [Google Scholar] [CrossRef]
  15. Gallus, J.; Kirchner, U.; Vogt, R.; Benter, T. Impact of driving style and road grade on gaseous exhaust emissions of passenger vehicles measured by a Portable Emission Measurement System (PEMS). Transp. Res. Part D Transp. Environ. 2017, 52, 215–226. [Google Scholar] [CrossRef]
  16. Merkisz, J.; Andrzejewski, M.; Pielecha, J. The effect of applying the eco-driving rules on the exhaust emissions. Combust. Engines 2013, 155, 66–74. [Google Scholar] [CrossRef]
  17. Dimaratos, A.; Giechaskiel, B.; Clairotte, M.; Fontaras, G. Impact of Active Diesel Particulate Filter Regeneration on Carbon Dioxide, Nitrogen Oxides and Particle Number Emissions from Euro 5 and 6 Vehicles under Laboratory Testing and Real-World Driving. Energies 2022, 15, 5070. [Google Scholar] [CrossRef]
  18. Huang, Y.; Ng, E.C.Y.; Surawski, N.C.; Zhou, J.L.; Wang, X.; Gao, J.; Lin, W.; Brown, R.J. Effect of diesel particulate filter regeneration on fuel consumption and emissions performance under real-driving conditions. Fuel 2022, 320, 123937. [Google Scholar] [CrossRef]
  19. Barrios, C.C.; Domínguez-Sáez, A.; Rubio, J.R.; Pujadas, M. Factors influencing the number distribution and size of the particles emitted from a modern diesel vehicle in real urban traffic. Atmos. Environ. 2012, 56, 16–25. [Google Scholar] [CrossRef]
  20. Giechaskiel, B.; Riccobono, F.; Vlachos, T.; Mendoza-Villafuerte, P.; Suarez-Bertoa, R.; Fontaras, G.; Bonnel, P.; Weiss, M. Vehicle emission factors of solid nanoparticles in the laboratory and on the road using portable emission measurement systems (PEMS). Front. Environ. Sci. 2015, 3, 82. [Google Scholar] [CrossRef]
  21. Sokolnicka-Popis, B.; Szymlet, N.; Siedlecki, M.; Gallas, D. The impact of particulate filter substrate type on the gaseous exhaust components emission. Combust. Engines 2020, 183, 58–62. [Google Scholar] [CrossRef]
  22. Siedlecki, M.; Szymlet, N.; Sokolnicka, B. Influence of the Particulate Filter Use in the Spark Ignition Engine Vehicle on the Exhaust Emission in Real Driving Emission Test. J. Ecol. Eng. 2020, 21, 120–127. [Google Scholar] [CrossRef]
  23. Šarkan, B.; Jaśkiewicz, M.; Kubiak, P.; Tarnapowicz, D.; Loman, M. Exhaust Emissions Measurement of a Vehicle with Retrofitted LPG System. Energies 2022, 15, 1184. [Google Scholar] [CrossRef]
  24. Jaworski, A.; Lejda, K.; Lubas, J.; Mądziel, M. Comparison of exhaust emission from Euro 3 and Euro 6 motor vehicles fueled with petrol and LPG based on real driving conditions. Combust. Engines 2019, 178, 106–111. [Google Scholar] [CrossRef]
  25. Meneguzzer, C.; Gastaldi, M.; Rossi, R.; Gecchele, G.; Prati, M.V. Comparison of exhaust emissions at intersections under traffic signal versus roundabout control using an instrumented vehicle. Transp. Res. Procedia 2017, 25, 1597–1609. [Google Scholar] [CrossRef]
  26. Ziółkowski, A.; Fuć, P.; Lijewski, P.; Jagielski, A.; Bednarek, M.; Kusiak, W. Analysis of Exhaust Emissions from Heavy-Duty Vehicles on Different Applications. Energies 2022, 15, 7886. [Google Scholar] [CrossRef]
  27. Lijewski, P.; Merkisz, J.; Fuć, P.; Ziółkowski, A.; Rymaniak, L.; Kusiak, W. Zużycie paliwa i emisja spalin w procesie zmechanizowanego pozyskiwania i transportu drewna. Eur. J. Za. Rez. 2017, 136, 153–160. [Google Scholar] [CrossRef]
  28. Hong, B.; Lü, L. Assessment of Emissions and Energy Consumption for Construction Machinery in Earthwork Activities by Incorporating Real-World Measurement and Discrete-Event Simulation. Sustainability 2022, 14, 5326. [Google Scholar] [CrossRef]
  29. Triantafyllopoulos, G.; Dimaratos, A.; Ntziachristos, L.; Bernard, Y.; Dornoff, J.; Samaras, Z. A study on the CO2 and NOx emissions performance of Euro 6 diesel vehicles under various chassis dynamometer and on-road conditions including latest regulatory provisions. Sci. Total Environ. 2019, 666, 337–346. [Google Scholar] [CrossRef]
  30. Press Materials. Available online: https://www.globalmrv.com (accessed on 13 January 2023).
  31. Giechaskiel, B.; Gioria, R.; Carriero, M.; Lähde, T.; Forloni, F.; Perujo, A.; Martini, G.; Bissi, L.M.; Terenghi, R. Emission Factors of a Euro VI Heavy-duty Diesel Refuse Collection Vehicle. Sustainability 2019, 11, 1067. [Google Scholar] [CrossRef]
  32. Zhang, Y.; Lou, D.; Tan, P.; Hu, Z.; Fang, L. Effect of SCR downsizing and ammonia slip catalyst coating on the emissions from a heavy-duty diesel engine. Energy Rep. 2022, 8, 749–757. [Google Scholar] [CrossRef]
  33. Leskovjan, M.; Kočí, P.; Maunula, T. Simulation of diesel exhaust aftertreatment system DOC—pipe—SCR: The effects of Pt loading, PtOx formation and pipe configuration on the deNOx performance. Chem. Eng. Sci. 2018, 189, 179–190. [Google Scholar] [CrossRef]
  34. Varella, R.; Faria, M.; Mendoza-Villafuerte, P.; Baptista, P.C.; Sousa, L.; Duarte, G.O. Assessing the influence of boundary conditions, driving behavior and data analysis methods on real driving CO2 and NOx emissions. Sci. Total Environ. 2019, 658, 879–894. [Google Scholar] [CrossRef]
  35. Sala, R.; Krasowski, J.; Dzida, J. Selective Catalytic Reduction of Nitrogen Oxides in Vehicles Complaint to Euro VI Emission Limit, Autobusy: Technika, Eksploatacji, Systemy Transportwoe; Instytut Naukowo-Wydawniczy Spatium: Radom, Poland, 2017; pp. 1052–1056. [Google Scholar]
  36. Li, P.; Lü, L. Evaluating the Real-World NOx Emission from a China VI Heavy-Duty Diesel Vehicle. Appl. Sci. 2021, 11, 1335. [Google Scholar] [CrossRef]
  37. Drywa, M. Wpływ nawierzchni jezdni na zużycie paliwa. Autobusy. Tech. Eksploat. Syst. Transp. 2014, 10, 10. [Google Scholar]
  38. Kokoszka, S.; Kuboń, M. A Comperative Analysis of the Roads for Agriculture Transport on Plain and Piedmont Areas; Inżynieria Rolnicza: Cracov, Poland, 2004; pp. 253–261. [Google Scholar]
  39. Merkisz, J.; Kozak, M.; Molik, P.; Nijak, D.; Andrzejewski, M.; Nowak, M.; Rymaniak, Ł.; Ziółkowski, A. The analysis of the emission level from a heavy-duty truck in city traffic. Silniki Spalinowe 2012, 150, 80–88. [Google Scholar]
Figure 1. Research object.
Energies 16 07257 g001
Figure 2. Portable emission measurement system Axion RS+.
Energies 16 07257 g002
Figure 3. Timber extraction route.
Energies 16 07257 g003
Figure 4. Condition of the unpaved roads: (a)—stage one (road portion marked blue), (b)—stage two (road portion marked magenta), (c)—stage three (road portion marked yellow).
Energies 16 07257 g004
Figure 5. Vehicle velocity profile. (Vertical lines mark the end of the subsequent stages of the study).
Energies 16 07257 g005
Figure 6. Operating time share as a function of speed and acceleration during individual test stages, (a) stage one, (b) stage two, (c) stage three, (d) stage four—bitumen-paved road.
Energies 16 07257 g006
Figure 7. Operating time share as a function of engine load and engine speed during individual test stage, (a) stage one, (b) stage two, (c) stage three, (d) stage four—bitumen-paved road.
Energies 16 07257 g007
Figure 8. Coefficient of road type share on individual stages of the test.
Energies 16 07257 g008
Figure 9. Coefficient of the share of work in individual stages.
Energies 16 07257 g009
Figure 10. Coefficients of mass share of the emission components in individual stages of the test (a) THC, (b) CO2, (c) CO, and (d) NOx.
Energies 16 07257 g010
Figure 11. Road emission share coefficients in individual stages of the test for (a) THC, (b) CO2, (c) CO, and (d) NOx.
Energies 16 07257 g011
Figure 12. Specific emission share coefficients in individual stages of the test for (a) THC, (b) CO2, (c) CO, and (d) NOx.
Energies 16 07257 g012
Figure 13. Fuel mileage share coefficients in individual stages.
Energies 16 07257 g013
Figure 14. Stage one of the research cycle—a turn on the forest road.
Energies 16 07257 g014
Table 1. Specification of the research objects.
ParameterResearch Object
Engine typeDiesel
Displacement12.4 dm3
Maximum power output @1900 rpm353 kW
Number of cylinders6
Emission standardEuro VI
AftertreatmentSCR, DPF, DOC
Table 2. Axion RS+ technical specifications.
ParameterMeasurement MethodMeasurement RangeMeasurement Accuracy
CO2Non-dispersive infrared0–16%±3%
CONon-dispersive infrared0–10%±3%
HCNon-dispersive infrared0–2000 ppm±4%
O2Electrochemical0–25%±1%
NOxElectrochemical0–5000 ppm±1%
PMLaser dispersion0–250 g/m3±2%
Table 3. Comparison of the emissions in the test.
IndexExhaust Component
COTHCNOxCO2
Road emission2.98 g/km0.10 g/km0.14 g/km1557.29 g/km
Specific emission0.91 g/kWh0.03 g/kWh0.04 g/kWh477 g/kWh
Table 4. Fuel demand in timber transport.
StageFuel Consumption
dm3/100 km × 1 m3dm3/1 km × 1 m3
Stage 126.571.100
Stage 29.340.093
Stage 33.910.039
Stage 41.850.018
Entire test2.450.024
Disclaimer/Publisher’s Note: The statements, opinions and data contained in all publications are solely those of the individual author(s) and contributor(s) and not of MDPI and/or the editor(s). MDPI and/or the editor(s) disclaim responsibility for any injury to people or property resulting from any ideas, methods, instructions or products referred to in the content.

