Abstract
The nano-scale pore systems in shale reservoirs control shale gas transportation and aggregation, which is of great significance for the resource evaluation of shale oil and gas and the selection of a “sweet spot”. Taking twelve marine shale samples from the Wufeng–Longmaxi Formation in the Zigong area, southwest Sichuan Basin, as the research target, we carried out a series of experiments, including total organic carbon (TOC) analysis, X-ray diffraction (XRD), gas adsorption (CO2 + N2), and mercury intrusion porosimetry (MIP), to study the full-scale pore structure characterization and controlling factors of pore volume and specific surface area. The results presented the following findings. (1) Marine shale samples from the target area are rich in organic matter, with an average TOC value of 3.86%; additionally, the mineral composition was dominated by quartz and clay minerals, with average contents of 44.1% and 31.4%, respectively. (2) The full-scale pore size distribution curves of pore volume developed multimodally, with the main peaks at 0.5 nm–2 nm, 3 nm–6 nm, and 700 nm–2.2 um; moreover, the full-scale pore size distribution curves of a specific surface area developed unimodally, with the main peak ranging from 0.5 nm to 1.2 nm. (3) Pore volume was mainly contributed by mesopores and macropores, with an average contribution of 46.66% and 42.42%, respectively, while the contribution of micropores was only 10.91%. The specific surface area was mainly contributed by micropores and mesopores, with an average contribution of 64.63% and 29.22%, respectively, whereas the contribution of micropores was only 6.15%. (4) The TOC content mainly controlled the pore volume and specific surface area of micropores and mesopores, while the clay and feldspar content generally controlled the pore volume and specific surface area of macropores. Additionally, the quartz content had an inhibitory effect on the development of all pore types. These results will help researchers understand the laws of gas accumulation and migration.
1. Introduction
The U.S. shale gas revolution has accelerated the global wave of shale gas exploration and development [1,2,3]. Shale reservoirs have undergone complex structural and sedimentary evolution, developing large numbers of nano-scale pores. The nano-scale pore systems in shale reservoirs control shale gas transportation and aggregation. Thus, nano-scale pore structure characterization is of great significance for shale gas resource evaluation and development [4,5,6].
The pore structure of shale reservoirs refers to the type, size, morphology, pore size distribution (PSD), pore volume (PV), specific surface area (SSA), and connectivity of the pores [7,8,9,10,11,12]. The characterization techniques used for shale pore structures are mainly divided into three categories: image methods, fluid injection methods, and X-ray methods. The image method mainly involves various types of scanning electron microscopy (such as FE-SEM, BIB-SEM, and FIB-SEM) and nano–micro CT, with the advantages of high resolution and the direct observation of pore morphology [13,14,15,16,17,18]. The fluid injection method includes low-temperature gas adsorption (mainly CO2 and N2), pressure-controlled porosimetry, and constant-rate-controlled porosimetry. The advantage of this method is its ability to characterize the pore structures of interconnected pores [13,19,20]. The X-ray method mainly includes small angle neutron scattering (SANS) and ultra-small angle neutron scattering (USANS), low field nuclear magnetic resonance (LF-NMR), and two-dimensional nuclear magnetic resonance (2D-NMR) [9,21,22,23,24,25,26,27,28].
It is difficult to accurately characterize the micro heterogeneity characteristics of shale reservoirs using a single technology. Therefore, it is necessary to combine multiple technologies to achieve the precise description and comprehensive characterization of nano pore structures [10,29,30].
This article focuses on marine organic-rich shale samples from the Upper Ordovician Wufeng Formation (WF-F) and Lower Silurian Longmaxi Formation (LMX-F) in the southern Zigong area of the Sichuan Basin. A systematic analysis of twelve samples was conducted, including XRD, TOC, low-temperature gas adsorption (CO2 + N2), and mercury intrusion porosimetry (MIP) experiments. Multiple experimental methods were combined to achieve full-scale pore size characterization of the pore structure. These analyses clarified the contributions of different types of pores to PV and SSA, enabling us to discuss the coupling relationship between organic matter (OM), mineral content, and PV/SSA, thereby deepening our understanding of shale gas enrichment mechanisms and providing scientific guidance for promoting the efficient development of shale gas.
2. Geological Setting
Located in the upper Yangtze platform, the Sichuan Basin is a gas-rich basin in southwest China with an area of about 26 × 104 km2 (Figure 1) [6,31]. In the process of tectonic evolution and formation in the Sichuan Basin, the area has undergone several tectonic stages, including the Hercynian, Caledonian, Himalayan, Yanshanian, and Indosinian movements. Two global marine transgressions occurred during the period in which the deposition of marine shales occurred in the northeast, east, and southeast Sichuan Basin areas under a relatively low-energy setting and anoxic environment. Under the action of global transverse and tectonic movements, during the Late Ordovician to Early Silurian periods, thick layers of organic-rich marine shale were deposited in the Wufeng and Longmaxi Formations in Sichuan Basin, with a thickness up to 500 m. This type of OM is generally type I or II1, and the thermal evolution of kerogen is in a mature stage [32,33,34].
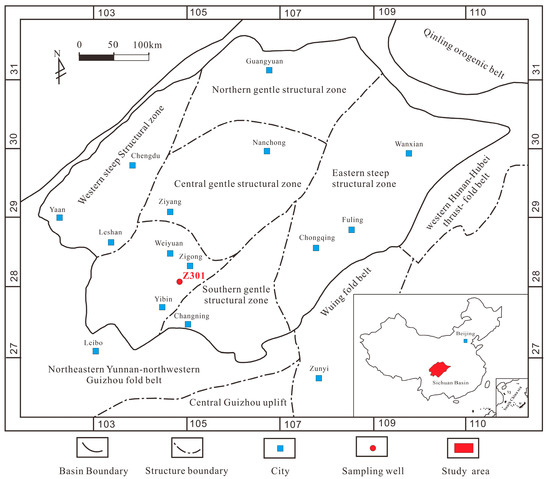
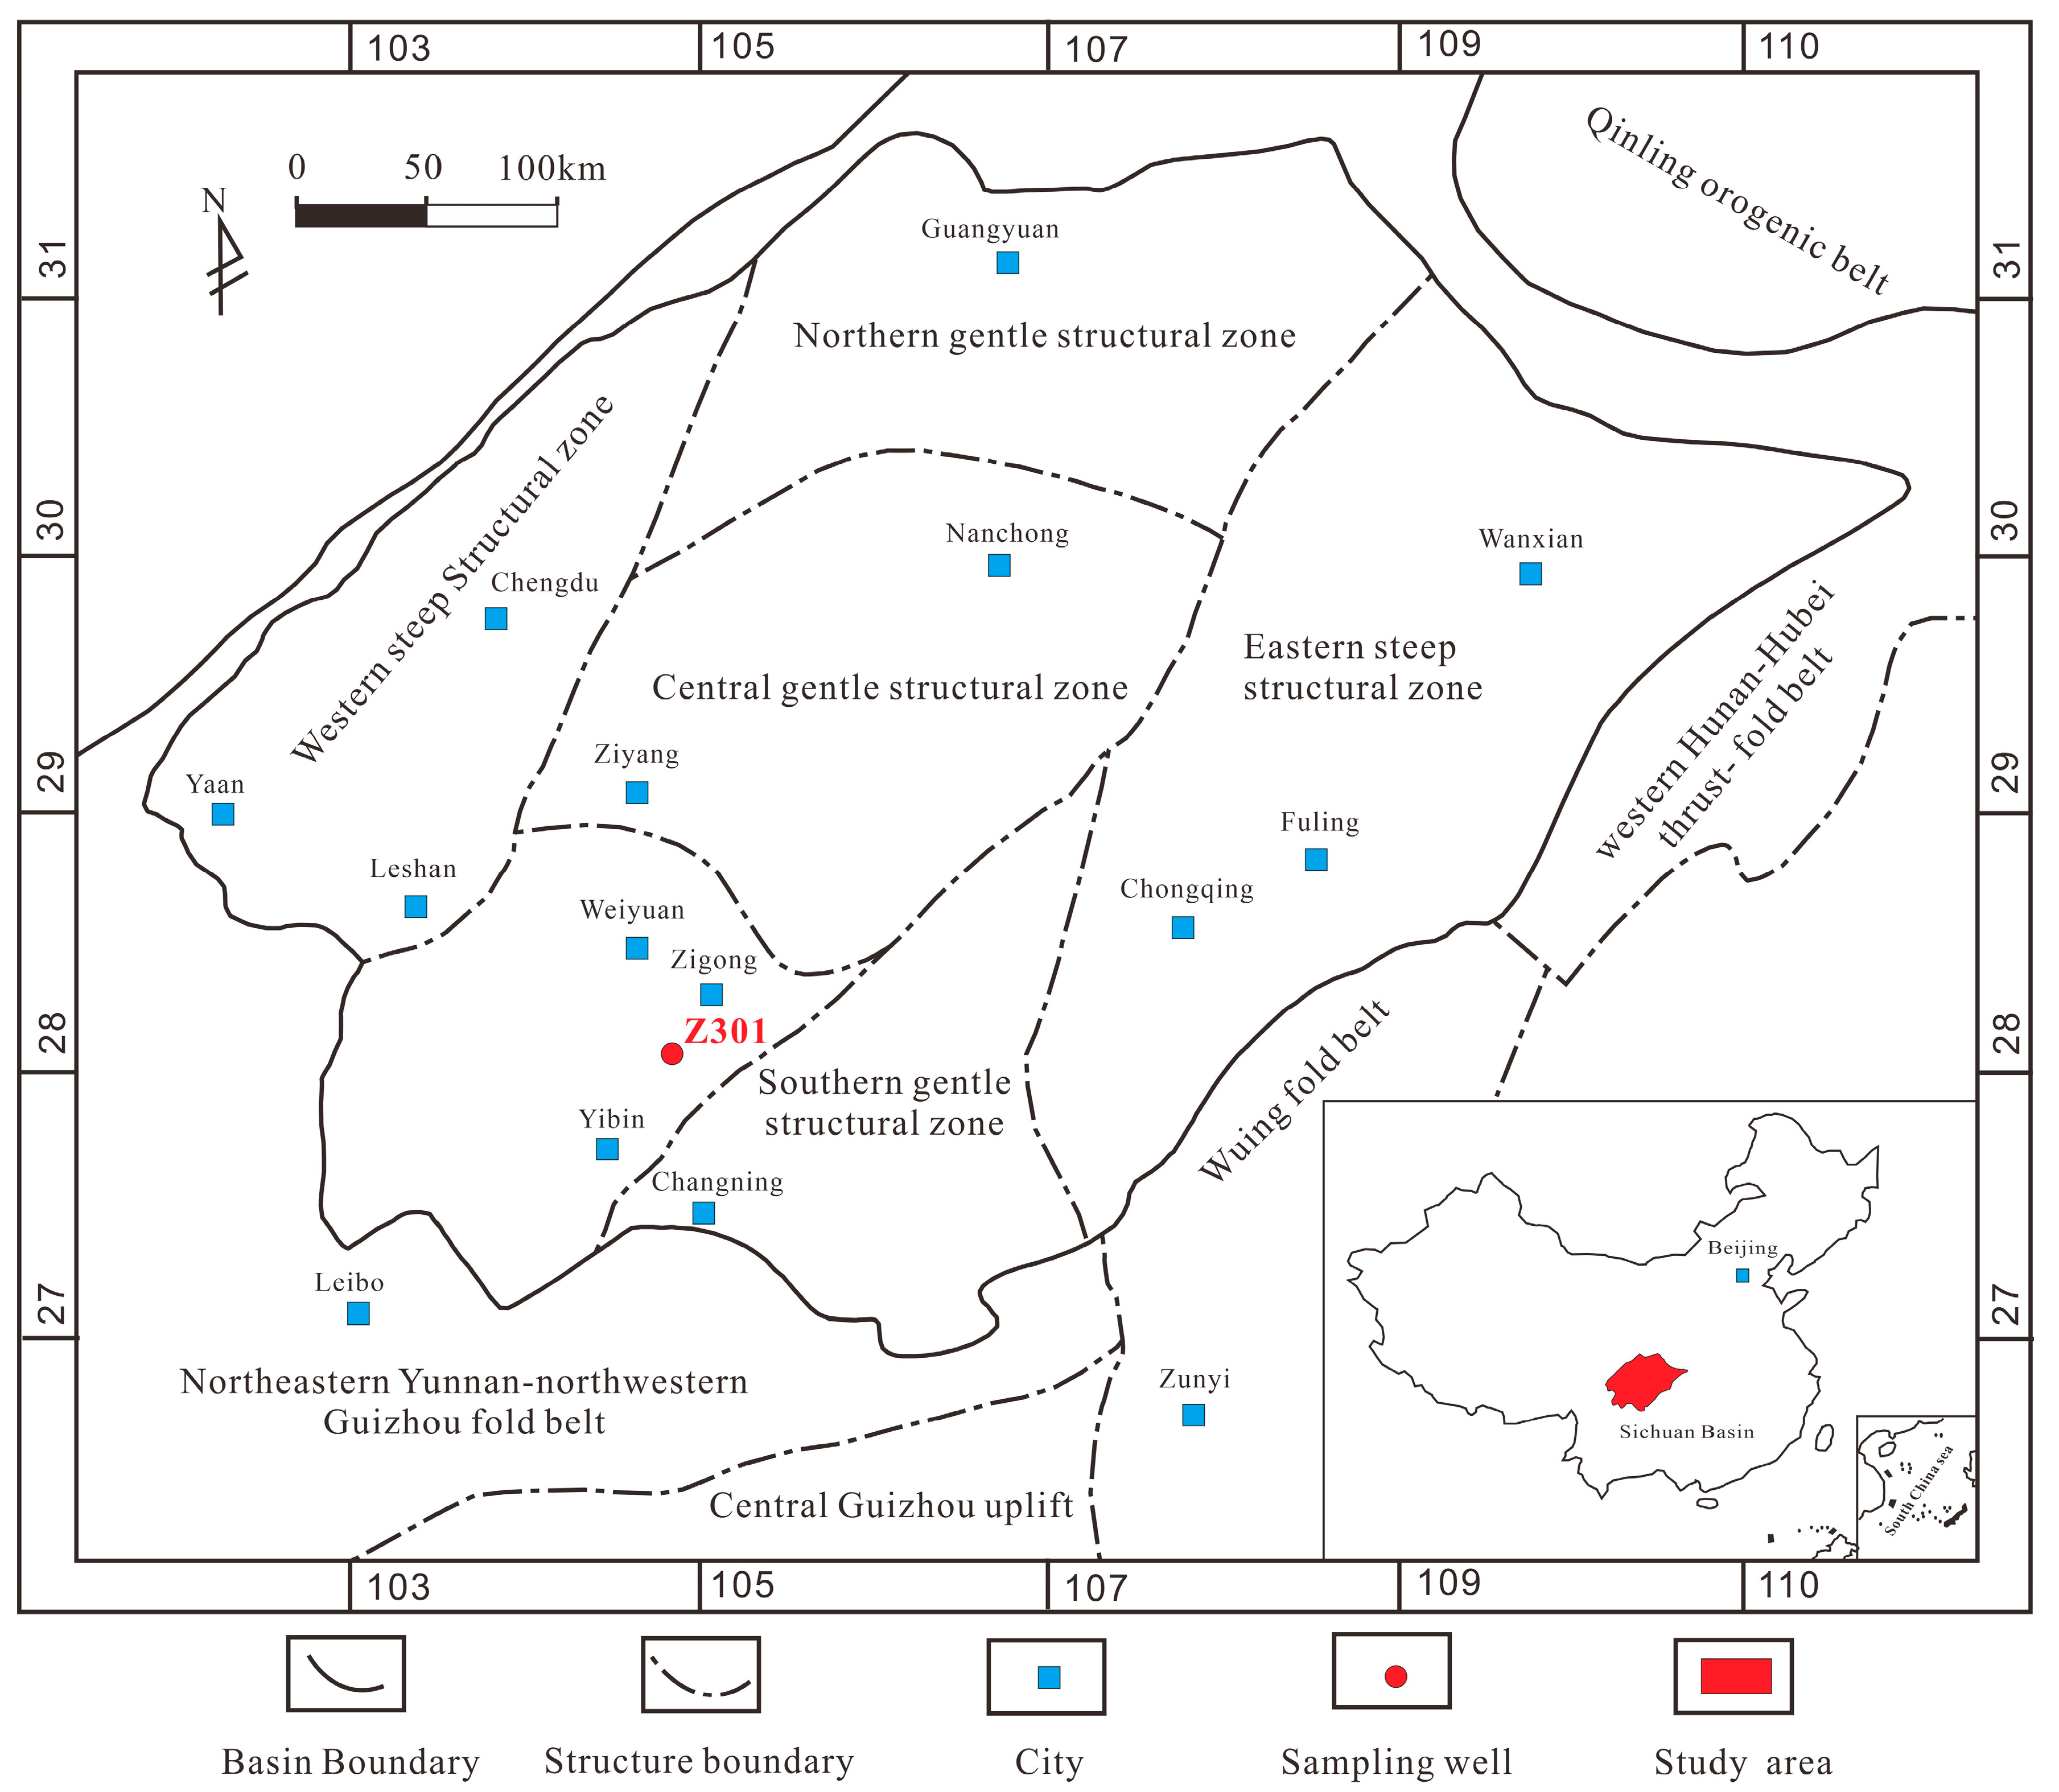
Figure 1.
Location of the study area in the Sichuan Basin, China.
As shown in Figure 1, the Zigong block is structurally located in southwest Sichuan, adjacent to the Weiyuan gas field in the north and the Changning gas field in the south. Organic-rich marine shales in the Wufeng and Longmaxi Formation constitute the main shale gas reservoirs with a thickness of 80–150 m in the study area. The Wufeng Formation, deposited in a deep-water environment, consists mainly of black, fine, and thick carbonaceous shale, carbonaceous mudstone, argillaceous siltstone, and siliceous shale [35]. The Longmaxi Formation can be subdivided into three members based on lithologies from bottom to top. The lower member is a set of dark grey to black carbonaceous shales with abundant graptolite fossils deposited in a deep-water environment. The middle and upper members were deposited in sloped and shallow-water shelf settings, respectively. The middle member comprises dark and grey argillaceous siltstones, while the upper member is dominated by dark-grey mudstone and grey shales.
3. Samples and Methods
3.1. Samples
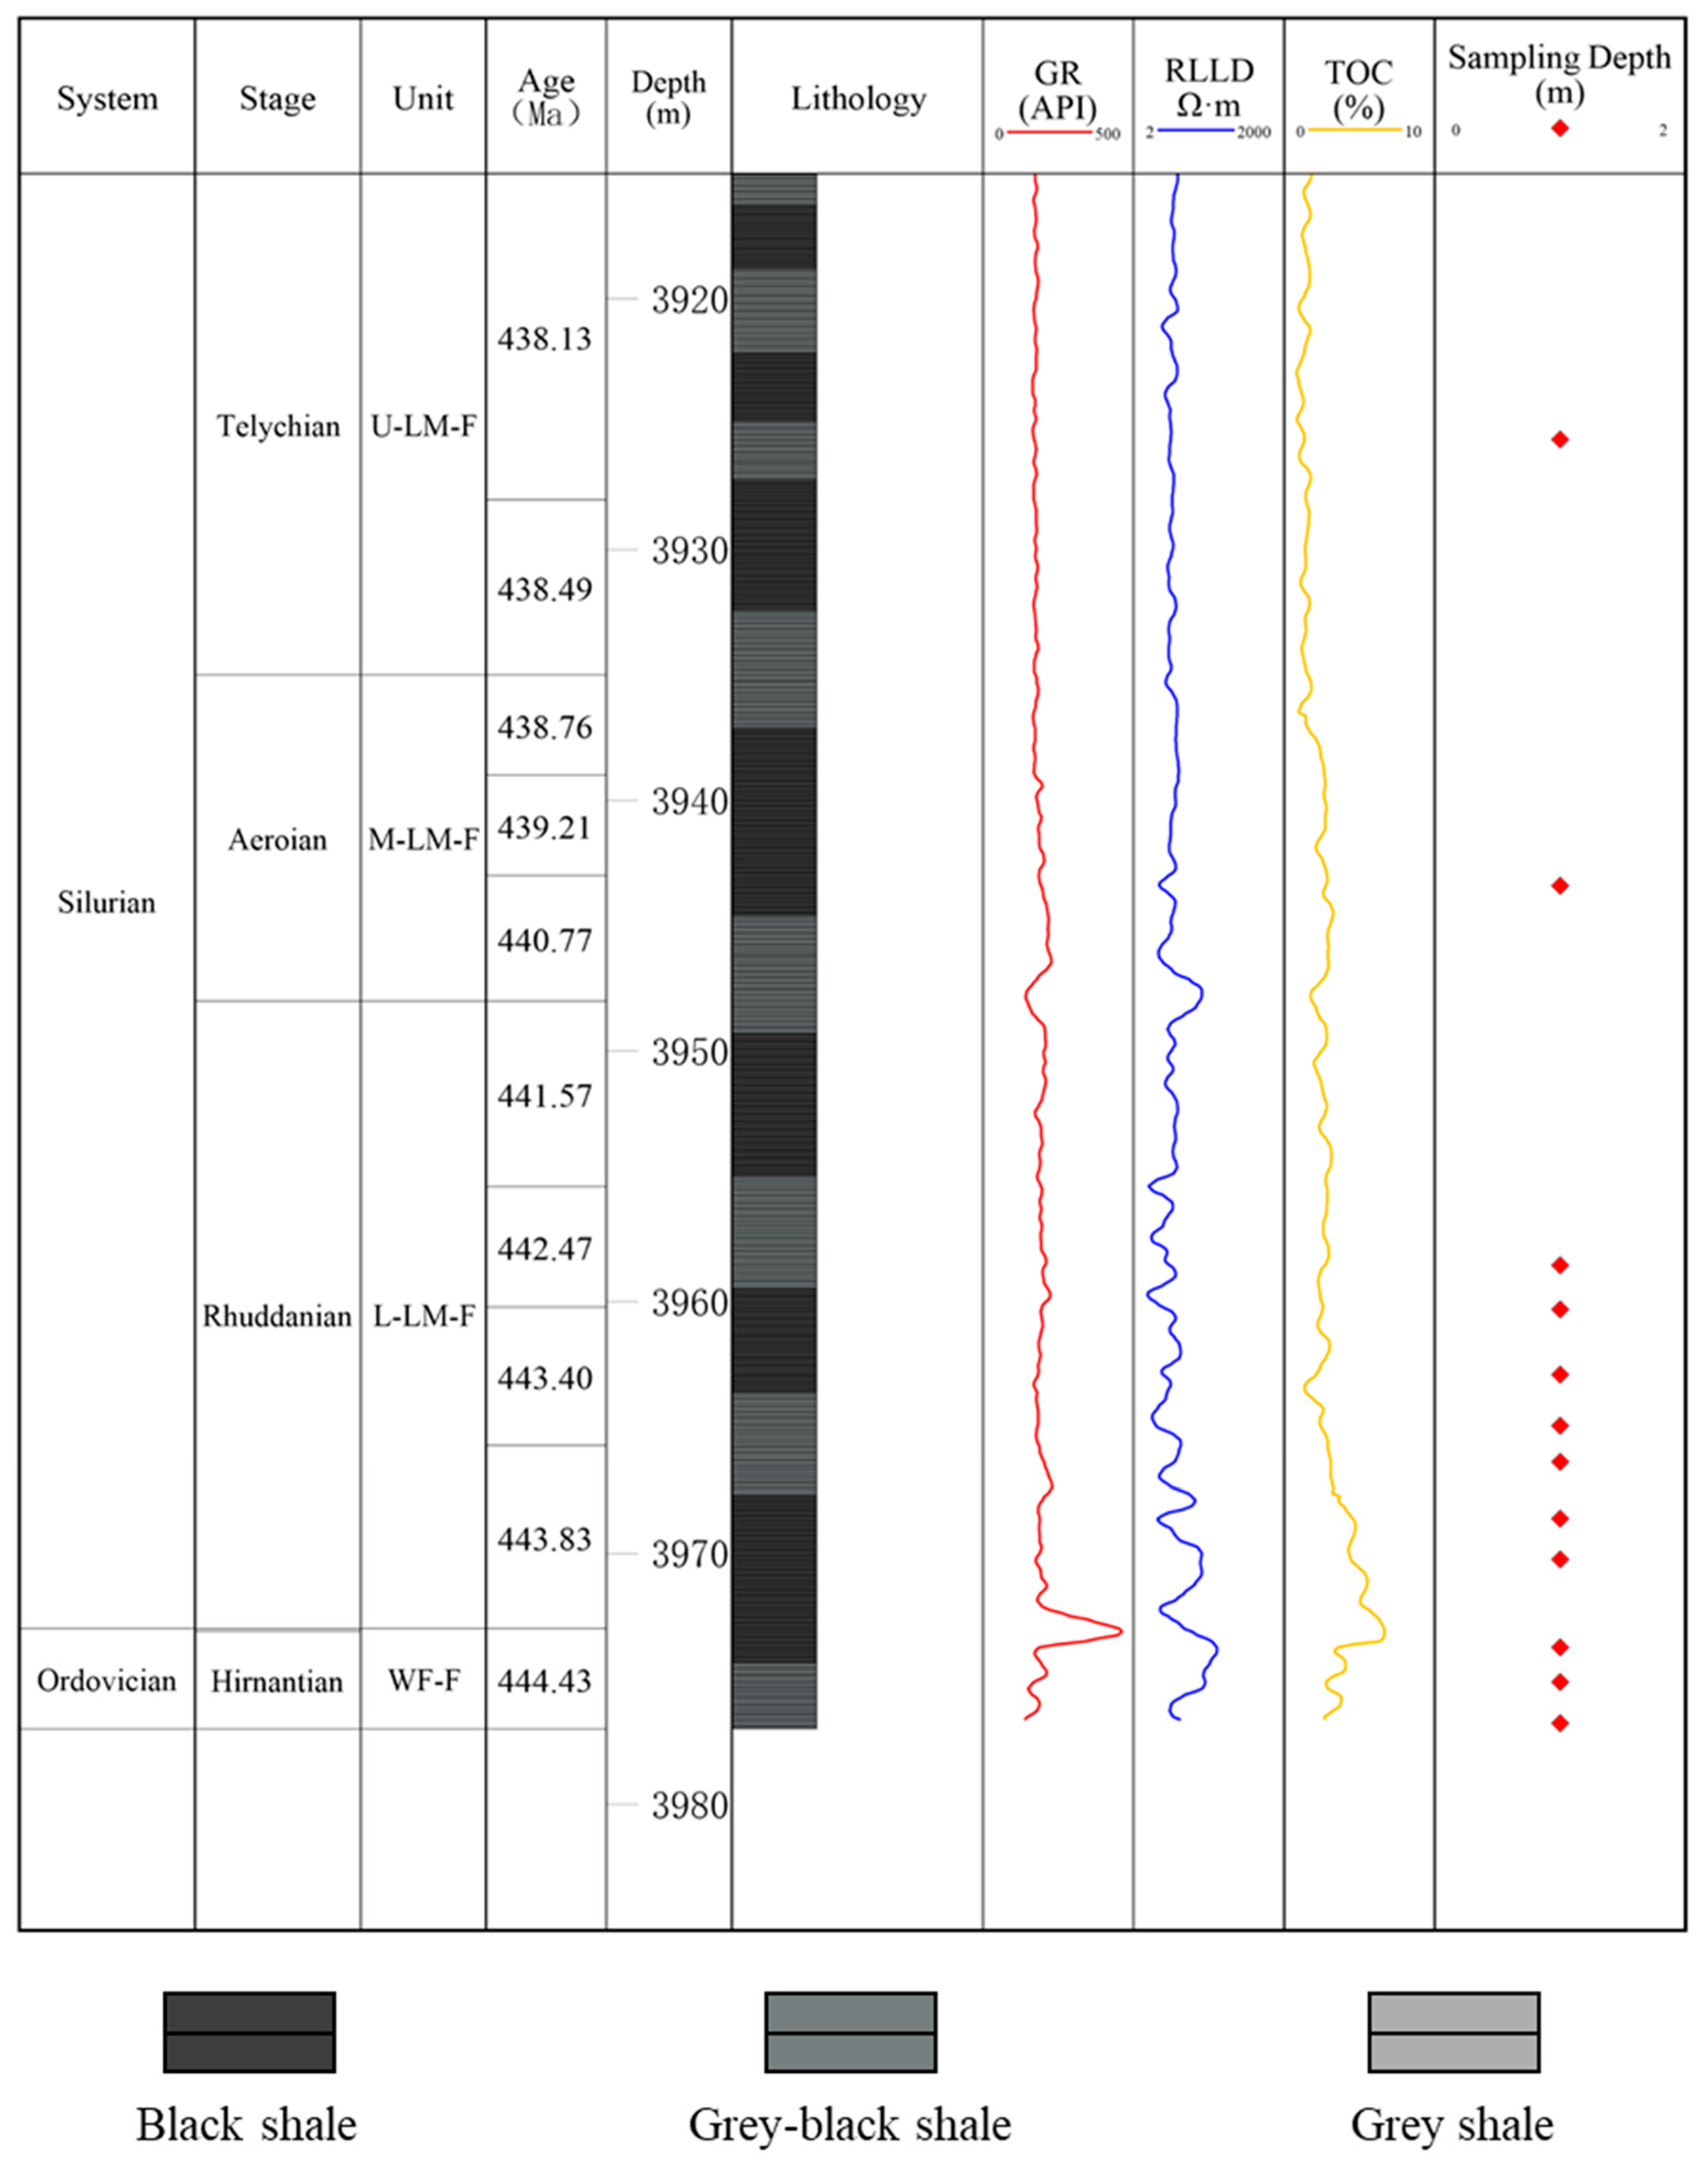
As depicted in Figure 1, the sample well, named D301, was strategically positioned in the Zigong area, southwest Sichuan Basin. This pivotal evaluation well, drilled in 2022, yielded twelve marine shale core samples, with three from the Wufeng Formation and nine from Longmaxi Formation, at sampling depths of 3925.59–3976.76 m (Figure 2). The samples from the Wufeng Formation were generally grey and grey–black shales, while samples from the Wufeng Formation were mainly black and grey–black shales.
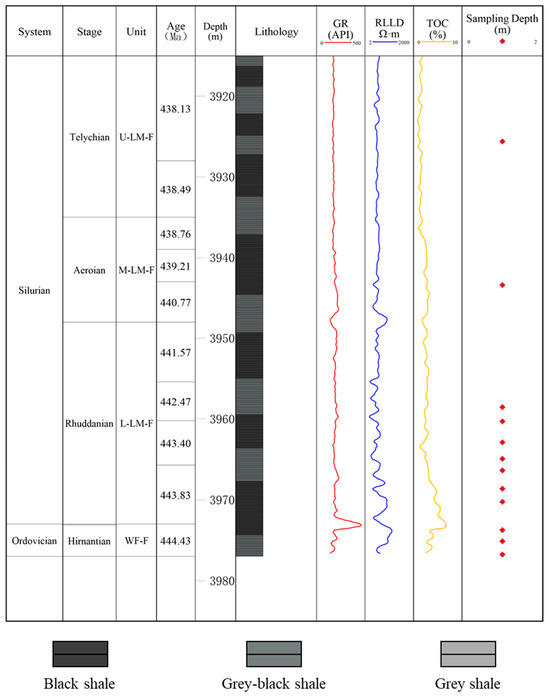
Figure 2.
Sampling depth, stratigraphy, lithology, and variations in GR, RLLD, and TOC contents in Well Z301; ages were obtained from [36]; WF-F refers to the Wufeng Formation; U-LM-F refers to the Upper Longmaxi Formation; M-LM-F refers to the Middle Longmaxi Formation; L-LM-F refers to the Lower Longmaxi Formation. (GR: natural gamma ray; RLLD: deep lateral resistivity).
A series of experiments was conducted, including Rock-Eval pyrolysis, total organic carbon (TOC) analysis, X-ray diffraction (XRD), low-temperature CO2 adsorption analysis (LTCA), low-temperature N2 adsorption analysis (LTNA), and mercury intrusion porosimetry (MIP).
3.2. TOC
All twelve shale samples were cleaned and then powdered to 80-mesh particles using an agate mortar and pestle before TOC analysis. According to the China national standard GB/T 19145–2003 [37], a CS-230 carbon–sulfur analyzer was used to measure the TOC content. TOC content analyses were carried out in the Key Laboratory of Continental Shale Hydrocarbon Accumulation and Efficient Development, Northeast Petroleum University.
3.3. XRD
A D8 DISCOVER X-ray diffractometer was used to calculate the mineralogical compositions using Cu Kα radiation (λ = 0.15418 nm) under a working voltage of 30 kV–45 kV and an operating current of 20 mA–100 mA. The slit was 1 mm, and the scanning speed was 4/min, following the Petro-China Standard SY/T 5163-2018 [37]. This experiment was performed at the Core Laboratory of iRock Technologies, Suzhou, Jiangsu, China.
3.4. LTCA and LTNA
LTCA and LTNA experiments were performed using an ASAP 2460 surface area analyzer, following the China National Standard GB.T 19587-2004 [38]. All shale samples were powdered to 60–80 mesh prior to the experiment. Then, the samples were degassed in a vacuum oven heated to 110 °C for about 16 h to remove adsorbed matter and gas. Nitrogen adsorption/desorption isotherms were obtained under a temperature of 77.3 K (−196 °C). During this process, the relative pressures (P/P0) ranged from 0.01 to 1. CO2 adsorption isotherm measurements were conducted at 273 K within a relative pressure range of 0.0004–0.029. The density functional theory (DFT) method was applied to characterize the PV, SSA, and PSD of the micropores.
3.5. MIP
Mercury intrusion porosimetry (MIP) experiments were performed using an AutoPore IV 9505 following the China National Standard GB/T21650.1–2008 [38]. The cumulative intruded mercury volumes were recorded under certain pressures with stepwise increases in pressure to approximately 200 MPa. The pressure was converted into an equivalent pore radius using the Washburn Equation. In this way, incremental intruded mercury volumes under different pressures, i.e., the pore volumes connected by pore throats of different sizes, were obtained.
4. Results
4.1. TOC
As shown in Table 1, twelve marine shale samples from the Zigong area were rich in OM, with the TOC content ranging from 1.72% to 6.75% (averaging 3.86%). Additionally, more than 90% of the samples had a TOC content greater than 2%. Marine shale samples in LMX-F were richer in TOC than those in WF-F; the average TOC content of the two formations was 4.35% and 3.70%, respectively.

Table 1.
TOC and mineral composition of Wufeng–Longmaxi shale.
4.2. Mineral Composition
The XRD quantitative results of marine shale samples are presented in Table 1, which shows that the mineral composition of the twelve Wufeng–Longmaxi shale samples from the Zigong area mainly contained quartz (29.2% to 66.7%, averaging 44.1%) and clay minerals (10.4 to 46.5%, averaging 31.4%), followed by dolomite (2.0% to 25.6%, averaging 10.9%), calcite (0.5% to 11.3%, averaging 5.3%), feldspar (2.4% to 8.0%, averaging 5.1%), and pyrite (1.2% to 7.5%, averaging 3.3%). Comparative analysis shows that shale samples from the WF-F were more abundant in quartz and calcite, while clay minerals were relatively deficient. A mixed layer of illite–smectite (averaging 66.4%) was the main component of the clay minerals, followed by illite (averaging 24.7%) and chlorite (averaging 8.9%).
4.3. Micropore Characterization with LTCA
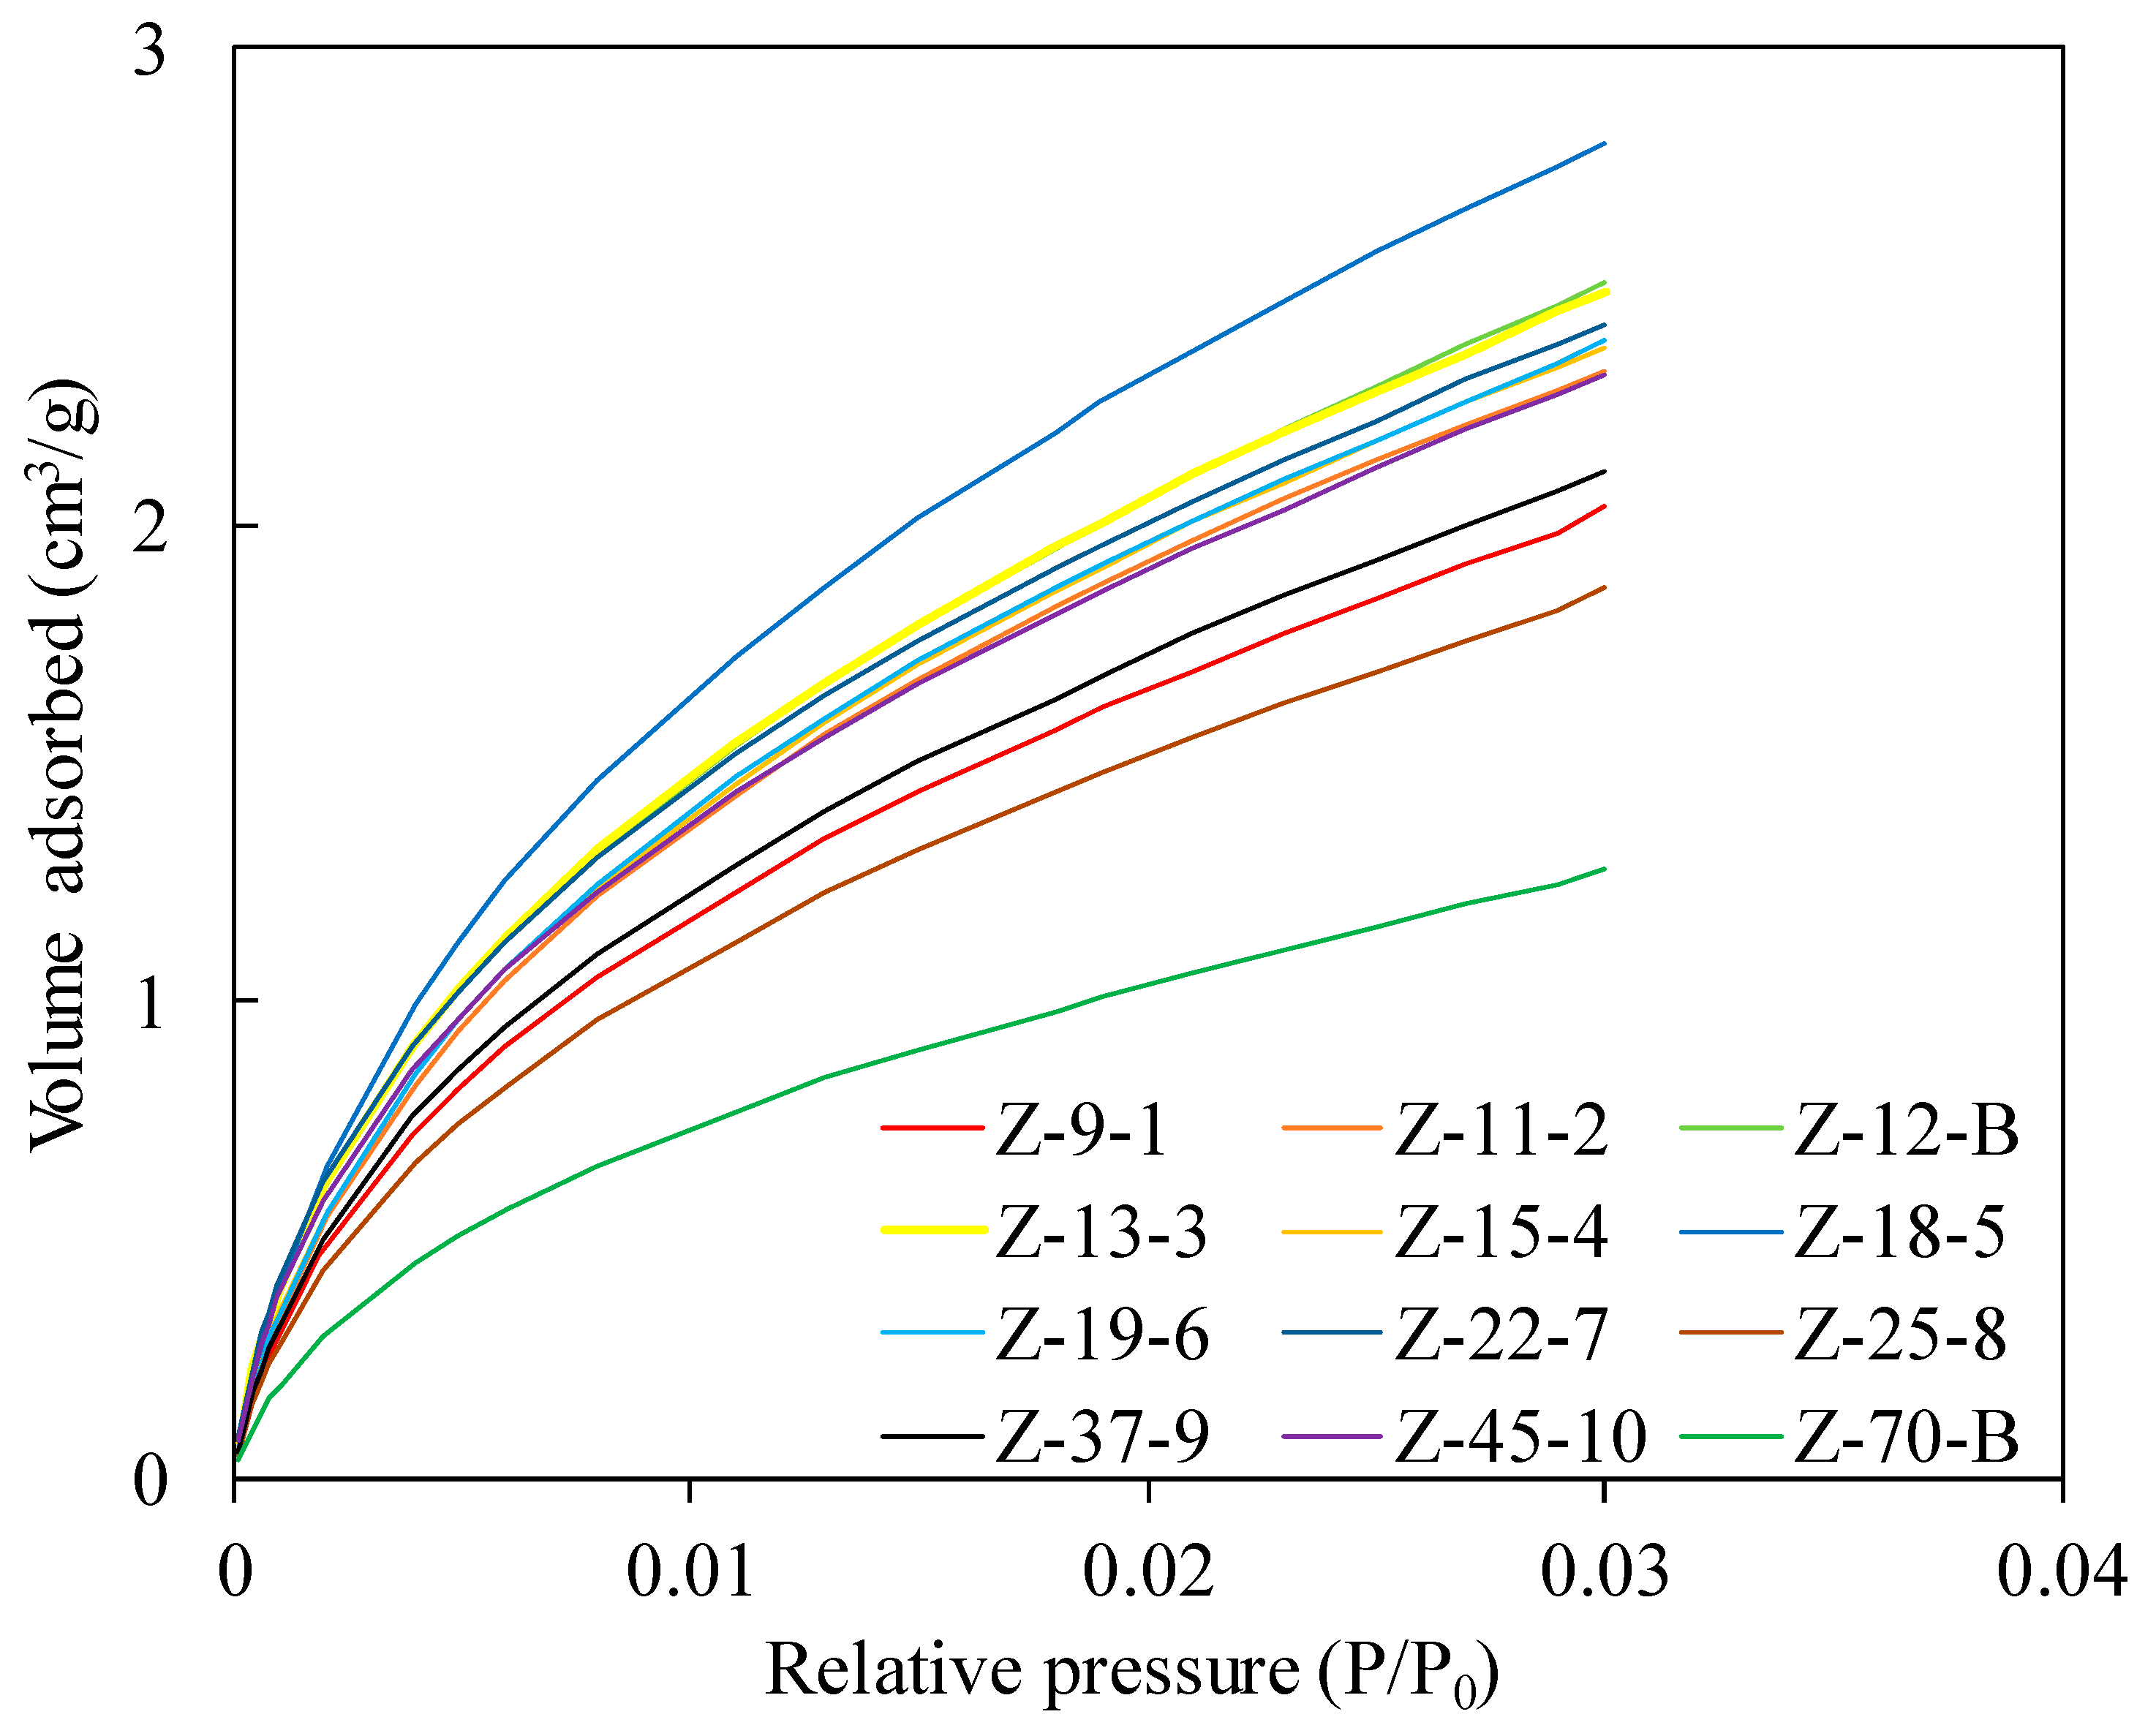
Low-temperature CO2 adsorption experiments (LTCAs) are commonly used to characterize micropore (<2 nm) structures [19,39]. As shown in Figure 3, CO2 adsorption isotherms of the twelve marine shale samples from the Wufeng–Longmaxi Formation in the Zigong area are similar to those of the type I adsorption isotherm [40]. The maximum adsorption volumes ranged from 1.28 cm3/g to 2.80 cm3/g (averaging 2.24 cm3/g), which indicates a clear increase as TOC increases. For example, sample Z-70-B had the lowest adsorption volume and TOC content (1.28 cm3/g, 1.75%, respectively), while sample Z-18-5 had the highest adsorption volume and TOC content (2.80 cm3/g, 6.79%, respectively). The pore volume of the micropores (Micro PV) ranged from 0.0016 to 0.0035 cm3/g (averaging 0.0028 cm3/g), and the specific surface area of the micropores (Micro SSA) ranged from 5.17 to 11.85 m2/g (averaging 9.20 m2/g).
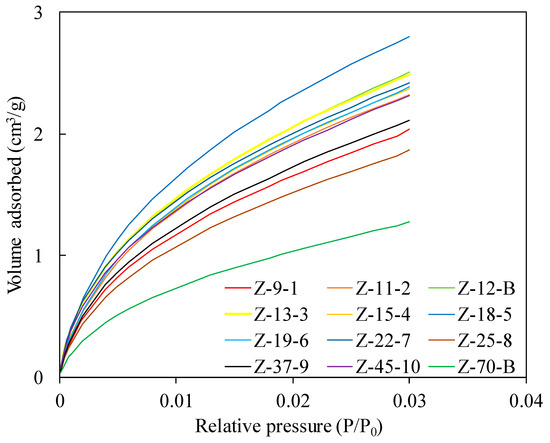
Figure 3.
CO2 adsorption isotherms of the Wufeng–Longmaxi shales in the Zigong area.
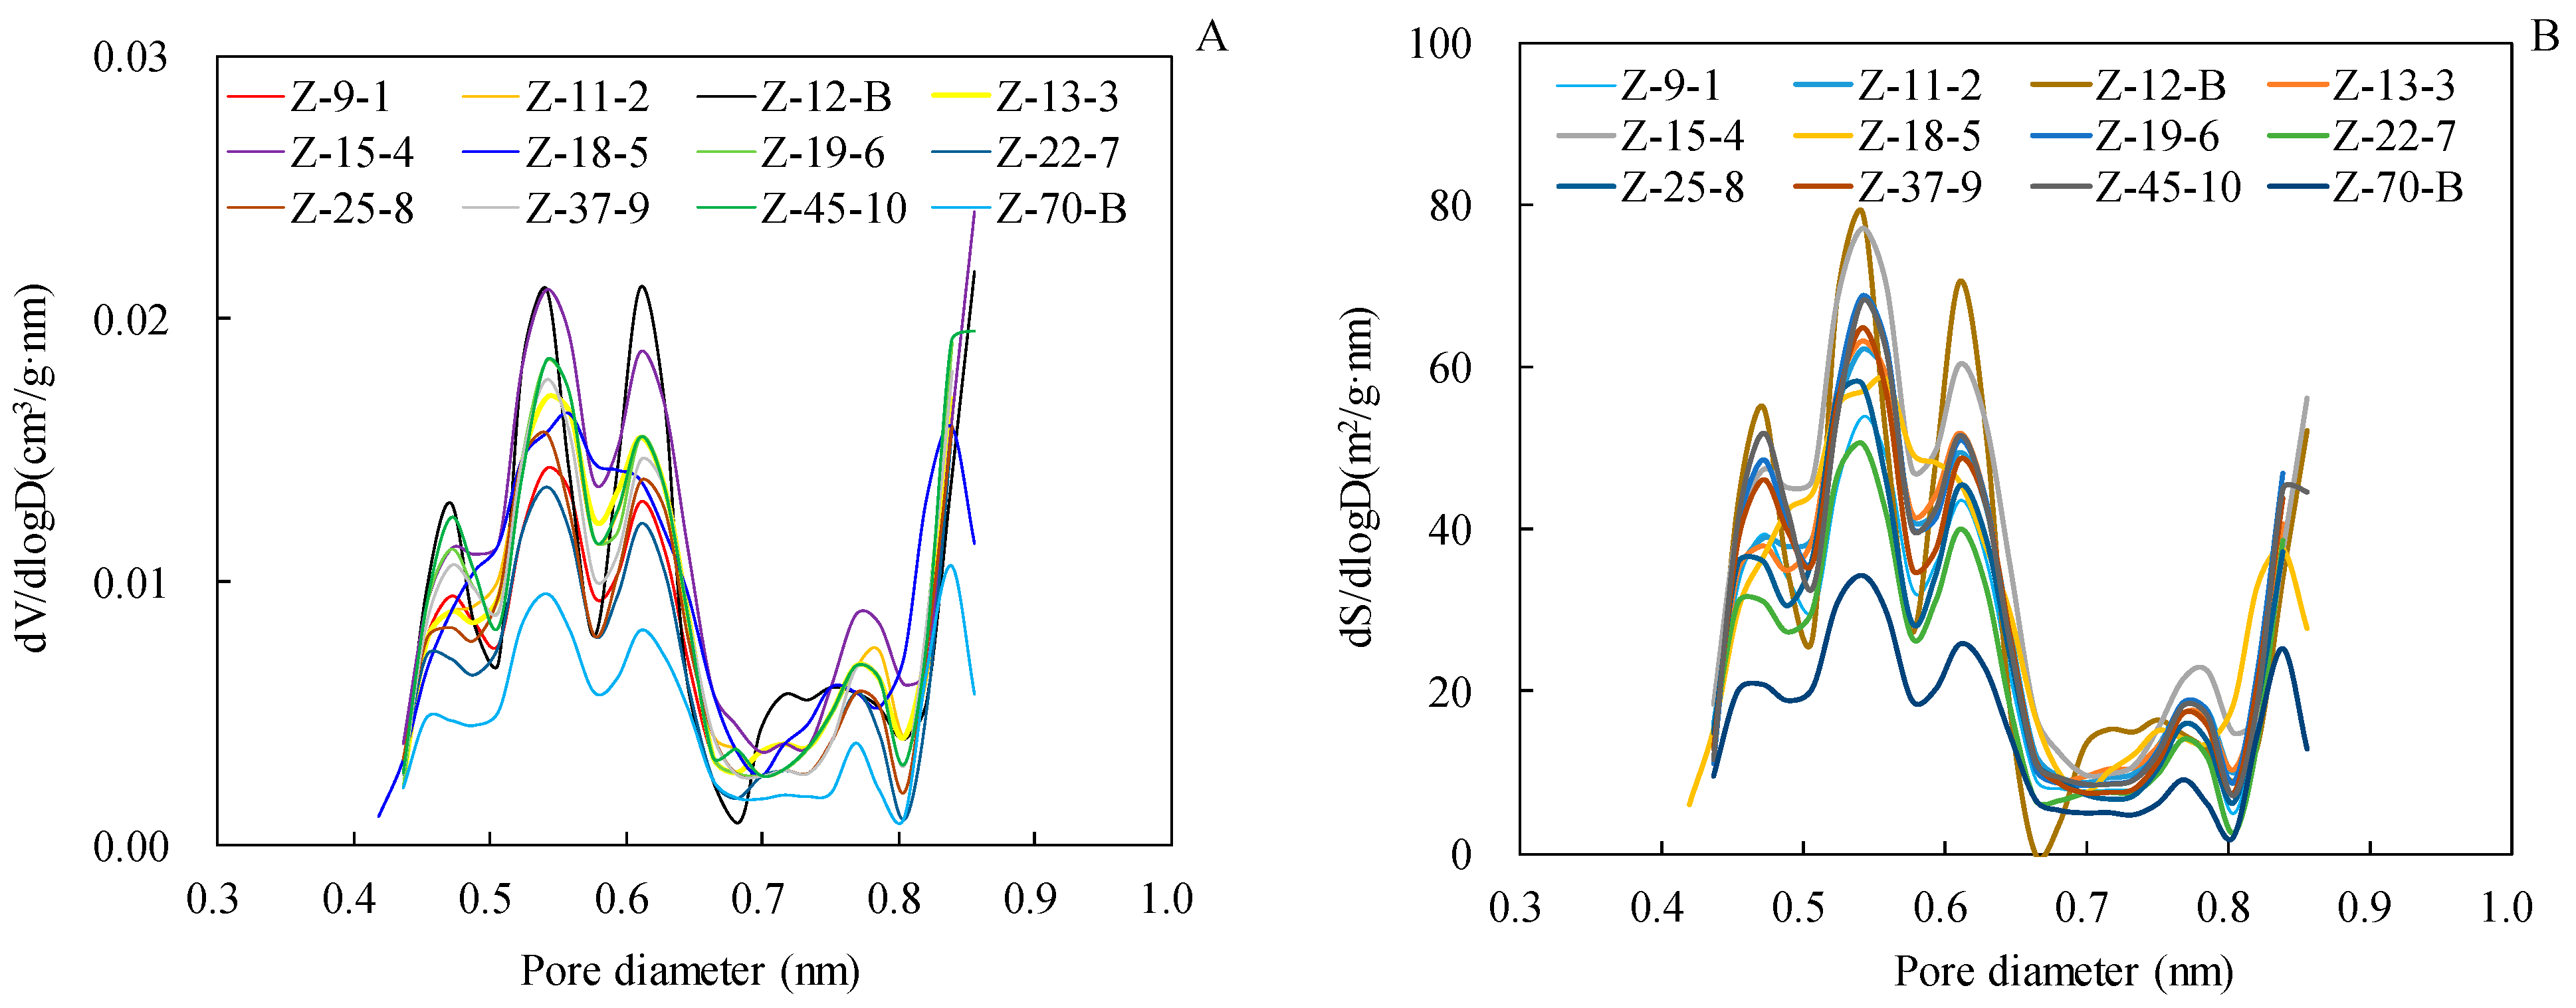
The PSD curves in this study were obtained via the DFT model. As shown in Figure 4A,B, both the PV and SSA of micropores were contributed by pores smaller than 0.9 nm (mainly 0.4 to 0.7 nm).
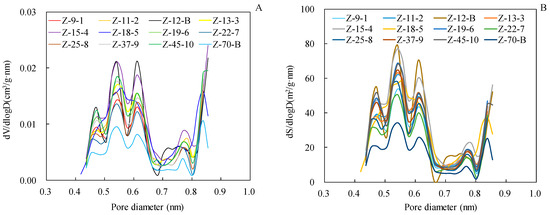
Figure 4.
PSD curves derived from the low-temperature CO2 adsorption experiment: (A) for PV; (B) for SSA.
4.4. Mesopore Characterization with LTNA
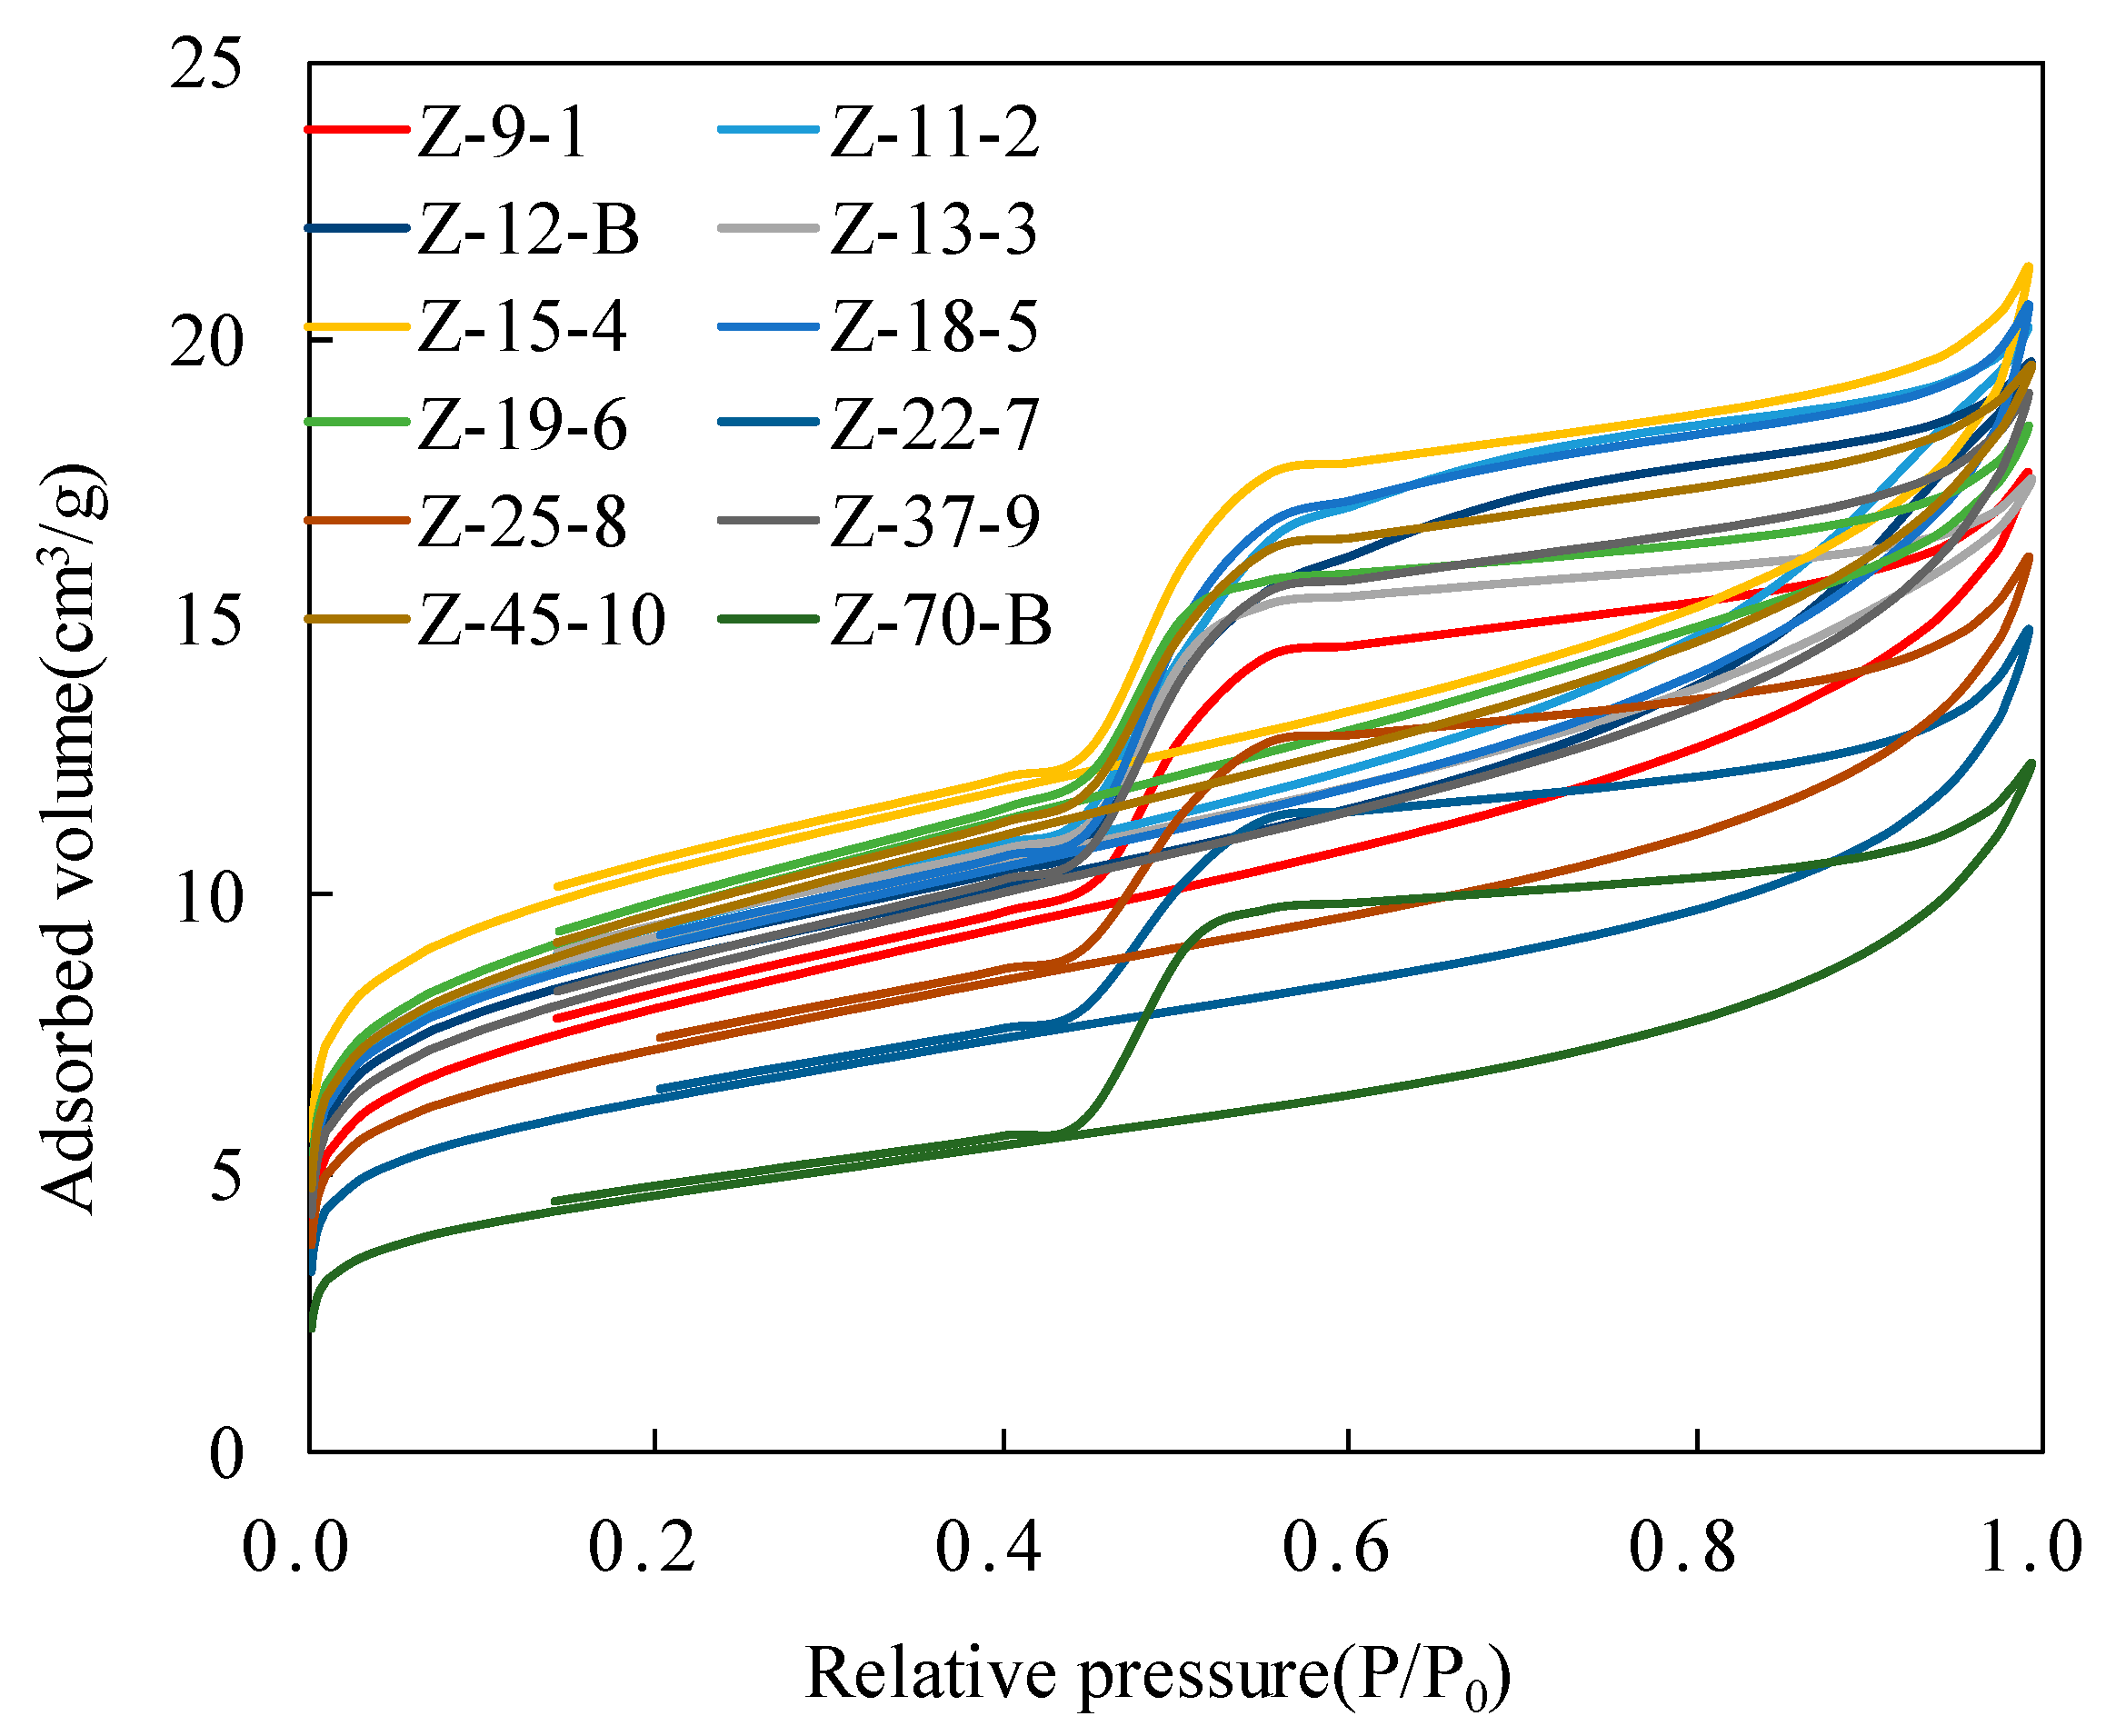
Low-temperature N2 adsorption experiments (LTNAs) are commonly used to characterize mesopore (2 nm–50 nm) structures [13]. As shown in Figure 5, the low-temperature N2 adsorption and desorption isotherms exhibit an inverse “S” shape, which is consistent with a typical International Union of Pure and Applied Chemistry (IUPAC) type IV(a) isotherm [41,42]. The adsorption and desorption isotherms separate at P/P0 = 0.45, forming a significant hysteresis loop due to capillary condensation in mesopore structures. According to IUPAC’s classification, the hysteresis loops of the twelve Wufeng–Longmaxi shale samples present the superposition characteristics of H2(a) and H3, indicating the presence of inkbottle-shaped pores with narrow necks and slit-shaped pores [42].
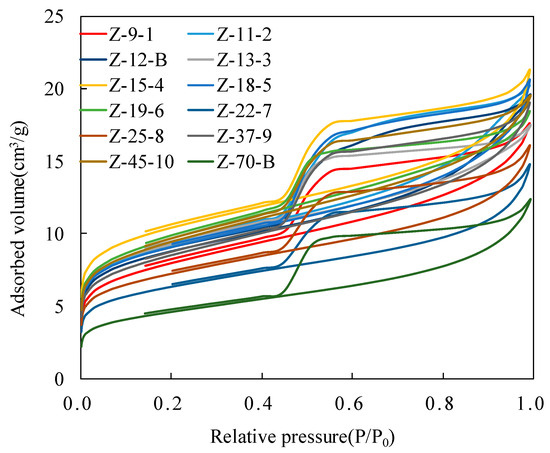
Figure 5.
N2 adsorption isotherms of Wufeng–Longmaxi shales in the Zigong area.
The Barrett–Joyner–Halend (BJH) model was selected to calculate PV, and the Brunauer–Emmett–Teller (BET) model was selected to calculate the SSA and average pore size (APD). The BJH PV ranged from 0.0177 cm3/g to 0.0316 cm3/g (averaging 0.0262 cm3/g), BET SSA ranged from 16.59 m2/g to 37.40 m2/g (averaging 30.09 m2/g), and BET APD ranged from 3.25 nm to 4.59 nm (averaging 3.77 nm). Here, the average BJH PV of the Zigong shale samples is less than that of the Jiaoshiba shale samples (the BJH PV averaged 0.0301 cm3/g), while the average SSA of the shale samples in the study area is higher (the BET SSA averaged 18.97 cm3/g) [43], possibly because the depths of the Jiaoshiba shales are much shallower than those in the Zigong area. Moreover, the effect of compaction is weak, better preserving the pores. Both the average BJH PV and average BET SSA of the Zigong shale samples in the study area are much higher than those of the Chang7 lacustrine shale (the BJH PV and BET SSA averaged 0.0079 cm3/g and 1.766 m2/g, respectively) from the southeastern Ordos Basin [44]. This phenomenon is mainly due to the higher maturity of the Zigong marine shale samples, which developed a large number of organic pores. The pore volume of the mesopore (Meso PV) ranged from 0.0077 to 0.00180 cm3/g (averaging 0.0120 cm3/g), and the specific surface area of the mesopore (Meso SSA) ranged from 2.64 to 5.63 m2/g (averaging 4.16 m2/g).
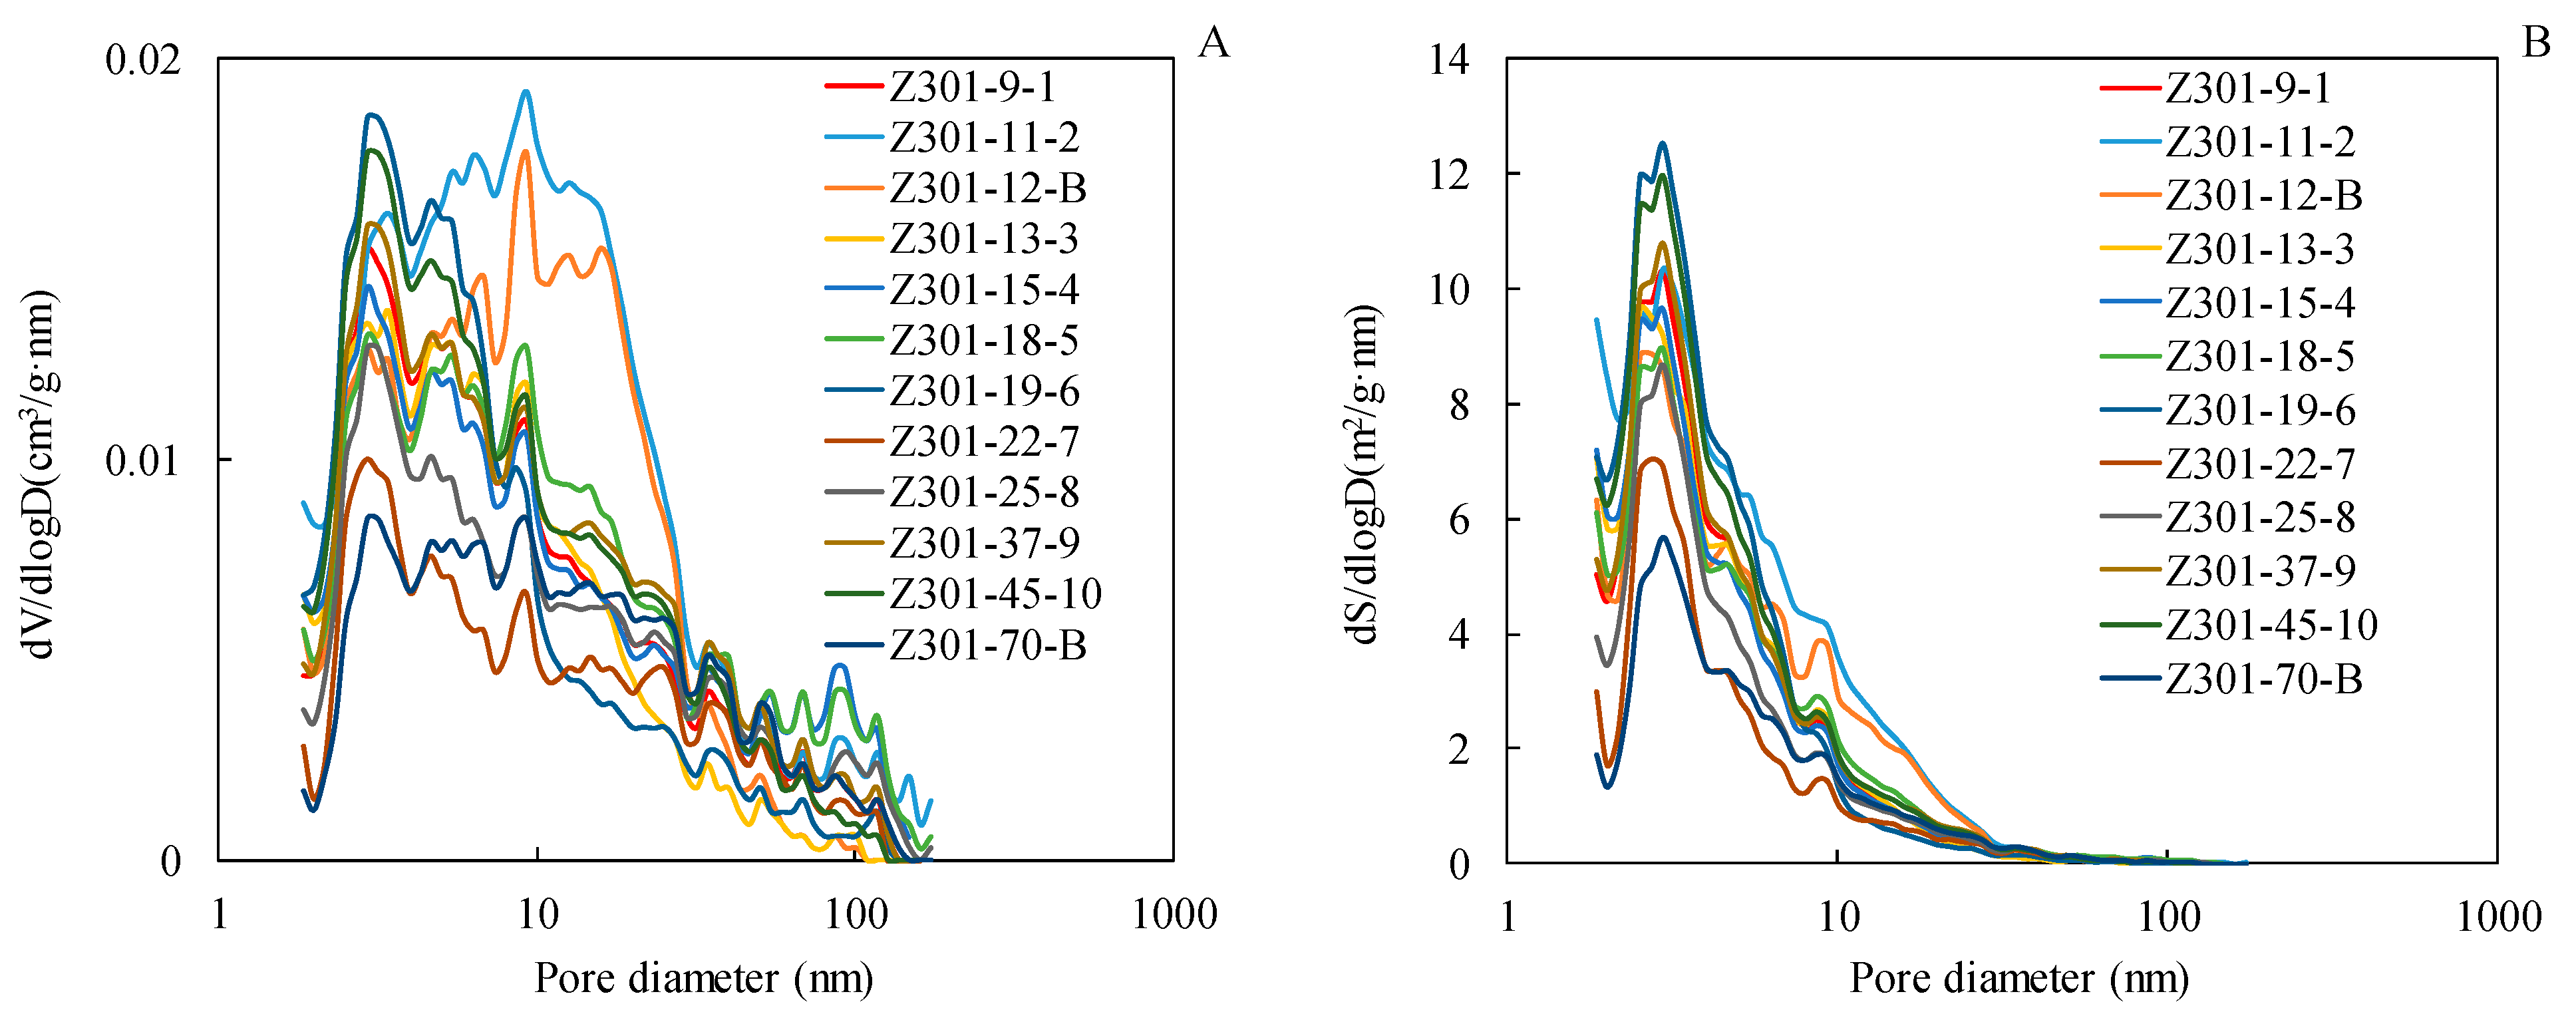
The PSD curves calculated via the BJH model are shown in Figure 6A,B. For the PSD curves of PV, all nine Longmaxi shale samples and one Wufeng shale sample (sample Z-9-1) show similar variations (Figure 6A), with dominant pore sizes of less than 20 nm. In addition, two Wufeng shale samples (sample Z-11-2 and sample Z-12-B) show similar variations, with dominant pore sizes of less than 30 nm. For the PSD curves of the SSA, all twelve Wufeng–Longmaxi shale samples show similar variations (Figure 6B), with dominant pore sizes of less than 10 nm.
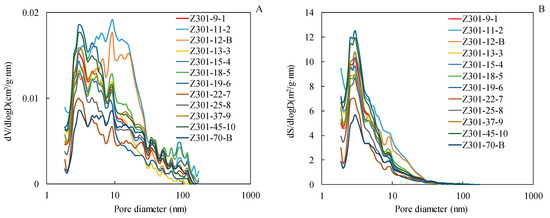
Figure 6.
PSD curves derived from the low-temperature N2 adsorption experiment: (A) for PV; (B) for SSA.
4.5. Macropore Characterization with MIP
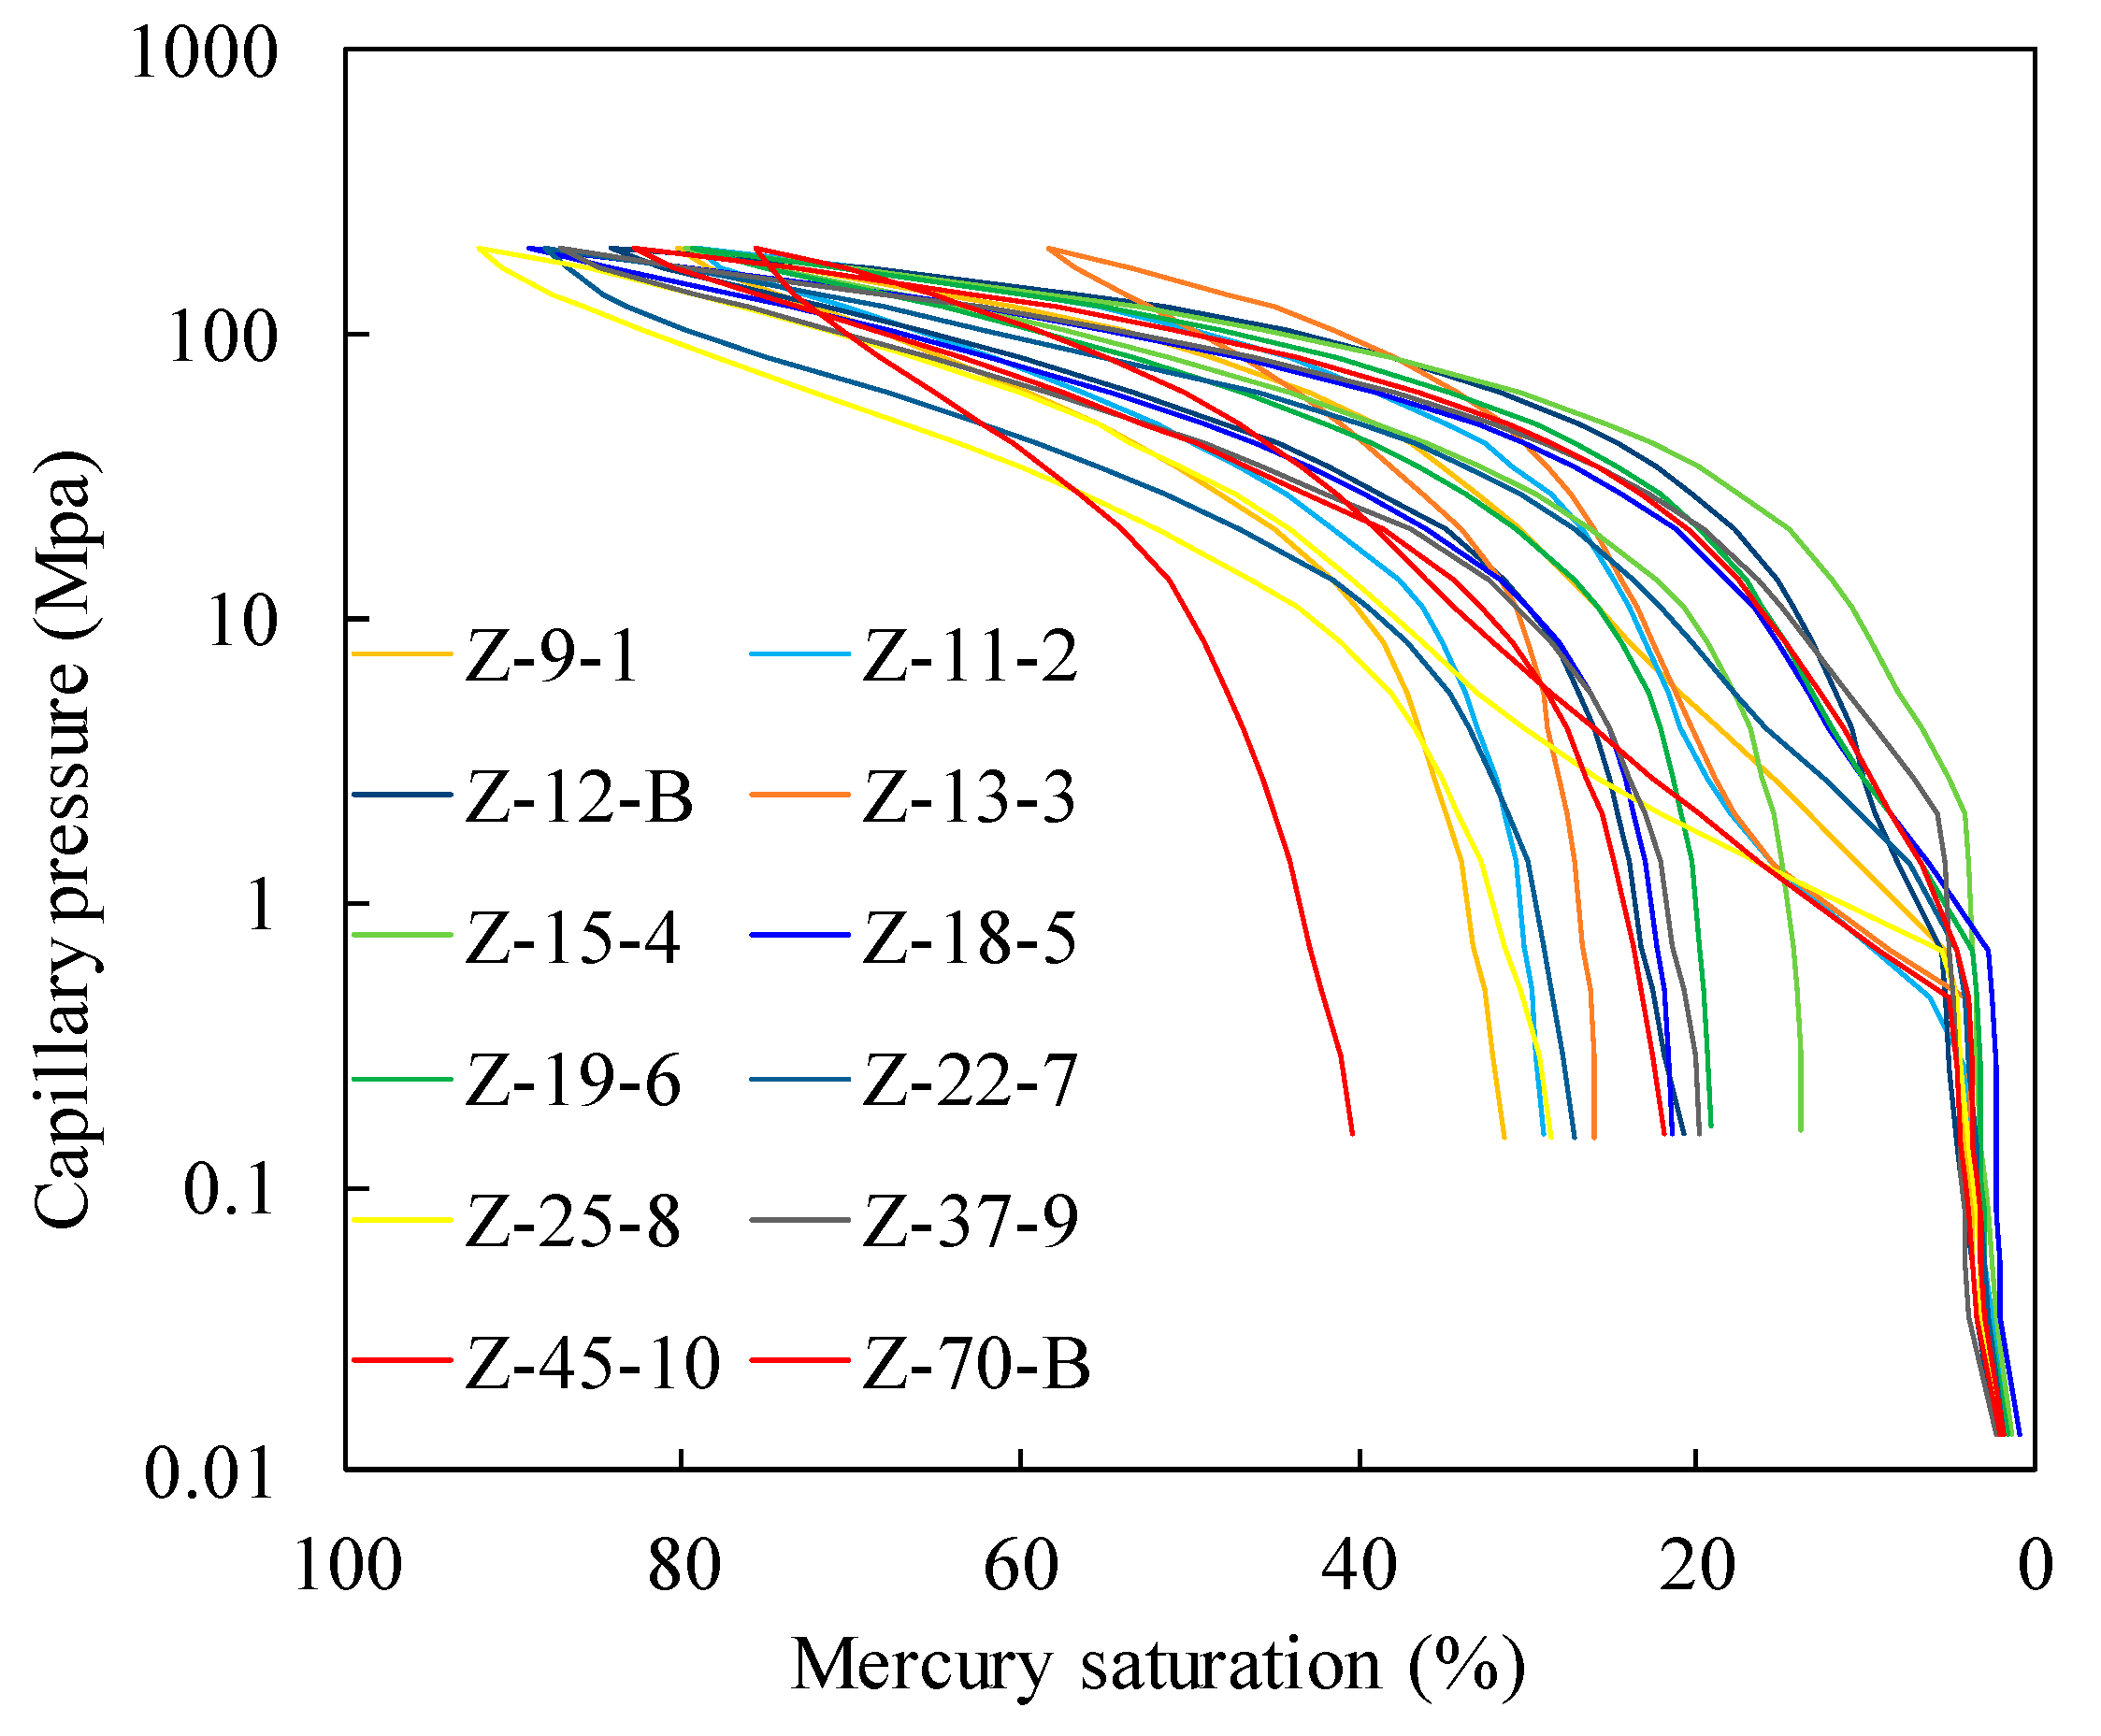
Mercury intrusion porosimetry experiments are commonly used to characterize macropore (>50 nm) structures [45,46]. As shown in Figure 7, as the injection pressure increased, mercury slowly entered the shale pore network system. When the injection pressure exceeded 7 MPa, the volume of mercury increased rapidly, indicating that the shale samples mainly developed pores smaller than 100 nm. There is a significant discrepancy here between the injection and withdrawal curves. With an average mercury removal efficiency of 70.29%, mercury did not completely exit after the experiment, indicating the development of inkbottle-shaped pores, which is consistent with the research results of the LTNA experiments [47]. The pore volume of the macropores (Macro PV) ranged from 0.0076 to 0.00190 cm3/g (averaging 0.0109 cm3/g), and the specific surface area of the macropores (Macro SSA) ranged from 0.57 to 1.42 m2/g (averaging 4.16 m2/g).
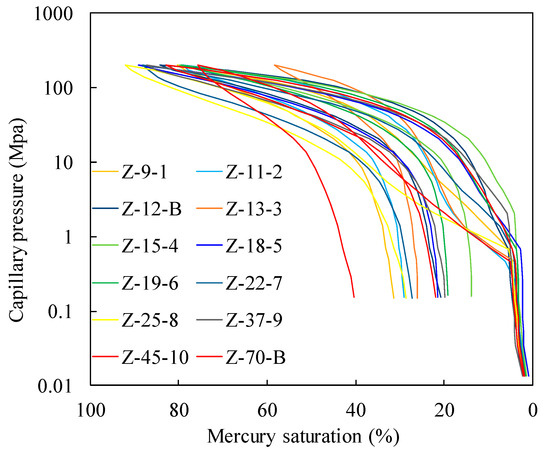
Figure 7.
Mercury injection curves for Wufeng–Longmaxi shales in the Zigong area.
The PSD curves obtained in the MIP experiment are shown in Figure 8. The PSD curves of PV exhibit bimodal distribution (Figure 8A), with the left peak being composed of mesopores and macropores, generally smaller than 100 nm, and the right peak being composed of microfractures, with pore sizes ranging from 1 to 3 um. The PSD curves of the SSA also exhibit bimodal distribution (Figure 8B). The SSA was mainly contributed by pores smaller than 30 nm.
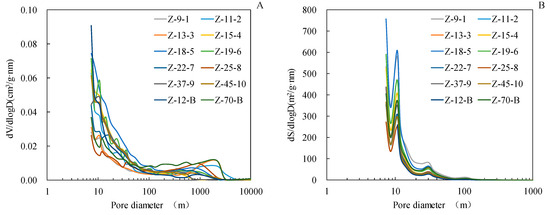
Figure 8.
PSD curves derived from the MIP experiment: (A) for PV; (B) for SSA.
5. Discussion
5.1. Full-Scale Pore Structure Characteristics
Full-scale PSD can provide significant information about pore structures, such as the range of pore sizes, dominant pore sizes, and composition of different types of pores (micro-, meso-, and macropores) in PV and SSA [10,29,30]. To fully characterize the pore structure, it is essential to combine multiple methods, as each pore structure characterization experiment is applicable only for a specific pore size range. Thus, an LTCA experiment was used to characterize the micropore structure, an LTNA experiment was used to characterize the mesopore structure, and an MIP experiment was used to characterize the macropore structure.
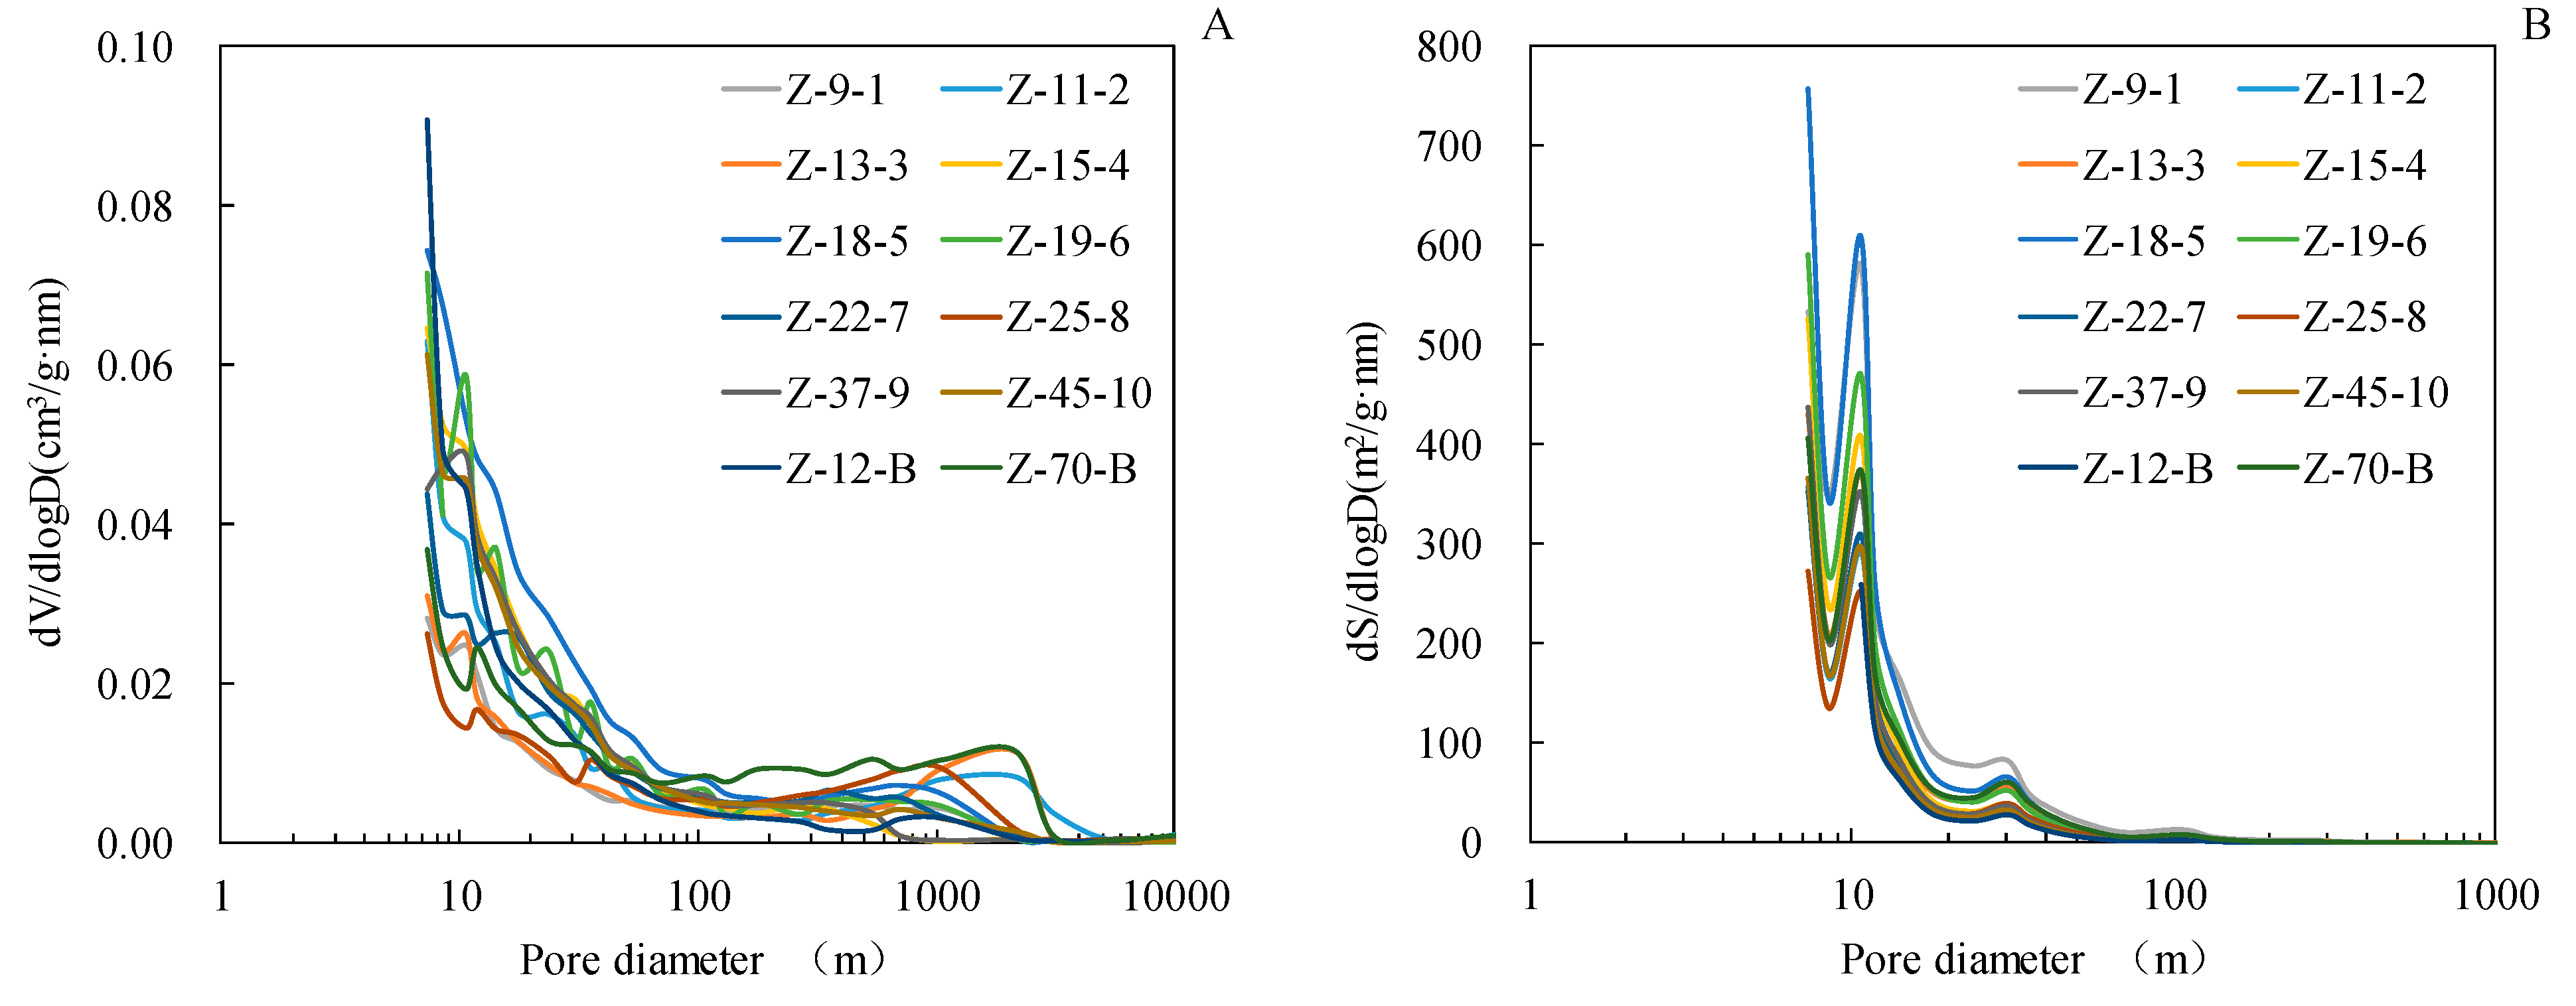
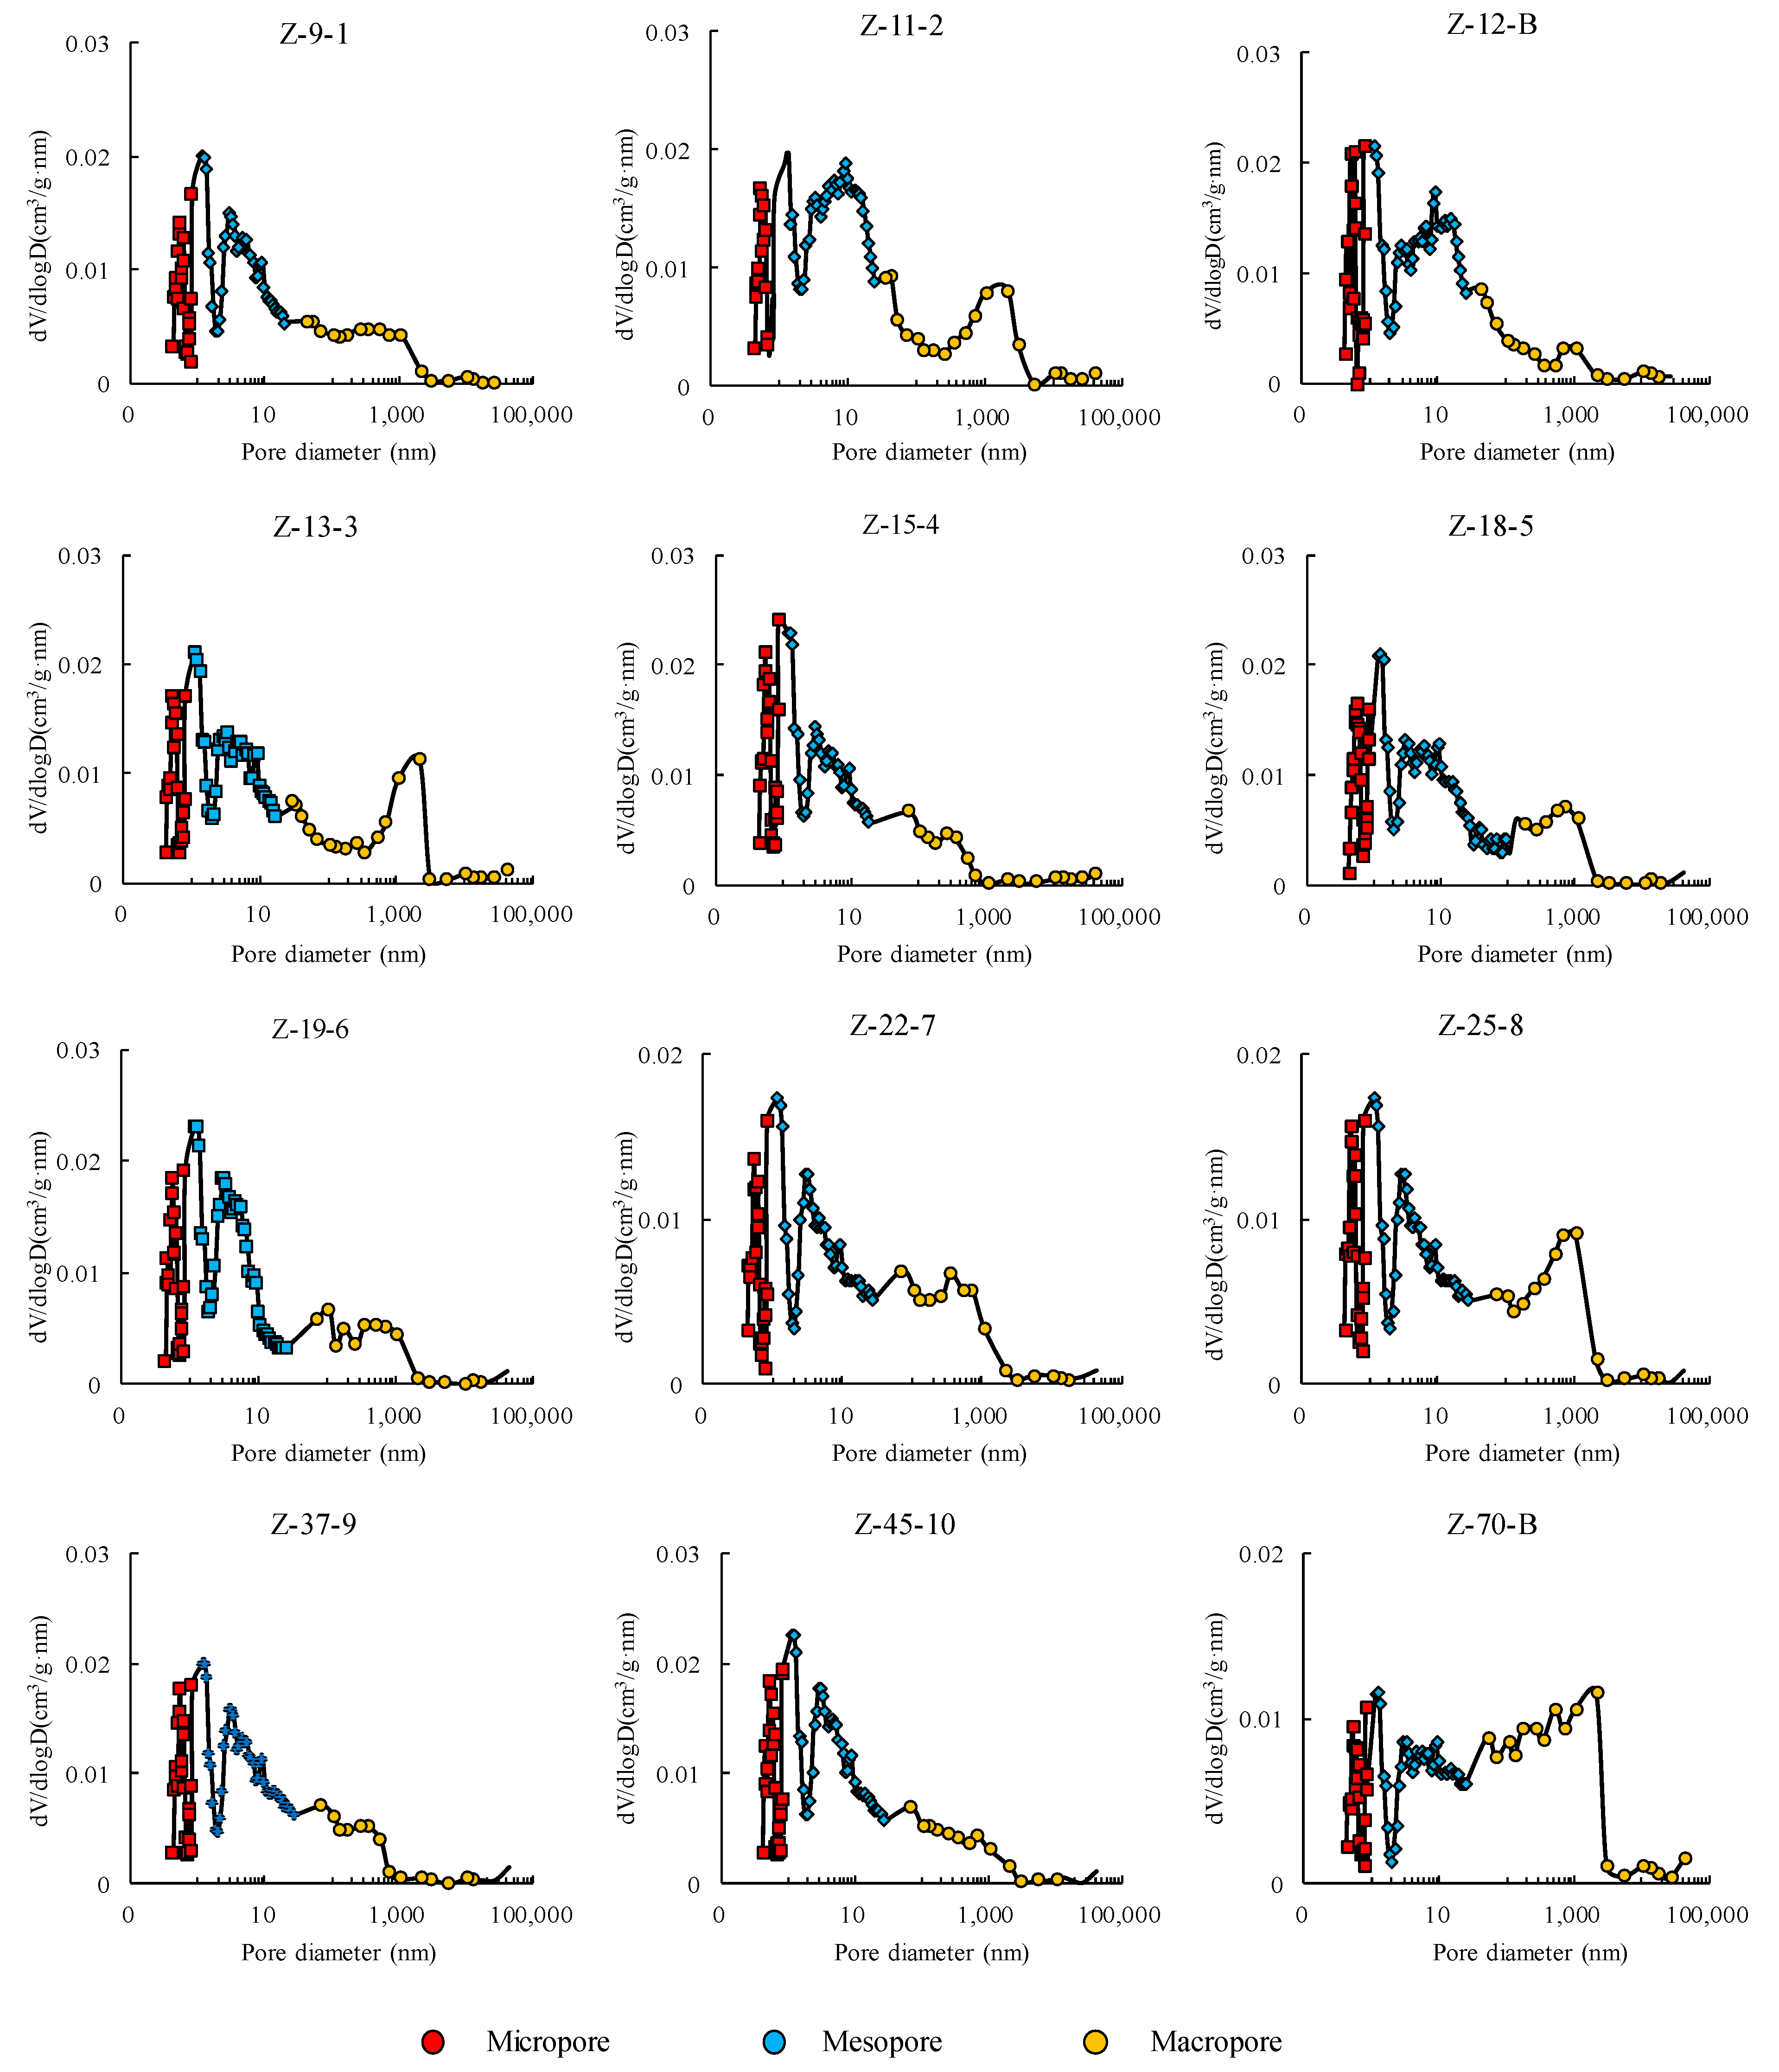
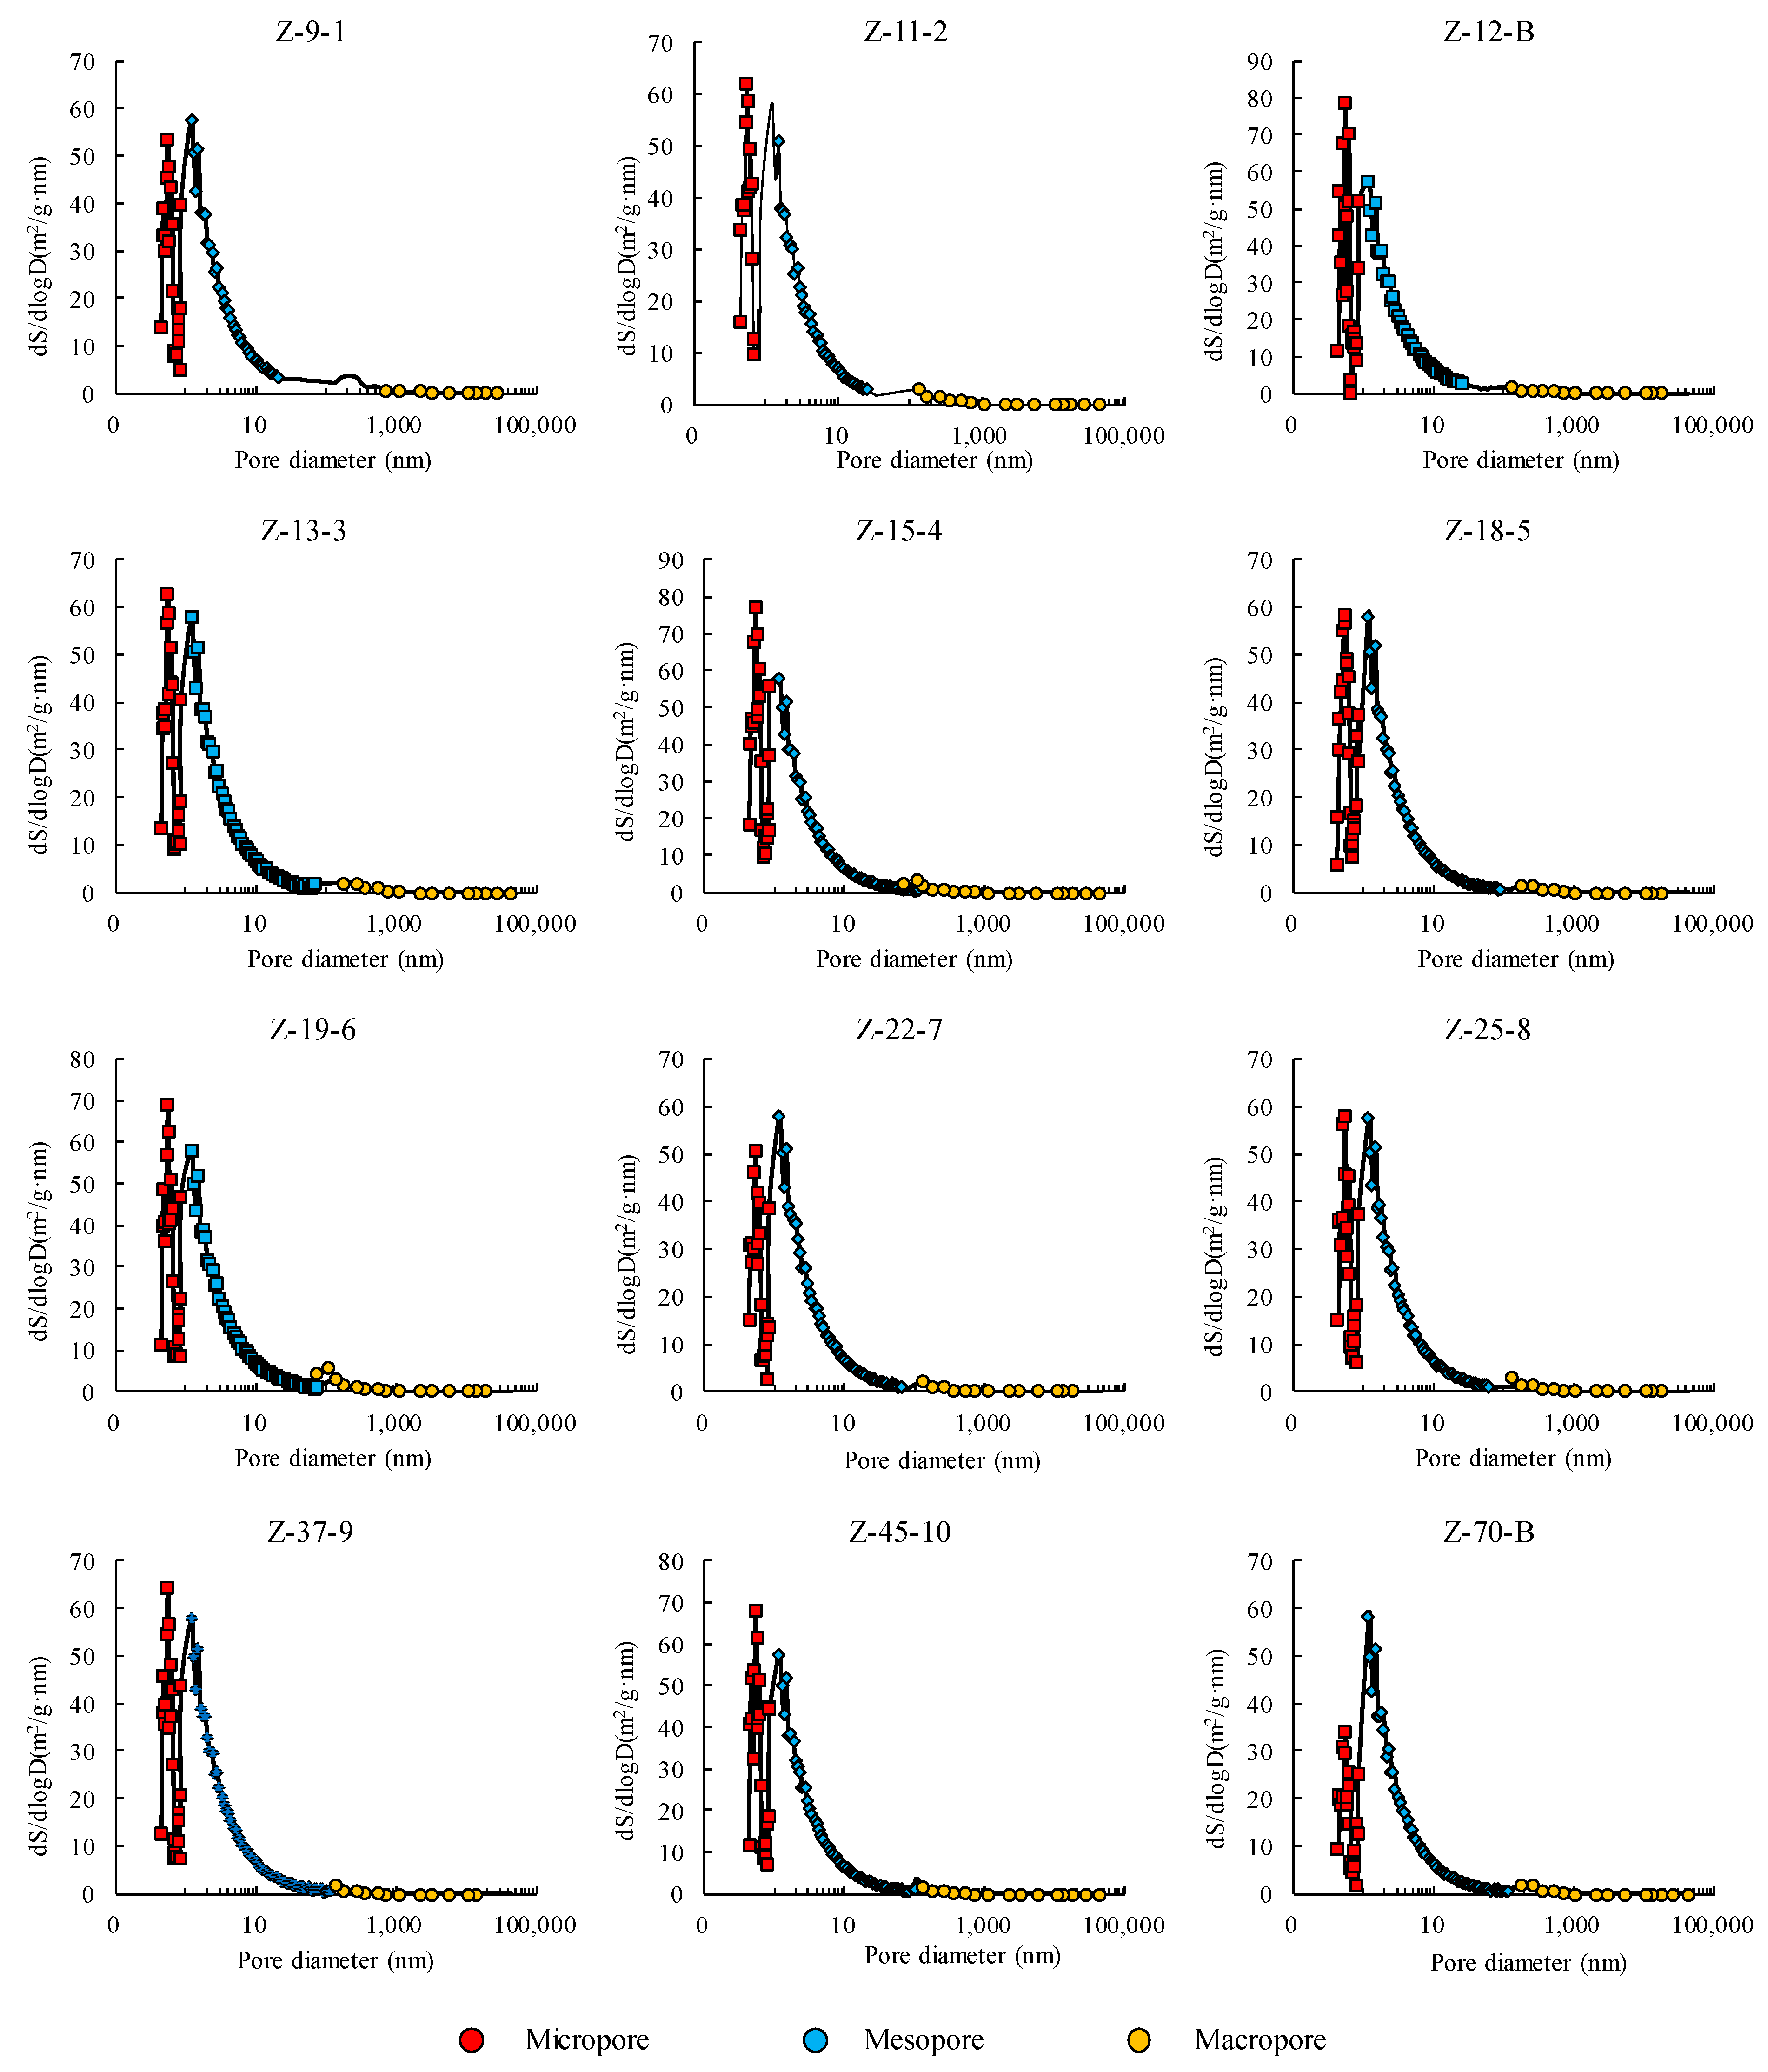
Full-scale PSD curves of PV and SSA derived from the LTCA, LTNA, and MIP experiments are shown in Figure 9 and Figure 10, respectively. The full-scale PSD curves of PV developed multimodally, with the main peaks at about 0.5 nm–2 nm, 3 nm–6 nm, and 700 nm–2.2 um. The full-scale PSD curves of the SSA developed unimodally, with the peaks mainly located between 0.5 nm and 1.2 nm.
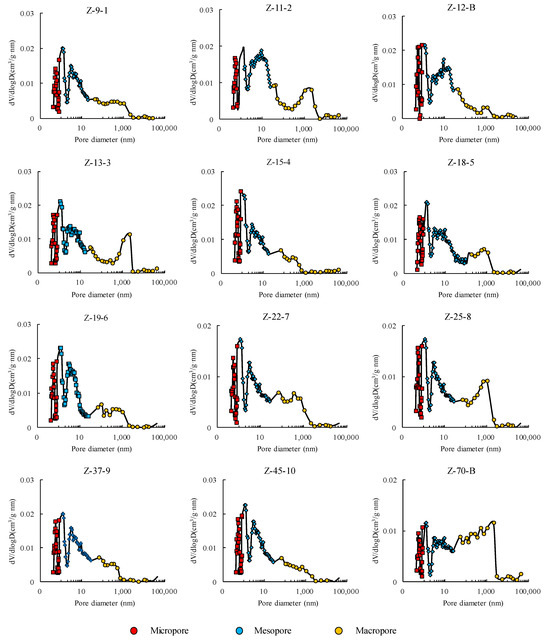
Figure 9.
Full-scale PSD curves of PV derived from the LTCA, LTNA, and MIP experiments.
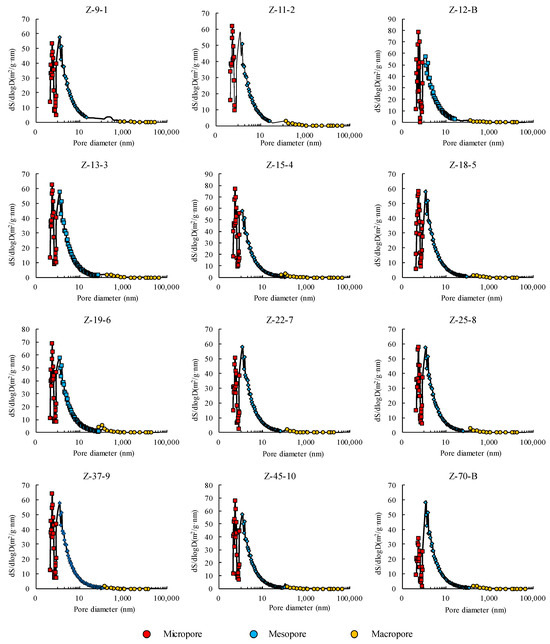
Figure 10.
Full-scale PSD curves of SSA derived from the LTCA, LTNA, and MIP experiments.
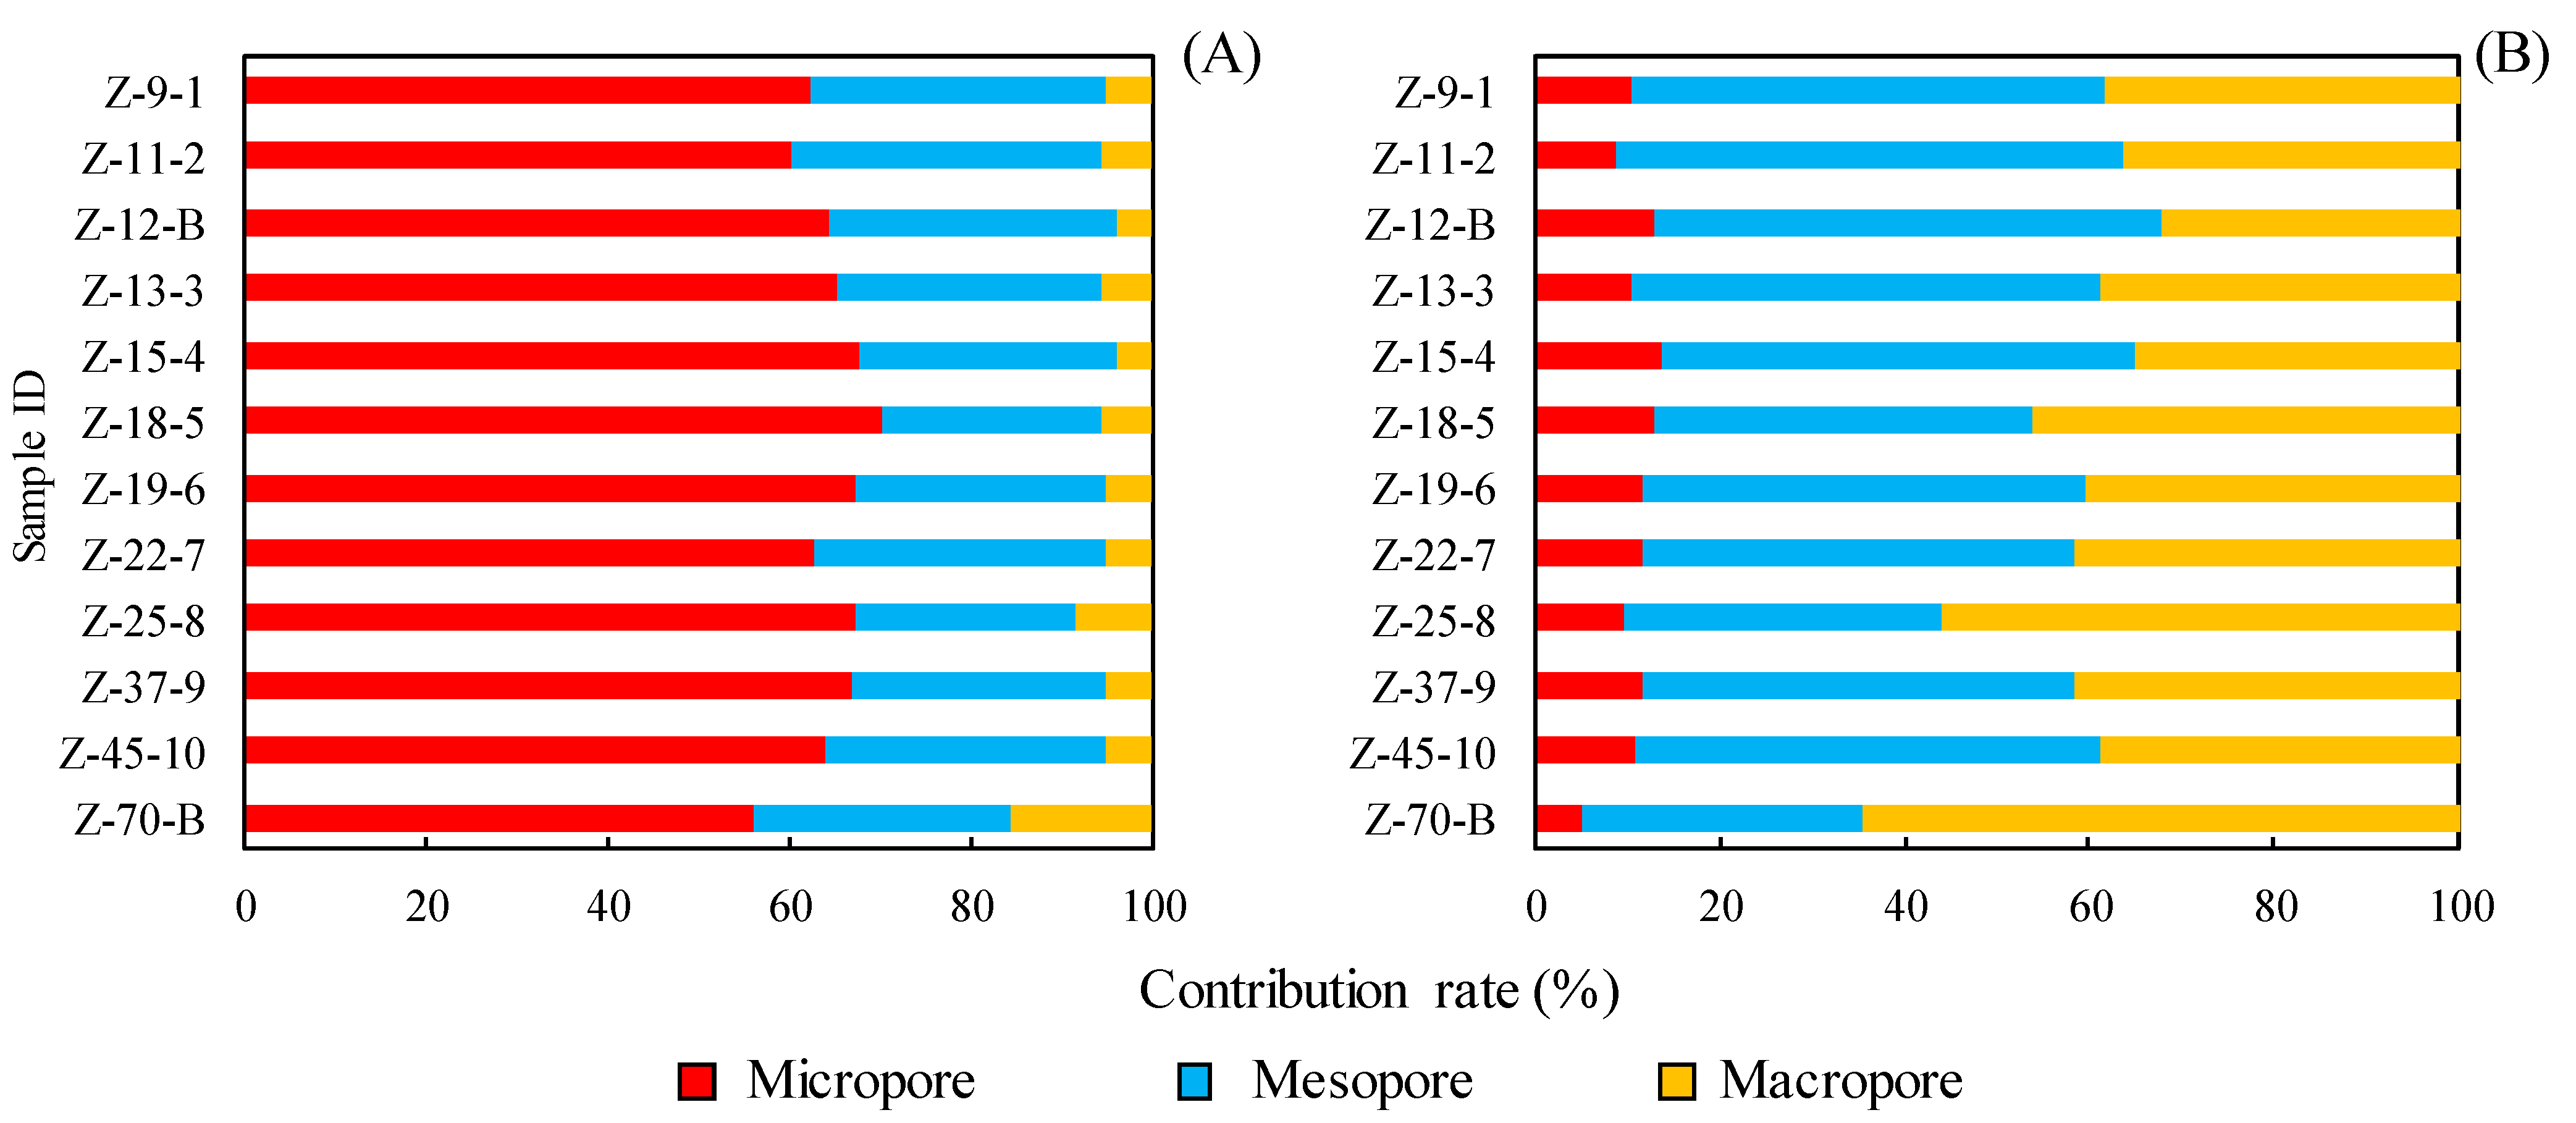
As shown in Table 2 and Figure 11, the composition of different types of pores (micro-, meso-, and macropores) in the PV and SSA results for the twelve marine shale samples in the study area was statistically analyzed. The total PV ranged from 0.0213 to 0.0328 cm3/g (averaging 0.0257 cm3/g) and was primarily contributed by mesopores (46.66%), followed by macropores (42.42%), while the contribution of micropores was quite small (10.91%). The total SSA ranged from 9.23 to 16.88 m2/g (averaging 14.19 m2/g) and was dominated by micropores (64.63%), followed by mesopores (29.22%), while the contribution of macropores was negligible (6.15%).
Table 2.
Micro, meso, and macro PV and SSA obtained via LTCA, LTNA, and MIP experiments.
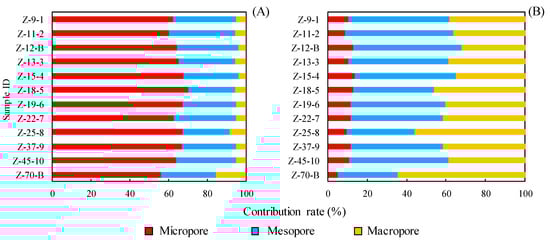
Figure 11.
The contribution of micro, meso, and macropores to PV (A) and SSA (B).
5.2. Factors Affecting Pore Volume and Specific Surface Area
5.2.1. TOC
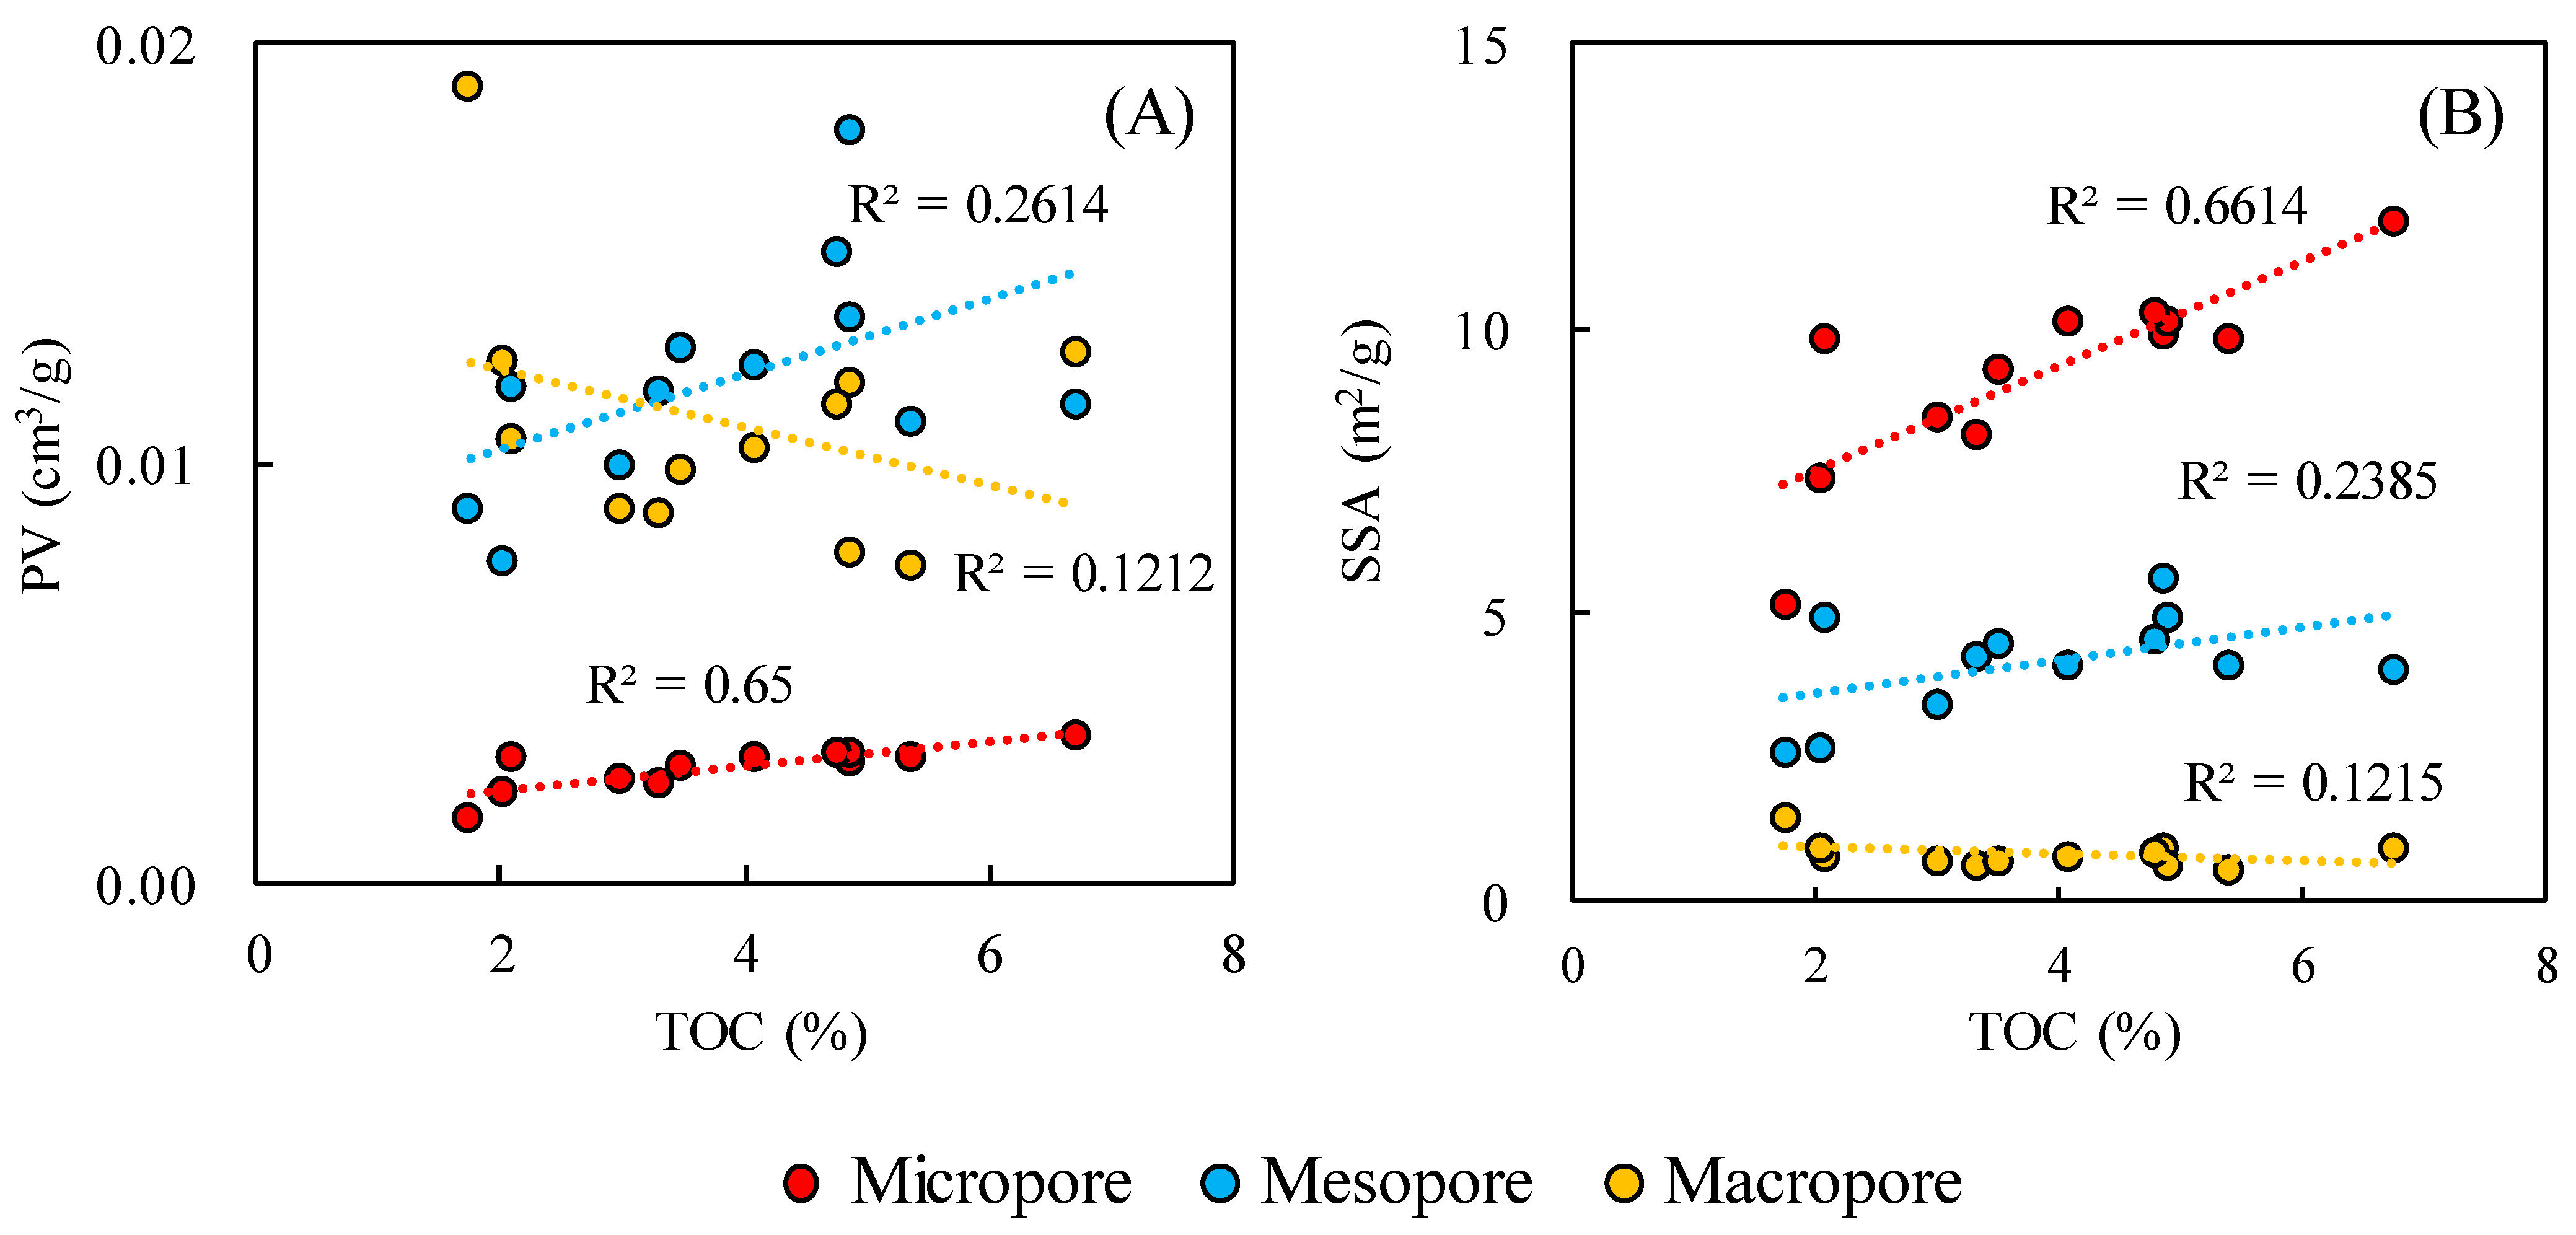
Marine shale organic matter (OM) is highly mature, along with highly developed OM pores, which are the main storage spaces for marine shale gas [48]. The TOC content has an important impact on shale pore and pore size distribution. Figure 12 shows the correlations between micro, meso, and macro PV, SSA, and TOC content. Here, there is a positive correlation between micro PV (R2 = 0.65), micro SSA (R2 = 0.66), and TOC content (Figure 12A,B), indicating that micropores represent a large proportion of pores in organic matter. The intensive thermal maturation and hydrocarbon expulsion of OM usually results in the development of abundant OM pores, which are mainly micropores and mesopores [29].
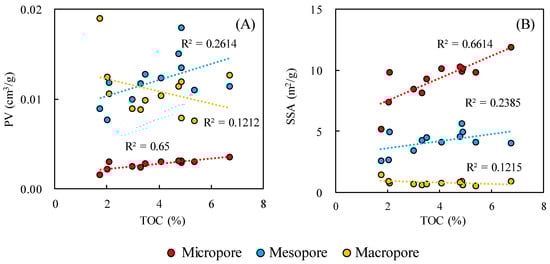
Figure 12.
Correlations between micro, meso, and macro PV, SSA, and TOC content: PV (A); SSA (B).
Overall, meso PV (R2 = 0.26) and meso SSA (R2 = 0.26) increased with an increase in the TOC content, but the positive correlation was quite weak, indicating that mesopores only account for a small proportion of pores in organic matter. There is no obvious correlation between macro PV, macro SSA, and TOC content, indicating that the TOC content has little impact on the development of macropores.
5.2.2. Mineral Composition
Clay content has a significant impact on the development of shale pores. Wang (2019) studied the full-scale pore structure and its controlling factors in Wufeng–Longmaxi shale from the Weiyuan and Changning area. The results indicated that for shale samples with similar TOCs and quartz content, clay-rich samples commonly have a higher porosity than that of clay-poor ones [29].
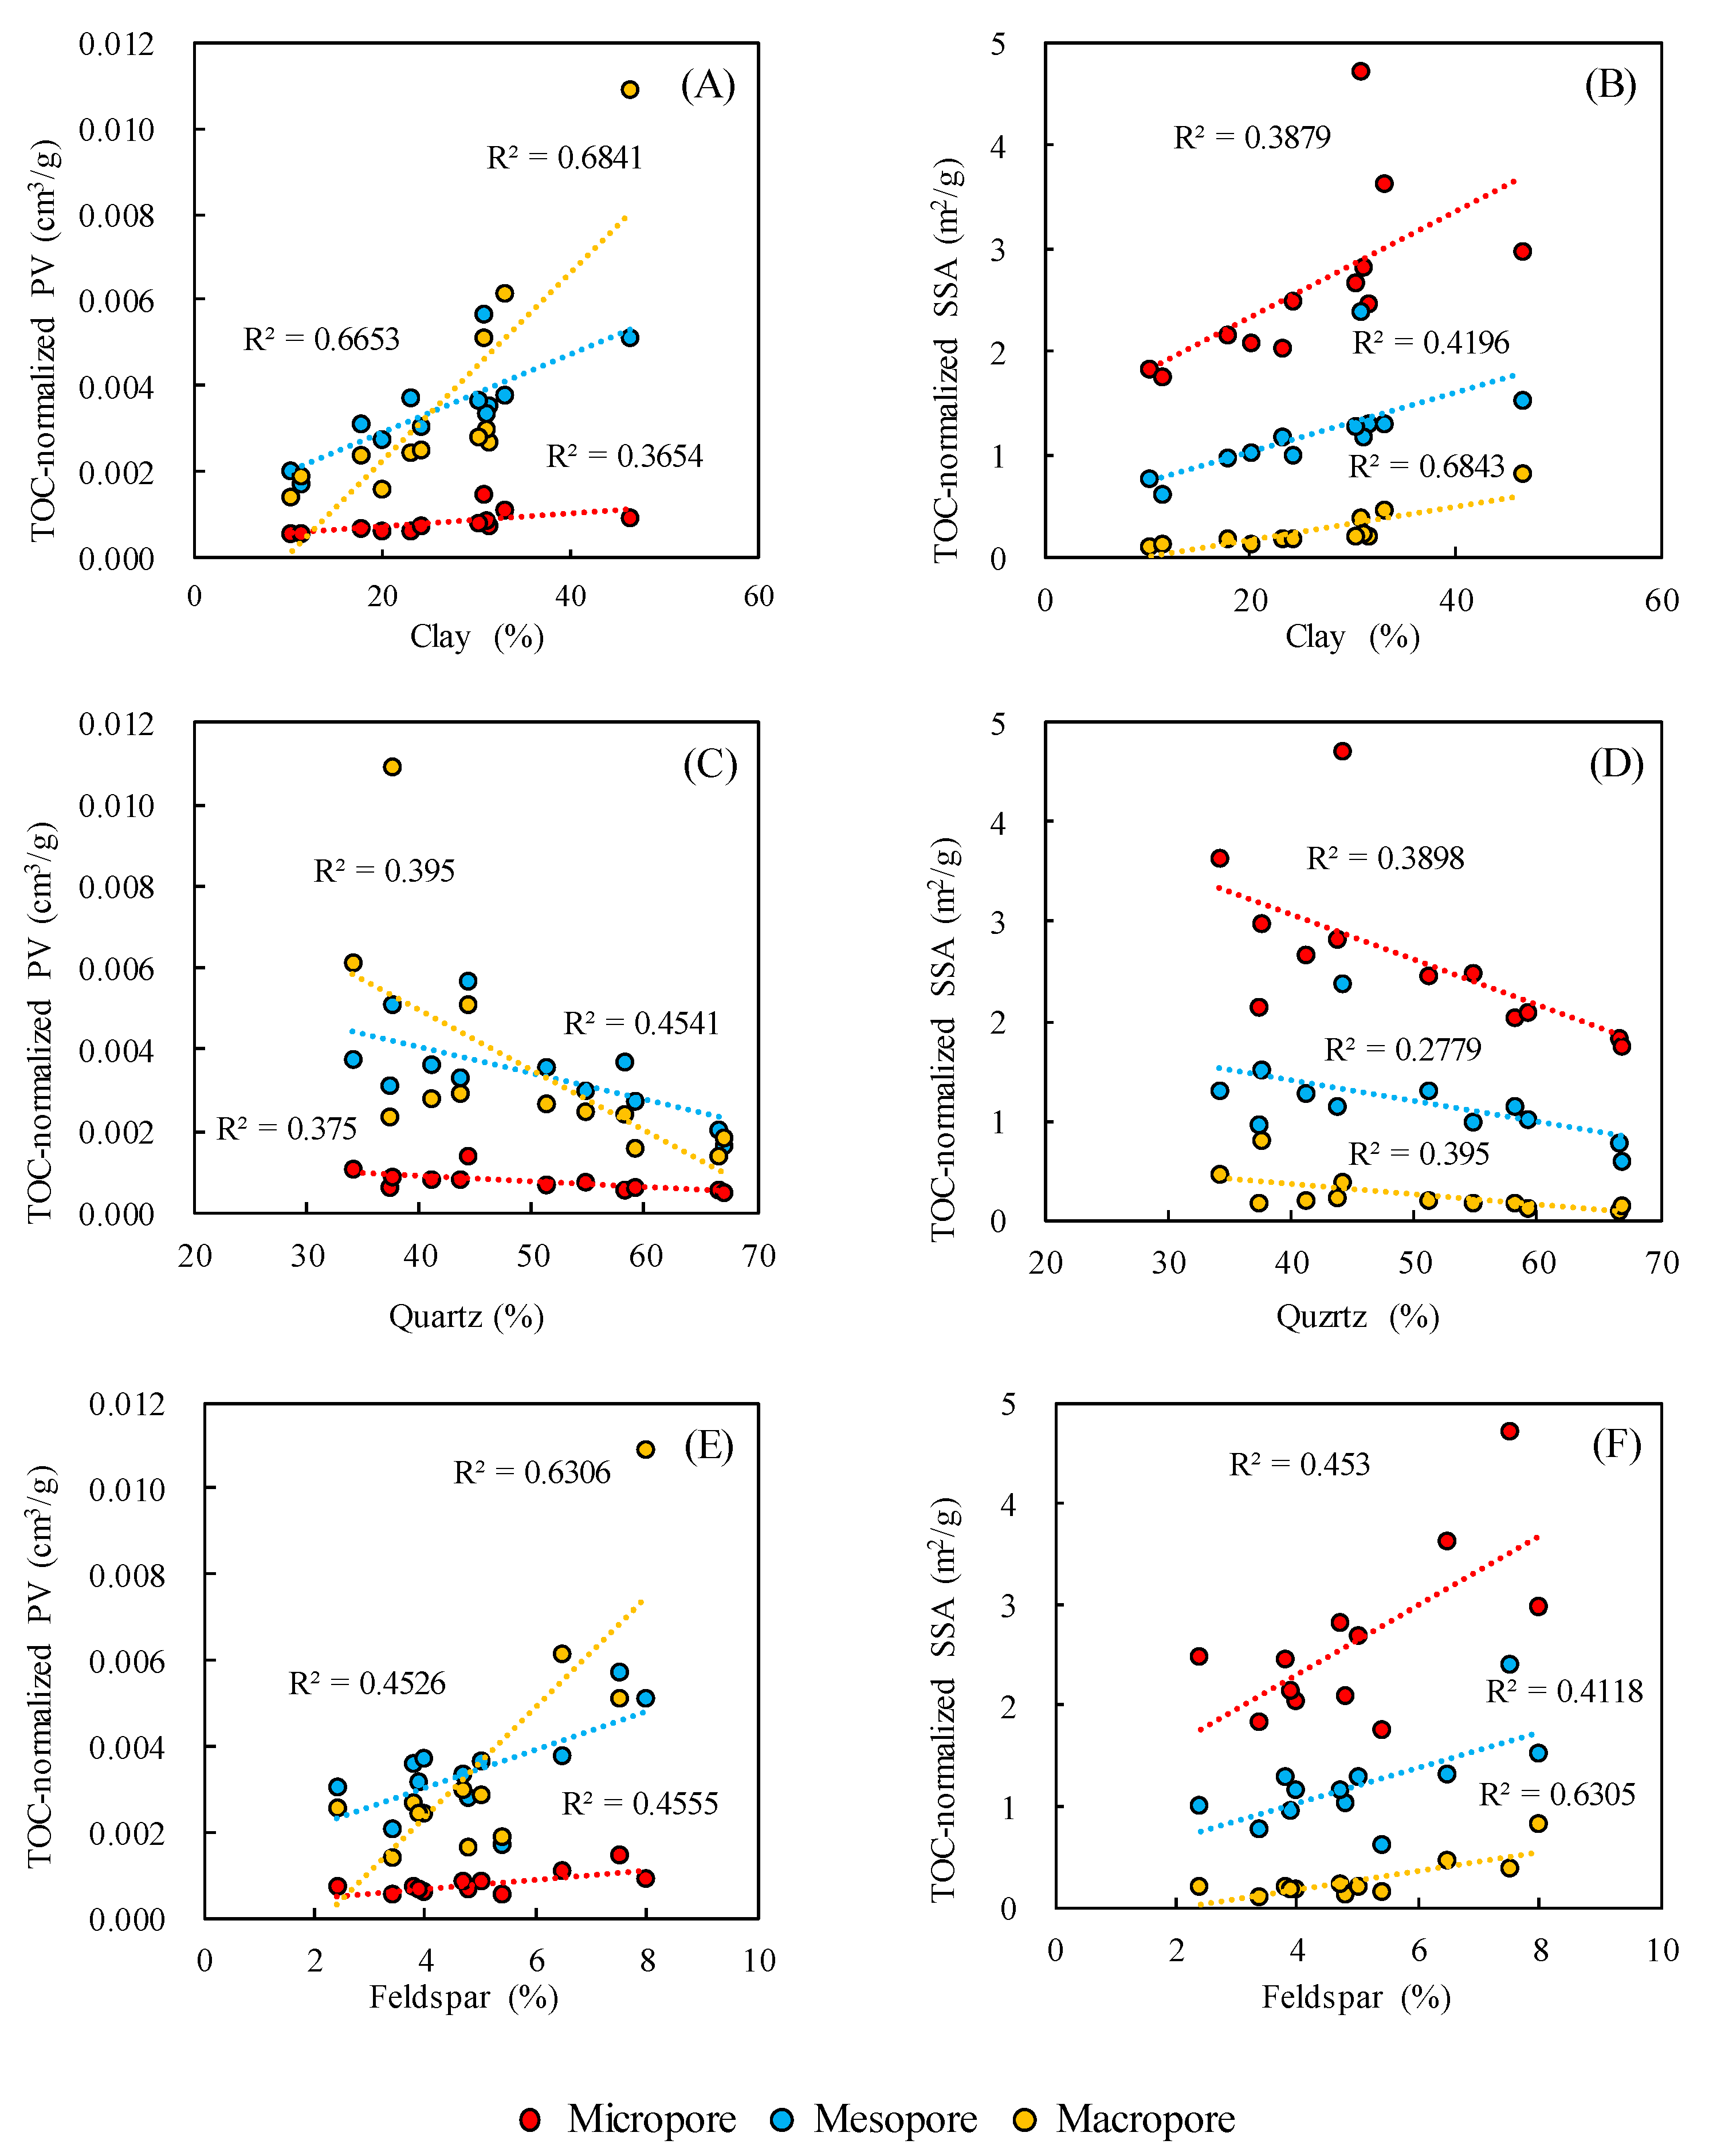
To eliminate interference from organic matter when studying the relationship between mineral content and PV and SSA, TOC-normalized PV and SSA were calculated. Figure 13A shows that positive relationships were found between meso TOC-normalized PV (R2 = 0.67), macro TOC-normalized PV (R2 = 0.68), and clay content. This result indicates that the clay-related pores are mainly composed of mesopores and macropores. Figure 13B shows positive relationships between the TOC-normalized SSAs of all pore types (especially macropores, R2 = 0.68) and clay content, indicating that macropores are the main contributors to the SSA values of the marine shale samples in the study area.
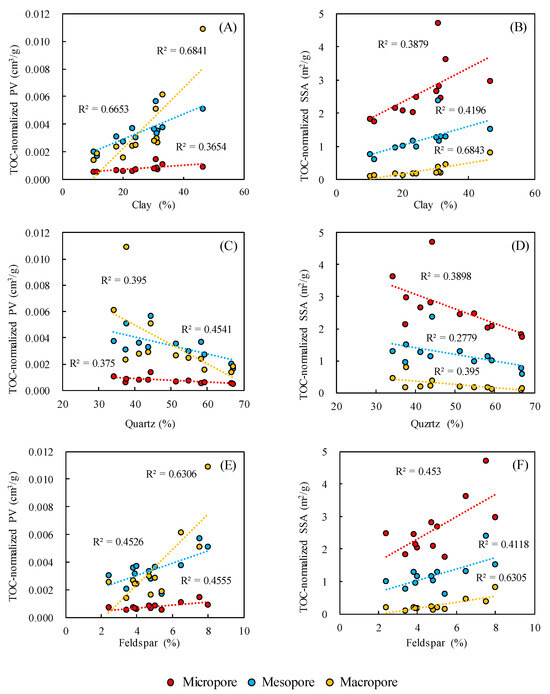
Figure 13.
Correlations between TOC-normalized micro, meso, and macro PV, SSA, and mineral content: clay (A,B), quartz (C,D), and feldspar (E,F).
Figure 13C,D show that the TOC-normalized full-scale PV and SSA decreased with an increase in the quartz content, indicating that the quartz content has an inhibitory effect on the development of pores of all types. This result can be explained by the secondary cementation of biogenic silica [49,50,51]. However, relationships between TOC-normalized full-scale and feldspar PV and SSA were positive (Figure 13E,F). PV and SSA gradually increased with an increase in feldspar content due to the formation of many dissolution pores under acidic environments [52], indicating that feldspar dissolution pores are important components of shale pores, particularly for macropores (R2 = 0.63).
6. Conclusions
(1) The marine shale samples of the Wufeng–Longmaxi Formation in the Zigong area, southwest Sichuan Basin, are rich in organic matter, with an average TOC of 3.86%. The mineral composition is dominated by quartz and clay minerals, with average contents of 44.1% and 31.4%, respectively.
(2) Combining LTCA, LTNA, and MICP measurements, the full-scale pore structure of the Wufeng–Longmaxi shale was quantified piecewise. The full-scale PSD curves of PV developed multimodally, with the main peaks occurring at about 0.5 nm–2 nm, 3 nm–6 nm, and 700 nm–2.2 um. The full-scale PSD curves of SSA developed unimodally, with the peaks mainly located between 0.5 nm and 1.2 nm.
(3) Total pore volume (PV) was mainly contributed by mesopores and macropores, with an average contribution of 46.66% and 42.42%, respectively. The contribution of micropores was only 10.91%. The total specific surface area (SSA) was mainly contributed by micropores and mesopores, with an average contribution of 64.63% and 29.22%, respectively. The contribution of micropores was only 6.15%.
(4) The TOC content mainly controls the total PV and total SSA of micropores and mesopores, while the clay content mainly controls the PV and SSA of macropores, indicating that the sizes of the pores in organic matter are generally very small, and increasing organic matter and clay minerals would increase the total PV and SSA. These will help deepen our understanding of shale and gas reservoirs.
Author Contributions
Data curation; writing—original draft, Z.L.; resources and software, Z.B.; supervision, resources, and Funding acquisition, H.W. (Hailong Wang).; writing—review and editing and visualization, X.Z.; software and validation, H.W. (Hongxue Wang).; resources, Z.J.; investigation, T.H. All authors have read and agreed to the published version of the manuscript.
Funding
The authors thank the support from the Science and Technology Special Projects of PetroChina (No. 2023ZZ21), and the Open Fund of Key Laboratory of Exploration Technologies for Oil and Gas Resources (Yangtze University), Ministry of Education (No. K202307).
Institutional Review Board Statement
Not applicable.
Informed Consent Statement
Not applicable.
Data Availability Statement
Data are available from the authors upon request.
Acknowledgments
The authors greatly appreciate anonymous reviewers and editors for their constructive comments for their precious advice.
Conflicts of Interest
The authors declare no conflict of interest.
References
- Feng, Z.; Hao, F.; Tian, J. Shale gas geochemistry in the Sichuan Basin, China. Earth-Sci. Rev. 2022, 232, 104141. [Google Scholar] [CrossRef]
- Jiang, F.; Huo, L.; Chen, D. The controlling factors and prediction model of pore structure in global shale sediments based on random forest machine learning. Earth-Sci. Rev. 2023, 241, 104442. [Google Scholar] [CrossRef]
- Wang, M.; Guo, Z.; Jiao, C. Exploration progress and geochemical features of lacustrine shale oils in China. J. Pet. Sci. Eng. 2019, 178, 975–986. [Google Scholar] [CrossRef]
- He, T.; Li, W.; Lu, S.; Yang, E.; Jing, T.; Ying, J.; Zhu, P.; Wang, X.; Pan, W.; Zhang, B.; et al. Quantitatively unmixing method for complex mixed oil based on its fractions carbon isotopes: A case from the Tarim Basin, NW China. Pet. Sci. 2023, 20, 102–113. [Google Scholar] [CrossRef]
- Li, X.; Cai, J.; Liu, H. Characterization of shale pore structure by successive pretreatments and its significance. Fuel 2020, 269, 117412. [Google Scholar] [CrossRef]
- Zhang, L.; Xiao, D.; Lu, S. Pore development of the Lower Longmaxi shale in the southeastern Sichuan Basin and its adjacent areas: Insights from lithofacies identification and organic matter. Mar. Pet. Geol. 2020, 122, 104662. [Google Scholar] [CrossRef]
- Gu, M.; Xian, X.; Duan, S. Influences of the composition and pore structure of a shale on its selective adsorption of CO2 over CH4. J. Nat. Gas Sci. 2017, 46, 296–306. [Google Scholar] [CrossRef]
- Han, H.; Guo, C.; Zhong, N. Pore structure evolution of lacustrine shales containing type I organic matter from the upper cretaceous Qingshankou formation, Songliao Basin, China: A study of artificial samples from hydrous pyrolysis experiments. Mar. Pet. Geol. 2019, 104, 375–388. [Google Scholar] [CrossRef]
- Yang, R.; He, S.; Hu, Q. Applying SANS technique to characterize nano-scale pore structure of Longmaxi shale, Sichuan Basin (China). Fuel 2017, 197, 91–99. [Google Scholar] [CrossRef]
- Zhang, J.; Li, X.; Wei, Q. Characterization of full-sized pore structure and fractal characteristics of marine–continental transitional Longtan formation Shale of Sichuan Basin, South China. Energy Fuel 2017, 31, 10490–10504. [Google Scholar] [CrossRef]
- Yang, F.; Ning, Z.F.; Wang, Q. Pore structure characteristics of Lower Silurian shales in the southern Sichuan Basin, China: Insights to pore development and gas storage mechanism. Int. J. Coal Geol. 2016, 156, 12–24. [Google Scholar] [CrossRef]
- Qiu, H.; Jiang, Z.; Liu, Z. Difference in pore structure characteristics between condensate and dry shale gas reservoirs: Insights from the pore contribution of different matrix components. J. Nat. Gas Sci. Eng. 2021, 96, 104283. [Google Scholar] [CrossRef]
- Tian, H.; Pan, L.; Xiao, X. A preliminary study on the pore characterization of Lower Silurian black shales in the Chuandong Thrust Fold Belt, southwestern China using low pressure N2 adsorption and FE-SEM methods. Mar. Petrol. Geol. 2013, 48, 8–19. [Google Scholar] [CrossRef]
- Klaver, J.; Hemes, S.; Houben, M. The connectivity of pore space in mudstones: Insights from high-pressure Wood’s metal injection, BIB–SEM imaging, and mercury intrusion porosimetry. Geofluids 2015, 15, 577–591. [Google Scholar] [CrossRef]
- Tang, X.; Jiang, Z.; Jiang, S. Heterogeneous nanoporosity of the Silurian Longmaxi Formation shale gas reservoir in the Sichuan Basin using the QEMSCAN, FIB-SEM, and nano-CT methods. Mar. Petrol. Geol. 2016, 78, 99–109. [Google Scholar] [CrossRef]
- Wang, P.; Jiang, Z.; Ji, W. Heterogeneity of Intergranular, intraparticle and organic pores in Longmaxi shale in Sichuan basin, south China: Evidence from SEM digital images and fractal and multi fractal Geometries. Mar. Pet. Geol. 2016, 72, 122–138. [Google Scholar] [CrossRef]
- Fathy, D.; Wagreich, M.; Fathi, E. Maastrichtian Anoxia and Its Influence on Organic Matter and Trace Metal Patterns in the Southern Tethys Realm of Egypt during Greenhouse Variability. ACS Omega 2023, 22, 19603–19612. [Google Scholar] [CrossRef] [PubMed]
- Huang, X.; Zhao, Y. Evolution of pore structure and adsorption-desorption in oil shale formation rocks after compression. Energy 2023, 278, 127913. [Google Scholar] [CrossRef]
- Zhang, L.; Xiong, Y.; Li, Y. DFT modeling of CO2 and Ar low-pressure adsorption for accurate nanopore structure characterization in organic-rich shales. Fuel 2017, 204, 1–11. [Google Scholar] [CrossRef]
- Zhang, J.; Wang, H.; Vandeginste, V. Effect of litho-facies on nano-pore structure of continental shale in shuinan formation of Jiaolai Basin. Geoenergy Sci. Eng. 2023, 228, 212020. [Google Scholar] [CrossRef]
- Ge, X.; Fan, Y.; Chen, H. Probing the influential factors of NMR T1-T2 spectra in the characterization of the kerogen by numerical simulation. J. Magn. Reson. 2015, 260, 54–66. [Google Scholar] [CrossRef]
- Zhou, S.; Liu, H.; Yan, G. NMR research of movable fluid and T2 cutoff of marine of South China. Oil Gas Geol 2016, 37, 612–616. [Google Scholar]
- Gao, F.; Song, Y.; Zhuo, L. Quantitative characterization of pore connectivity using NMR and MIP: A case study of the Wangyinpu and Guanyintang shales in the Xiuwu basin, Southern China. Int. J. Coal Geol. 2018, 197, 53–65. [Google Scholar] [CrossRef]
- Zhang, P.; Lu, S.; Li, J. Comparisons of SEM, Low-Field NMR, and mercury intrusion capillary pressure in characterization of the pore size distribution of lacustrine Shale: A case study on the Dongying Depression, Bohai Bay Basin, China. Energy Fuel 2017, 31, 9232–9239. [Google Scholar] [CrossRef]
- Fleury, M.; Romero-Sarmiento, M. Characterization of shales using T1-T2 NMR maps. J. Pet. Sci. Eng. 2016, 137, 55–62. [Google Scholar] [CrossRef]
- Clarkson, C.; Freeman, M.; He, L. Characterization of tight gas reservoir pore structure using USANS/SANS and gas adsorption analysis. Fuel 2012, 95, 371–385. [Google Scholar] [CrossRef]
- Clarkson, C.; Solano, N.; Bustin, R. Pore structure characterization of North American shale gas reservoirs;using USANS/SANS, gas adsorption, and mercury intrusion. Fuel 2013, 103, 606–616. [Google Scholar] [CrossRef]
- Jones, B.; Manning, D.A. Comparison of geochemical indices used for the interpretation of palaeoredox conditions in ancient mudstones. Chem. Geol. 1994, 111, 111–129. [Google Scholar] [CrossRef]
- Wang, Y.; Liu, L.; Zheng, S. Full-scale pore structure and its controlling factors of the Wufeng-Longmaxi shale, southern Sichuan Basin, China: Implications for pore evolution of highly overmature marine shale. J. Nat. Gas Sci. Eng. 2019, 67, 134–146. [Google Scholar] [CrossRef]
- Zhang, J.; Li, X.; Zou, X. Characterization of the full-sized pore structure of coal-bearing shales and its effect on shale gas content. Energy Fuel 2019, 33, 1969–1982. [Google Scholar] [CrossRef]
- Guo, X.; Qin, Z.; Yang, R. Comparison of pore systems of clay-rich and silica-rich gas shales in the lower Silurian Longmaxi formation from the Jiaoshiba area in the eastern Sichuan Basin, China. Mar. Pet. Geol. 2019, 101, 265–280. [Google Scholar] [CrossRef]
- Dai, J.; Zou, C.; Liao, S. Geochemistry of the extremely high thermal maturity Longmaxi shale gas, southern Sichuan Basin. Org. Geochem. 2014, 74, 3–12. [Google Scholar] [CrossRef]
- Wu, J.; Liang, C.; Hu, Z. Sedimentation mechanisms and enrichment of organic matter in the Ordovician Wufeng Formation- Silurian Longmaxi Formation in the Sichuan Basin. Mar. Pet. Geol 2019, 101, 556–565. [Google Scholar] [CrossRef]
- Yan, C.; Jin, Z.; Zhao, J. Influence of sedimentary environment on organic matter enrichment in shale: A case study of the Wufeng and Longmaxi Formations of the Sichuan Basin, China. Mar. Pet. Geol 2018, 92, 880–894. [Google Scholar] [CrossRef]
- Shi, Z.; Yuan, Y.; Zhao, Q. Paleogeomorphology and shale distribution of Late Ordovician-Early Silurian Yangtze platform, South China: Implication for shale mineralogy and TOC content. J. Nat. Gas Geosci. 2023, 8, 245–262. [Google Scholar] [CrossRef]
- Cai, Q.; Hu, M.; Kane, O.I. Cyclic variations in paleoenvironment and organic matter accumulation of the Upper Ordovician-Lower Silurian black shale in the Middle Yangtze Region, South China: Implications for tectonic setting, paleoclimate, and sea-level change. Mar. Petrol. Geol. 2022, 136, 105477. [Google Scholar] [CrossRef]
- Li, Z.; Bao, Z.; Wei, Z. Geochemical features of lacustrine shales in the upper cretaceous qingshankou formation of changling sag, songliao basin, Northeast China. Energies 2022, 15, 6983. [Google Scholar] [CrossRef]
- Chen, F.; Zhao, H.; Wang, S.; Lu, S.; Wang, M.; Ding, X.J.O.; Geology, G. Evaluation of movable shale oil reserves in the Es~(1L) of the Raoyang sag, Jizhong Depression. Oil Gas Geol. 2019, 40, 593–601. [Google Scholar]
- Liu, J.; Yao, Y.; Liu, D. Experimental evaluation of CO2 enhanced recovery of adsorbed-gas from shale. Int. J. Coal Geol. 2017, 179, 211–218. [Google Scholar] [CrossRef]
- Sing, K.S.W. Reporting physisorption data for gas/solid systems-with special reference to the determination of surface area and porosity. Pure Appl. Chem 1985, 57, 603–619. [Google Scholar] [CrossRef]
- Gregg, S.J.; Sing, K.S.W. Adsorption, Surface Area, and Porosity; Academic Press: New York, NY, USA, 1982; p. 303. [Google Scholar]
- Thommes, M.; Kaneko, K.; Neimark, A. Physisorption of gases, with special reference to the evaluation of surface area and pore size distribution (IUPAC Technical Report). Pure Appl. Chem. 2015, 87, 1051–1069. [Google Scholar] [CrossRef]
- Yang, F.; Ning, Z.; Wang, Q. Pore structure of Cambrian shales from the Sichuan Basin in China and implications to gas storage. Mar. Pet. Geol. 2016, 70, 14–26. [Google Scholar] [CrossRef]
- Shan, C.; Zhao, W.; Wang, F. Nanoscale pore structure heterogeneity and its quantitative characterization in Chang7 lacustrine shale of the southeastern Ordos Basin, China. J. Pet. Sci. Eng. 2019, 187, 106754. [Google Scholar] [CrossRef]
- Labani, M.; Rezaee, R.; Saeedi, A. Evaluation of pore size spectrum of gas shale reservoirs using low pressure nitrogen adsorption, gas expansion and mercury porosimetry: A case study from the Perth and Canning Basins, Western Australia. J. Pet. Gas. Sci. Eng. 2013, 112, 7–16. [Google Scholar] [CrossRef]
- Tsakiroglou, C.; Payatakes, A. Characterization of the pore structure of reservoir rocks with the aid of serial sectioning analysis, mercury porosimetry and network simulation. Adv. Water Resour. 2000, 23, 773–789. [Google Scholar] [CrossRef]
- Zhang, L.; Lu, S.; Xiao, D. Pore structure characteristics of tight sandstones in the northern Songliao Basin, China. Mar. Pet. Geol. 2017, 88, 170–180. [Google Scholar] [CrossRef]
- Wang, X.; Zhang, L.; Lei, Y. Characteristics of migrated solid organic matters and organic pores in low maturity Lacustrine shale: A case study of the shale in Chang7 oil-bearing formation of Yanchang Formation, southeastern Ordos Basin. Acta Pet. Sin. (Chin. Engl. Abstr.) 2018, 39, 141–150. [Google Scholar]
- Zhang, L.; Xiao, D.; Lu, S. Effect of sedimentary environment on the formation of organic-rich marine shale: Insights from major/trace elements and shale composition. Int. J. Coal Geol. 2019, 204, 34–50. [Google Scholar] [CrossRef]
- Ross, D.J.K.; Bustin, R.M. The importance of shale composition and pore structure upon gas storage potential of shale gas reservoirs. Mar. Petrol. Geol. 2009, 26, 916–927. [Google Scholar] [CrossRef]
- Li, H.; He, T.; Li, W. Paleoenvironment Change and Organic Matter Accumulation of Marine Shale in the Zigong Area, Southern Sichuan Basin, China: A Case Study of Well Z303. Energies 2023, 16, 4015. [Google Scholar] [CrossRef]
- Hu, H.; Hao, F.; Liu, J. Organic matter-hosted pore system in the Wufeng-Longmaxi (O3w-S11) shale, Jiaoshiba area, Eastern Sichuan Basin, China. Int. J. Coal Geol. 2017, 173, 40–50. [Google Scholar] [CrossRef]
Disclaimer/Publisher’s Note: The statements, opinions and data contained in all publications are solely those of the individual author(s) and contributor(s) and not of MDPI and/or the editor(s). MDPI and/or the editor(s) disclaim responsibility for any injury to people or property resulting from any ideas, methods, instructions or products referred to in the content. |
© 2023 by the authors. Licensee MDPI, Basel, Switzerland. This article is an open access article distributed under the terms and conditions of the Creative Commons Attribution (CC BY) license (https://creativecommons.org/licenses/by/4.0/).