Article

Pore Structure Characteristics of Shale Oil Reservoirs with Different Lithofacies and Their Effects on Mobility of Movable Fluids: A Case Study of the Chang 7 Member in the Ordos Basin, China

1
School of Energy Resources, China University of Geosciences, Beijing 100083, China
2
Key Laboratory for Marine Reservoir Evolution and Hydrocarbon Abundance Mechanism, Ministry of Education, China University of Geosciences, Beijing 100083, China
3
Beijing Key Laboratory of Unconventional Natural Gas Geological Evaluation and Development Engineering, China University of Geosciences, Beijing 100083, China
4
Yanchang Oilfield Co., Ltd., Yan’an 716000, China
5
China National Offshore Oil Corporation Limited, Tianjin Branch, Tianjin 300459, China
*
Authors to whom correspondence should be addressed.
Energies 2024, 17(4), 862; https://doi.org/10.3390/en17040862
Submission received: 22 December 2023 / Revised: 7 February 2024 / Accepted: 8 February 2024 / Published: 12 February 2024
(This article belongs to the Special Issue Geo-Fluids in Unconventional Reservoirs: Latest Advances)

Abstract

:
The Chang 7 member of the Triassic Yanchang Formation in the Ordos Basin is a significant continent shale oil reservoir in China. Therefore, conducting an in-depth investigation into the pore structure and fluid mobility characteristics of the Chang 7 shale oil reservoir holds immense importance for advancing shale oil exploration. This study conducts a detailed analysis of the pore structures and their impact on fluid mobility of the Chang 7 shale oil reservoir using multiple methodologies, i.e., a cast thin section, scanning electron microscopy (SEM), X-ray diffraction (XRD), high-pressure mercury injection (HPMI), low-temperature nitrogen adsorption (LTNA), and nuclear magnetic resonance (NMR). The results show that the sandstone in the Yanwumao area of the Chang 7 shale oil reservoir consists mainly of lithic arkose and feldspathic litharenite, which can be classified into three lithofacies (massive fine-grained sandstone (Sfm), silt-fine sandstone with graded bedding (Sfgb), and silt-fine sandstone with parallel bedding (Sfp)). Moreover, three pore structures (Type I, II, and III), and four pore spaces (nanopores, micropores, mesopores, and macropores) can be characterized. Pore structure Type I, characterized by large pores, exhibits bimodal pore diameter curves, resulting in the highest levels of movable fluid saturation (MFS) and movable fluid porosity (MFP). Pore structure Type II demonstrates unimodal pore structures, indicating robust connectivity, and higher MFS and MFP. Pore structure Type III primarily consists of dissolved and intercrystalline pores with smaller pore radii, a weaker pore configuration relationship, and the least fluid mobility. Furthermore, a correlation analysis suggests that the pore structure significantly impacts the fluid flowability in the reservoir. Favorable petrophysical properties and large pores enhance fluid flowability. Micropores and mesopores with high fractal dimensions have a greater impact on reservoir fluid mobility compared to macropores and nanopores. Mesopores mainly control MFS and MFP, while micropores govern the shift from bound fluid to movable fluid states. Among the lithofacies types, the Sfm lithofacies exhibit the highest fluid mobility due to their significant proportion of macropores and mesopores, whereas the Sfgb lithofacies have lower values because they contain an abundance of micropores. The Sfp lithofacies also dominate macropores and mesopores, resulting in medium fluid mobility levels. This study combines lithofacies types, micro-reservoir pore structure characteristics, and mobile fluid occurrence characteristics to better understand the dominant reservoir distribution characteristics of the Chang 7 shale oil reservoirs in the Ordos Basin and provide theoretical information for further optimization of production strategies.

1. Introduction

As conventional hydrocarbon resources diminish, many countries such as Canada, China, and the United States have turned their attention towards exploring unconventional resources [1,2]. Shale oil is a popular target for global exploration due to its widespread distribution [3,4,5]. The Ordos Basin has abundant unconventional reserves, with the Triassic Chang 7 shale oil resource alone reaching up to 4.23 billion tons [6]. Although the Chang 7 member is rich in shale oil reserves, the shale oil reservoir has the characteristics of extremely low physical properties, a complex lithology, strong heterogeneity, complex pore and throat structure, and significant fluid fluidity variability, which put challenges on its exploration and development [7]. Therefore, it is urgent to conduct deep research on its pore structure characteristics and mobility of movable fluids.
As one of the crucial aspects in conventional reservoir research, pore structure evaluation serves as a focal point and hotspot in shale oil reservoir assessment [8]. Due to the small pore throat size and complex pore structure of shale oil reservoirs, numerous advanced technologies with high precision and resolution have been employed for studying their pore structures, primarily encompassing qualitative and quantitative characterization [8,9,10]. Qualitative characterization methods include conventional optical microscopy, scanning electron microscopy (SEM), field emission scanning electron microscopy (FE-SEM), and CT scanning analyses [11,12,13]. These techniques enable direct observation of the type, shape, and connectivity of reservoir pores [14]. The main technical means used for quantitative characterization are the fluid intrusion method and radiation detection method. Among them, the fluid intrusion method includes mercury injection technology and gas adsorption technology, which can quantitatively characterize reservoir pore size, pore volume, and pore specific surface area [15,16,17,18,19]. Radiation detection methods include the nuclear magnetic resonance technique (NMR), small angle scattering technique, and ultra-small angle neutron scattering technique [8,18,20], in which the NMR experiment can be combined with other techniques to convert the T2 spectrum into pore throat size to characterize the spatial size distribution characteristics of the reservoir pore throat [10,19,21]. These methods are limited by the principle of testing and differ from the pore range and reservoir structure parameters of experimental testing [22,23]. In addition to these test methods, fractal theory is currently widely used for quantitatively describing the heterogeneity of pore structures [24]. At present, in many quantitative experimental methods, the quantitative characterization of all pore sizes is difficult to complete through a single technical means [21,22,23,25]. Therefore, the combined use of multiple experimental methods is an effective approach for the comprehensive quantitative evaluation of pore structures. Given the pore structure of shale oil reservoirs in the Chang 7 Formation of the Ordos Basin, domestic and foreign scholars have carried out numerous research on pore type, morphology, and size in recent years [26,27], but previous studies are mostly focused on a certain region, or the research method is relatively singular, and the distribution and heterogeneity of shale oil reservoir pores are lacking in systematic descriptions and research. All these restrict the fine characterization and optimization of the Chang 7 shale oil sweet spot in the Ordos Basin [19]. Therefore, it is necessary to combine multiple experimental methods to accurately characterize the pore structure characteristics of shale oil reservoirs and employ fractal theory to further evaluate its heterogeneity.
The occurrence characteristics and fluid mobility in pore spaces of shale oil reservoirs have been a hot topic for many scholars [9,10]. Nuclear magnetic resonance (NMR) can rapidly and accurately determine the movable fluid saturation (MFS), movable fluid porosity (MFP), bound fluid saturation, and other common fluid mobility parameters, to effectively evaluate and predict the fluid productivity of various oil and gas reservoirs, and has been widely used in the study of reservoir fluid mobility [10,19]. Reservoir fluid mobility is affected by multiple factors [19]. Previous studies mainly focused on the effects of micro-factors such as reservoir physical properties, micro-pore structure, and mineral composition on the fluid flow [26,27]. However, from a macro analysis, the relative fluid mobility of rock has a great influence, and the movable fluid saturation of pore space of different lithofacies is different [8]. The best fluid mobility is typically found in fine-grained, cross-bedded sandstones (Sc), while the worst fluid mobility is typically found in siltstone to silt-grained sandstones (Ss) [14]. For Chang 7 interlayer shale oil reservoirs, different types of lithofacies have undergone different sedimentary diageneses, corresponding to different pore throat distribution relations, resulting in differences in the occurrence characteristics of mobile fluids [21,24,25,26,27,28]. However, previous studies have simply divided the rock types and ignored the influence of lithofacies on movable fluid [9,10]. Therefore, it is necessary to further analyze the influence of lithofacies types on fluid mobility according to the difference in pore throat structure of different lithofacies types.
The Chang 7 member of the Yanchang Formation in the Yanwumao area is a typical shale oil reservoir, which is mainly composed of organic-rich mud shale deposits and fine-grained sandstone deposits, as a result of gravity flow [29,30]. Additionally, the well-developed source rocks in local areas are typical shale oil reservoirs with self-generation and self-storage [31]. However, there is no research report on the influence of the diversity of reservoir lithofacies and the complexity of the pore structure on the occurrence characteristics of reservoir fluids in the study area. Therefore, this study aims to investigate the pore structure and its impact on the movable fluid in the Chang 7 shale oil reservoirs using multiple methodologies, i.e., a cast thin section, scanning electron microscopy (SEM), X-ray diffraction (XRD), high-pressure mercury injection (HPMI), low-temperature nitrogen adsorption (LTNA), and nuclear magnetic resonance (NMR). The main objectives of this study are as follows: (1) to clarify the mineral composition and pore structure of the Chang 7 shale oil reservoirs; (2) to characterize the full pore size distribution (PSD) and the distribution of movable fluid in the Chang 7 shale oil reservoirs; (3) to quantitatively evaluate the heterogeneity of the pore structure by using fractal theory in reservoirs; (4) to reveal the factors controlling the pore structure and the movable fluid distribution of the shale oil reservoirs. The research results provide important theoretical information for clarifying the micro-pore structure and the occurrence characteristics of movable fluid in different lithofacies reservoirs of the Chang 7 member, and guiding the optimization of shale oil reservoirs in this member.

2. Geological Background

The Ordos Basin, situated at the western frontier of the North China Platform, stands as a substantial hydrocarbon basin [20,31] (Figure 1a). The basin comprises six structural divisions, specifically the Yimeng uplift, Weibei uplift, Jinxi flexure belt, Yishan slope, Tianhuan depression, and West Rim thrust belt [32]. The primary oil reserves are located in the Shanbei Slope and Weihe Uplift (Figure 1b). During the Middle-Late Triassic period, a significant lake basin formed due to collision amid the North China Plate and Yangtze Plate as well as the Qinling orogeny resulting in thick Yanchang continental clastic deposits exceeding 1000 m. The Yanchang Formation can be divided into 10 oil-bearing layers from bottom to top (Chang 10–Chang 1), and its sedimentary characteristics reflect the whole process of the formation, development, and extinction of the lake basin [10] (Figure 1c). The Chang 7 sedimentary period was the maximum period of the paleo-lake area and deposited a thick set of high-quality source rocks, which are the main production layers of shale oil [11]. This member has a thickness ranging from 100 to 130 m with mudstone and shale thickness varying from 15 to 50 m (over 60 m in some areas) [33]. Situated at an elevation of 1470–1667 m within the central part of the Shanbei Slope is the Yanwumao area, considered a source region for the Shanbei loess featuring gullies, mounds, and ridges (Figure 1b). Sediments transported by gravitational forces, combined with the formation of shale oil, present indications of lacustrine sedimentation from deep to semi-deep environments [29,30,31]. The target layer of this research is the Chang 7 member, which develops semi-deep to deep lake subfacies.

3. Samples and Methods

A total of 10 core samples were obtained from two wells (named the W4223 well and W4227 well, respectively) in the Yanwumao area (Figure 1b). All samples (sample ID: S1–S10), taken from the Chang 7 reservoir (Table 1), are columnar core plugs with a diameter of about 2.5 cm and a length of about 8 cm. These sandstones came from shale oil reservoirs with strong heterogeneity, which have experienced strong compaction and cementation. These 10 samples were subjected to porosity and permeability, XRD, mercury intrusion porosimetry (HPMI), and nitrogen adsorption tests (LTNA). In addition, nuclear magnetic resonance testing (NMR) was conducted on samples S1 to S5.
Samples underwent porosity and permeability assessments utilizing a Poro PDP-200 overburden hole permeameter, with the testing procedure outlined in the SY/T 6385-2016 standard of China [34]. The Ultima IV X-ray diffractometer was utilized to analyze whole rock and clay components, determining types and contents of minerals including quartz, feldspar, carbonate, and clay. This analysis followed the testing procedure outlined in the SY/T 5163-2018 standard of China [35].
The HPMI experiment utilized an AutoPore IV 9500 mercury injection apparatus produced by American Instruments following the GB/T 29171-2012 standard of China [36]. Before experimentation, samples were dried at a constant temperature of 40 °C until weight stabilization occurred. The mercury injection experiment included pressurized mercury injection and depressurization with a maximum pressure of 200 MPa. Surface tension measured at 480 mN/m along with contact angle measurements taken at 140° informed this process, while expansion volume remained fixed at 0.05 mL. Pc refers to the mercury intrusion pressure expressed in MPa. The pore size distribution (PSD) can be derived from the resulting mercury injection curve based on the Washburn equation.
LTNA testing was conducted in conformity with the GB/T 21650.2-2008 standard of China [37], using an ASAP 2460 instrument manufactured by Micromeritics in the United States. All samples underwent vacuum drying at a temperature of 40 °C for 10 h to remove residual and capillary water. N2 adsorption and desorption isotherms were recorded under subcritical temperature conditions (77 K) by adjusting the relative pressure P/P0. The specific surface area (SBET) was calculated using the multi-point Brunauer–Emmett–Teller (BET) technique, while the Barrette–Joynere–Halenda (BJH) method was utilized for the analysis of pore size distribution (PSD).
For conducting the NMR experiment, GeoSpec2 equipment was employed following the SY/T 6490-2014 standard of China [38]. The T2 relaxation time of each sample was measured both when fully saturated and after centrifugation treatment. Key test parameters included a centrifugal speed of 6000 r/min, resonance frequency at 2 MHz, echo interval of 0.1 ms, a waiting duration of 6 s, echo count set to 8196, and 64 scanning cycles. Previous studies have successfully applied mercury injection data to convert nuclear magnetic resonance (NMR) T2 spectra into pore size to characterize pore structure [13,39,40,41,42,43,44,45]. Building upon these studies, this research proposed applying the pore radius (r) derived from HPMI and LTNA experiments to convert T2 spectra, thereby characterizing the full PSD of reservoirs. Previous research has proposed an exponential relationship between T2 and pore radius [2]:
T 2 = r n ρ 2 F s
where Fs represents a dimensionless factor related to pore shape; n stands for a dimensionless power exponent. When 1 / C = ρ 2 * F s , Formula (1) can be written as follows:
r = C T 2 1 / n
Therefore, the T2 values can be converted to r by calculating C and n (Figure 2). For the specific determination, refer to previous studies [10,41,46,47,48,49].

4. Results

4.1. Reservoir Petrological Characteristics and Petrophysical Properties

After analyzing the CTS and SEM, it can be observed that the samples primarily consist of lithic arkose and feldspathic litharenite (Figure 3). The XRD data (Table 1) reveal that quartz is the dominant detrital grain component, accounting for 15.8–41% (with an average of 29.27%), followed by feldspar with a range of 17.4–40.3% (average: 31.26%) and clay ranging from 11.2% to 64.1% (with an average of 24.41%). Most samples exhibit low carbonate contents. Most of the samples had a low content of carbonate and clay minerals, while S3, S5, S8, and S10 samples exhibited a high content. Amidst the diverse array of identified clay minerals, illite constitutes the highest proportion at an average value of approximately 19.65%, followed by mixed layers consisting of illite/smectite (I/S) at around an average value of 17.45%, chlorite being present at approximately equal proportions averaging about 19.12%, and kaolinite exhibiting relatively lower content levels averaging approximately 7.14%. The porosity of Chang 7 reservoirs varies from 3.58% to 7.88%, averaging at 5.39%. In terms of permeability, it spans from 0.0024 mD to 0.0655 mD in air, averaging 0.02989 mD (Table 1). Notably, sample S8 exhibits the lowest quality among all reservoirs, displaying a porosity of merely 3.925% and a permeability as low as only 0.003 mD. Based on a detailed core observation and CTS (Table 2), three lithofacies have been identified: massive fine-grained sandstone (Sfm), silt-fine sandstone with graded bedding (Sfgb), and silt-fine sandstone with parallel bedding (Sfp).

4.2. Pore Types

Based on the analysis from CTS and SEM data, the predominant pore types encompass residual intergranular pores, dissolution pores, intercrystalline pores, and microfractures (Figure 4a–f). Most residual intergranular pores are triangular and are formed because of compaction, with an ore diameter higher than 25 μm (Figure 4a,d,f). Dissolved pores are mainly formed from mineral particles subjected to substantial dissolution, which are common in feldspar grains (Figure 4a,d–f). These pores have a relatively poor connection and usually have irregular geometric shapes, with pore diameters generally less than 5 μm. Intercrystalline pores are mainly formed by clay cements such as illite, I/S, and chlorite (Figure 4b,c). A few microfractures related to diagenesis are present in reservoirs (Figure 4b), which are commonly well connected.

4.3. Quantitative Pore Parameter Characterization
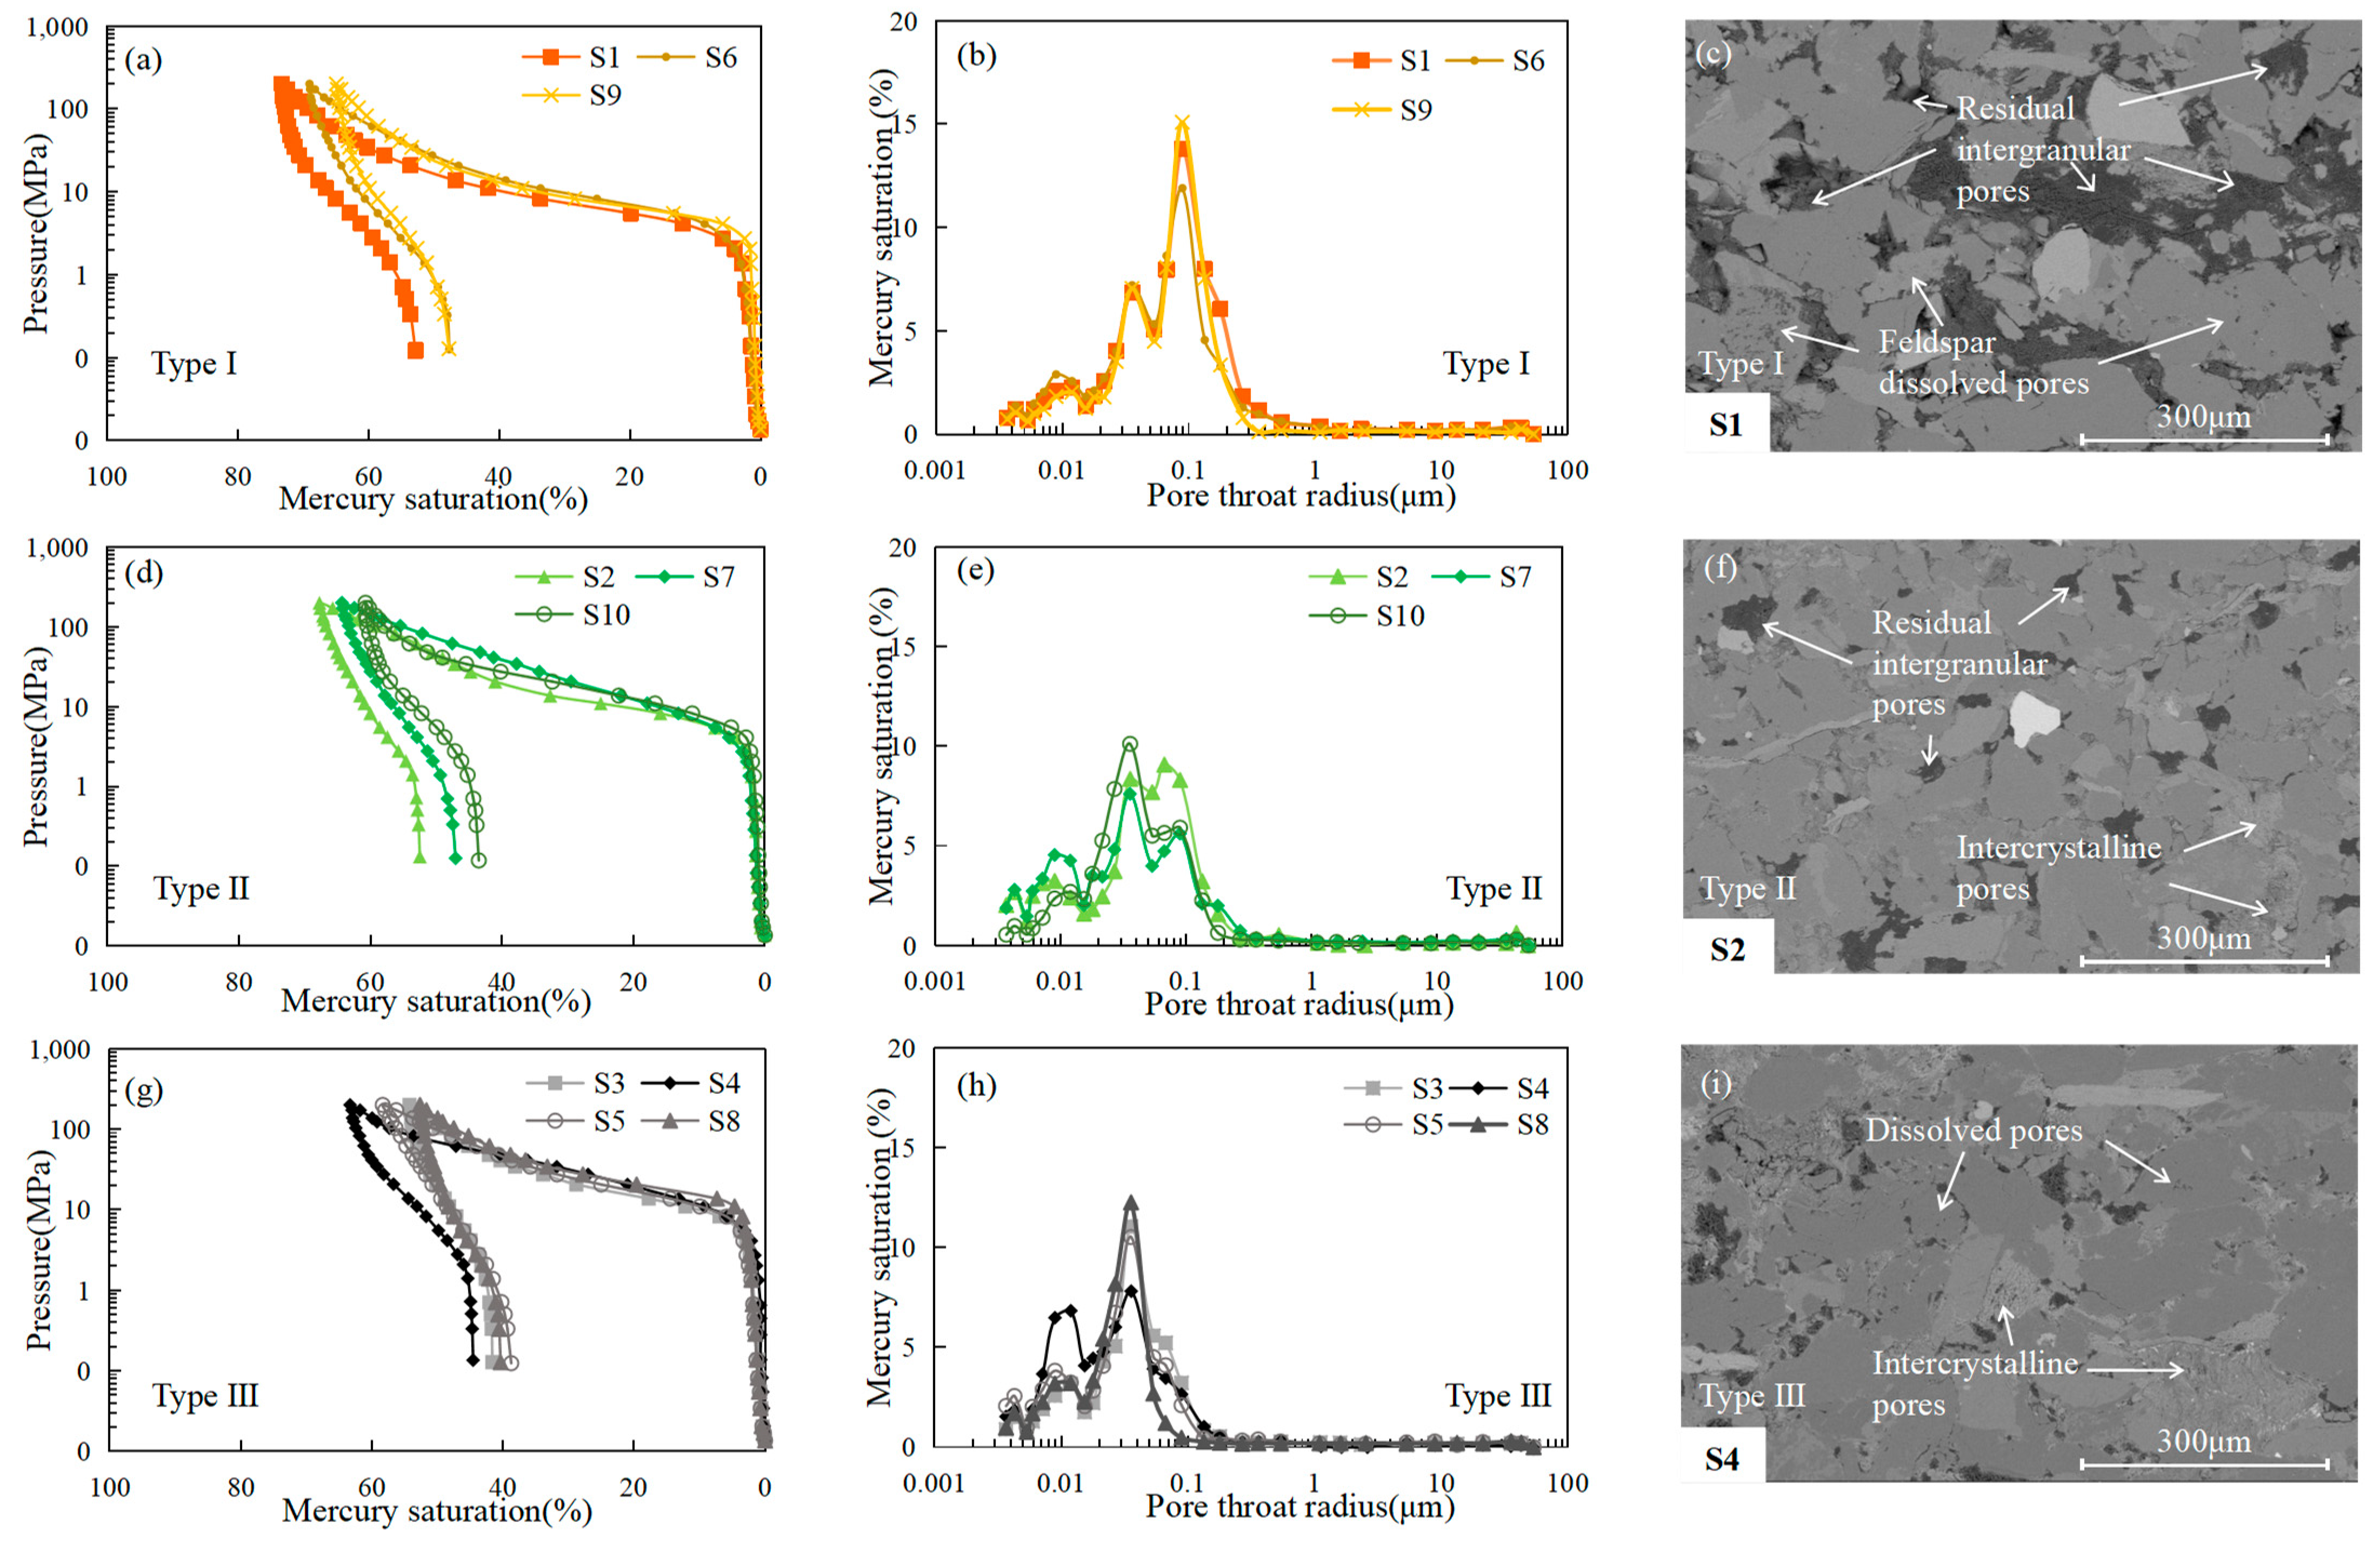
4.3.1. HPMI Curve

According to the HPMI curve morphology and the pore distribution, the samples’ pore structures were categorized into three types (Table 3, Figure 5). Type I pore structures have a gentle and long section (Figure 5a–c). The threshold pressure (Pt) value is below 2.74 MPa, indicating larger pores within this category. These pores exhibit a unimodal size distribution with the peak mainly concentrated around 0.1 μm, while having an average radius of 0.070 μm, suggesting that they are relatively large and concentrated. On average, this type shows maximum values for mercury saturation (69.04%) and mercury retreat efficiency (28.46%), implying a higher storage capacity and connectivity within its pore structures. The combination types for this category of samples primarily consist of residual intergranular pores and feldspar dissolution pores.
Type II pore structures exhibit a gentle and short section in their capillary pressure curves (Figure 5d–f), while the corresponding distribution of pore sizes shows a bimodal characteristic. The Pt ranges from 2.73 to 4.12 MPa, averaging 3.19 MPa. These formations possess both larger and more numerous smaller pores, leading to significant heterogeneity in their size distribution patterns. It is important to note that compared to Type I pore structures, Type II ones demonstrate lower maximum mercury saturation and mercury retreat efficiency, with respective average values of 64.27% and 26.91%. This suggests limited connectivity within this category of structures of pores.
Pore configurations of Type III structures display increased displacement pressures and narrow radii of the pores (Figure 5g–i). The Pt spans between 5.48 and 11.02 MPa, averaging 6.87 MPa. The distribution in pore sizes exhibits a single peak centered around 0.04 μm, indicating the presence of numerous nano-scale pores in this sample type and emphasizing significant heterogeneity within the network of pores. Additionally, there is a noticeable decrease in both maximum mercury saturation and mercury retreat efficiency for this category of samples, averaging 57.14% and 26.73%, respectively, suggesting poor connectivity in this type of pore structure. These samples primarily consist of intercrystalline pores combined with a relatively dense rock matrix characterized by fewer larger-radius pores.

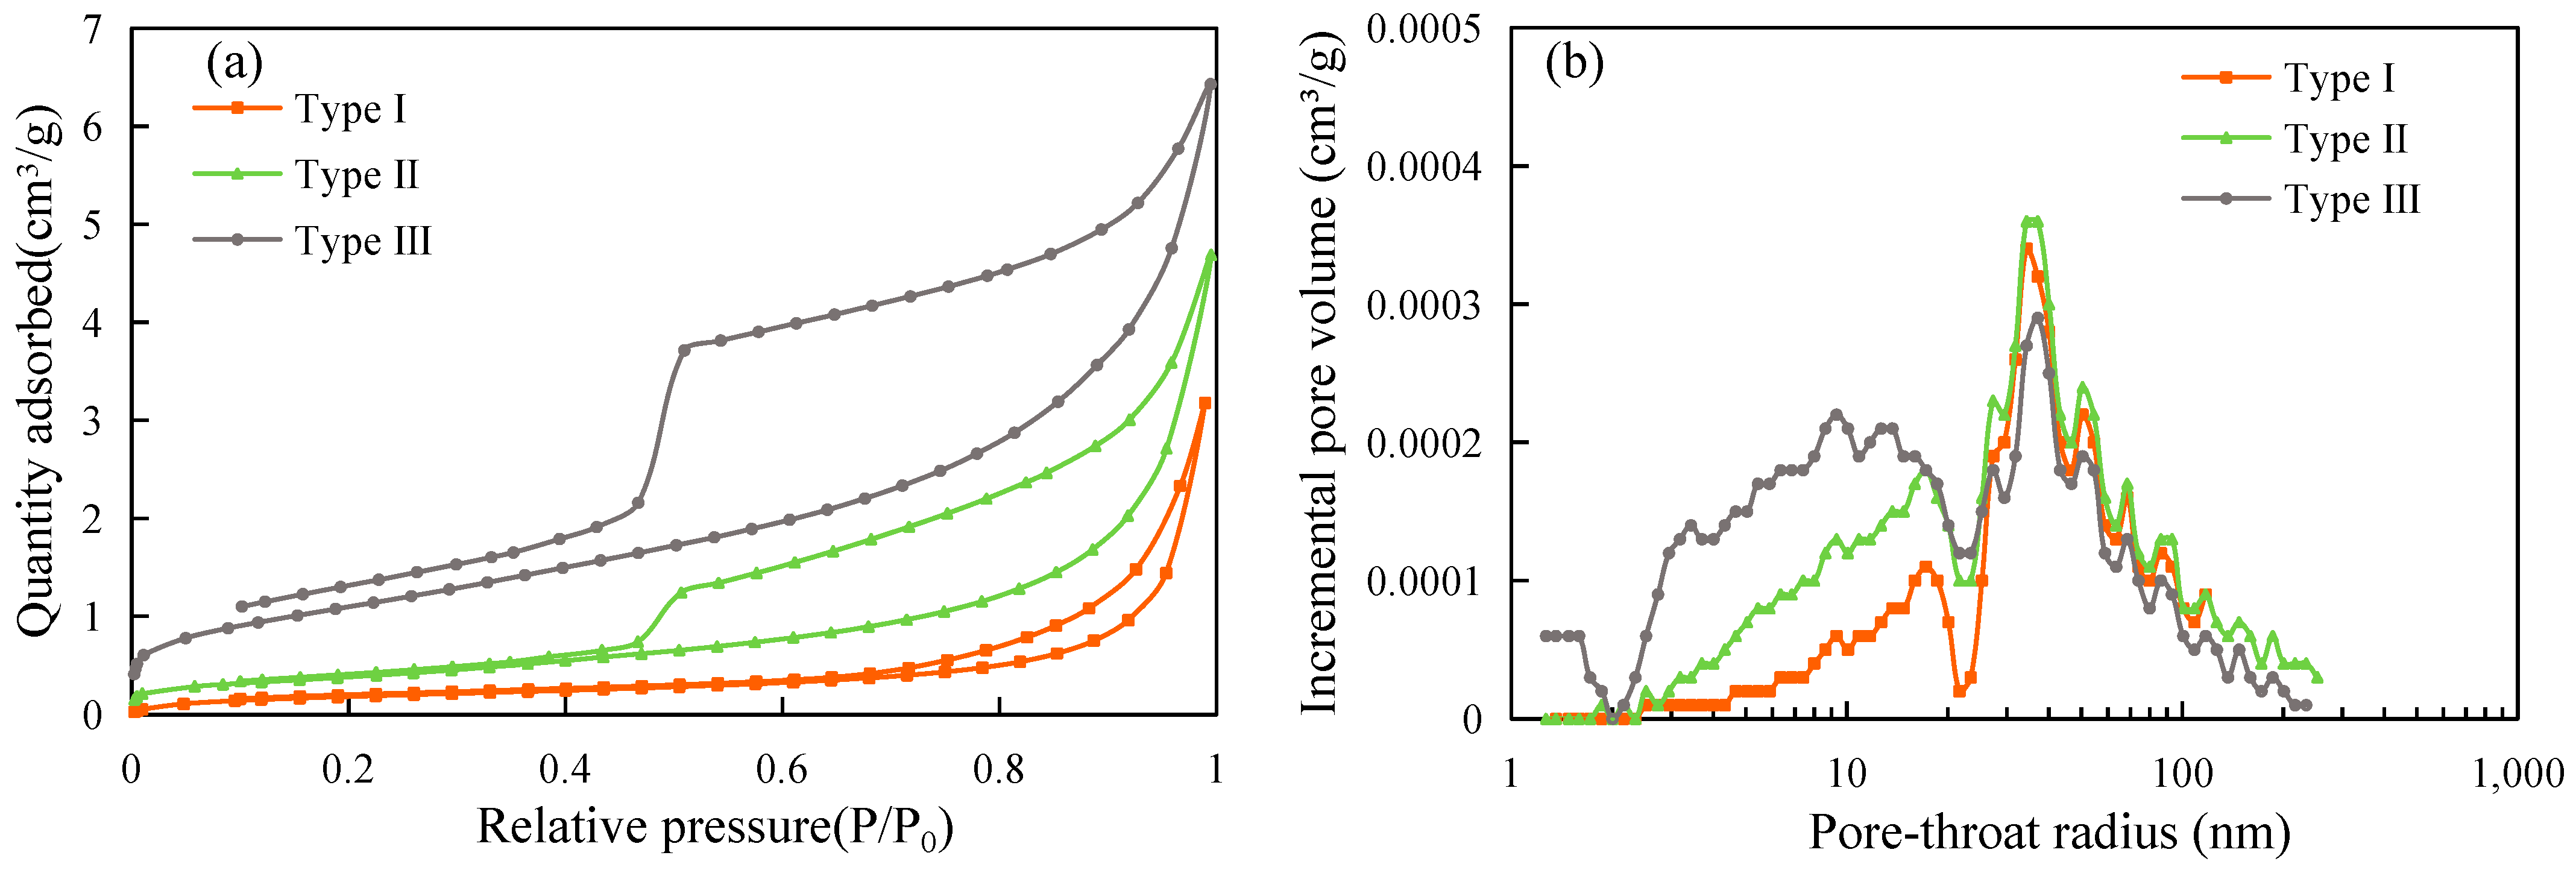
4.3.2. N2 Adsorption Isotherms

The measured isotherms of all samples are in type II adsorption shape [50], featuring a distinct hysteresis curve when P/P0 > 0.45 (Figure 6a). The patterns observed in adsorption and desorption isotherms indicate the pore structure of the porous material [51]. The isotherms for adsorption–desorption were divided into three categories, aligning with the classification of pores under high-pressure mercury (Figure 6).
Across pore structures ranging from Type I to Type III, there was an overall upward shift in the adsorption–desorption isotherms of the specimens, and the area of hysteresis loops gradually increased (Figure 6), indicating that Type III samples contained a higher number of smaller pores, dominating the primary pore area, capable of adsorbing a large amount of nitrogen gas, which correlates with the outcomes obtained from high-pressure mercury experiments. The samples exhibited a progressive increase in the average BET specific surface area (SBET) and the average BJH total pore volume (Vads) from Type I to Type III, while the average BJH pore radius (Rp) decreased (Table 3).

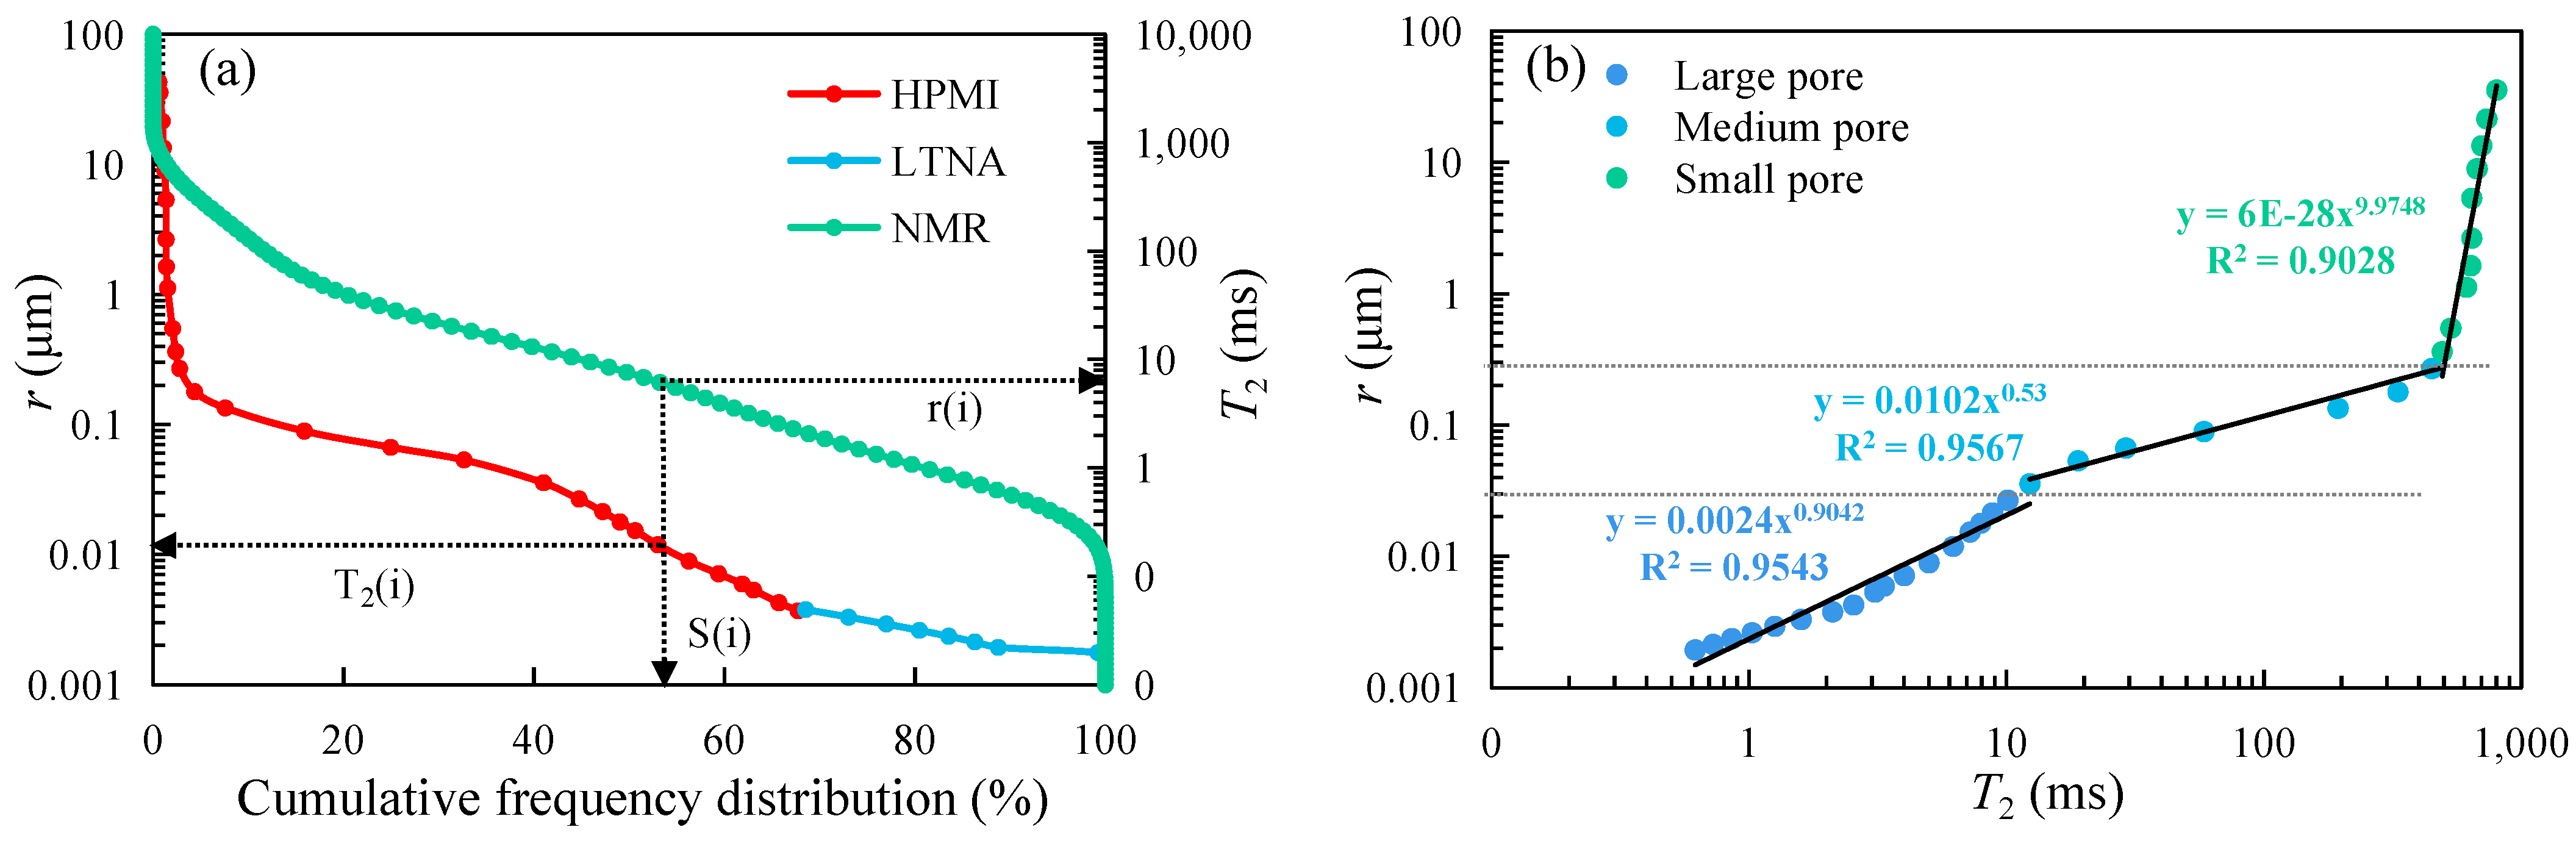
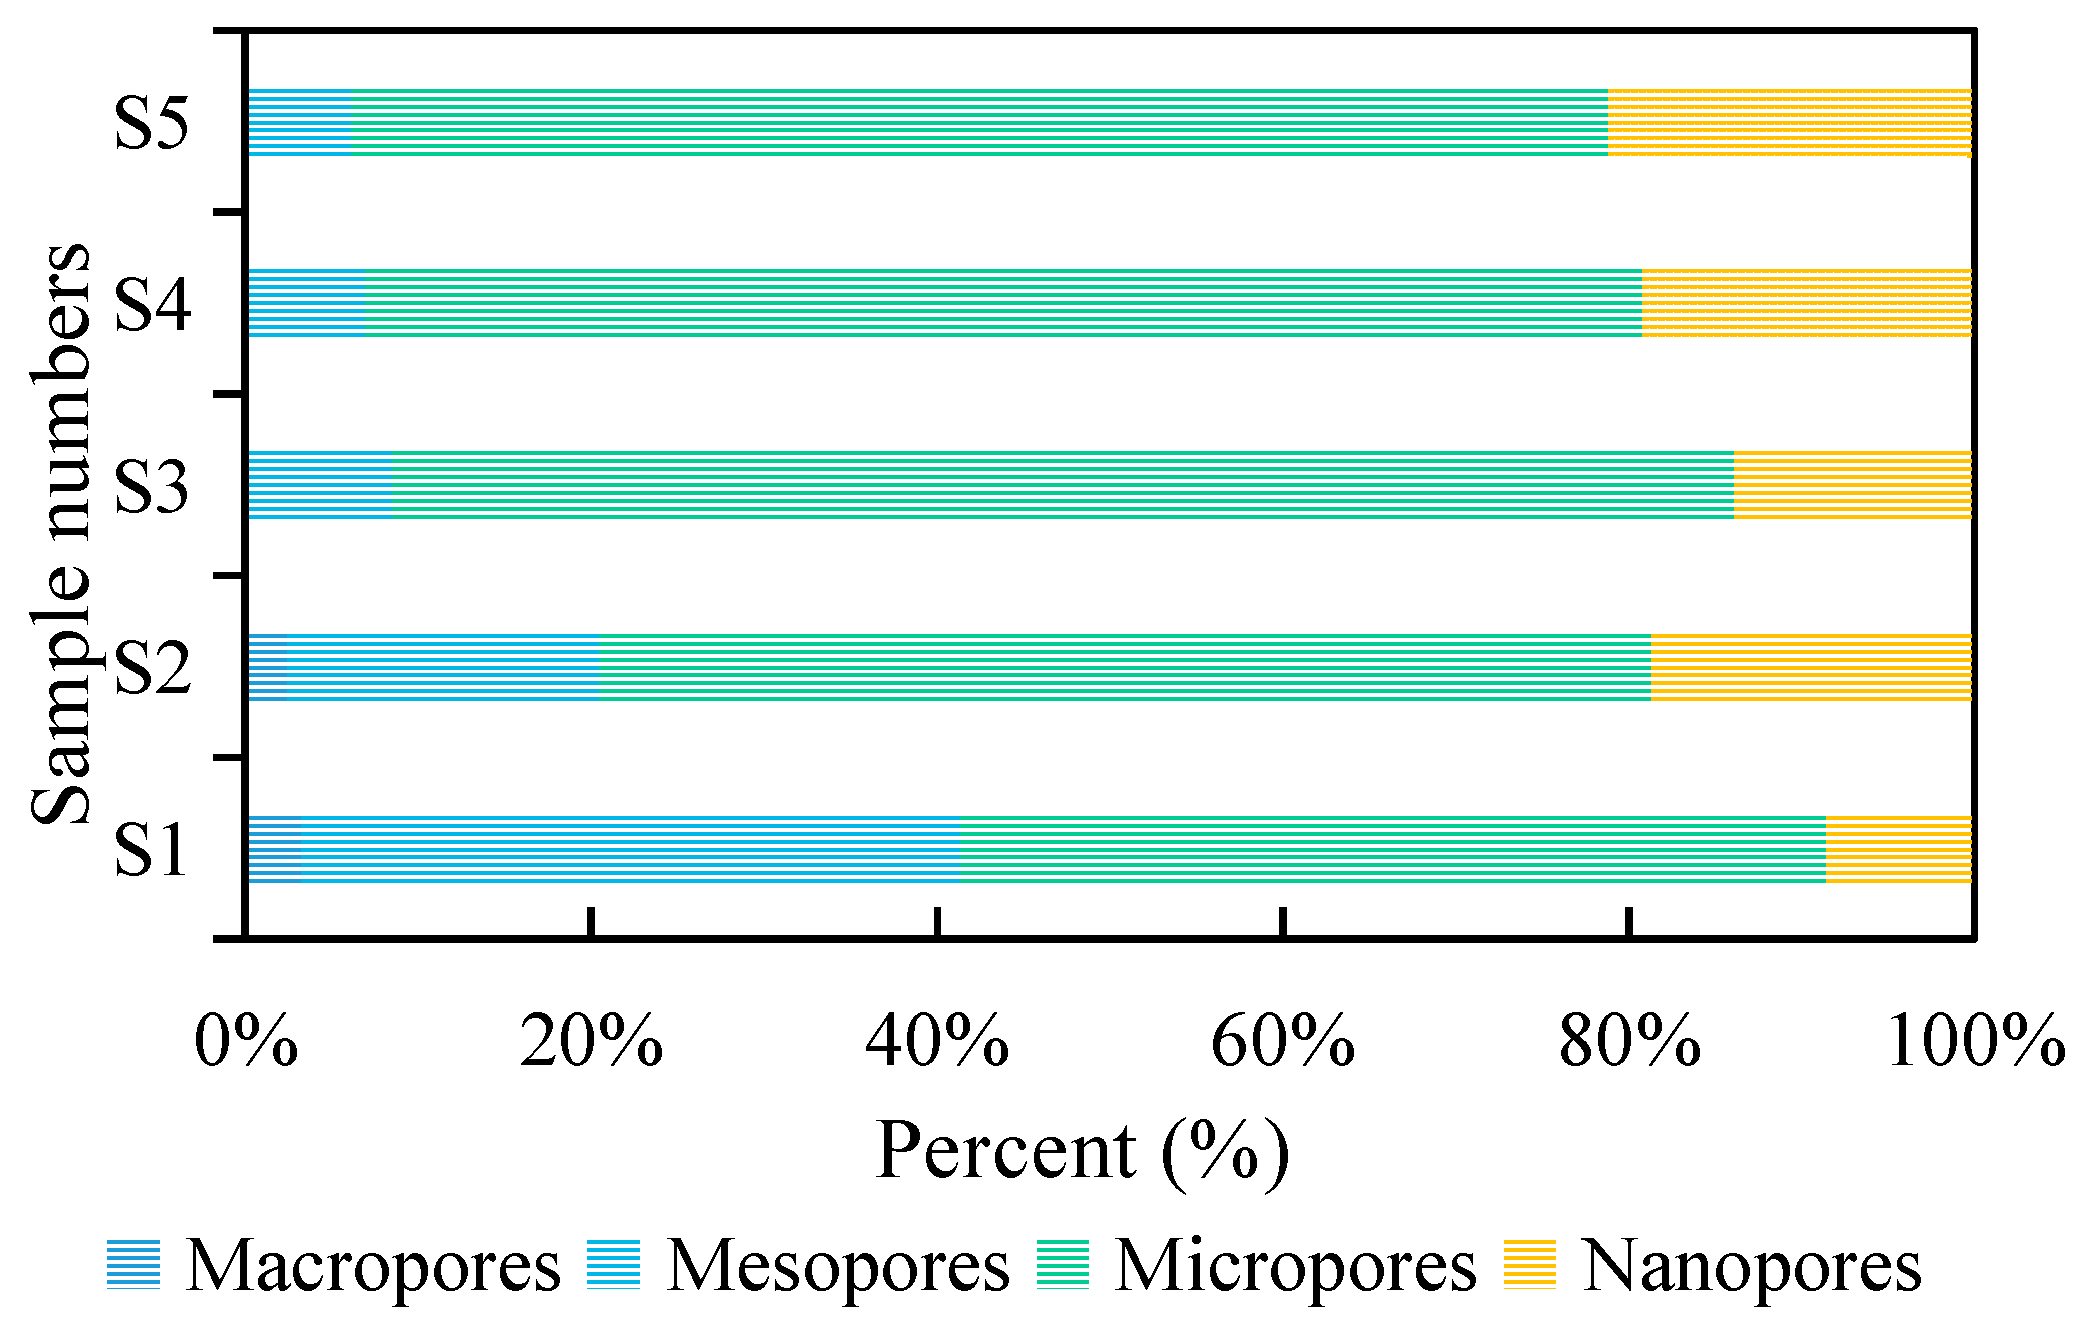
4.4. Complete Pore Dispersion on a Full Scale

The NMR T2 spectra of movable fluids were converted using the PSD derived from integrated HPMI and LTNA experiments (Table 4). Figure 7 shows the comparison between the PSDs converted from the NMR T2 spectrum and obtained from LNTA and HPMI experiments. The two curves share similar ranges, with matched pore peaks, indicating that the PSD in shale oil reservoirs can be effectively characterized with the PSD curve derived from the NMR T2 spectrum.
According to pore radius, the pores were divided into nanopores (<0.01 μm), micropores (0.01~0.1 μm), mesopores (0.1~1 μm), and macropores (>1 μm). The proportions of different types of pores were determined through calculations (Figure 8). The findings indicated that micropores constituted the majority, accounting for an average of 65.87%. Nanopores and mesopores followed with average proportions of 16.04% and 15.46%, respectively. Macropores had the smallest representation, averaging 2.63%. Additionally, pore structures of Type I and II were predominantly composed of mesopores, with Type I exhibiting a higher presence of mesopores, whereas Type III pore structures mainly comprised micropores and nanopores, suggesting that diverse pore configurations within the shale oil reservoir resulted from the development and combination of various types and sizes of pores.

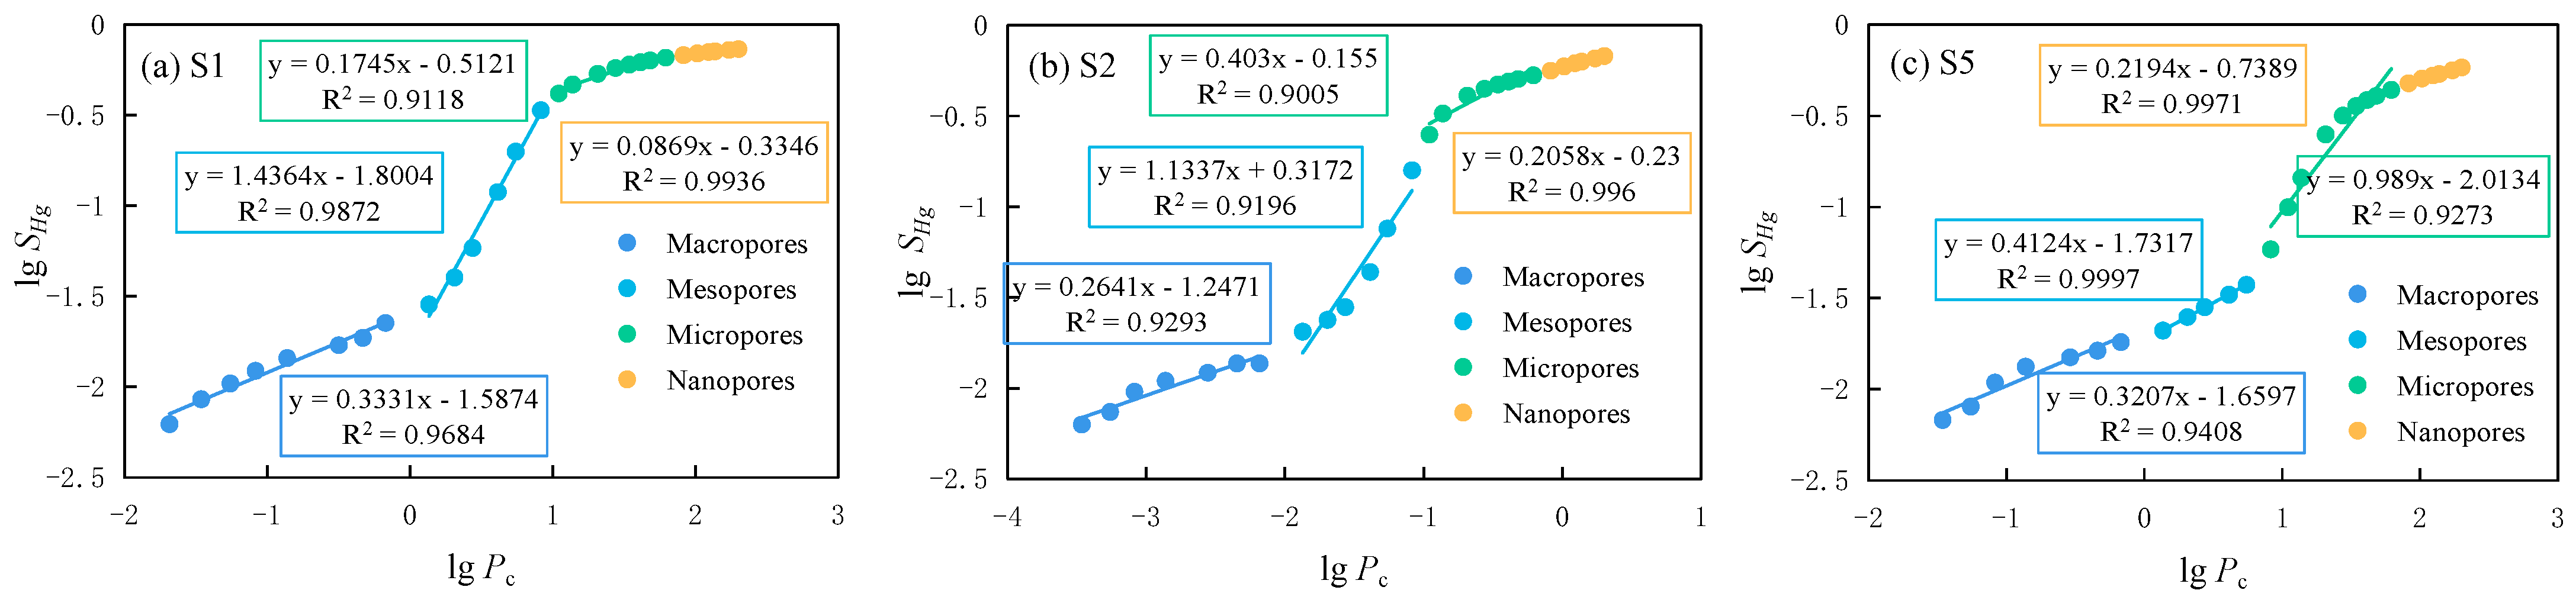
4.5. Fractal Characteristics of Pore Structure

Fractal theory is frequently utilized in the analysis of intricate and self-similar irregular pores, providing an effective approach for characterizing pore structures. Currently, fractal theory is extensively used to study the microscopic pore structures of rocks [46,48]. The internal pore structure of porous rocks typically exhibits a non-integer dimension, with an ideal fractal dimension (D) value ranging between 2 and 3 [52]. D = 2 signifies highly uniform pore structures, while D = 3 indicates significant heterogeneity. The fractal dimension can be determined with various experiments, such as HPMI, LTNA, and NMR [50,51,52]. Among them, HPMI experiments are commonly used to describe pore structures with wide pore sizes [11]. Therefore, the HPMI experimental data were used to calculate the D value of shale oil reservoirs in the study area.
According to the calculation model of fractal dimension showed in previous studies [53,54], the mathematical formula can be expressed as follows:
lg   S H g = ( D 2 ) lg   p c + C
where SHg represents mercury saturation %, C represents a constant, and D represents the fractal dimension. D can be obtained by fitting the slope (K) of the curve between lg SHg and lg Pc in the double logarithmic coordinates. And the fractal dimension is D = K + 2 .
The D values of all samples can be divided into four phases (Figure 9), indicating a clear multifractal nature in the pore structure. D1, D2, D3, and D4 denote the fractal measurements of macropores, mesopores, micropores, and nanopores, respectively [10,48,55]. The correlation coefficient (R2) surpasses 0.9 (Table 5), indicating a high correlation coefficient. Figure 9a shows that non-wetting mercury first enters macropores at sample S1. After that, the available mercury volume changes slightly with increasing pressure. However, the entered mercury volume increases sharply at r = 0.1–1 μm, where pressure is slightly changed, indicating that mercury enters mesopores. Finally, mercury enters micropores and nanopores.
The fractal feature curves of representative samples are displayed in Figure 9a–c. Analysis of the fractal characteristics of the samples showed that mesopores and micropores had higher fractal dimensions, while macropores and nanopores had lower fractal dimensions. This indicates that mesopores and micropores have stronger structural heterogeneity and more complex pore size distributions. It is worth noting that from Type I to Type III (Table 5), D2 gradually decreased, while D3 gradually increased. The primary cause for this phenomenon is the enhanced occurrence of carbonate minerals and clay minerals, which occupy the pore spaces with wider radii. As a consequence, there is an augmentation in surface roughness and intricacy within the pores, leading to an increased abundance of micropores and significant heterogeneity within them.

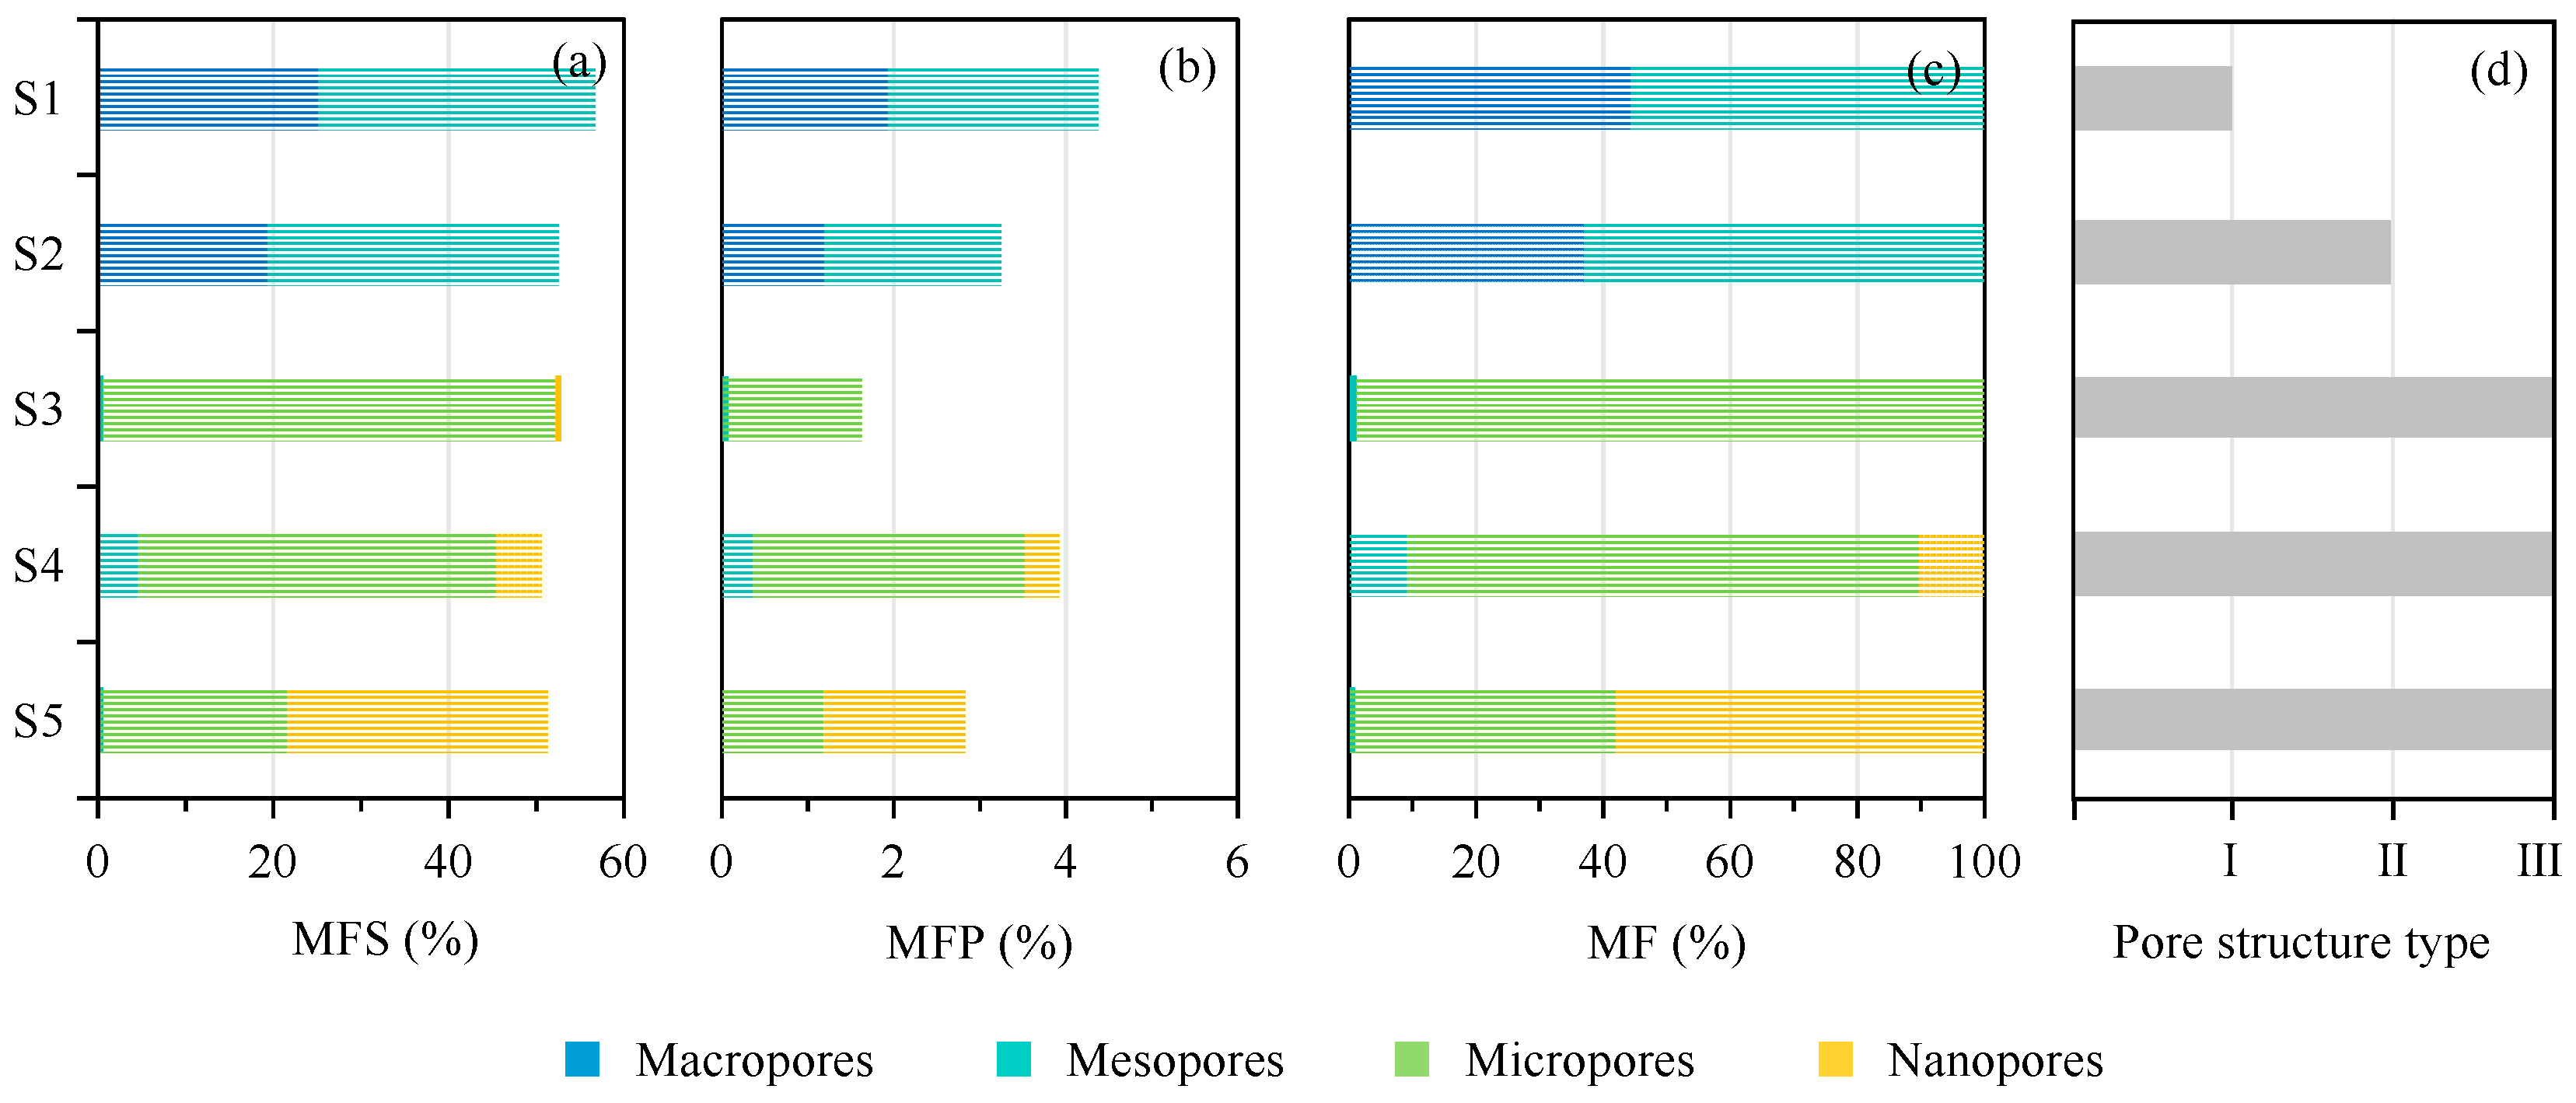
4.6. Distribution of Mobile Fluids

The T2cutoff, movable fluid saturation (MFS), and movable fluid porosity (MFP) can be obtained from the NMR experiment (Figure 10 and Figure 11). At the intersection point of the T2 spectral accumulation curve of the saturated sample, the corresponding relaxation time T2 represents the T2cutoff [12]. The MFS varies between 50.64% and 56.76%, averaging approximately 52.714%. Similarly, the MFP falls within a range of 1.6311% to 4.3875%, with an average value close to 3.2049%. Moreover, notable disparities in fluid mobility were observed among assorted pore configurations: Type I pore structures exhibited a strong storage capacity and permeability, accompanied by excellent interconnection among pores leading to the utmost fluid mobility; Type II pore structures demonstrated limited reservoir fluid mobility due to poor selectivity and connectivity of pores; Type III pore structures displayed heterogeneous characteristics and weak connectivity among pores resulting in the lowest level of fluid mobility.
As the nuclear magnetic resonance T2 spectrum depicts the movable fluids’ distribution inside the reservoir pores, the converted full aperture PSD can be expressed with the frequency distribution of movable fluids across varied pore radii; additionally, it allows for the computation of movable fluid attributes concerning diverse pore types (Figure 11). The results showed that in samples S1 (Type I) and S2 (Type II), predominantly, the mesopores harbored the distribution of mobile fluids, which was mainly because mesopores not only occupied higher storage spaces but also had larger pore radii. In Type III, movable fluids were mainly distributed in the micropores, mainly because macropores and mesopores had larger pore radii, contributing the highest permeability to the samples, but their proportions of pore space were the smallest, resulting in the lowest MFS and MFP.

5. Discussion

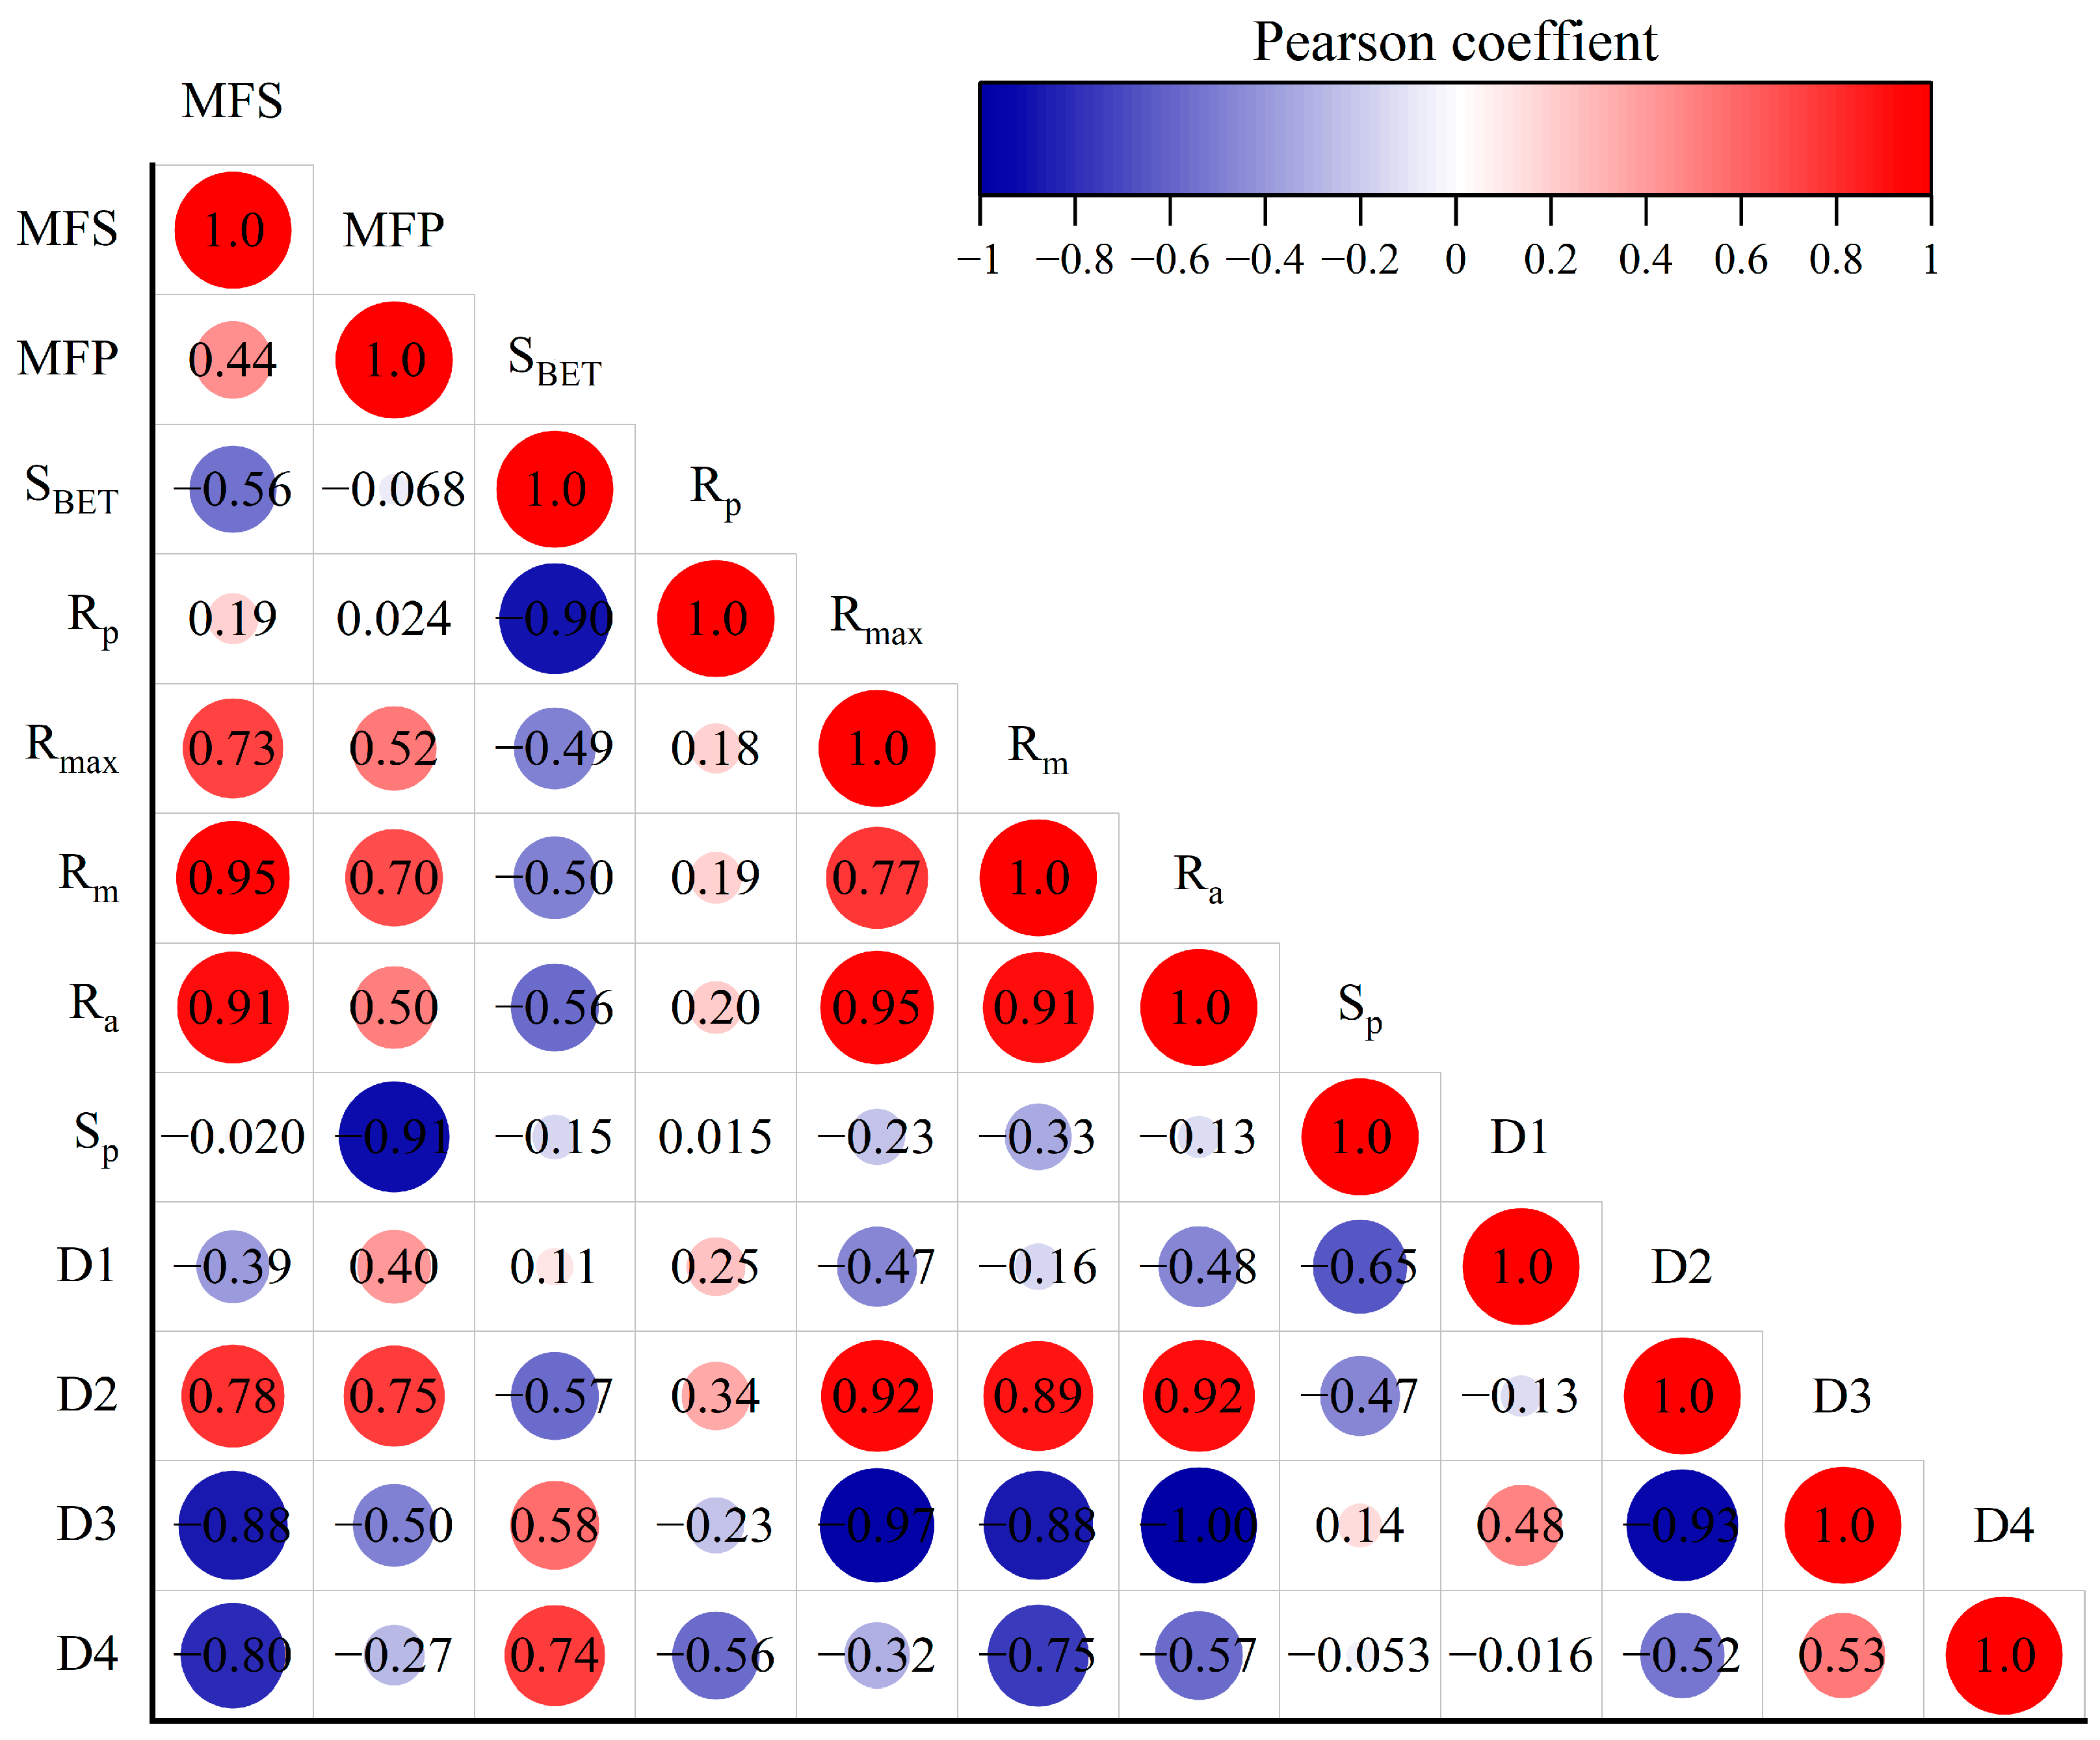
5.1. Connection between Fluid Mobility and the Pore Structures

The SBET demonstrates an inverse relationship with MFS and MFP (Figure 12), suggesting that a higher SBET hinders fluid flow. This can be attributed to the fact that nanopores and micropores contribute to the SBET, creating significant spaces for bound fluid adsorption and impeding fluid movement. Rp exhibits a slight positive correlation with MFS and MFP, indicating that reservoir fluid flow capacity is minimally affected by nanopore development. In contrast, Rmax, Rm, and Ra show significantly positive correlations with MFS and MFP (Figure 12), implying that larger pores could enhance fluid flow capacity [56]. Additionally, Rp shows weak positive correlations with Rmax, Rm, and Ra; however, these correlations are only 0.184, 0.195, and 0.205, respectively (Figure 12). Therefore, LTNA and HPMI can influence the distribution of movable fluids based on pore radius but their effects on movable fluids are relatively independent.
The sorting coefficient (Sp) is a character vector to represent pore homogeneity [55]. Generally, the closer the value is to zero, the better the homogeneity, and vice versa [10,13,39]. The Sp of the test samples is mainly between 1.5 and 2.0 (Table 3), indicating moderate sorting. MFS and MFP are negatively correlated with Sp (Figure 12), indicating that as Sp decreases, there is an enhancement in pore distinctiveness, leading to improved fluid mobility.
The correlation between movable fluid parameters and diverse pore sizes was examined to explore their association with movable fluids (Figure 13). The results demonstrate a favorable relationship between the movable fluid parameters and the proportion of pores in both mesopores and nanopores. Importantly, the association between movable fluid parameters and mesopores is significantly stronger than that of nanopores. The movable fluid parameters show an adverse correlation with the proportion of micropores. This occurrence highlights that mesopores primarily govern MFS and MFP, while the shift from bound fluid to movable fluid is governed by micropores.

5.2. Effect of Heterogeneity in Pore Structure on Fluid Mobility

D1, D3, and D4 also exhibit negative correlations with movable fluid parameters, implying that high heterogeneity negatively impacts fluid flow capacity in micropores and nanopores. However, D1 only shows a weak correlation with MFS and MFP. Conversely, D2 exhibits a robust positive relationship with parameters indicating fluid mobility, and correlation coefficients exceeding 0.7 (Figure 12). Similarly, movable fluid parameters positively correlate with both D3 and D4 with correlation coefficients surpassing 0.5 (Figure 12), suggesting a similar influence on movable fluids by these variables. The association between D3 and movable fluid parameters is stronger than that of D4 which suggests that heterogeneity in micropores can have a more significant impact on movable fluids compared to macropores and nanopores. It is noteworthy that there is a strong positive correlation between D2 and Rmax/Rm/Ra, whereas opposite correlations are observed for D1/D3/D4 indicating different controlling factors on heterogeneity across different pore ranges. In general terms, strong heterogeneity in mesopores hampers the occurrence of movable fluids compared to nanopores and micropores but does not affect macropore systems.

5.3. Relationships between Lithofacies and Fluid Mobility

The Sfm lithofacies are usually located within multi-stage overlapped sand bodies, primarily deposited in gravity flow channels (Figure 14a,b). The Sfp lithofacies appear in the interbedded sand-mud sequence, with finer grain sizes than Sfm, also deposited in turbidite channels (Figure 14a,c), indicating that it is farther away from the source area than the Sfm lithofacies [57,58]. The pores of these two types of lithofacies are large, and movable fluids are mainly hosted in the macropores and mesopores (Figure 14e,f), which contributes to the enhanced fluid mobility observed in the Sfm sandstones. The Sfgb lithofacies predominantly form within clay-rich environments, interspersed within thin sandstone and mudstone beds, primarily in turbidite sheet sands (Figure 14a,d). These lithofacies sandstones often contain a large amount of carbonate cement or clay matrices [12]. Strong carbonate cementation or massive clay mineral filling in this type of lithofacies sandstones shrinks the macropores and mesopores so that movable fluids are predominantly found in micropores (Figure 14g). As a result, Sfgb sandstones have less fluid mobility and poorer physical properties. It is worth noting that the MFS of micropores and mesopores in the Sfm lithofacies is higher than the other two lithofacies, while the MFP of nanopores shows the opposite trend. Hence, Sfm lithofacies exhibit better pore connectivity and enhanced fluid mobility due to their larger pores compared to other lithofacies. These results indicate that Sfm lithofacies sandstones are relatively promising prospects for exploration purposes.

6. Conclusions

(1)
Following a comprehensive examination of the pore structure in the Chang 7 shale oil reservoirs, it was observed that three distinct types exist. Type I mainly developed residual intergranular pores and feldspar dissolution pores, manifesting bimodal pore diameter curves with the highest MFS and MFP values. The curves of the pore size distribution in Type II displays unimodal characteristics indicating good pore connectivity, with higher fluid mobility. Type III is mainly dominated by dissolved pores and intercrystalline pores, showcasing an inadequate relationship in the configuration of pores, consequently leading to the lowest fluid mobility.
(2)
The pore structure of the Chang 7 shale oil reservoir plays a significant role in controlling fluid mobility. High fluid flowability is attributed to favorable petrophysical properties and large pores. Mesopores mainly control MFS and MFP, and micropores primarily dictate the shift from bound fluid to movable fluid. The pronounced heterogeneity of mesopores significantly impairs the fluidity of reservoir fluids.
(3)
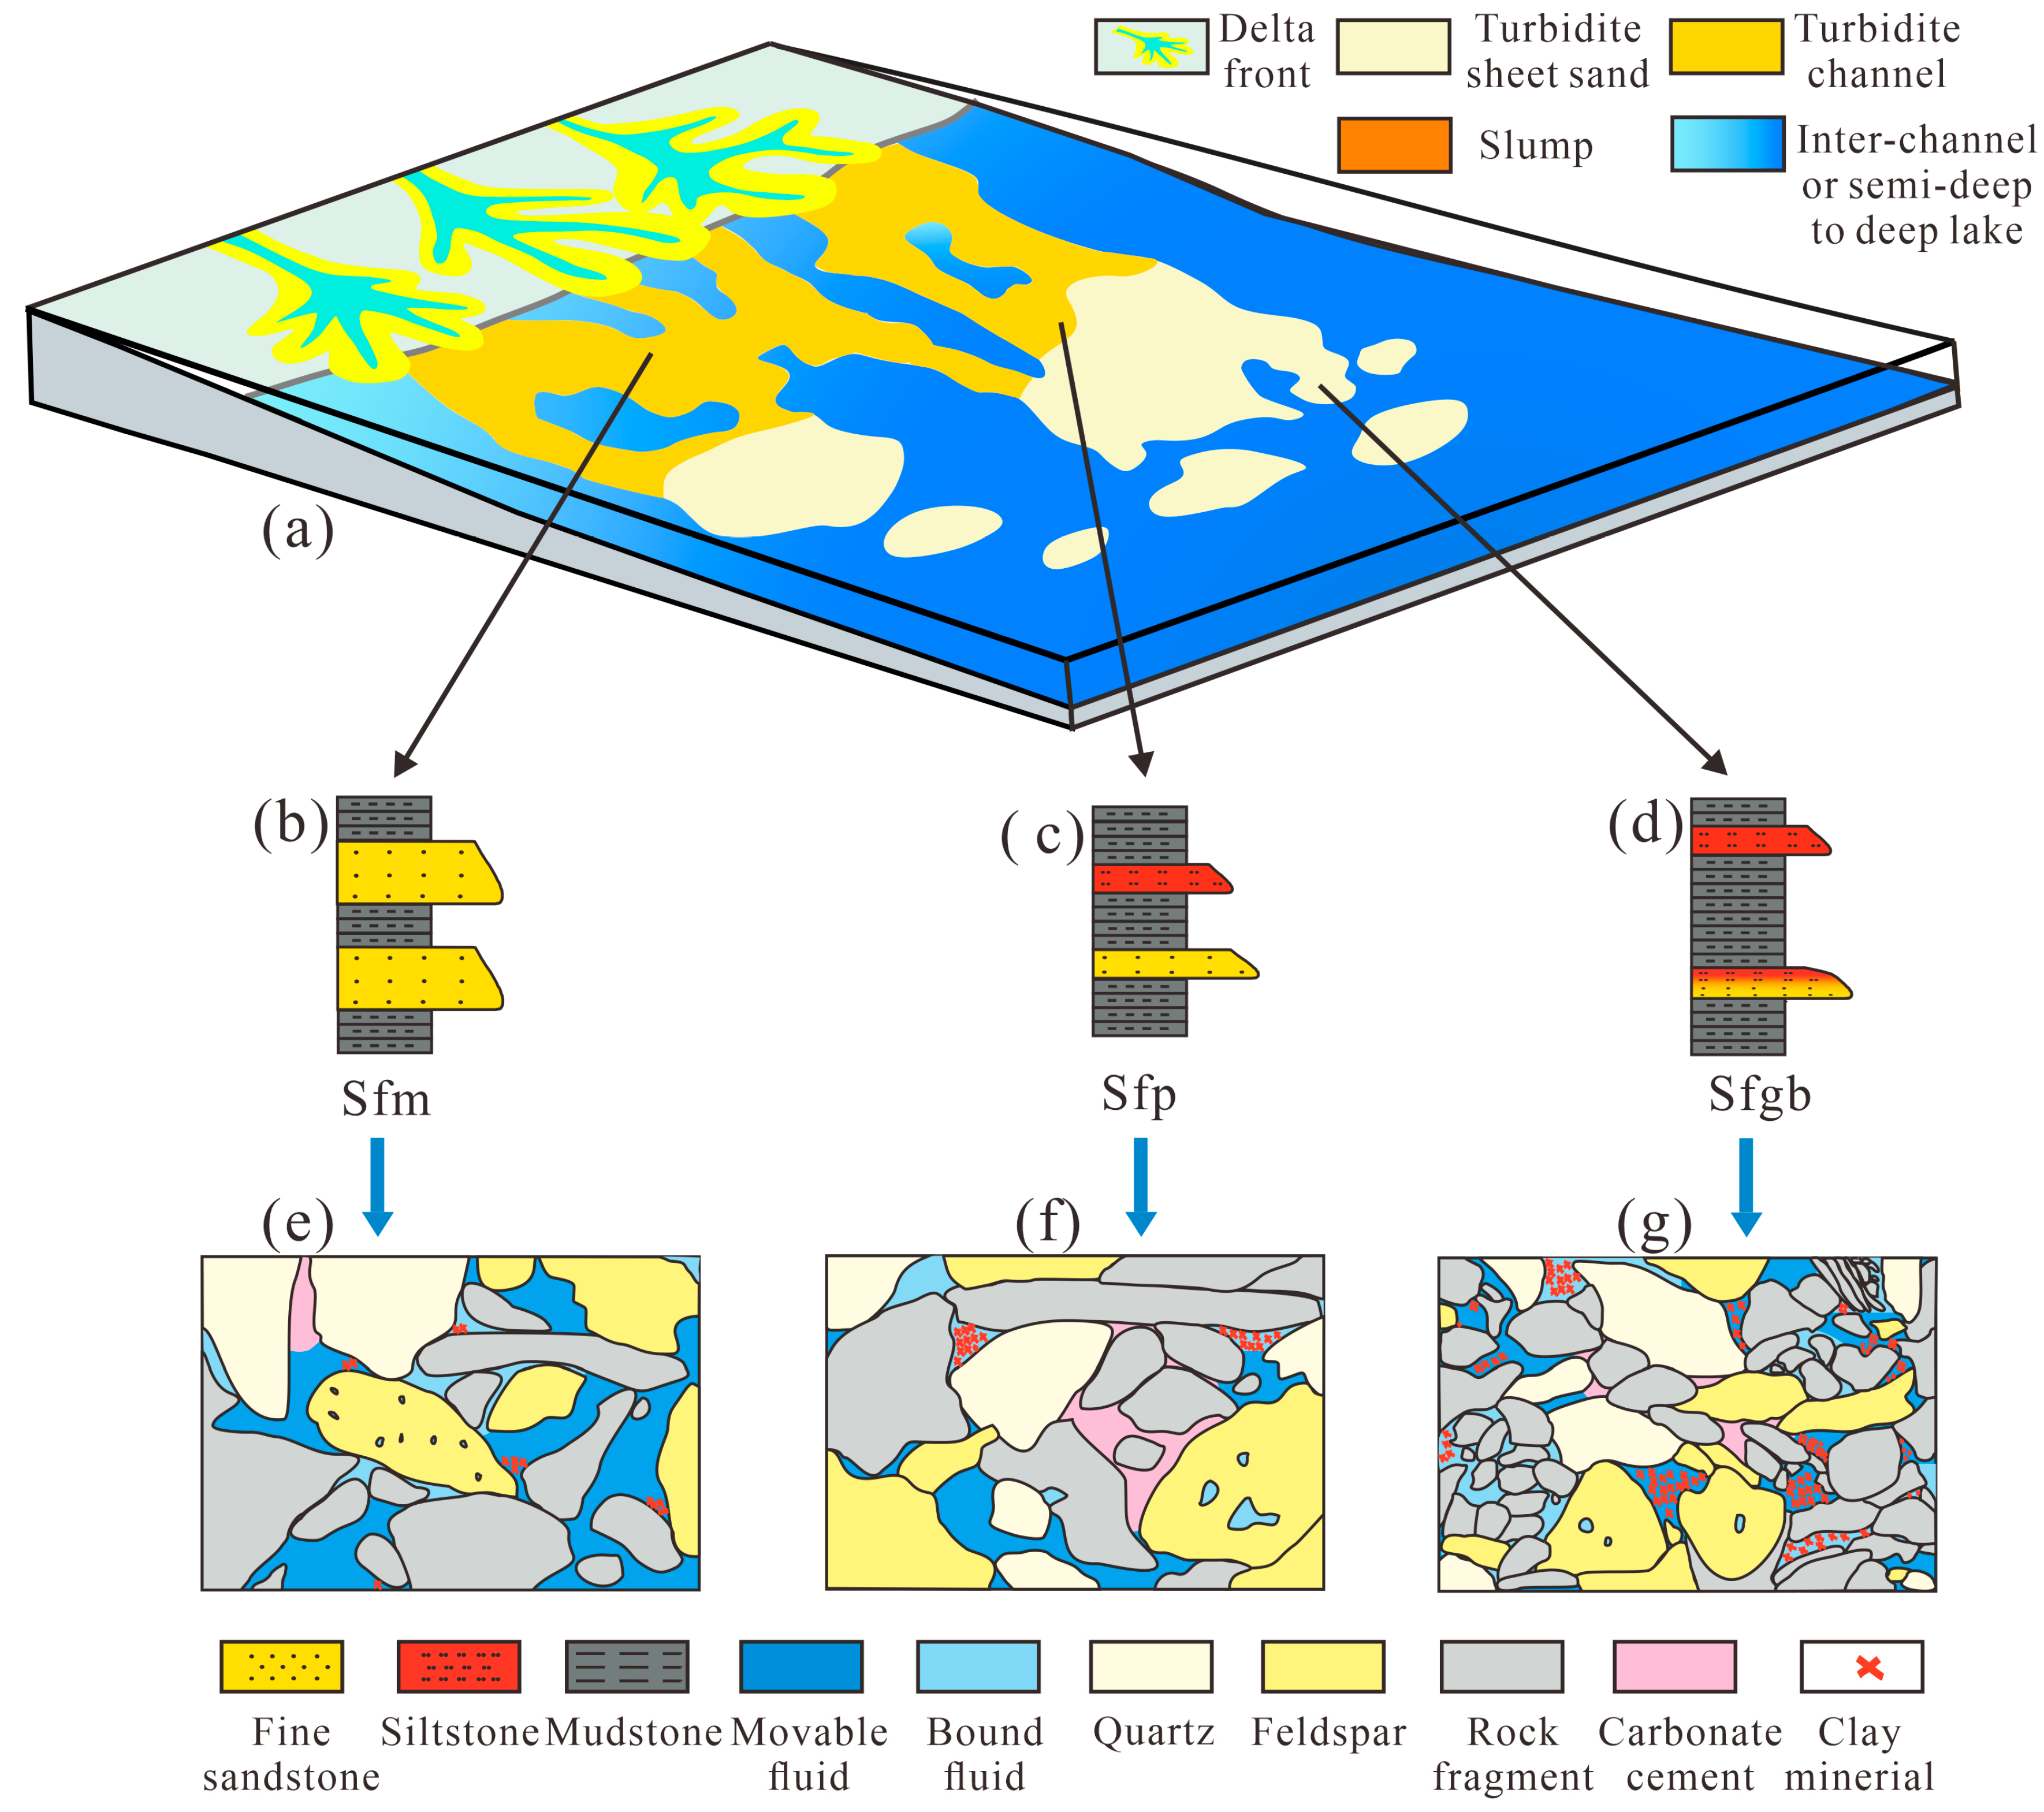
The lithofacies in the Chang 7 shale oil reservoirs exhibit various fluid mobilities. The lithofacies characterized by massive fine-grained sandstone (Sfm) exhibit the highest fluid mobility due to the large proportion of macropores and mesopores. In contrast, graded bedding and silt-fine sandstone lithofacies (Sfgb) have lower fluid mobility due to the abundance of micropores. The decrease in the proportion of macropores in the parallel bedding and silt-fine sandstone (Sfp) lithofacies leads to medium fluid mobility.
In summary, this study emphasizes the importance of pore structure in controlling fluid flow in the Chang 7 shale oil reservoirs. Understanding the different types of pore structures and their effects on fluid flow can help develop more effective production strategies. In addition, further studies can be conducted to investigate the potential impact of reservoir characteristics, such as mineral composition and organic matter content, on fluid flow. By gaining a deeper understanding of the fluid flow characteristics in shale oil reservoirs, China can develop more effective extraction strategies to increase domestic shale oil production. This is important for China as it will reduce its dependence on imported oil, increase energy security, and boost its domestic economy.

Author Contributions

Y.X.: Conceptualization, Formal Analysis, Methodology, Data Curation, Writing—Original Draft. Z.Y.: Supervision, Project Administration. H.W.: Supervision, Review and Editing, Project Administration. H.Y.: Resources, Formal Analysis. N.M.: Supervision, Writing—Review and Editing, Funding Acquisition. X.J.: Software, Validation. H.Z.: Formal analysis. All authors have read and agreed to the published version of the manuscript.

Funding

This research was jointly funded by the National Natural Science Foundation of China (No. 42202149).

Informed Consent Statement

Informed consent was obtained from all subjects involved in the study.

Data Availability Statement

The data presented in this study are available on request from the corresponding author.

Acknowledgments

The authors wish to thank the Yanchang Oilfield Company for providing samples and data access and for permission to publish this work. Additionally, the authors are thankful to anonymous re-viewers for reviewing this paper and their valuable comments and suggestions, which significantly improved the quality of this research.

Conflicts of Interest

Author Zhengqin Ye and Hailong Yang were employed by the Yanchang Oilfield company. Author Xinyuan Ji was employed by the China National Offshore Oil Corporation Limited company. The remaining authors declare that the research was conducted in the absence of any commercial or financial relationships that could be construed as a potential conflict of interest.

References

  1. Sun, L.D.; Zou, C.N.; Jia, A.L.; Wei, Y.S.; Zhu, R.K.; Wu, S.T.; Guo, Z. Development Characteristics and Orientation of Tight Oil and Gas in China. Pet. Explor. Dev. 2019, 46, 1015–1026. [Google Scholar] [CrossRef]
  2. Pang, Y.D.; Liu, Y.L.; Zhang, L.; Xi, N.; Yuan, L.; Chen, C. Micro-Pore Structure and Fluid Mobility of Tight Sandstone Reservoirs of Chang 8 Member in Huachi Area in Ordos Basin. Pet. Geol. Oilfield Dev. Daqing 2023, 42, 1–10. [Google Scholar] [CrossRef]
  3. Wang, G.P.; Jin, Z.J.; Zhang, Q.; Zhu, R.; Tang, X.; Liu, K.; Dong, L. Effects of Clay Minerals and Organic Matter on Pore Evolution of the Early Mature Lacustrine Shale in the Ordos Basin, Chi-Na. J. Asian Earth Sci. 2022, 246, 105516. [Google Scholar] [CrossRef]
  4. Fu, J.H.; Liu, X.Y.; Li, S.X.; Guo, Q.; Zhou, X.; Yang, W. Discovery and Resource Potential of Shale Oil of Chang 7 Member, Triassic Yanchang Formation, Ordos Basin. China Pet. Explor. 2021, 26, 1–11. [Google Scholar] [CrossRef]
  5. Fu, J.; Niu, X.; Dan, W.; Liang, X.; Xin, H.; You, Y. The Geological Characteristics and the Progress on Exploration and Development of Shale Oil in Chang7 Member of Mesozoic Yanchang Formation, Ordos Basin. China Pet. Explor. 2019, 24, 601–614. [Google Scholar]
  6. Wang, Q.; Tao, S.; Guan, P. Progress in Research and Exploration & Development of Shale Oil in Continental Basins in China. Nat. Gas Geosci. 2020, 31, 417–427. [Google Scholar]
  7. Fu, S.; Jin, Z.; Fu, J.; Li, S.; Yang, W. Transformation of Understanding from Tight Oil to Shale Oil in the Member 7 of Yanchang Formation in Ordos Basin and Its Significance of Exploration and Development. Acta Pet. Sin. 2021, 42, 561–569. [Google Scholar]
  8. Xu, J.; Ge, Y.; He, Y.; Pu, R.; Liu, L.; Duan, L.; Du, K. Quantitative Characterization and Dynamic Evolution of Pore Structure in Shale Reservoirs of Chang 7 Oil Layer Group in Yanchang Area, Ordos Basin. Oil Gas Geol. 2023, 44, 292–307. [Google Scholar]
  9. Zang, Q.; Liu, C.; Awan, R.S.; Yang, X.; Li, G.; Wu, Y.; Lu, Z.; Feng, D. Occurrence Characteristics of the Movable Fluid in Heterogeneous Sandstone Reservoir Based on Fractal Analysis of NMR Data: A Case Study of the Chang 7 Member of Ansai Block, Ordos Basin, China. J. Pet. Sci. Eng. 2022, 214, 110499. [Google Scholar] [CrossRef]
  10. Zhang, Q.; Liu, Y.; Wang, B.; Ruan, J.; Yan, N.; Chen, H.; Wang, Q.; Jia, G.; Wang, R.; Liu, H.; et al. Effects of Pore-Throat Structures on the Fluid Mobility in Chang 7 Tight Sandstone Reservoirs of Longdong Area, Ordos Basin. Mar. Pet. Geol. 2022, 135, 105407. [Google Scholar] [CrossRef]
  11. Gao, H.; Zhou, X.; Wen, Z.; Guo, W.; Tian, W.; Li, S.; Fan, Y.; Luo, Y. Classification and Evaluation of Shale Oil Reservoirs of the Chang 71-2 Sub-Member in the Longdong Area. Energies 2022, 15, 5364. [Google Scholar] [CrossRef]
  12. Feng, D.; Liu, C.; Feng, X.; Wang, X.; Awan, R.S.; Yang, X.; Xu, N.; Wu, Y.; Wu, Y.; Zang, Q. Movable Fluid Evaluation of Tight Sandstone Reservoirs in Lacustrine Delta Front Setting: Occurrence Characteristics, Multiple Control Factors, and Prediction Model. Mar. Pet. Geol. 2023, 155, 106393. [Google Scholar] [CrossRef]
  13. Meng, Z.; Sun, W.; Liu, Y.; Luo, B.; Zhao, M. Effect of Pore Networks on the Properties of Movable Fluids in Tight Sandstones from the Perspective of Multi-Techniques. J. Pet. Sci. Eng. 2021, 201, 108449. [Google Scholar] [CrossRef]
  14. Wang, W.R.; Yue, D.L.; Eriksson, K.A.; Liu, X.Y.; Liang, X.W.; Qu, X.F.; Xie, Q.C. Qualitative and Quantitative Characterization of Multiple Factors That Influence Movable Fluid Saturation in Lacustrine Deep-Water Gravity-Flow Tight Sandstones from the Yanchang Formation, Southern Ordos Basin, China. Mar. Pet. Geol. 2020, 121, 104625. [Google Scholar] [CrossRef]
  15. Tian, W.; Lu, S.; Huang, W.; Wang, S.; Gao, Y.; Wang, W.; Li, J.; Xu, J.; Zhan, Z. Study on the Full-Range Pore Size Distribution and the Movable Oil Distribution in Glutenite. Energy Fuels 2019, 33, 7028–7042. [Google Scholar] [CrossRef]
  16. Zhao, X.; Yang, Z.; Lin, W.; Xiong, S.; Luo, Y.; Liu, X.; Xia, D. Fractal Study on Pore Structure of Tight Sandstone Based on Full-Scale Map. Int. J. Oil Gas Coal Technol. 2019, 22, 123–139. [Google Scholar] [CrossRef]
  17. Yue, Q.; Shan, X.; Zhang, X.; Xu, C.; Yi, J.; Fu, M. Quantitative Characterization, Classification, and Influencing Factors of the Full Range of Pores in Weathering Crust Volcanic Reservoirs: Case Study in Bohai Bay Basin, China. Nat. Resour. Res. 2021, 30, 1347–1365. [Google Scholar] [CrossRef]
  18. Zhang, J.; Liu, G.; Torsaeter, O.; Tao, S.; Jiang, M.; Li, G.; Zhang, S. Pore-Throat Structure Characteristics and Its Effect on Flow Behavior in Gaotaizi Tight Siltstone Reservoir, Northern Songliao Basin. Mar. Pet. Geol. 2020, 122, 104651. [Google Scholar] [CrossRef]
  19. Wu, M.; Qin, Y.; Wang, X.; Li, G.; Zhu, C.; Zhu, S. Fluid Mobility and Its Influencing Factors of Tight Sandstone Reservoirs in China. J. Jilin Univ. Earth Sci. Ed. 2021, 51, 35–51. [Google Scholar]
  20. Nie, R.-S.; Zhou, J.; Chen, Z.; Liu, J.; Pan, Y. Pore Structure Characterization of Tight Sandstones via a Novel Integrated Method: A Case Study of the Sulige Gas Field, Ordos Basin (Northern China). J. Asian Earth Sci. 2021, 213, 104739. [Google Scholar] [CrossRef]
  21. Wang, M.; Guan, Y.; Li, C.; Liu, Y.; Liu, J.; Xu, J.; Li, Z.; Lu, S. Qualitative Description and Full-Pore-Size Quantitative Evaluation of Pores in Lacustrine Shale Reservoir of Shahejie Formation, Jiyang Depression. Oil Gas Geol. 2018, 39, 1107–1119. [Google Scholar]
  22. Xiao, D.; Zhao, R.; Yang, X.; Fang, D.; Li, B.; Kong, X. Characterization, Classification and Contribution of Marine Shale Gas Reservoirs. Oil Gas Geol. 2019, 40, 1215–1225. [Google Scholar]
  23. Zhu, R.; Wu, S.; Su, L.; Cui, J.; Mao, Z.; Zhang, X. Problems and Future Works of Porous Texture Characterization of Tight Reservoirs in China. Acta Pet. Sin. 2016, 37, 1323–1336. [Google Scholar]
  24. Yang, W.; Wang, Y.; Xie, M.; Li, Y.; Gao, Y.; Deng, Y.; Xu, C.; Qin, J.; Peng, S.; Yang, L.; et al. Effect of Lithofacies on Differential Movable Fluid Behaviors of Saline Lacustrine Fine-Grained Mixed Sedimentary Sequences in the Jimusar Sag, Junggar Basin, NW China: Forcing Mechanisms and Multi-Scale Models. Mar. Pet. Geol. 2023, 150, 106150. [Google Scholar] [CrossRef]
  25. Zeng, H.; Wang, F.; Luo, J.; Tao, T.; Wu, S. Characteristics of Pore Structure of Intersalt Shale Oil Reservoir by Low Temperature Nitrogen Adsorption and High Pressure Mercury Pressure Methods in Qianjiang Sag. Bull. Geol. Sci. Technol. 2021, 40, 242–252. [Google Scholar]
  26. Xu, H.; Tang, D.; Zhao, J.; Li, S. A Precise Measurement Method for Shale Porosity with Low-Field Nuclear Magnetic Resonance: A Case Study of the Carboniferous-Permian Strata in the Linxing Area, Eastern Ordos Basin, China. Fuel 2015, 143, 47–54. [Google Scholar] [CrossRef]
  27. Cao, S.; Li, S.; Dang, H.; Xing, H.; Zhang, L.; Zhang, T.; Bai, P. Pore Characteristics and Controlling Factors of Chang 7 Shale in Southeastern Ordos Basin. Xinjiang Pet. Geol. 2022, 43, 11–17. [Google Scholar]
  28. Wu, J.; Yang, S.; Gan, B.; Cao, Y.; Zhou, W.; Kou, G.; Wang, Z.; Li, Q.; Dong, W.; Zhao, B. Pore Structure and Movable Fluid Characteristics of Typical Sedimentary Lithofacies in a Tight Conglomerate Reservoir, Mahu Depression, Northwest China. ACS Omega 2021, 6, 23243–23261. [Google Scholar] [CrossRef] [PubMed]
  29. Bai, Y.-B.; Luo, J.-L.; Wang, S.-F.; Yang, Y.; Tang, L.-P.; Fu, X.-Y.; Zheng, H. The Distribution of Chang-8 Tight Sandstone Oil Reservoir of Yanchang Formation in Wubao Area, Central-South of Ordos Basin. Geol. China 2013, 40, 1159–1168. [Google Scholar]
  30. Bai, Y.B.; Zhao, J.Z.; Zhao, Z.L.; Yin, Y.Y.; Tong, J.N. Accumulation Conditions and Characteristics of the Chang 7 Tight Oil Reservoir of the the Yanchang Formation in Zhidan Area, Ordos Basin. Oil Gas Geol. 2012, 34, 22–28. [Google Scholar] [CrossRef]
  31. Bai, Y.B.; Luo, J.L.; Zhang, T.J.; Liu, Z.; Feng, X. Characteristics and Evaluation of Source Rocks of Yanchang Formation in Wubao Area, Ordos Basin. J. Lanzhou Univ. Sci. 2012, 48, 22–28. [Google Scholar] [CrossRef]
  32. Zang, Q.; Liu, C.; Awan, R.S.; Yang, X.; Lu, Z.; Li, G.; Wu, Y.; Feng, D.; Ran, Y. Comparison of Pore Size Distribution, Heterogeneity and Occurrence Characteristics of Movable Fluids of Tight Oil Reservoirs Formed in Different Sedimentary Environments: A Case Study of the Chang 7 Member of Ordos Basin, China. Nat. Resour. Res. 2022, 31, 415–442. [Google Scholar] [CrossRef]
  33. Xi, K.; Cao, Y.; Liu, K.; Wu, S.; Yuan, G.; Zhu, R.; Kashif, M.; Zhao, Y. Diagenesis of Tight Sandstone Reservoirs in the Upper Triassic Yanchang Formation, Southwestern Ordos Basin, China. Mar. Pet. Geol. 2019, 99, 548–562. [Google Scholar] [CrossRef]
  34. SY/T 6385-2016; Porosity and Permeability Measurement under Overburden Pressure. Petroleum Industry Press: Beijing, China, 2016.
  35. SY/T 5163-2018; Analysis Method for Clay Minerals and Ordinary Non-Clay Minerals in Sedimentary Rocks by the X-ray Diffraction. Petroleum Industry Press: Beijing, China, 2018.
  36. GB/T 29171-2012; Rock Capillary Pressure Measurement. China Standards Press: Beijing, China, 2012.
  37. GB/T 21650.2-2008; Pore Size Distribution and Porosity of Solid Materials by Mercury Porosimetry and Gas Adsorption—Part 2: Analysis of Mesopores and Macropores by Gas Adsorption. China Standards Press: Beijing, China, 2008.
  38. SY/T 6490-2014; Specification for Mmeasurement of Rock NMR Parameter in Laboratory. Petroleum Industry Press: Beijing, China, 2014.
  39. Qu, Y.; Sun, W.; Tao, R.; Luo, B.; Chen, L.; Ren, D. Pore-Throat Structure and Fractal Characteristics of Tight Sandstones in Yanchang Formation, Ordos Basin. Mar. Pet. Geol. 2020, 120, 104573. [Google Scholar] [CrossRef]
  40. Huang, H.; Sun, W.; Ji, W.; Zhang, R.; Du, K.; Zhang, S.; Ren, D.; Wang, Y.; Chen, L.; Zhang, X. Effects of Pore-Throat Structure on Gas Permeability in the Tight Sandstone Reservoirs of the Upper Triassic Yanchang Formation in the Western Ordos Basin, China. J. Pet. Sci. Eng. 2018, 162, 602–616. [Google Scholar] [CrossRef]
  41. Fang, T.; Zhang, L.K.; Liu, N.G.; Zhang, L.Q.; Wang, W.M.; Yu, L.; Li, C.; Lei, Y.H. Quantitative Characterization of Pore Structure of Tight Gas Sandstone Reservoirs by NMR T2 Spectrum Technology: A Case Study of Carboniferous-Permian Tight Sandstone Reservoir in Linqing Depression. Acta Pet. Sin. 2017, 38, 902–915. [Google Scholar] [CrossRef]
  42. Liu, T.; Ma, Z.; Fu, R. Analysis of Rock Pore Structure with NMR Spectra. Prog. Geophys. 2003, 18, 737–742. [Google Scholar]
  43. Li, J.; Yin, J.; Zhang, Y.; Lu, S.; Wang, W.; Li, J.; Chen, F.; Meng, Y. A Comparison of Experimental Methods for Describing Shale Pore Features—A Case Study in the Bohai Bay Basin of Eastern China. Int. J. Coal Geol. 2015, 152, 39–49. [Google Scholar] [CrossRef]
  44. Xiao, D.; Lu, S.; Lu, Z.; Huang, W.; Gu, M. Combining Nuclear Magnetic Resonance and Rate-Controlled Porosimetry to Probe the Pore-Throat Structure of Tight Sandstones. Pet. Explor. Dev. 2016, 43, 961–970. [Google Scholar] [CrossRef]
  45. Zhao, H.; Ning, Z.; Zhao, T.; Zhang, R.; Wang, Q. Effects of Mineralogy on Petrophysical Properties and Permeability Estimation of the Upper Triassic Yanchang Tight Oil Sandstones in Ordos Basin, Northern China. Fuel 2016, 186, 328–338. [Google Scholar] [CrossRef]
  46. Li, K. Analytical Derivation of Brooks-Corey Type Capillary Pressure Models Using Fractal Geometry and Evaluation of Rock Heterogeneity. J. Pet. Sci. Eng. 2010, 73, 20–26. [Google Scholar] [CrossRef]
  47. Wu, Y.; Liu, C.; Ouyang, S.; Luo, B.; Zhao, D.; Sun, W.; Awan, R.S.; Lu, Z.; Li, G.; Zang, Q. Investigation of Pore-Throat Structure and Fractal Characteristics of Tight Sandstones Using HPMI, CRMI, and NMR Methods: A Case Study of the Lower Shihezi Formation in the Sulige Area, Ordos Basin. J. Pet. Sci. Eng. 2022, 210, 110053. [Google Scholar] [CrossRef]
  48. Li, P.; Zheng, M.; Bi, H.; Wu, S.; Wang, X. Pore Throat Structure and Fractal Characteristics of Tight Oil Sandstone: A Case Study in the Ordos Basin, China. J. Pet. Sci. Eng. 2017, 149, 665–674. [Google Scholar] [CrossRef]
  49. Zhang, F.; Jiang, Z.; Sun, W.; Li, Y.; Zhang, X.; Zhu, L.; Wen, M. A Multiscale Comprehensive Study on Pore Structure of Tight Sandstone Reservoir Realized by Nuclear Magnetic Resonance, High Pressure Mercury Injection and Constant-Rate Mercury Injection Penetration Test. Mar. Pet. Geol. 2019, 109, 208–222. [Google Scholar] [CrossRef]
  50. Sing, S.W.; Everett, R.A.; Haul, L.; Moscou, N.; Pierotti, R.A.; Rouquerol, J.; France, & Siemieniewska, T. International Union of Pure and Applied Chemistry Physical Chemistry Division Commission on Colloid and Surface Chemistry including Catalysis* Reporting Physisorption Data for Gas/solid Systems with Special Reference to the Determination of Surface Area and Porosity Reporting Physisorption Data for. Available online: https://publications.iupac.org/pac/contact.html (accessed on 21 December 2023).
  51. Budaeva, A.D.; Zoltoev, E.V. Porous Structure and Sorption Properties of Nitrogen-Containing Activated Carbon. Fuel 2010, 89, 2623–2627. [Google Scholar] [CrossRef]
  52. Li, K.; Home, R. Fractal Modeling of Capillary Pressure Curves for the Geysers Rocks. Geothermics 2006, 35, 198–207. [Google Scholar] [CrossRef]
  53. Wang, J.; Wu, S.; Li, Q.; Guo, Q. An Investigation into Pore Structure Fractal Characteristics in Tight Oil Reservoirs: A Case Study of the Triassic Tight Sandstone with Ultra-Low Permeability in the Ordos Basin, China. Arab. J. Geosci. 2020, 13, 961. [Google Scholar] [CrossRef]
  54. Dou, W.; Liu, L.; Jia, L.; Xu, Z.; Wang, M.; Du, C. Pore Structure, Fractal Characteristics and Permeability Prediction of Tight Sandstones: A Case Study from Yanchang Formation, Ordos Basin, China. Mar. Pet. Geol. 2021, 123, 104737. [Google Scholar] [CrossRef]
  55. Lai, J.; Wang, G.; Fan, Z.; Zhou, Z.; Chen, J.; Wang, S. Fractal Analysis of Tight Shaly Sandstones Using Nuclear Magnetic Resonance Measurements. AAPG Bull. 2018, 102, 175–193. [Google Scholar] [CrossRef]
  56. Yang, L.; Wang, S.; Jiang, Q.; You, Y.; Gao, J. Effects of Microstructure and Rock Mineralogy on Movable Fluid Saturation in Tight Reservoirs. Energy Fuels 2020, 34, 14515–14526. [Google Scholar] [CrossRef]
  57. Bouma, A.H.; Kuenen, P.H.; Shepard, F.P. Sedimentology of Some Flysch Deposits: A Graphic Approach to Facies Interpretation; Elsevier: Amsterdam, The Netherlands, 1962. [Google Scholar]
  58. Talling, P.J.; Masson, D.G.; Sumner, E.J.; Malgesini, G. Subaqueous Sediment Density Flows: Depositional Processes and Deposit Types. Sedimentology 2012, 59, 1937–2003. [Google Scholar] [CrossRef]
Figure 1. Geological map showing the well locations (a,b) and stratigraphic column (c) representing the Chang 7 member within the research zone.
Energies 17 00862 g001
Figure 2. (a) The process of translating the NMR T2 spectrum into r. (b) The relationship between T2 and r of S2.
Energies 17 00862 g002
Figure 3. The categorization chart for the Chang 7 sandstone. These 10 black squares correspond to 10 samples.
Energies 17 00862 g003
Figure 4. (a) Residual intergranular pores and feldspar dissolved pores, W4223, 1992.7 m, S1, SEM. (b) Intergranular pores and microfracture, W4227, 1938.6 m, S2, SEM. (c) Chlorite intercrystalline pores, W4227, 1980.2 m, S5, SEM. (d) Residual intergranular pores and dissolved pores, W4223, 1992.7 m, S1, SEM, CTS. (e) Ankerite-filled pores and dissolved pores, W4227, 1946.6 m, S3, CTS. (f) Residual intergranular pores, dissolved pores, W4227, 1961.3 m, S4, CTS.
Energies 17 00862 g004
Figure 5. The capillary pressure curves exhibit three types of pore structures (designated as (a,d,g)), alongside the distribution of pore sizes (labeled as (b,e,h)) and corresponding pore types (c,f,i).
Energies 17 00862 g005
Figure 6. (a) Isotherms for N2 adsorption and desorption; (b) Curves depicting BJH pore size distribution.
Energies 17 00862 g006
Figure 7. Comparisons of the PSD curves of NMR, LTNA, and HPMI experiments (ae); The full-scale distributions of the samples (f).
Energies 17 00862 g007
Figure 8. Proportions of various pore spaces.
Energies 17 00862 g008
Figure 9. Fractal characteristic curves of typical samples S1 (a), S2 (b) and S5 (c) with the three types of pore structures.
Energies 17 00862 g009
Figure 10. The NMR T2 spectrum’s porosity constituents and accumulation distribution curve for sample S1.
Energies 17 00862 g010
Figure 11. MFS (a), MFP (b), and MF (c) are contributed by different pore spaces with varying pore structure types (d). MF: the proportion of movable fluid content. Grey colons indicate the pore structure types corresponding to the sample.
Energies 17 00862 g011
Figure 12. Correlations using Pearson analysis between the mobility of fluid and pore structure parameters.
Energies 17 00862 g012
Figure 13. Correlation between MFS (a), MFP (b), and the proportion of pore spaces.
Energies 17 00862 g013
Figure 14. Modeling the pore network in various lithofacies to evaluate fluid mobility within a lacustrine environment. (a) Distribution of different facies within the lacustrine setting; (b) The Sfm lithofacies in multi-stage overlapped sand bodies; (c) The Sfp lithofacies in the sandstone and mudstone interbeds; (d) The Sfgb lithofacies within the mudstone interbeds and thin sandstone of a clay-rich environment; (eg) Visual representations depicting the diverse variations in pore types across three lithofacies of sandstone.
Energies 17 00862 g014
Table 1. Test samples’ mineral composition, permeability, and porosity.
Sample IDWellDepth (m)Porosity (%)Permeability (mD)Mineral Composition of XRD Whole-Rock Analysis (%)Clay Composition of XRD Clay Analysis (%)
QuartzFeldsparCalcite AnkeriteDolomiteClayKaoliniteChloriteIlliteI/S
S1W42231992.77.8770.06184126.50.6011.817.63.0464.424.14
S2W42271938.65.850.021928.540.20.407.723.22.134.2710.166.64
S3W42271946.63.6460.002518.119.51.747.2011.20.160.266.823.96
S4W42271961.37.2980.004137.735.30.309.217.52.478.723.552.77
S5W42271980.23.5790.002415.817.4001.264.12.244.137.8219.94
S6W42231987.55.830.065527.839.11.908.722.5927.130.933
S7W42232016.626.5580.021734.940.31.107.714.311.837.424.526.3
S8W42271929.663.9250.00322.131.230.306.310.113.534.630.721.2
S9W42271960.135.4830.062936.233.92.900.426.614.840.224.620.4
S10W42272005.843.8830.053130.629.20.901.13712.328.52336.2
Average 5.39290.0298929.2731.264.014.725.4124.417.14419.11519.64717.455
Table 2. Classification of lithofacies in the Chang 7 shale oil reservoir.
Lithofacies and SamplesCore PhotosCTSLithological Characteristics
Massive fine-grained sandstone (Sfm); (Samples: S1, S2, S7, S9, S10)Energies 17 00862 i001Energies 17 00862 i002
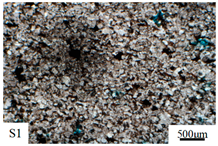
Grey, homogeneous, structureless, with low mud content; sharp contact at the lower or upper parts; high charcoal content.
Silt-fine sandstone with graded bedding (Sfgb); (Samples: S3, S5, S8)Energies 17 00862 i003Energies 17 00862 i004
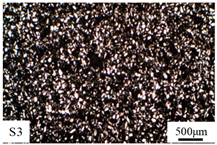
Grey and grey-brown; high carbonate content or high mud content; graded bedding, the Bouma Sequence (Ta division).
Silt-fine sandstone with parallel bedding (Sfp); (Samples: S4, S6)Energies 17 00862 i005Energies 17 00862 i006
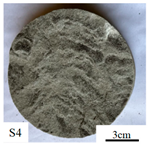
Grey-white; low mud content; parallel bedding, the Bouma Sequence (Tb division).
Table 3. The data from HPMI and LTNA experiments.
TypeSample
ID
HPMILTNA
Pt (MPa)Rmax (μm)Ra (μm)Rm (μm)Smax (%)We(%)SpSBET (m2/g)Vads (cm3/g)Rp (nm)
IS12.7380.2680.0720.04373.19927.861.6580.7050.00211.054
S62.7360.2690.0640.02769.00130.9841.6691.4160.0043.325
S92.7330.2690.0730.0364.90626.5481.4910.7640.0026.483
Average2.7360.2690.070.03369.03528.4641.6060.9620.0036.954
IIS22.7250.270.0570.01667.74425.5261.7171.3740.0044.368
S72.7330.2690.0470.0164.31726.8541.7720.6370.00213.145
S104.1170.1790.0450.01760.74428.3611.3164.4270.0082.669
Average3.1910.2390.050.01464.26826.9141.6022.1460.0046.727
IIIS35.4990.1340.0360.00754.24423.2951.9780.7730.0026.522
S45.4790.1340.0290.0163.3329.6511.5331.9930.0066.733
S55.4960.1340.0320.00758.34730.6051.7624.0920.0072.772
S811.0170.0670.0240.00552.65223.3561.1353.1270.0064.454
Average6.8730.1170.030.00857.14326.7271.6022.4960.0055.12
Pt = threshold pressure; Rmax = maximum pore radius (μm); Rm = median radius of pore (μm); Ra = average pore radius (μm); Sp = coefficients representing pore sorting; Smax = maximum values for mercury saturation; We = mercury retreat efficiency; SBET = Specific surface area; Vads = total amount of nitrogen adsorbed; Rp = 2 Vads/SBET.
Table 4. T2 spectrum conversion parameters of samples.
Sample IDSmall Pore AreaMedium Pore AreaLarge Pore Area
CnR2CnR2CnR2
S10.00311.79630.96880.00131.02890.99857 × 10−350.07200.955
S20.00241.10600.95430.01022.22870.95676 × 10−280.10030.9028
S30.00111.14380.99920.0021.92010.94054 × 10−390.08440.9602
S40.00331.23810.9980.01162.23360.98876 × 10−230.11600.9149
S57 × 10−50.65980.99860.00232.25730.99923 × 10−130.24190.9772
Table 5. Fractal dimensions of samples based on HPMI data.
TypeSample IDMacropores (>1 μm)Mesopores (0.1~1 μm)Micropores (0.01~0.1 μm)Nanopores (<0.01 μm)
D1R2D2R2D3R2D4R2
IS12.3330.9683.4360.9872.1750.9122.0870.994
S62.3440.9613.0560.9802.3940.9172.1140.986
S92.4210.9313.5880.9002.3300.9102.0830.998
Average2.3660.9533.3600.9562.3000.9132.0950.992
IIS22.2640.9293.1340.9202.4030.9012.2060.996
S72.3110.9452.8510.9582.6230.9682.2360.993
S102.2870.9672.7420.8792.7840.9442.0820.989
Average2.2870.9472.9090.9192.6030.9372.1750.993
IIIS32.3110.9582.4710.9512.8920.9052.1390.993
S42.5590.9082.7580.9663.0200.9722.1770.967
S52.3210.9412.4120.9972.9890.9272.2190.997
S82.3440.9572.2420.9933.3650.9372.1700.988
Average2.3840.9412.4710.9773.0670.9352.1760.986
Disclaimer/Publisher’s Note: The statements, opinions and data contained in all publications are solely those of the individual author(s) and contributor(s) and not of MDPI and/or the editor(s). MDPI and/or the editor(s) disclaim responsibility for any injury to people or property resulting from any ideas, methods, instructions or products referred to in the content.

