Abstract
The distributed energy system (DES) represents an innovative approach to energy generation and distribution that promotes decentralization and diversification of energy sources. DESs can offer numerous benefits, including increased resiliency, reduced transmission losses, improved efficiency, and lower carbon emissions. The optimal design of a DES requires careful consideration of various factors such as geographical location, climate conditions, and energy demand patterns. This paper utilizes a multi-objective genetic algorithm to optimize the combination of technologies and their corresponding sizes in a distributed energy system for three types of commercial buildings—hospitals, large offices, and large hotels across eight different climate zones in the U.S. A range of technologies are considered for integration into the DES. These technologies include photovoltaic systems, wind turbines, combined heat and power systems, solar thermal collectors, and electrical and thermal energy storage. The two objectives considered are maximizing the reduction in carbon dioxide emissions and minimizing the life cycle costs for the DES. The purpose of this study is to optimize and evaluate the multi-objective design of distributed energy systems aimed at decentralizing and diversifying energy sources. The analysis of optimized DES designs across all 24 case scenarios shows that a balance between cost saving and emission reduction has been achieved. Although this study primarily focuses on specific buildings and climate zones, the methods and findings can be adapted for a wider variety of building types across different geographical locations, thus paving the way for more widespread adoption of optimized distributed energy systems.
1. Introduction
The pursuit of clean and sustainable energy solutions is driven by concerns about climate change and the scarcity of traditional sources of energy. This shift has propelled extensive research into the advancement of technologies to harness renewable energy sources and investigation of their feasibility for cost-effective power generation. Amid these initiatives, the concept of ‘distributed energy generation’ has emerged as a critical aspect of sustainable energy discussions, which involves the production and distribution of energy utilizing power generation technologies and/or energy storage systems near the point of consumption rather than centralized facilities like traditional power plants. Adopting decentralized strategies that can exploit renewable sources such as solar power, wind energy, geothermal heat, or biomass allows us to tap into diverse energy resources while simultaneously reducing our reliance on finite fossil fuels [1]. Some advantages that have been noted for DES include their low environmental impact, technical benefits stemming from modular implementation, resiliency to grid disruptions, increased efficiency, reduced transmission and distribution losses, and cost-effective power production.
There has been a significant amount of research dedicated to the modeling and evaluation of distributed energy systems. Ding et al. [2] modeled a PV-battery system connected to the grid and maximized the efficiency of power generation by employing the P&O algorithm to monitor and adjust PV in response to variations in solar irradiance and temperature. Kim et al. [3] developed a novel integrated operation strategy (IOS) for poly-generation systems incorporating renewable energy and energy storage systems. The implementation of IOS led to a primary energy saving ratio of 30.79%, a carbon dioxide emission reduction ratio of 28.35%, and an operating cost saving ratio of 36.86%. Chen et al. [4] conducted a thermodynamic and economic analysis of a distributed energy system, integrating concentrating photovoltaic/thermal with an air source heat pump based on two operation strategies. According to the findings of their case study, the DES was able to achieve a maximum exergy efficiency of 40.23% and an annual cost of 24.22/m2. Zhang et al. [5] examined the influence of financial policies such as tax credits or subsidies in the U.S. regarding PV and battery energy storage on the payback period of a PV-battery system.
The intermittent nature of renewable energy sources poses a challenge in continuous electricity supply to meet demanding usage requirements. Effectively combining different renewable energy sources with the electric grid and/or energy storage devices ensures a reliable and stable power supply. In their study, Wang et al. [6] incorporated both electric and thermal energy storage systems into the power distribution and district heating network of a renewable distributed energy system. By optimizing the position and capacity of these storage systems, they were able to achieve a reduction in comprehensive costs by 13.4%. Sameti and Haghighat [7] performed DES optimization with and without energy storage under four different scenarios, evaluating the system performance in terms of total annualized cost and annual CO2 emission using Mixed Integer Linear Programming (MILP).
Numerous studies have explored the design of distributed energy systems through various multi-objective optimization techniques. Liu et al. [8] proposed the optimization of a novel distributed energy system that incorporates solar power and hybrid energy storage for 12 Nearly Zero Energy Community (NZEC) scenarios, including varying community types, scales, and new load conditions such as electric vehicles. Falke et al. [9] divided the optimization process into several stages: optimal district heating network design, design of generation units, storage systems, and renovation measures to minimize annual total cost and CO2 emissions. Liu et al. [10] developed an optimization strategy to split a complex mixed-integer nonlinear programming problem (MINLP) into two sub-problems, namely a nonlinear programming problem (NLP) and a mixed-integer linear programming problem (MILP). They carried out the optimization of energy conversion devices and PV-battery systems in a sequence. Zhang et al. [11] utilized multi-objective particle swarm optimization (MOPSO) to achieve the optimal size of DES by minimizing the payback period and maximizing the reduction of carbon dioxide emissions (RCDE). In the study by Wang et al. [12], they focused on the examination of a distributed building energy system that incorporates electric vehicles and takes into account the uncertain patterns of EV charging as well as time-of-use pricing for the grid. They used NSGA-II to minimize the levelized cost of electricity (LCOE) and the net quantity of electricity traded and maximize the renewable energy utilization ratio. Zhang et al. [13] also employed NSGA-II to determine the optimal capacity allocation of the solar and biomass-based DES under three different operation strategies to achieve three objectives: to maximize CO2 emission, annual cost saving, and primary energy reduction rates.
Among the various studies conducted on distributed energy systems, a significant portion has been centered around optimizing their operational strategy. Somma et al. [14] analyzed and optimized the operation of a DES aiming to minimize energy costs and CO2 emissions. They utilized a single function with a weighted sum of the two objectives and solved it using the branch-and-cut method. Wang et al. [15] conducted a study focusing on Shanghai’s context where they optimized the operational strategy of a hybrid system that integrates solar energy with combined cooling, heat, and power technology, taking into account variable user load and renewable energy output brought about by climate change. The study carried out by Bahlawan et al. [16] proposed an integrated approach that combines the design, which relates to determining equipment capacities and operational variables that pertain to defining the optimal operation of a distributed energy system using surrogate modeling and dynamic programming, respectively. Huang et al. [17] developed a method to optimize both the design and operational strategies of a distributed energy system powered by solar energy using a non-dominated sorting genetic algorithm (NSGA-II). Liu et al. [18] proposed a novel dynamic operation strategy for DES to utilize the surplus power generated by PV in various ways to minimize the waste of generated power and ensure optimal operation based on real-time energy demand. They developed this operational scheme for both grid-connected and off-grid DES and optimized their design using a genetic algorithm. Some studies emphasize the importance of peer-to-peer (P2P) energy sharing, which involves sharing surplus energy among distributed energy systems to optimize energy resource allocation, reduce carbon emissions, and enhance overall energy efficiency. One such study by Zhang et al. [19] conducted a study on the optimal operational strategy for P2P energy sharing among distributed energy systems and found a reduction in energy costs by 14.14% and carbon emissions by 14.76%.
Numerous studies, as shown by the provided literature, have explored DES from various aspects. However, the investigation of integration and design optimization issues of DES is still insufficient. The potential influence caused by climate zones, building energy consumption characteristics, and utility price differences on the DES life cycle environmental and economic performance are not considered in most optimizations. This paper aims to optimize the design of distributed energy systems for different building types and climate zones by considering both life cycle environmental and economic impact. The novelty of the paper lies in its comprehensive and detailed evaluation of the optimized distributed energy system (DES) performance for commercial buildings with unique energy consumption patterns across a wide range of environmental conditions. This analysis provides a deeper insight into how the optimized system performs in diverse scenarios, offering critical insights for practical application and decision-making. The subsequent sections are structured as follows: Section 2 outlines the modeling of the DES subsystems, operational strategy, selected building types and climate locations, and the multi-objective genetic algorithm model. Section 3 provides a detailed analysis of results obtained from simulating twenty-four case scenarios. Finally, Section 4 summarizes and concludes the work.
2. Materials and Methods
2.1. Description and Modeling of Distributed Energy System
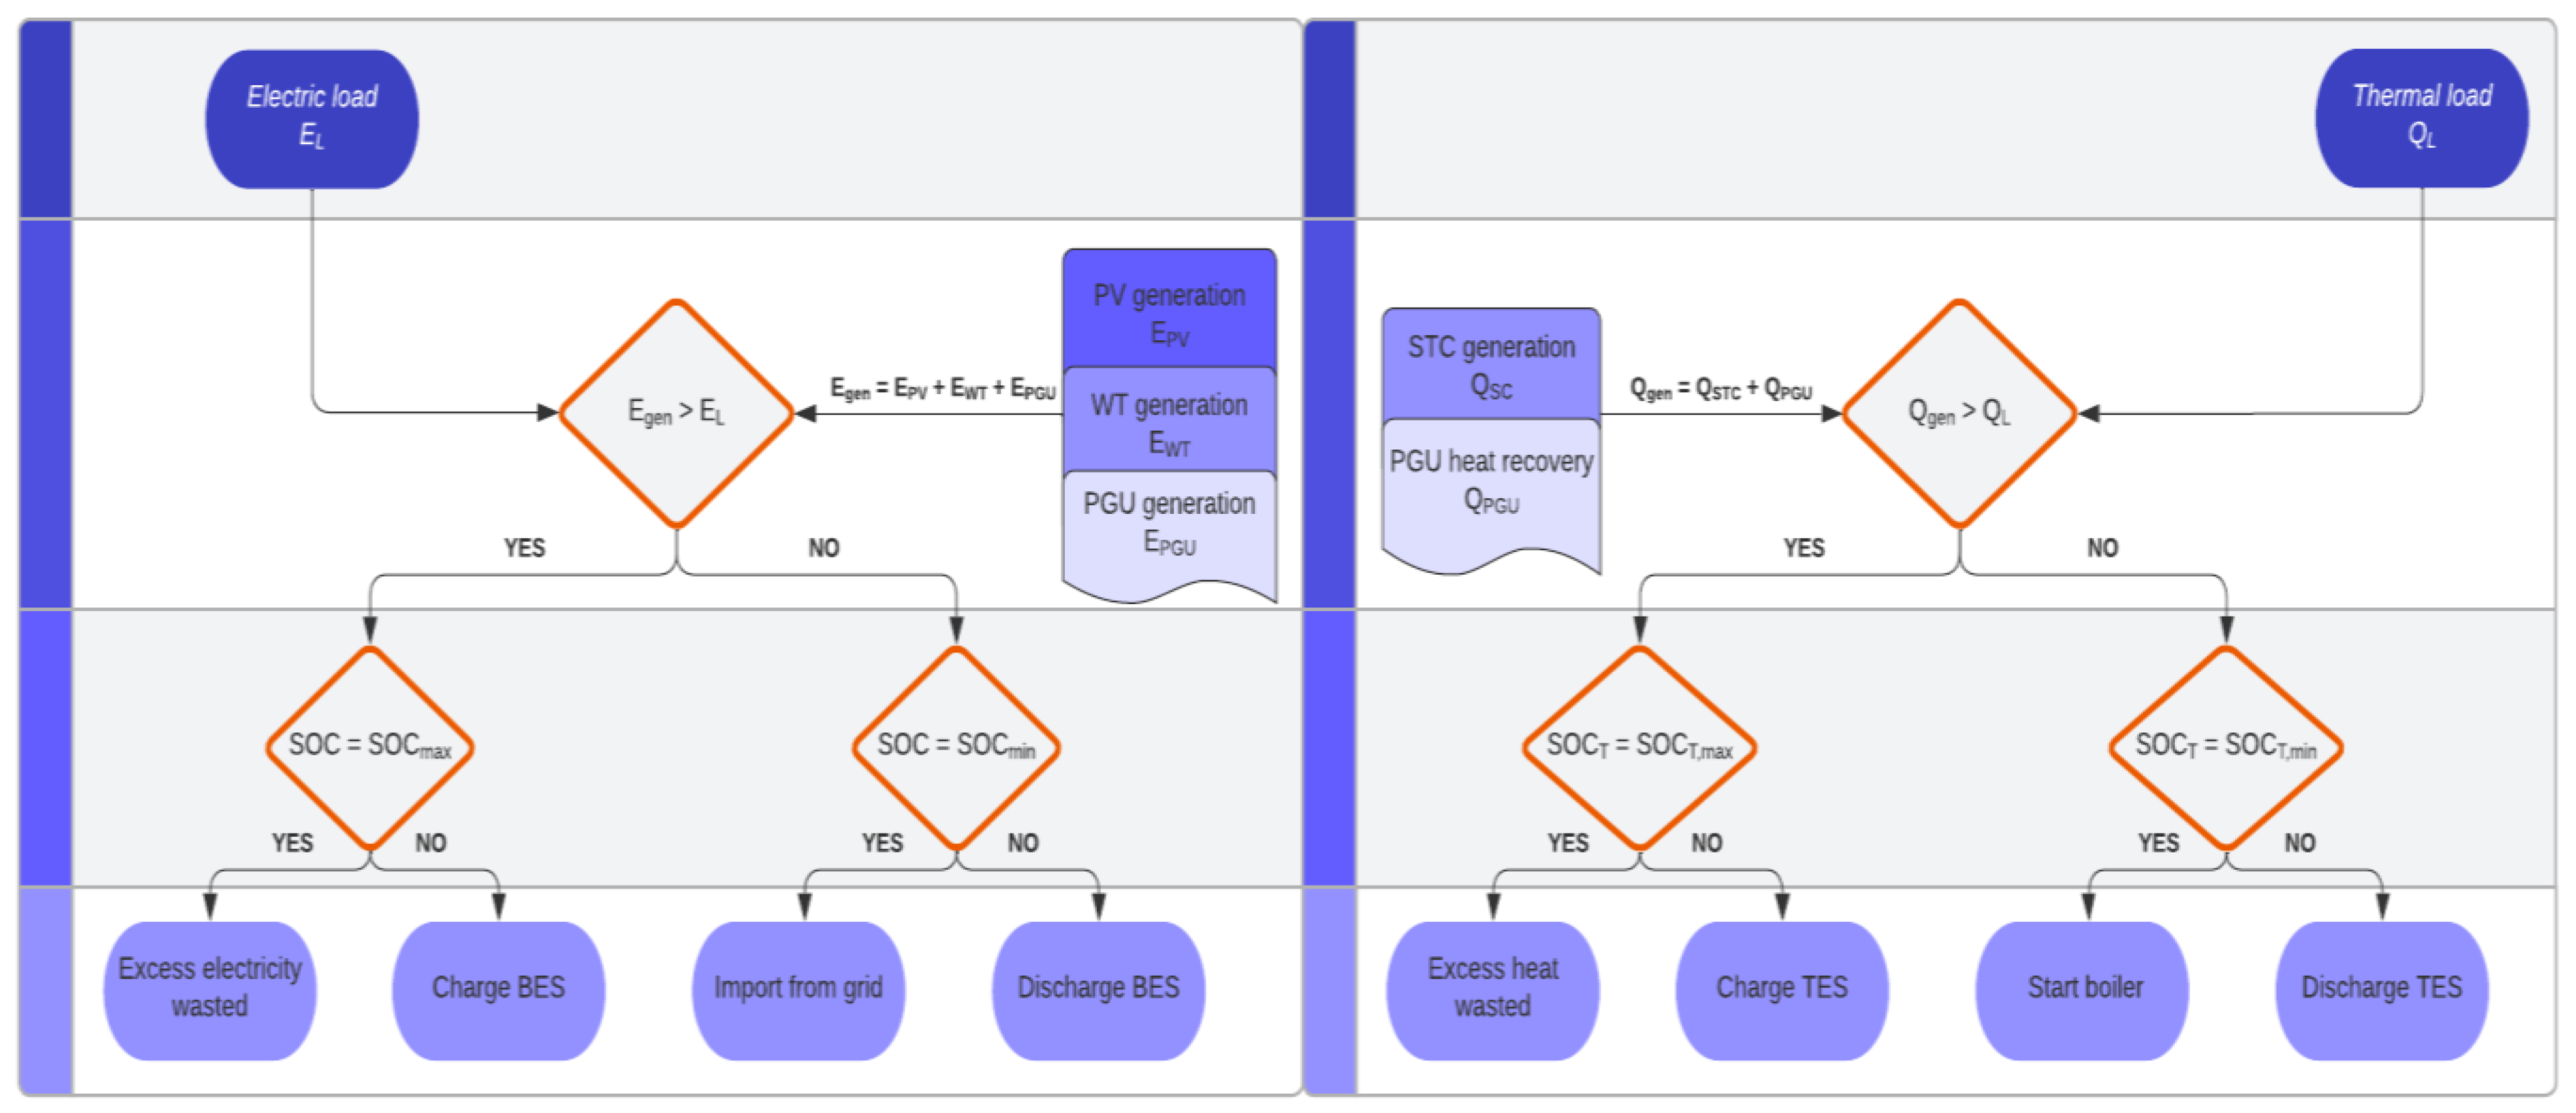
The grid-connected distributed energy system (DES), as shown in Figure 1, comprises various subsystems: photovoltaic (PV), wind turbine (WT), combined heat and power (CHP) system, solar thermal collector (STC), and energy storage devices, i.e., battery energy storage (BES) and thermal energy storage (TES). Power and heat demand at a given time can be fulfilled with their own production or via an energy storage system. On-site power generation from PV, WT, and CHP systems is used to fulfill the demand for electricity. The generated surplus electricity is stored in the battery. During periods of deficit in generated and stored electricity, the electrical grid is utilized to make up for the shortfall. Thermal energy is supplied using STC, and heat is recovered from the power generation unit (PGU). A hot water tank is used as TES to store excess thermal energy. A boiler is integrated to supply additional heat when the stored and recovered heat is insufficient. Natural gas is used to power both the PGU and backup boiler. In the proposed DES, excess electricity is not sold back to the electric grid. The operation strategy for this proposed grid-connected distributed energy system is depicted in Figure 2. The operational strategy of the grid-connected distributed energy system involves prioritizing the utilization of on-site generation to meet electricity demand. In cases when electricity demand exceeds the capacity of on-site generation, the stored electricity from the battery is utilized. If the discharged electricity from the battery is insufficient, grid electricity is then imported. When electricity demand can be satisfied using on-site generation, any excess electricity is used to charge the battery until it has reached its maximum capacity and the unused electricity is wasted. Likewise, the thermal demand is initially met by utilizing the STC and recovered heat from PGU. If the thermal load is not satisfied, the stored thermal energy in the hot water tank is utilized. The backup boiler is only utilized when there is a shortage of available thermal energy from generation and storage. When surplus energy from STC and heat recovery of PGU is available, it is utilized to charge the TES until it reaches its maximum capacity. Any remaining excess energy is then wasted.
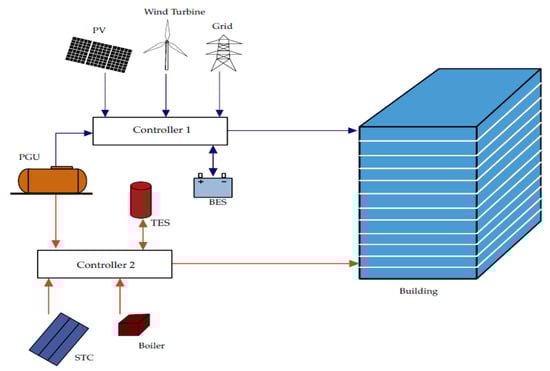
Figure 1.
Distributed energy system.
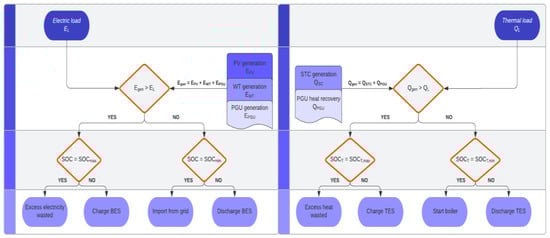
Figure 2.
DES operating strategy.
2.1.1. Photovoltaic (PV)
The power generation of a single PV module is computed using the following formula:
where As is the surface area of a PV module, f is the active surface area fraction, GT is the total solar radiation, ηcell is the cell conversion efficiency, and ηinverter is the inverter conversion efficiency. Hourly solar radiation is computed using data from the Typical Meteorological Year 3 (TMY3) [20] that includes information on global horizontal irradiance, direct normal irradiance, and diffuse horizontal irradiance.
PPV = As f GT ηcell ηinverter,
2.1.2. Wind Turbine
The power produced by a wind turbine depends on rotor power coefficient, Cp, air density, ρ, rotor radius, r, and wind speed, v, which can be expressed as [21]
The rotor power coefficient is calculated based on the tip speed ratio and the blade pitch angle.
PWT = ⅟₂ Cp ρ π r2 v3,
2.1.3. Combine Heat and Power (CHP)
The CHP system consists of an on-site power generation unit (PGU) driven by natural gas to generate electric energy and a heat recovery system to recover the waste heat from PGU to supply thermal energy. The PGU is operated at base load, and the electricity generated can be expressed as
where PPGU is the power of PGU and ∆t is the time interval, which is one hour in this simulation. The fuel consumed by PGU is represented as follows:
where ηPGU is the fuel-to-electric efficiency of PGU. Heat recovered from the PGU to fulfill the thermal load can be estimated as
where ηHRS is the efficiency of the heat recovery system.
EPGU = PPGU × ∆t,
FPGU = EPGU/ηPGU,
QR = (FPGU − EPGU) ηHRS = FPGU (1 − ηPGU) ηHRS,
2.1.4. Solar Thermal Collector (STC)
The heat transfer rate of an STC is determined by using the following formula [22]:
where ηSTC is the hourly efficiency of the STC and ASTC is the surface area of a single STC. The hourly efficiency of the STC is estimated as [22,23]
where yint and m are the y-intercept and the slope factor of STC, respectively. Tin is the collector inlet temperature and Tamb is the ambient air temperature.
QSTC = ηSTC GT ASTC,
ηSTC = yint − m [(Tin − Tamb)/GT],
2.1.5. Energy Storage System
Battery storage system (BES) utilizes a lead–acid battery, while the thermal energy storage system employs a hot water tank. State of Charge (SOC) is the remaining ratio capacity of a battery. The current state of charge, SOC (h), depends on the state of charge at the previous hour, SOC (h − 1), and current charging, PC (h), or discharging power, PDC (h).
When the BES is charging:
where EBES
is the capacity, ηC is charging efficiency, and PBES is the rated power of the battery. Pload (h) is the building hourly electric load and Pgen (h) is the hourly electric generation by PV, CHP, and WT.
SOC (h) = SOC (h − 1) + [(PC (h) × ηC × ∆t)/EBES],
Pgen (h) = PPV (h) + PWT (h) + PPGU (h),
When the BES is discharging:
where ηDC is the discharging efficiency of the battery.
SOC (h) = SOC (h − 1) − [(PDC (h) × ⅟ηDC × ∆t)/EBES],
Similarly, the state of charge for the hot water tank, SOCT (h), depends upon thermal energy current charging, QC (h), or discharging, QDC (h), of thermal energy.
When the TES is charging:
where ETES is the capacity and ηTC is the charging efficiency of the hot water tank. QL is the thermal demand of the building.
SOCT (h) = SOCT (h − 1) + [(QC (h) × ηTC × ∆t)/ETES],
QC (h) = QR + QSTC − QL,
When the TES is discharging:
where ηTDC is the discharging efficiency of the hot water tank. The technical parameter values of the above DES components are listed in Table 1.
SOCT (h) = SOCT (h − 1) − [(QDC (h) × ⅟ηTDC × ∆t)⁄ETES],
QDC (h) = QL − QR − QSTC,

Table 1.
Technical parameters of DES components.
2.2. Building Model and Climate Data
The design optimization of distributed energy systems is carried out for three types of commercial buildings: a hospital, a large hotel, and a large office across eight different climate zones. The commercial building models are selected from a set of 16 reference commercial buildings developed by the U.S. Department of Energy (DOE) [29,30] that represent most types of commercial buildings across all climate zones in the United States. EnergyPlus [31] is employed to generate the hourly electric and thermal load data using the building model and weather data. EnergyPlus is a building energy simulation software designed to model and analyze the energy consumption and performance of buildings by taking into account various factors like building materials, climate conditions, occupancy patterns, and HVAC systems to provide highly detailed insights into a building’s energy usage. The climate data used is from a Typical Meteorological Year (TMY) dataset [20] that represents a year’s worth of weather data in a specific locality derived from historical weather data, usually spanning several decades. Table 2 and Table 3 provide characteristics of the selected building types and climate conditions, respectively. The simulated energy load profiles also serve as a baseline representing the demand side of energy use to evaluate the performance of optimized DES.
Table 2.
Building types and their characteristics.
Table 3.
Selected locations and their associated climate characteristics.
2.3. Optimization Model
The two objectives for the optimization of the distributed energy system described in the preceding section are the minimization of life cycle costs (LCC) and the maximization of the reduction in carbon dioxide emissions (RCDE). The LCC incorporates capital costs for each subsystem, replacement costs, as well as operation and maintenance costs incurred throughout the lifetime of the distributed energy system. The lead acid battery, along with the hot water tank used in the proposed DES, needs to be replaced after 12 years [32,33]. PV and STC systems have a life span of about 25 years [34] and 30 years [27], respectively, while WT and CHP systems have a lifespan of about 20 years [35,36]. Given these different lifespans of DES components, the conservative estimate of 20 years lifespan is assumed for the proposed DES to allow for a replacement of the shorter-lived components while still making the most of the systems with long lifespans to maximize the efficiency and longevity of the entire system. The assumed lifespan for the proposed DES is 20 years. The carbon dioxide emissions include direct emissions from fuel used and indirect emissions from electricity imported from the grid. A multi-objective genetic algorithm (MOGA) is employed to generate a Pareto-optimal front, which consists of a set of optimal solutions that offer the best trade-offs between these competing objectives. Then, the Technique for Order Preference by Similarity to Ideal Solution (TOPSIS) method is utilized to select an optimal solution from within the generated Pareto frontier.
2.3.1. Decision Variable
The decision variables are typically adjusted by the optimization algorithm to find the best solution that satisfies the set of objectives and constraints. In this case, by selecting the optimal configuration and sizes of the distributed energy system components, i.e., decision variables listed below, the life cycle cost of the DES system is minimized and the reduction in carbon dioxide emission is maximized.
- NPV: Number of PV
- NWT: Number of WT
- PPGU: PGU rated power (kW)
- EBES: Battery capacity (kWh)
- PBES: Battery rated power (kW)
- NSTC: Number of STC
- ETES: Thermal storage capacity (kWh)
Table 4 provides lower and upper bounds on the decision variables. These bounds are modeled as integers and establish the minimum and maximum values that can be assigned to each variable.
Table 4.
Bounds for decision variables.
2.3.2. Objective Function
The two objective functions are formulated as follows:
where CostC is the total capital cost, CostR is the total replacement cost, and CostO&M is the total operation and maintenance cost for the DES.
where EL is the electric load and FL is the fuel consumption of the building before DES. EL,DES is the imported electricity and FL,DES is the fuel consumed after the application of DES. EFe and EFf are the emission factor for grid electricity and fuel, i.e., natural gas, respectively. The breakdown of costs at the subsystem level is outlined below.
Mini LCC = CostC + CostR + CostO&M,
Max RCDE = (EL − EL,DES) × EFe + (FL − FL,DES) × EFf,
The capital cost of PV is expressed as
where CapPV is the capacity of a PV panel and CPV is the specific capital cost, which includes the cost for inverter, installation, and labor.
CostC,PV = NPV × CapPV × CPV,
The capital cost of wind turbines is determined using
where CapWT is the capacity of a wind turbine and CWT is the specific capital cost of a wind turbine.
CostC,WT = NWT × CapWT × CWT,
The capital cost of PGU is expressed as
where CPGU is the specific capital cost of a PGU.
CostC,PGU = PPGU × CPGU,
The capital cost of the battery is calculated using
where Cpower and Ccap are the specific power and capacity cost of BES, respectively.
CostC,BES = PBES × Cpower + EBES × Ccap,
The capital cost of solar thermal collector is estimated as
where CSTC is the capital cost of a single STC unit.
CostC,STC = NSTC × CSTC,
The capital cost of the hot water tank is given by
where CTES is the specific capacity cost of TES. Table 5 lists the specific capital as well as maintenance costs used for the calculations.
CostC,TES = ETES × CTES,
Table 5.
Economic parameters for LCC calculations.
The total capital cost is the sum of the capital cost of each subsystem.
CostC = CostC,PV + CostC,WT + CostC,PGU + CostC,BES + CostC,STC + CostC,TES,
The total operation and maintenance cost in USD/kW-yr is expressed as
CostO&M = CO&M,PV + CO&M,WT + CO&M,PGU + CO&M,BES + CO&M,STC,
The savings in the utility from the DES implementation are obtained using
where Coste and Costf are the electric and fuel costs, respectively. The cost of fuel and electricity and their emission factors for each location are shown in Table 6. Emission from renewable sources is set to zero, whereas the emission factor associated with fossil fuel, i.e., natural gas, is assumed to be constant.
CostS = (EL − EL,DES) × Coste + (FL − FL,DES) × Costf
Table 6.
Utility cost [43] and emission factors.
The present values of the future expenses, such as replacement costs and O&M costs for all technologies under consideration over the 20-year lifespan, involve factoring in the time value of money into LCC calculations. The present values of the future expenses are determined using a present worth factor.
where PW represents the present worth factor and C is the cost of an item at the time of investment. With the value of discount rate, d, of 8% and inflation rate, r, of 4% [46], the present worth factor is calculated as
PW = Pr × I,
For the replacement cost of an item after n years:
Pr = [(1 + i)/(1 + d)]ⁿ,
For recurring costs such as annual operation and maintenance costs, the cumulative present worth factor is used:
where x = (1 + i)/(1 + d).
Pa = (1 − xⁿ)/(1 − x),
2.3.3. Constraints
The energy balance constraints for the optimization are
where Qboiler is the thermal energy supplied by the boiler. At any given hour, both the battery and the hot water tank must satisfy the following system capacity and power constraints:
(PPV + PWT + PPGU + PDC) × ∆t + EL,DES ≥ EL,
QR + QSTC + QDC + Qboiler ≥ QL,
0 ≤ SOC and SOCT ≤ 100%,
0 ≤ PC and PDC ≤ PBES,
3. Results and Discussions
Twenty-four different case scenarios that include a combination of three types of commercial buildings in eight climate zones are studied in this paper. The hourly electric and fuel load for each case was conducted using the EnergyPlus software. The technologies employed in this study were modeled using Python programming language. Then, MOGA was utilized to optimize the design of the DES for each scenario while considering their life cycle environmental and economic impact. The simulation was performed for the first week of each month (2016 h) rather than an entire year. By doing so, all seasonal variations in energy demand and supply were captured while reducing computation time.
3.1. Optimization Results
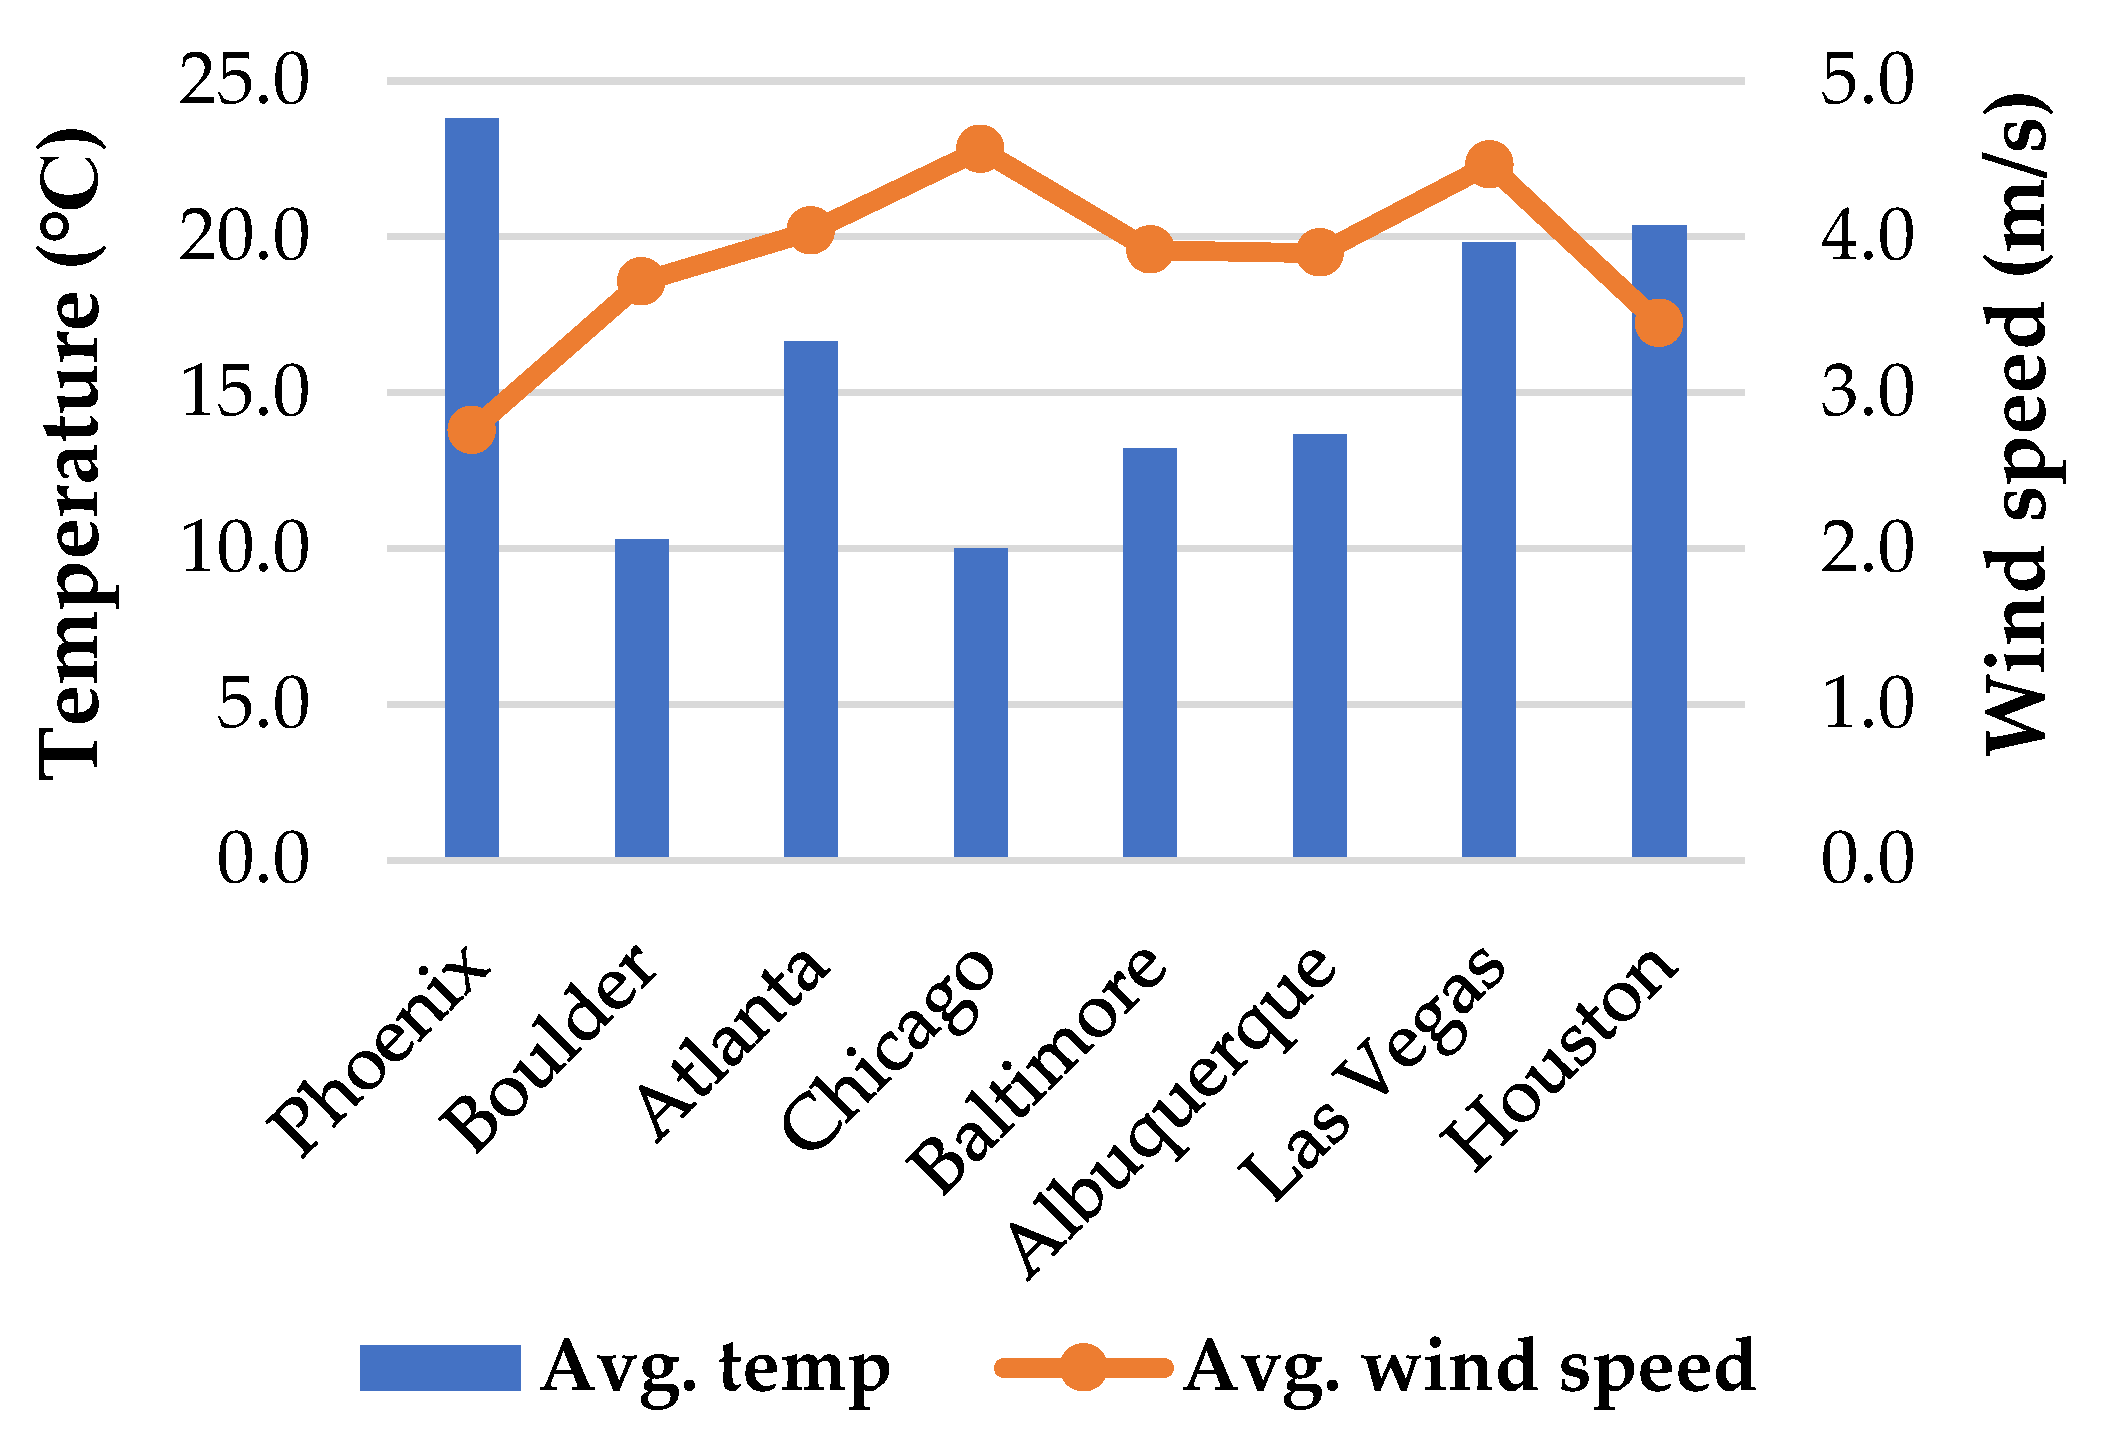
Based on the optimization results, Table 7 depicts values selected for the decision variables representing the optimal DES design for each building type and climate zone combination. According to the data presented in Table 7, there are no wind turbines employed in any of the cases. This suggests that opting for a DES configuration without wind turbines is preferable. The reason behind this preference can be attributed to the fact that wind turbine installation calls for significantly higher initial investments compared to other power generation technologies listed in Table 5. Based on the optimization results, the wind turbine is not an economically feasible choice for the studied cases. However, a wider array of technologies with and without wind resources can be investigated by integrating wind turbines into the optimization framework of the distributed energy system. Electricity is supplied using PV, CHP, and BES in the absence of WTs. PV has a slightly higher specific capital cost than PGU; however, fossil fuels used in CHP systems can lead to increased operational expenses and negative environmental consequences. Therefore, the adoption of PV significantly outnumbered the presence of the CHP system across all examined scenarios, regardless of the variations in average temperatures depicted in Figure 3.
Table 7.
Optimal values for the decision variables.
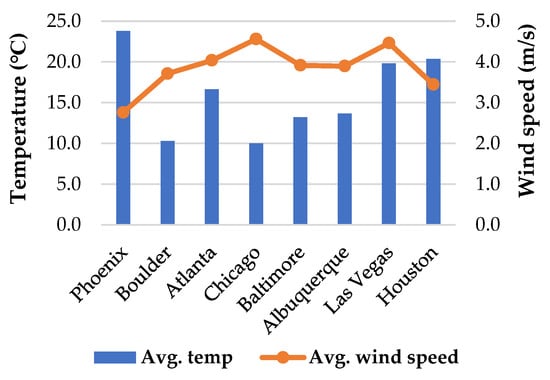
Figure 3.
Average hourly temperature and wind speed in selected locations.
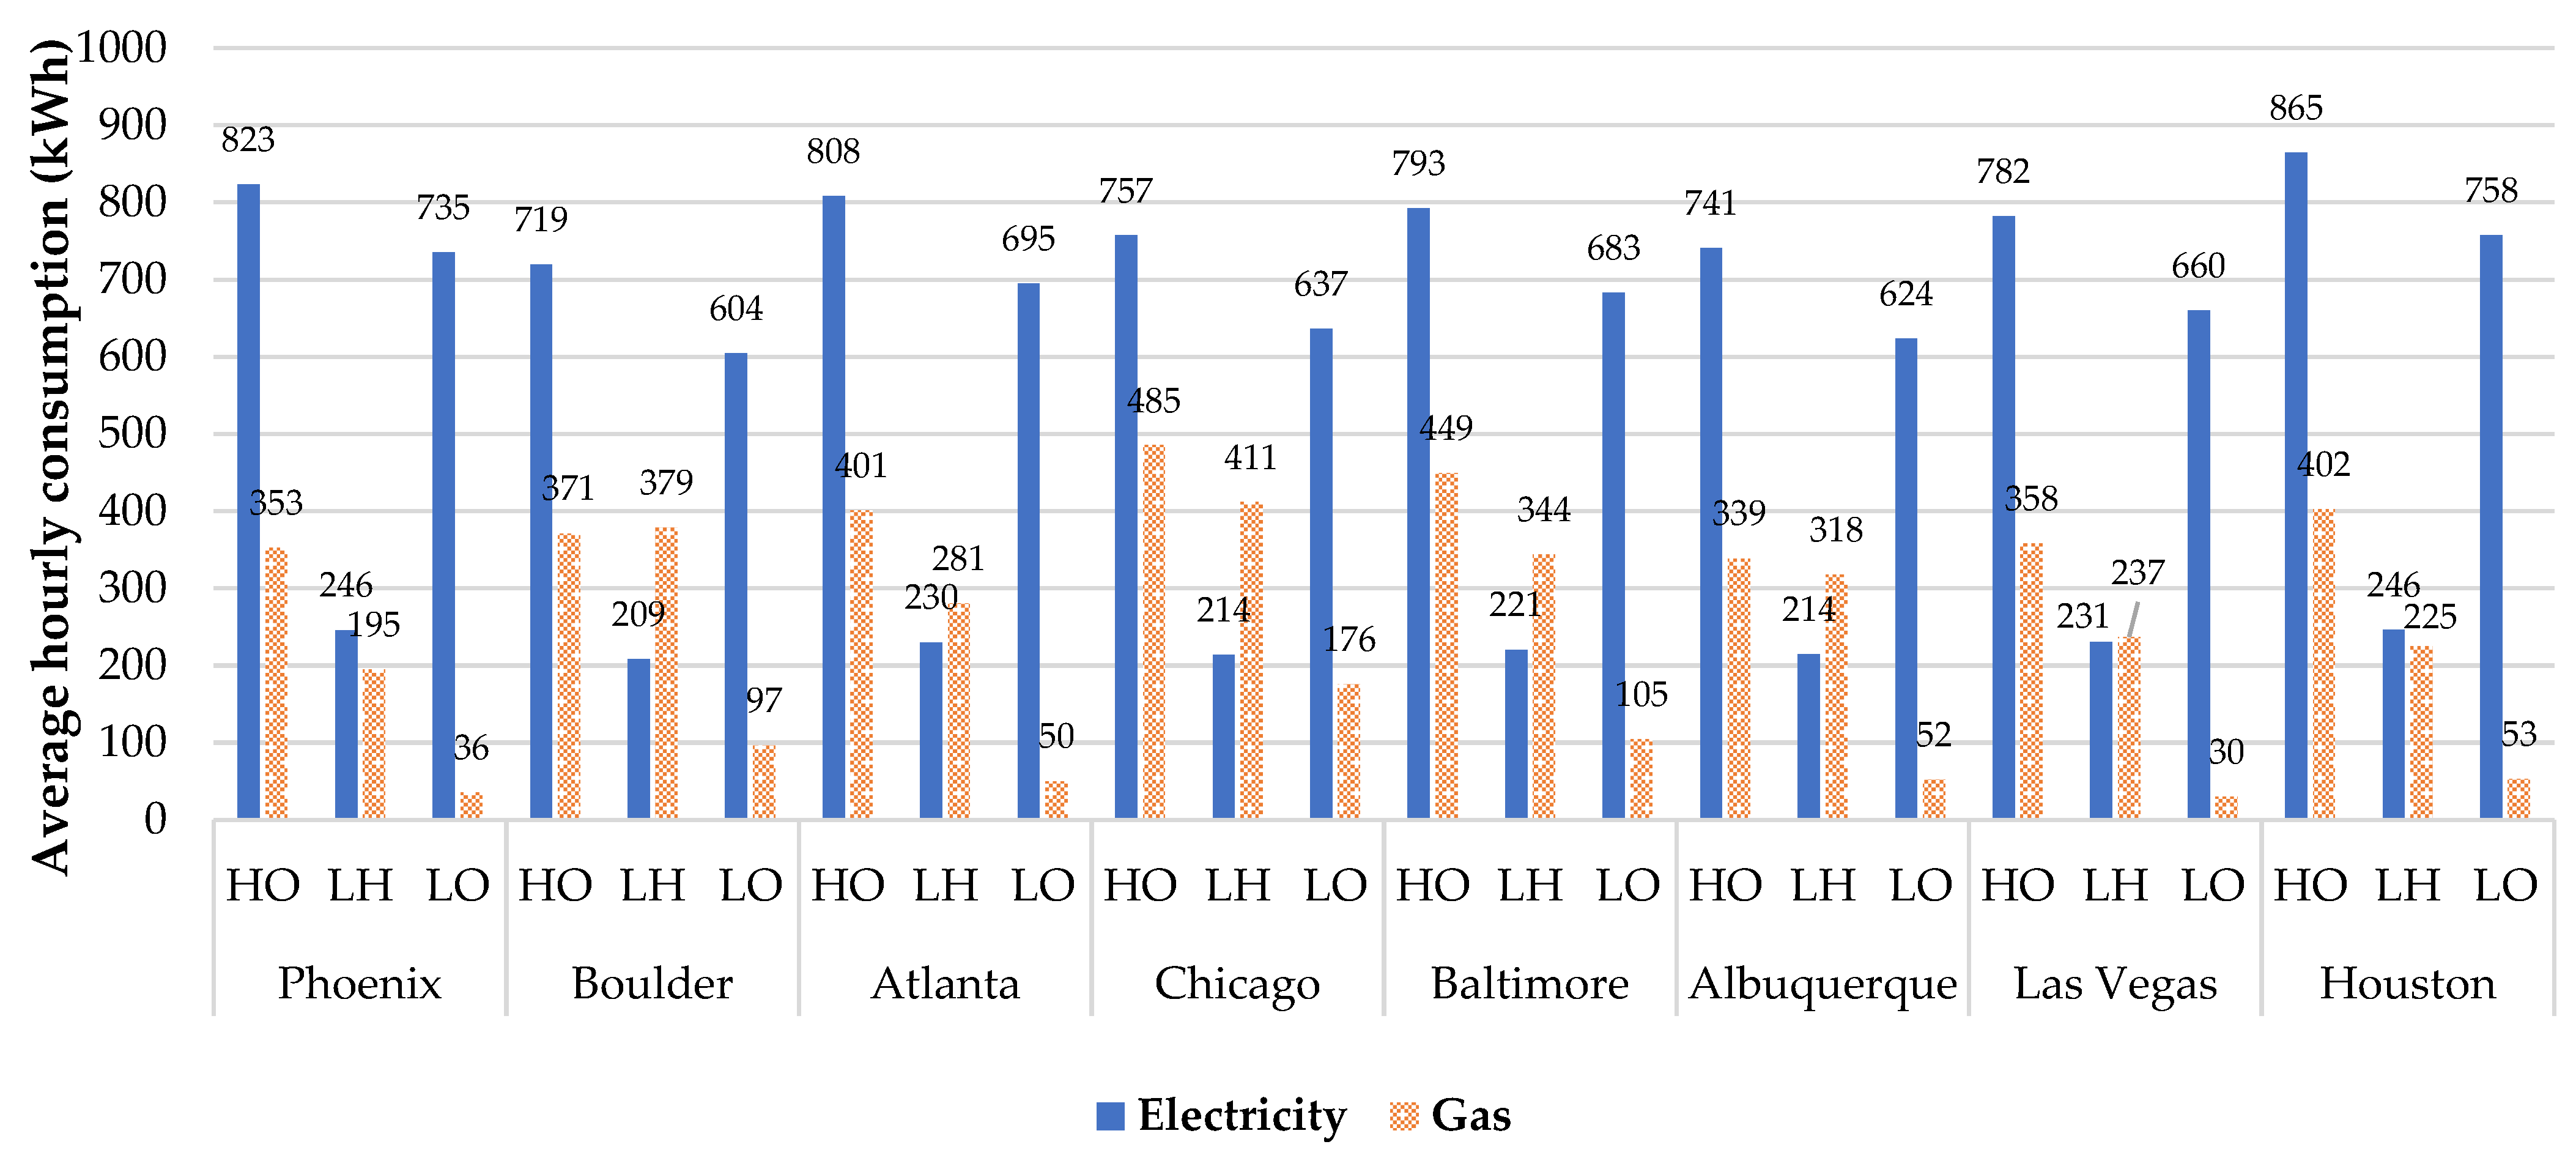
Figure 4 illustrates the average hourly consumption of electricity and fuel for selected commercial buildings in each location without the implementation of a distributed energy system. It should be noted that in this reference case, all the required electricity is imported from the grid and heat is supplied using a boiler. For all locations, hospitals have the highest electric demand and large hotels have the lowest electric demand. Thus, it can be seen in Table 7 that hospitals have higher PV numbers and the highest CHP capacity utilized. When comparing electricity demand between large office and hospital building types in Figure 4, it is observed that the former has relatively lower electricity demands for all climate zones. However, in Table 7, the number of PV panels used in large offices is higher than in hospitals in almost all locations except Albuquerque and Boulder, where it is only slightly lower. This is due to the absence of CHP systems to provide supplementary power in large office buildings for all locations with the exception of Chicago, where only a small 4 kW power generation unit is utilized. The average fuel consumption illustrated in Figure 4 represents the natural gas consumed by the boiler to fulfill the thermal requirements of the buildings before DES. Hospitals with the greatest fuel usage exhibit the highest thermal demand, whereas large office buildings with the lowest fuel usage have the lowest thermal demand. Considering that the thermal energy demand is lowest in large offices across all locations, only STC is utilized, as seen in Table 7, to fulfill the heating load, and CHP systems are eliminated as there is no need for additional thermal energy derived from recovered waste heat.

Figure 4.
Average hourly electric and fuel consumption.
3.2. Life Cycle Cost and Reduction in Carbon Dioxide Emission of Optimized Distributed Energy System
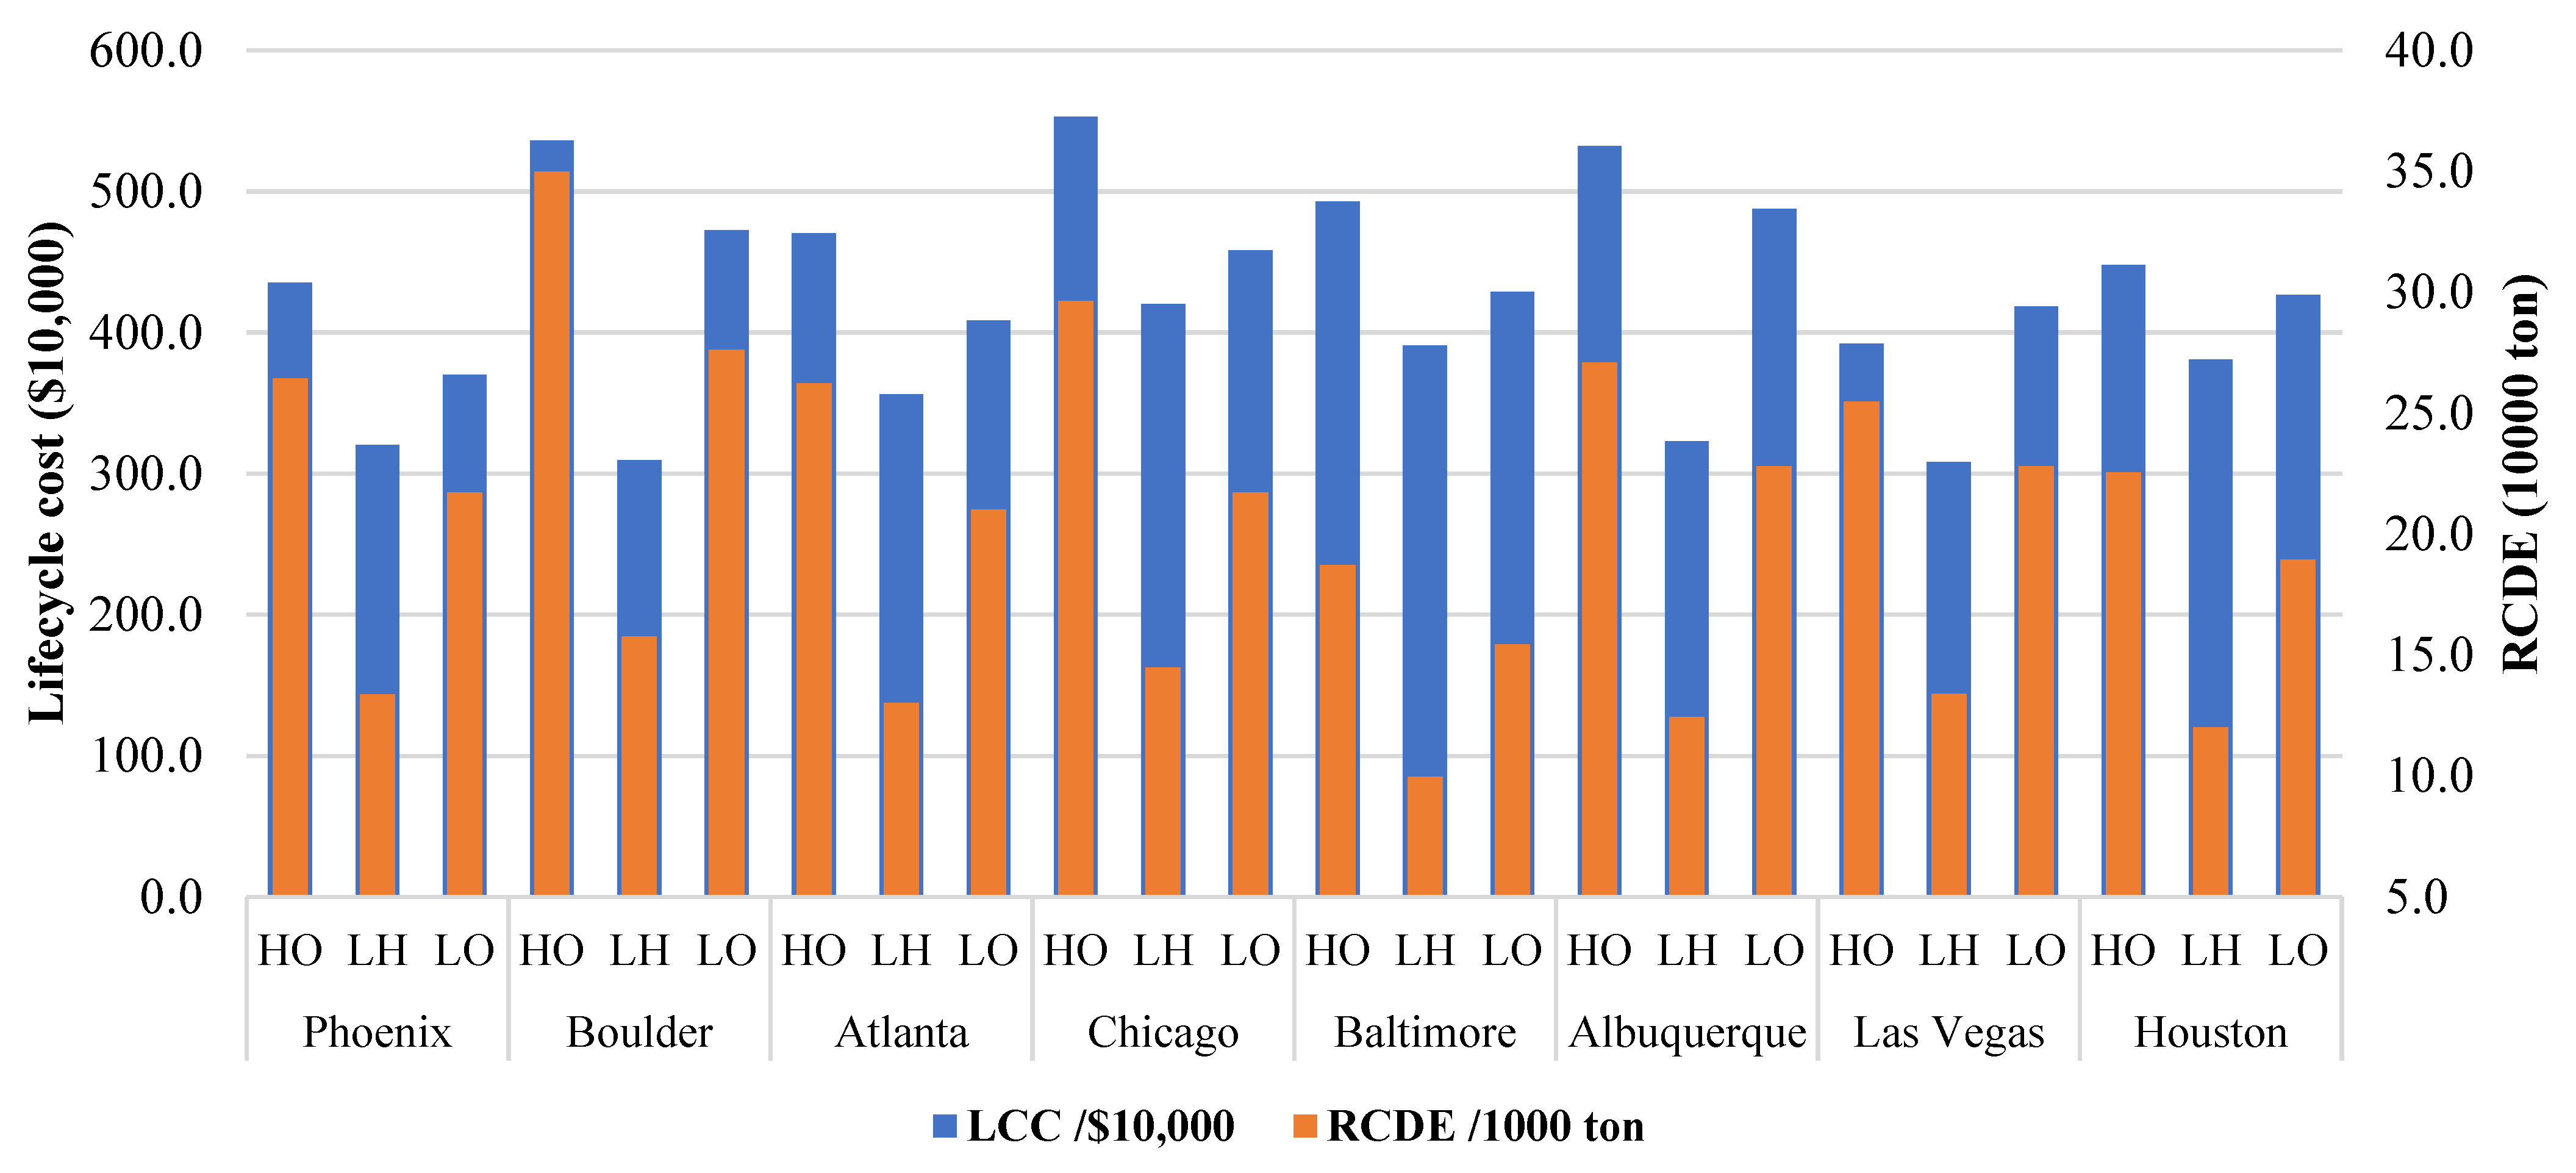
The life cycle cost associated with the optimized DES system for different building types and locations, listed in Table 7, is visually presented in Figure 5. The highest LCC among the assessed buildings is observed in a hospital located in Chicago, with a total of USD 5,527,000. On the other hand, the lowest LCC is found in a large hotel building situated in Las Vegas at USD 3,081,000. The magnitude of LCC is directly affected by the capacity and arrangement of the DES components, which are determined based on each building’s energy requirements. It can be observed from Figure 5 that hospital buildings in all locations except Las Vegas incur the highest life cycle expense due to their comparatively greater energy demands, necessitating a larger capacity of distributed energy system components. Additionally, Figure 5 depicts the reduction in carbon dioxide emission (RCDE) achieved from DES implementation for each case scenario. For the same building types across eight locations, Boulder has the highest RCDE, and Baltimore has the lowest RCDE. This can be explained by the highest emission factor associated with grid electricity for Boulder in Table 6, leading to higher reductions in CO2 emissions when utilizing DES. On the other hand, Baltimore has the lowest emission factor value for grid electricity among the studied locations.
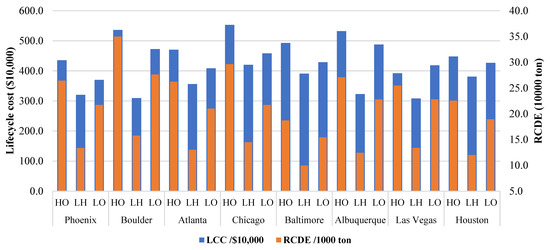
Figure 5.
Life cycle cost and reduction in carbon dioxide emissions for optimized DES.
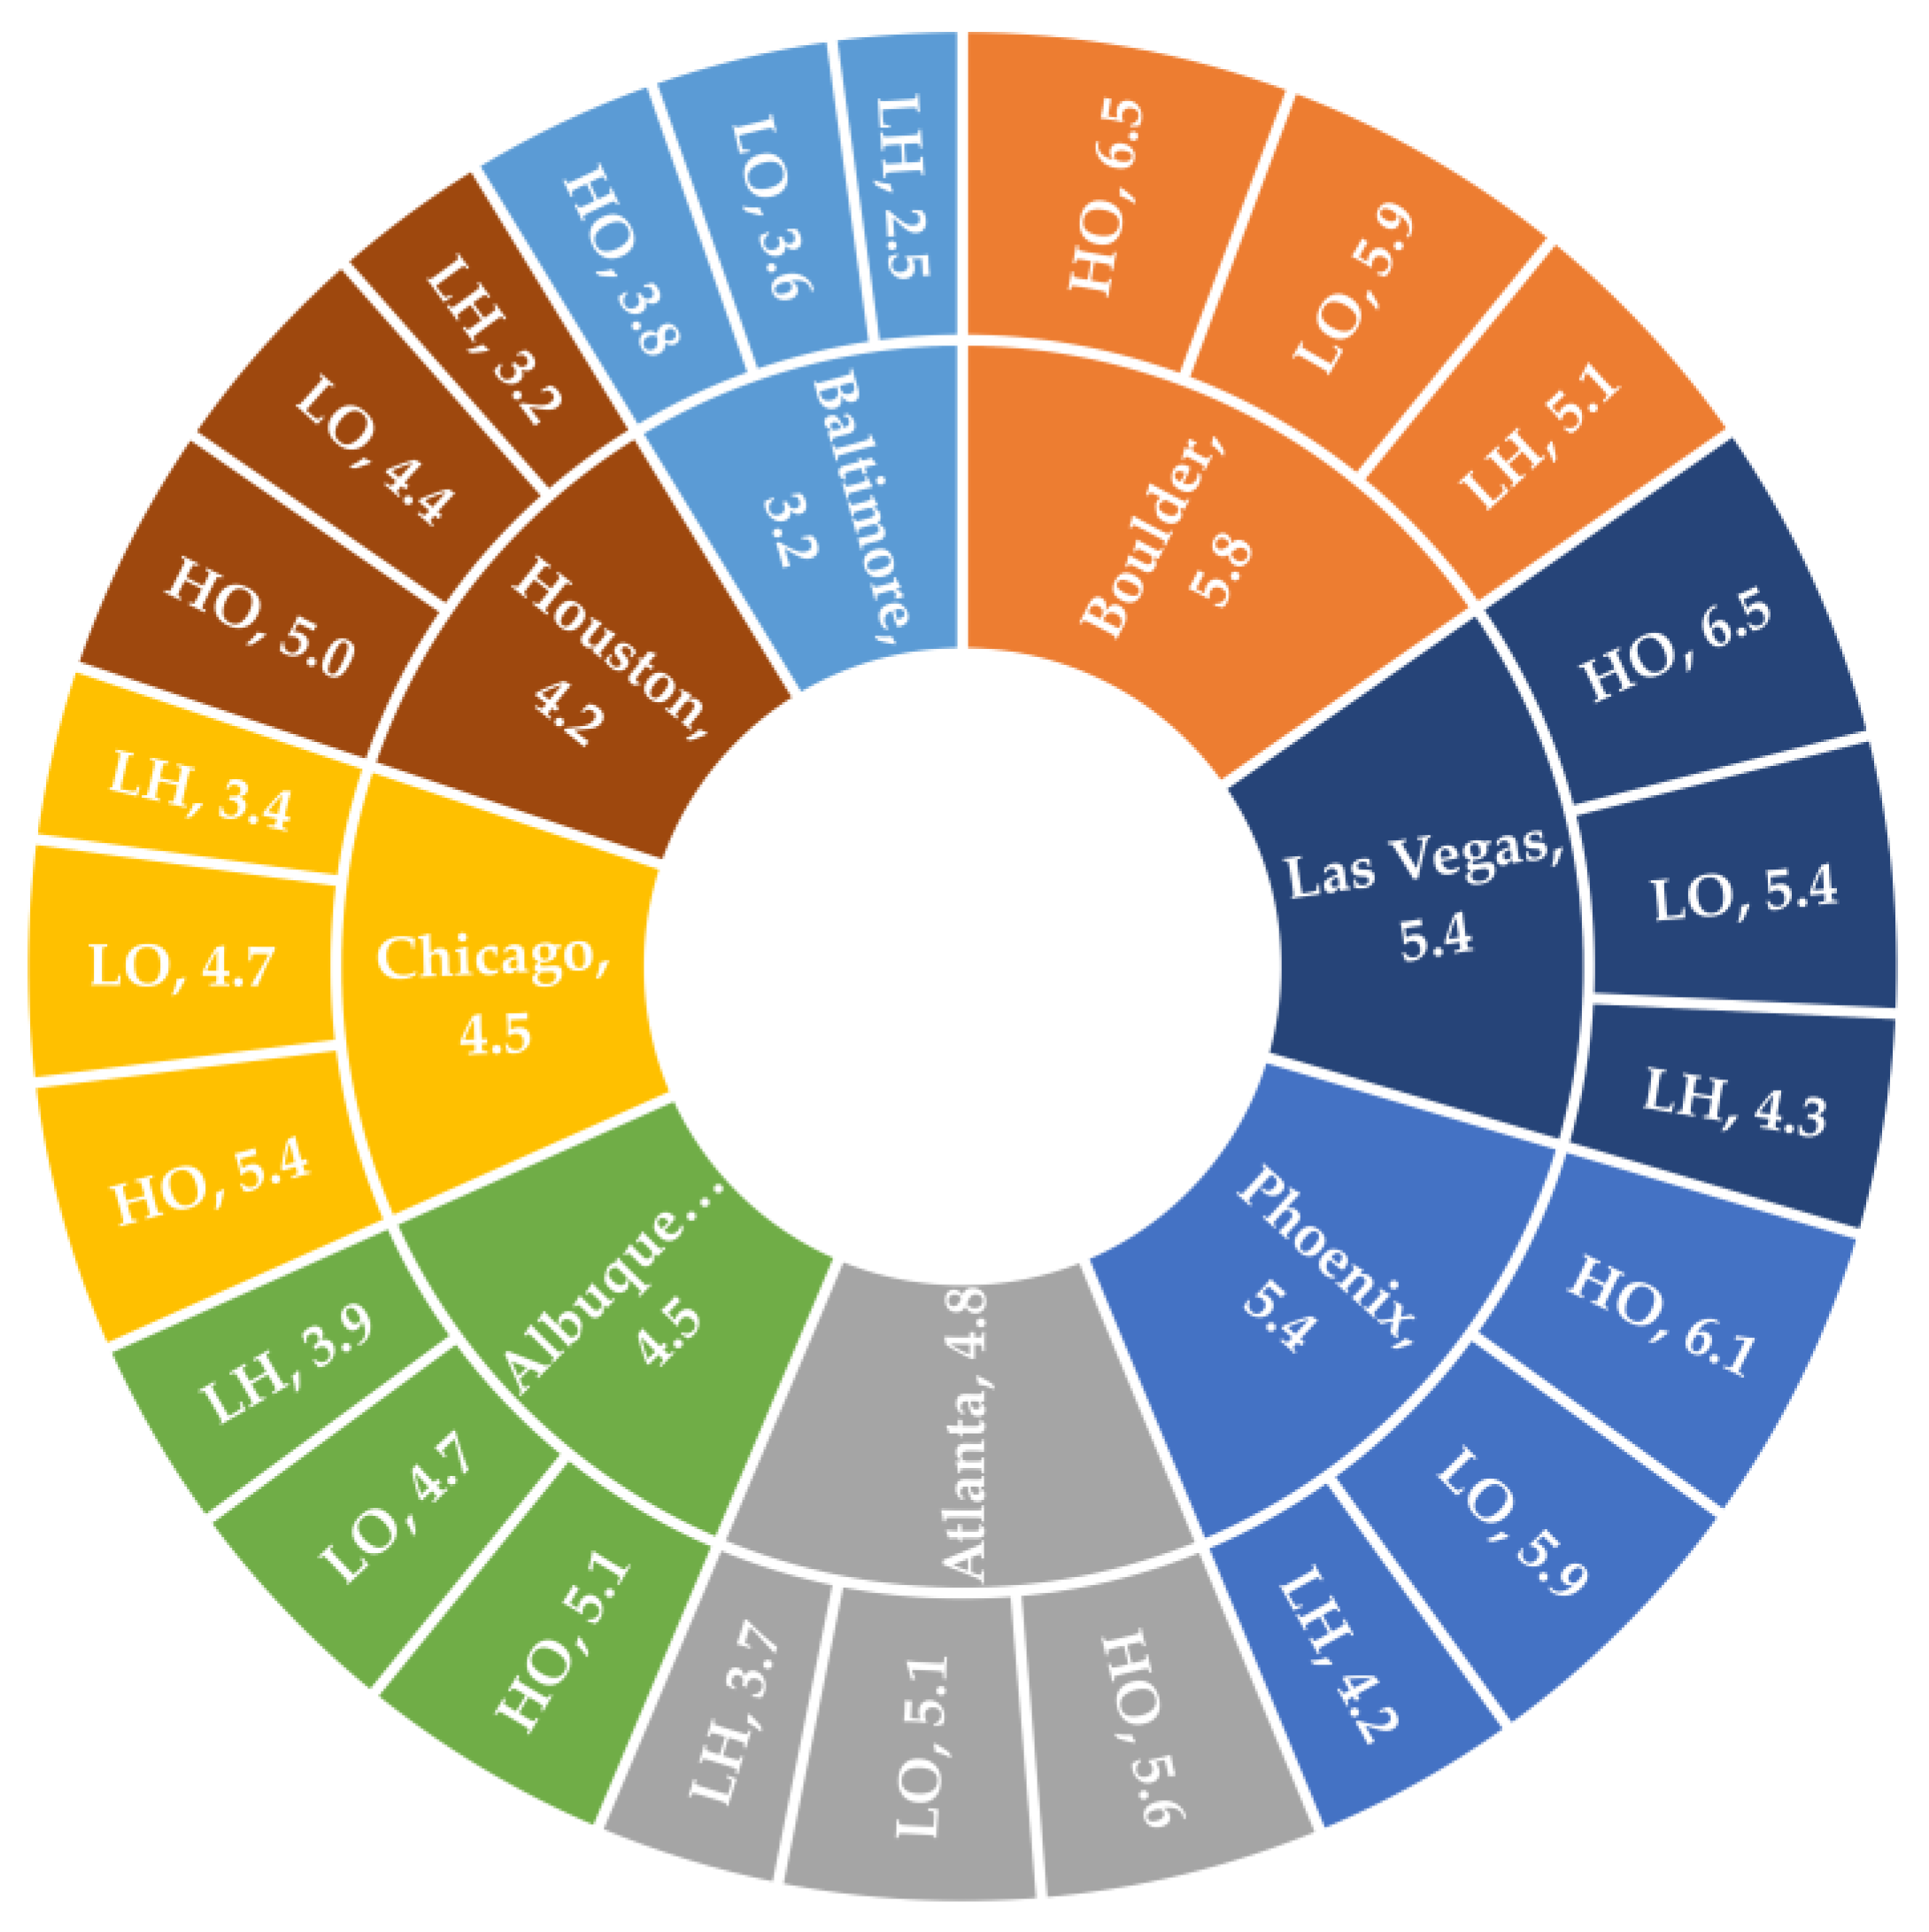
Figure 6 presents the ratio of RCDE to LCC (in kg/USD) for each building type in eight selected locations, as well as their respective average in each location. All three buildings in Boulder have the highest ratio value compared to respective buildings in other locations, which indicates a greater amount of carbon dioxide emissions reduced per dollar spent on the life cycle cost of implementing distributed energy systems. When comparing three building types located in the same climate zone, a hospital building has the highest ratio value, followed by a large office and then a large hotel. This suggests that hotels are comparatively less rewarded from DES implementation when it comes to reduction in carbon emissions.

Figure 6.
Ratio of RCDE to LCC.
The distribution of the life cycle cost for each component within the total life cycle cost of DES is shown in Figure 7. The PV system accounts for the highest proportion of the total life cycle cost in each case scenario which can be attributed to two factors: their relatively higher specific cost in Table 5 and the significant capacity utilized in Table 7. In large hotels, battery energy storage systems contribute significantly to the total life cycle cost due to the requirement for the highest capacity battery compared to other building types listed in Table 7. In comparison to other subsystems, the proportion of thermal energy storage appears insignificant due to its lowest specific capital cost in Table 7.
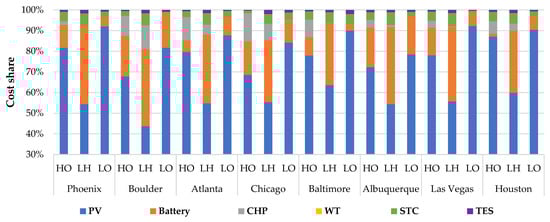
Figure 7.
Cost share of LCC of each subsystem in LCC of optimized distributed energy system.
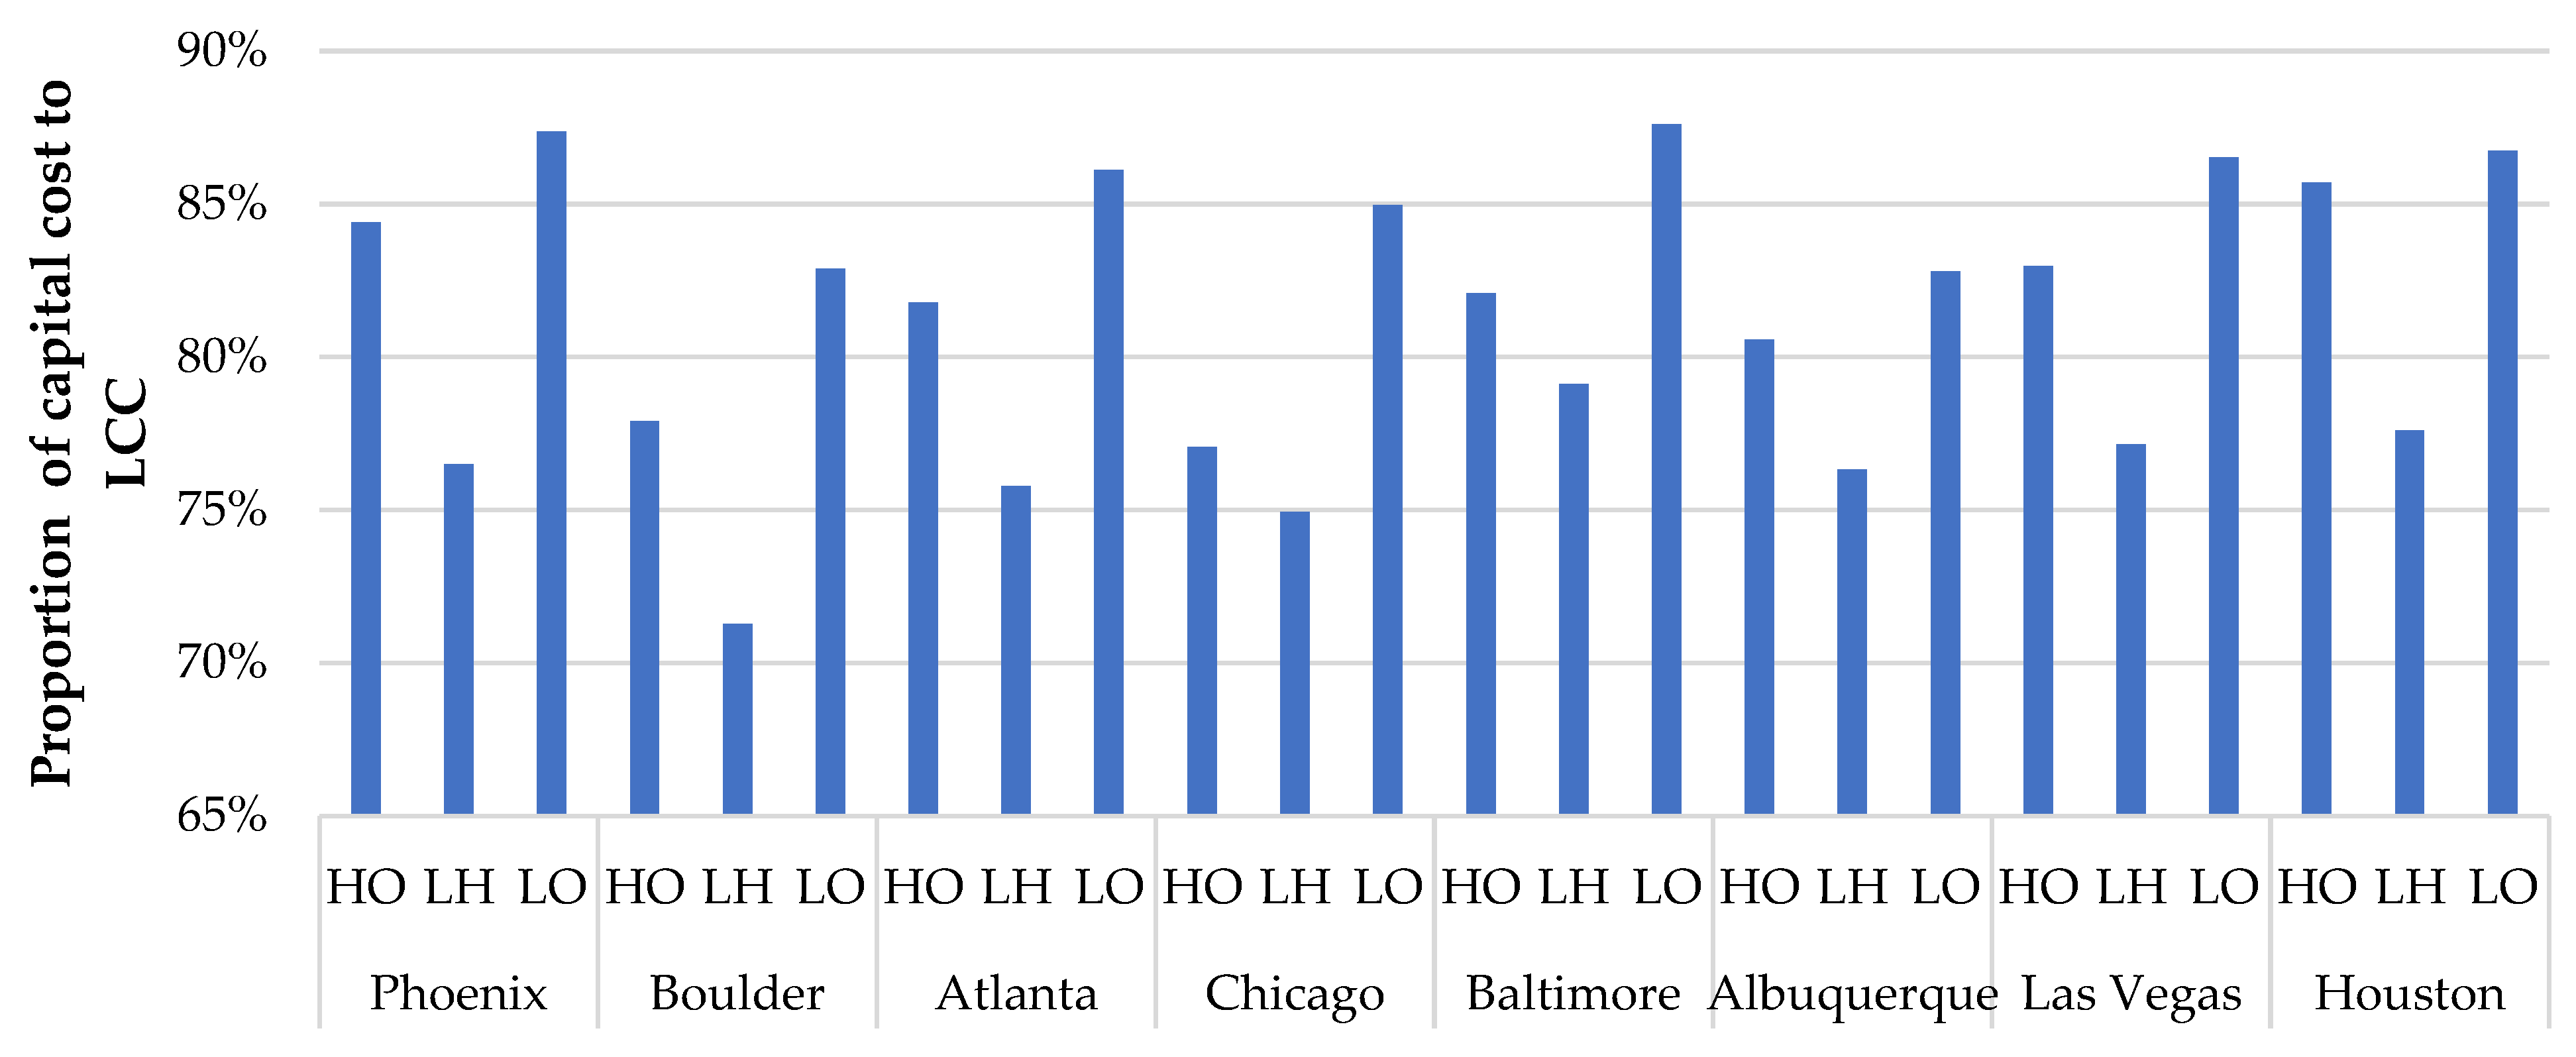
The total life cycle cost includes capital investment, operation and maintenance expenses, and replacement costs. When evaluating the financial viability of a project, it is necessary to allocate sufficient funds to cover the initial investment required for installation. The cost share of the total capital cost of DES subsystems within the total life cycle cost is depicted in Figure 8. In all scenarios, the main factor driving the life cycle cost of distributed energy systems is the proportion of capital investment, which accounts for over 70% of the total life cycle cost. From Figure 8, it can be seen that the proportion of the capital cost of the DES for large hotels is lower compared to hospitals and large offices in the same climate zone despite the use of the largest BES and TES system that is replaced after 12 years. This is due to the lowest number of PV being used, which has the highest capital cost out of the selected technologies.
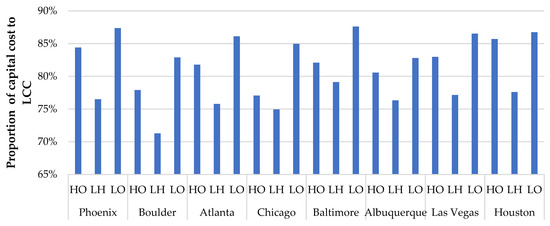
Figure 8.
Cost share of total capital cost in LCC of optimized distributed energy system.
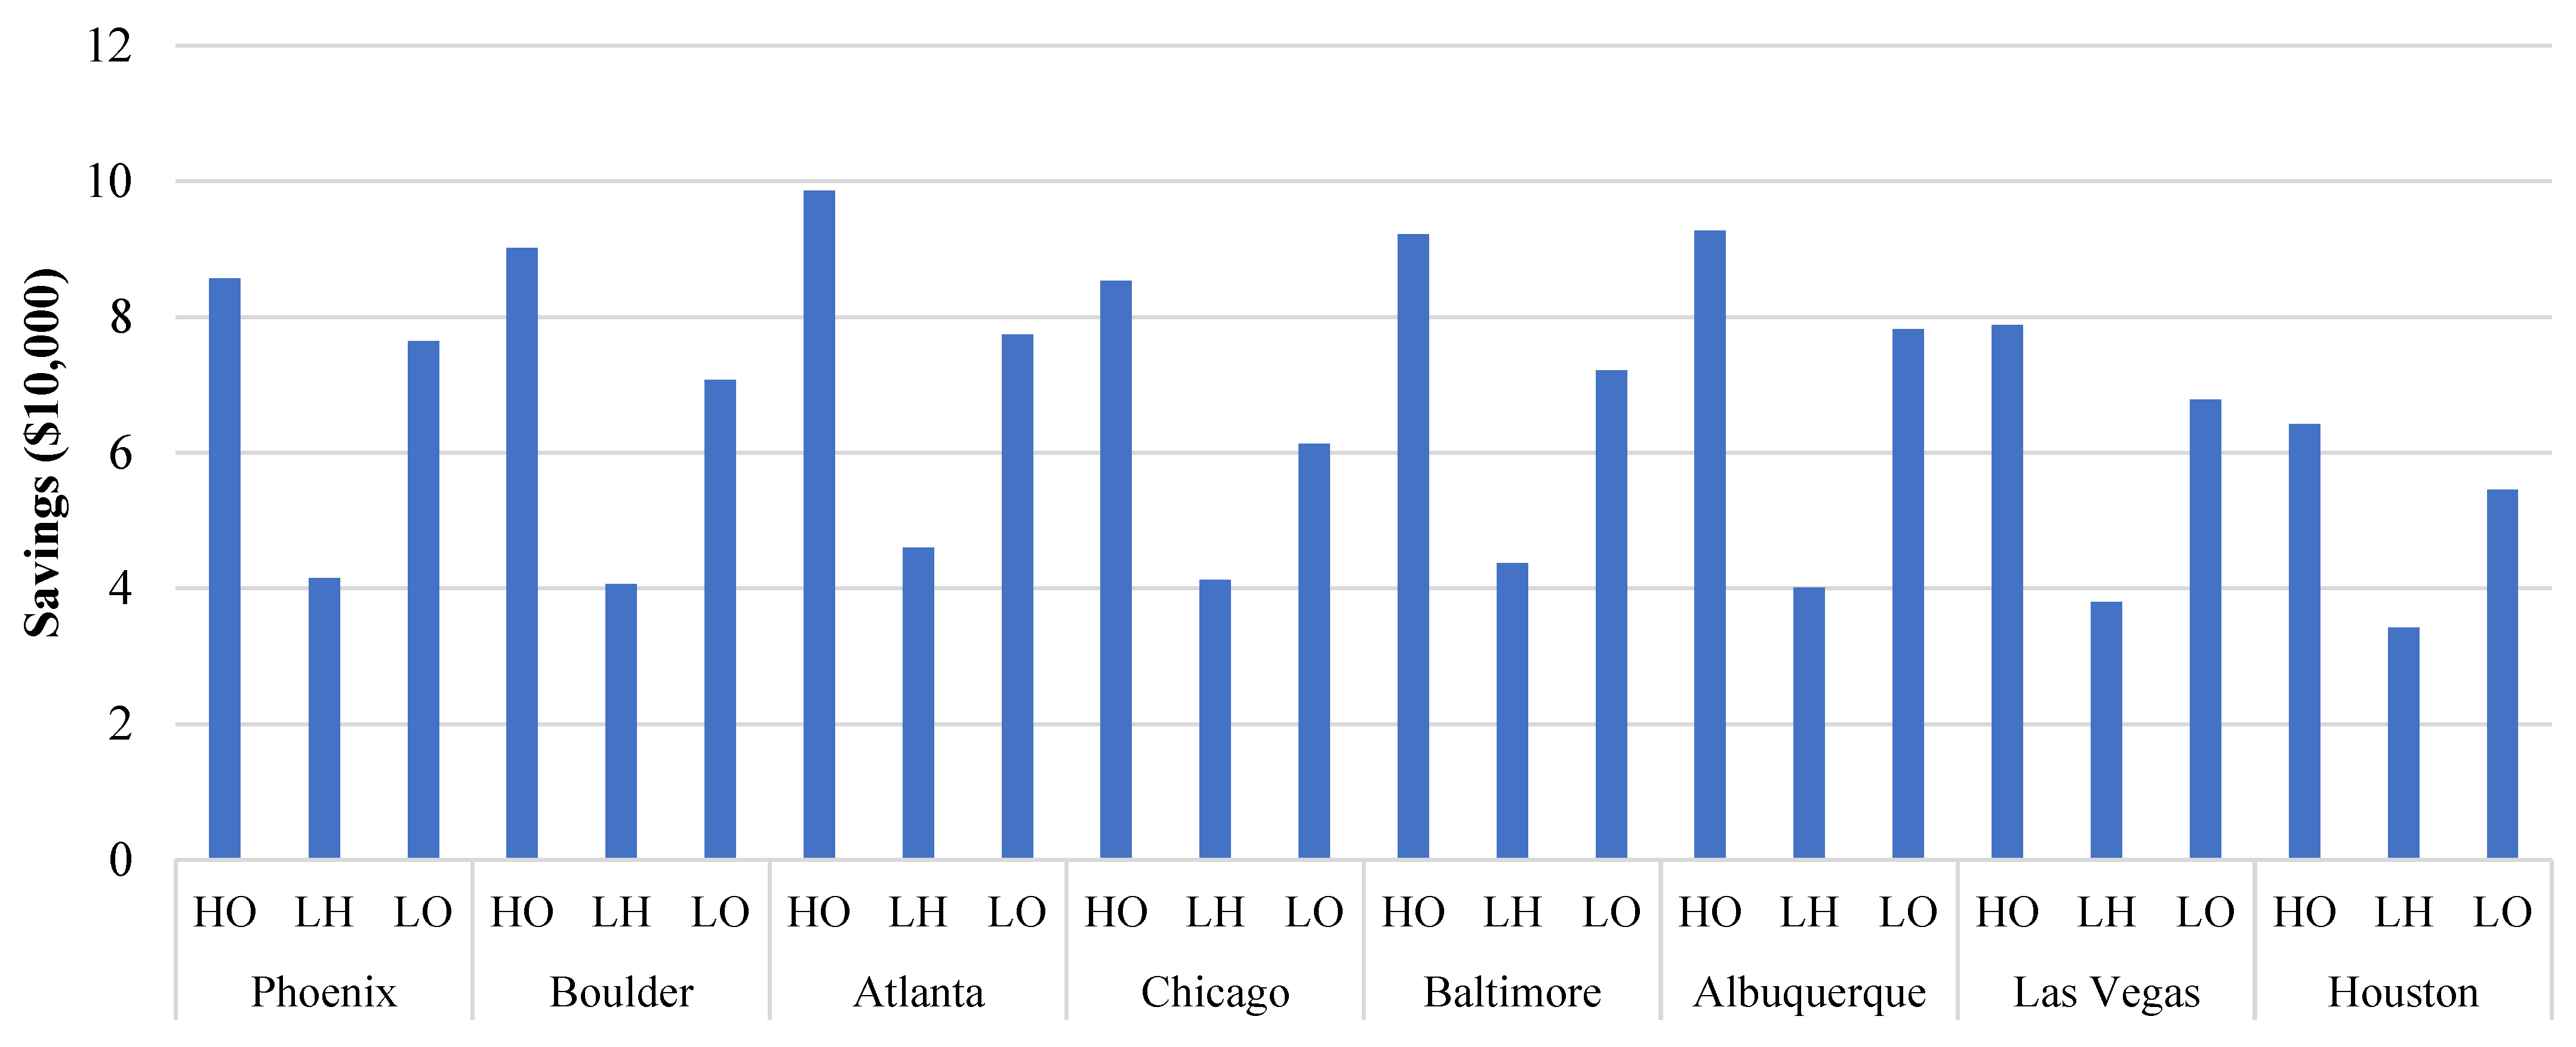
By generating power on-site, the use of a DES can significantly reduce fuel consumption and the cost of importing power from the grid, resulting in cost savings that are demonstrated in Figure 9. Note that the cost savings reported are for a 12-week period within which the simulation was conducted. Within a specific climate location, hospitals have the highest amount of savings, followed by large offices and then large hotels. This trend is directly related to the scale of their corresponding distributed energy systems outlined in Table 7. Consequently, greater savings are achieved for a larger capacity of the subsystems within the DES. The cost of grid electricity is also an important factor that impacts the potential savings derived from a DES. The cost savings resulting from the implementation of distributed energy systems in Houston and Las Vegas are on the lower end compared to other locations for buildings of the same type due to their lowest grid electricity costs in Table 6.
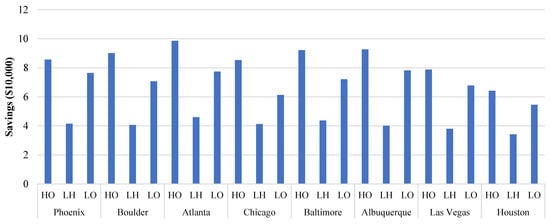
Figure 9.
Savings from implementation of optimized DES.
3.3. Optimized Distributed Energy System Operation Performance
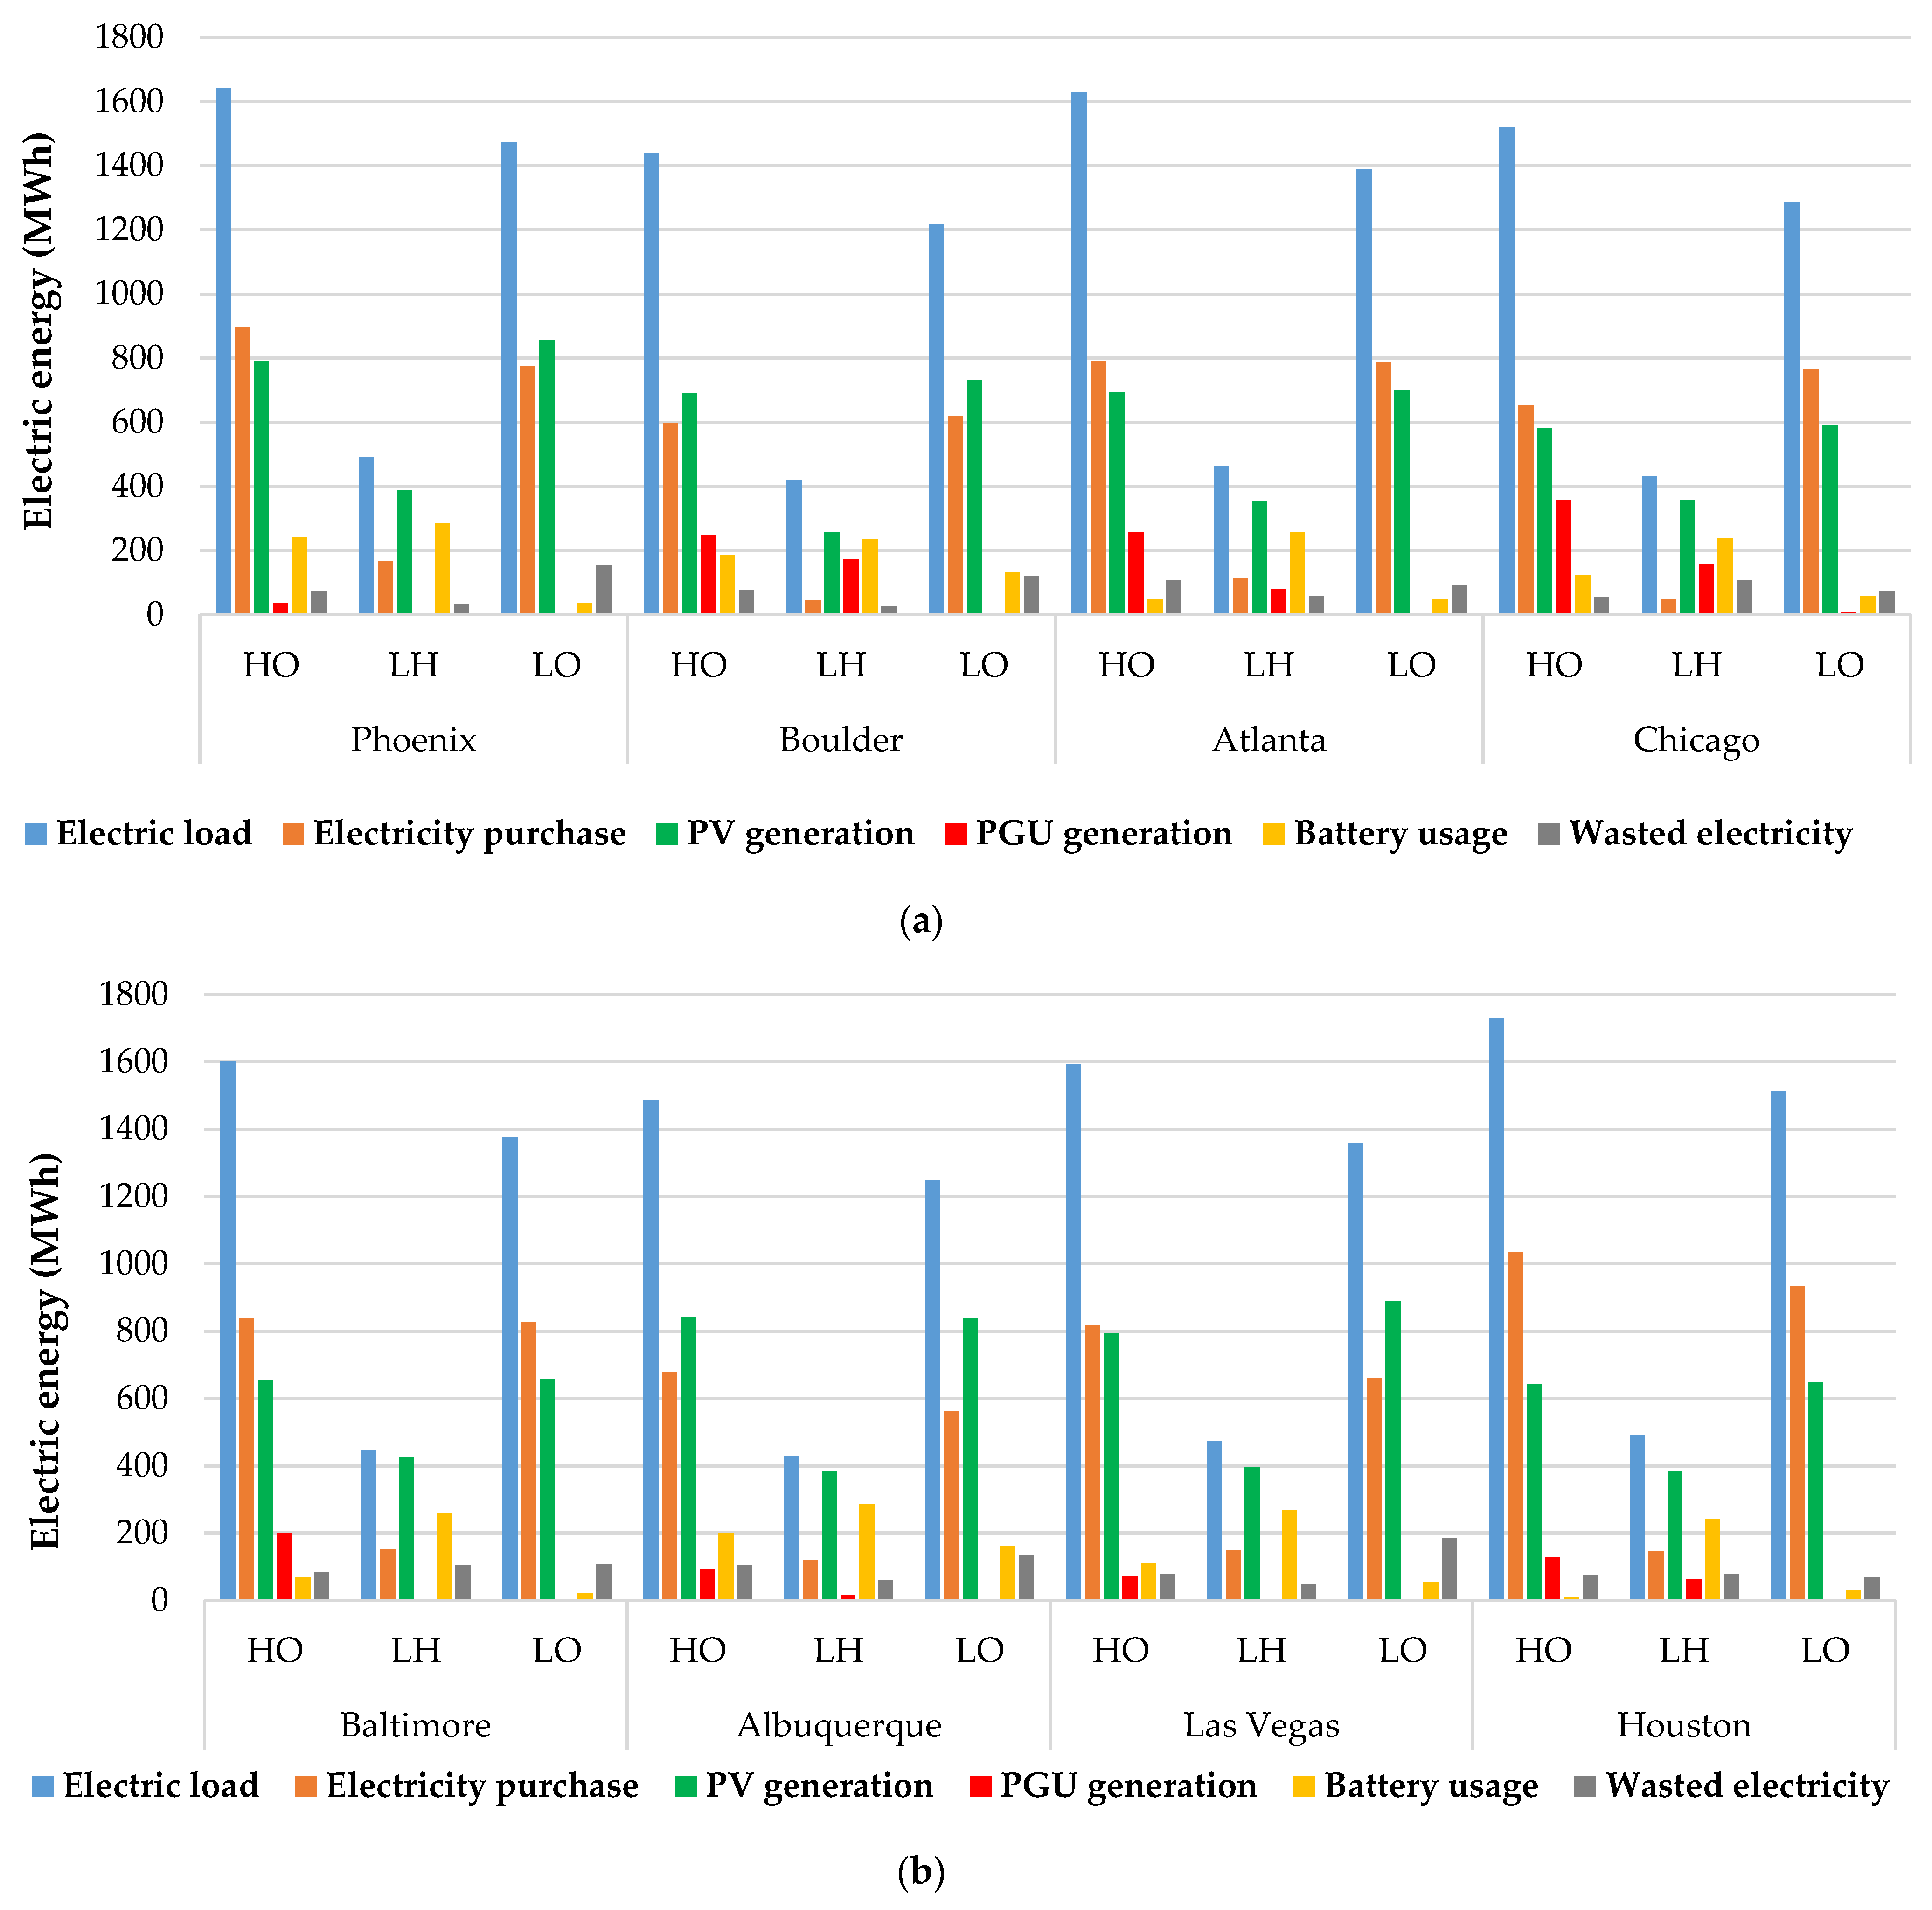
Figure 10a,b illustrates the electric load, imported electricity, power generated by PV and CHP, battery utilization, and wasted electricity for eight selected locations. Note that the data shown represents a cumulative total over the simulated period of 12 weeks. The “Electric load” in Figure 10a,b represents the building’s electric demand, which is traditionally met entirely by importing electricity from the grid in the absence of a DES. Under the implementation of the optimized DES, it can be observed that there is a significant reduction in the amount of electricity being imported. In hospitals and large offices, this reduction amounts to approximately half, while in large hotels, it is reduced to less than half of the electric load. The term “Battery usage” encompasses both the charging and discharging activities related to the battery system, so the electricity being supplied by BES is approximately half of the battery usage. In all scenarios, a certain amount of electricity is wasted despite integrating BES due to their limited capacity or rated power. Expanding the battery capacity to store this otherwise wasted electricity is not economically justified due to the increase in cost associated with it. It is also worth noting that if policies such as net metering are in place, the option of selling the electricity back to the grid would increase the cost savings or eliminate the BES in some cases.
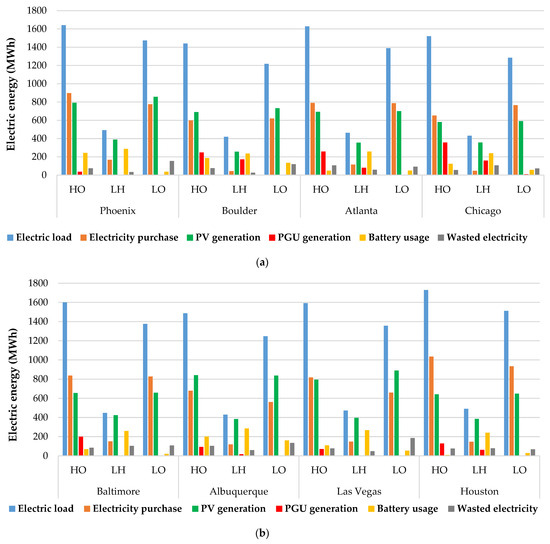
Figure 10.
Electric load, grid import, and supply from DES: (a) For HO, LH, LO located in four locations; (b) For HO, LH, LO located in remaining four locations.
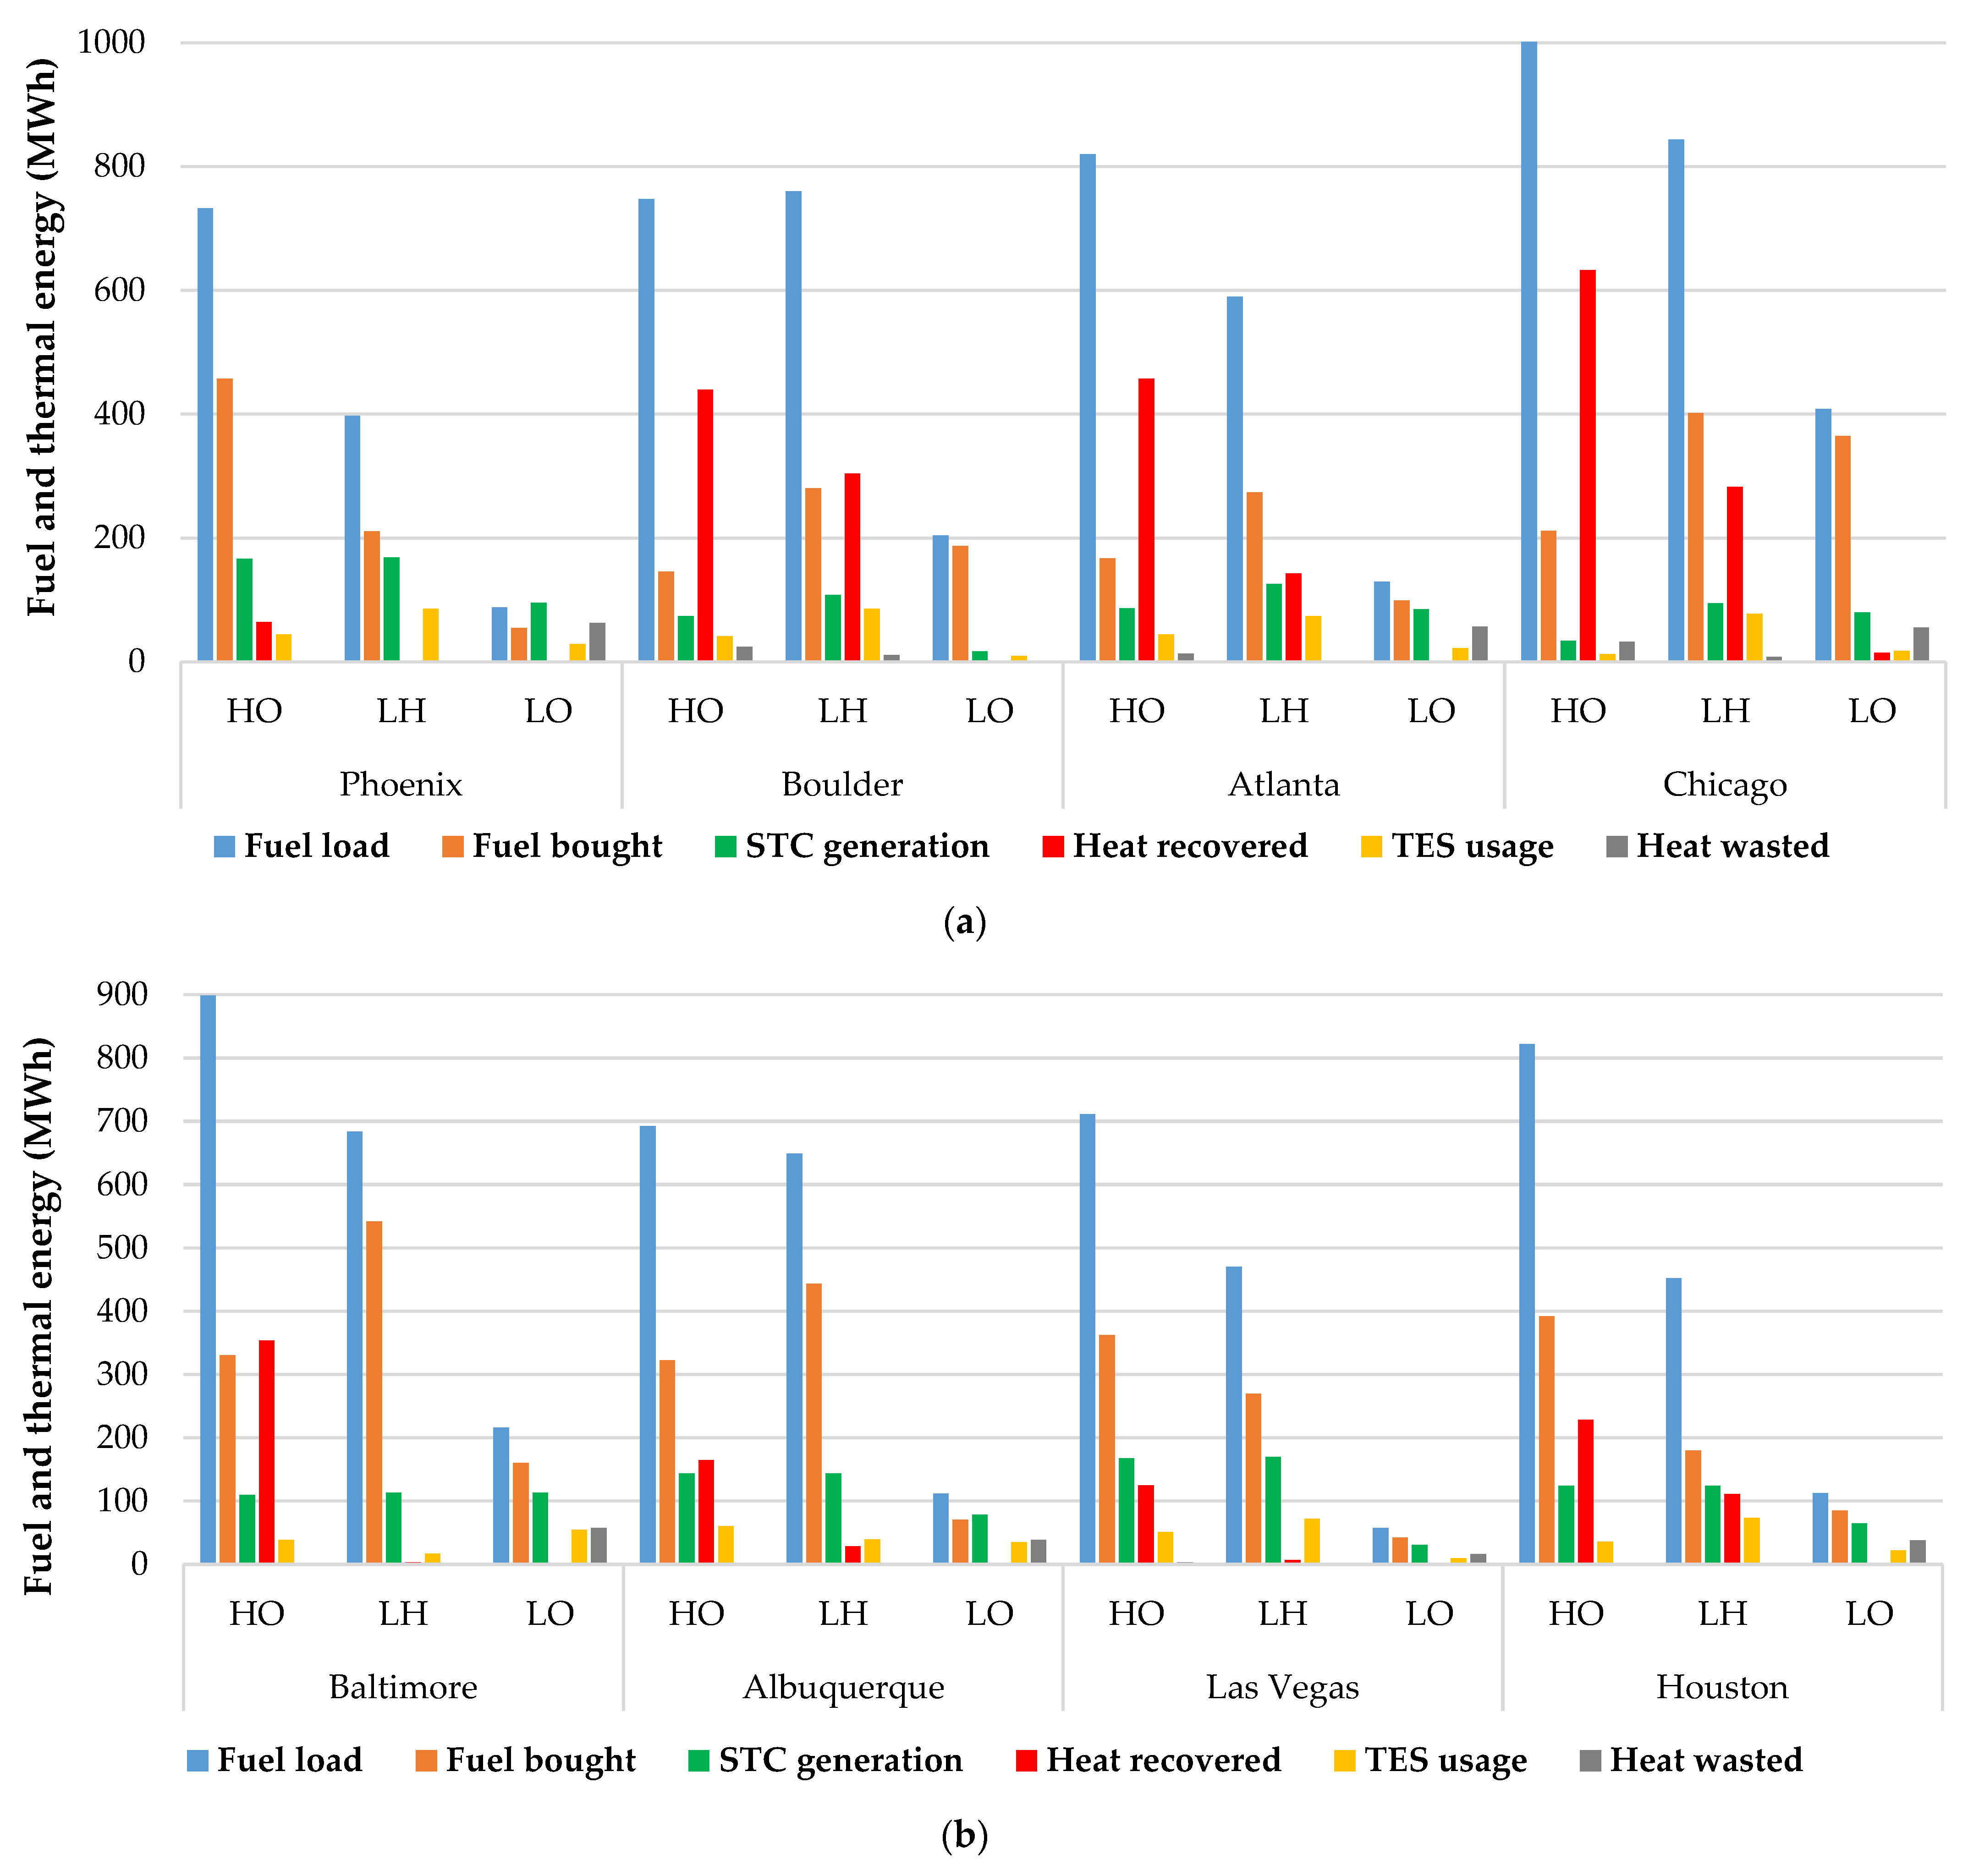
Likewise, Figure 11a,b depicts the fuel load, thermal energy provided by STC, heat recovery from PGU, TES usage, and wasted heat for each case scenario over 12 weeks. The term “Fuel load” refers to the quantity of fuel that is required by the boiler in order to fulfill thermal energy requirements prior to implementing a distributed energy system. The “Fuel bought” is the amount of fuel needed for the boiler used within the DES. Note that the fuel purchased for PGU is not included. “TES usage”, similar to “battery usage”, denotes both charging and discharging amounts during the simulation period. The “wasted heat” is due to the TES capacity limitation. Expanding the BES/TES capacity to store this otherwise wasted electricity/heat is not economically justified due to the increase in costs associated with it.
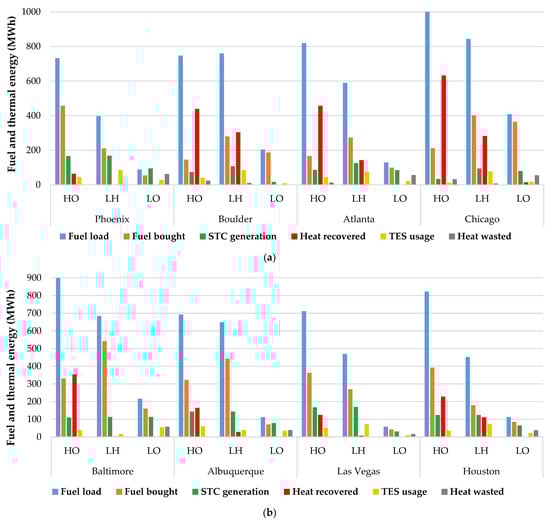
Figure 11.
Fuel load, purchase, and thermal energy supply from DES: (a) For HO, LH, LO located in four locations; (b) For HO, LH, LO located in remaining four locations.
4. Conclusions
This paper develops an optimization model for the design of distributed energy systems to identify optimal capacities for DES components that minimize life-cycle costs and maximize reduction in carbon emissions. Based on the results and analysis, the following conclusions can be drawn:
- When considering the trade-offs between life cycle cost and RCDE, photovoltaic systems are favored in an optimal distributed energy system.
- The impact of optimized DES is evaluated in terms of cost savings, energy usage, carbon emission reductions, and life-cycle costs in these buildings. Among the studied locations, Boulder exhibits the highest reduction in carbon dioxide emissions for buildings of the same type.
- The cost savings derived from the implementation of DES among selected building types in different locations, hospitals, and large offices generally reap greater benefits when compared to large hotels. However, Large hotels, particularly the one located in Las Vegas, achieve the lowest life-cycle costs.
- The ratio of RCDE to LCC differs based on building type and location, with all three buildings in Boulder having the largest value, indicating a higher amount of emission reduction per dollar spent. When comparing three building types located in the same climate zone, a hospital building has the highest ratio value, followed by a large office and then a large hotel.
- The primary factor contributing to the life cycle cost of a DES is the initial capital investment, which constitutes more than 70% of the total expenditure in every instance.
Author Contributions
Conceptualization, J.Z. and H.C.; methodology, J.Z. and K.M.; software, J.Z. and K.M.; formal analysis, Y.C.; investigation, K.M.; writing—original draft preparation, K.M. and J.Z.; writing—review and editing, H.C. and Y.C.; visualization, K.M. and J.Z.; supervision, J.Z. and H.C. All authors have read and agreed to the published version of the manuscript.
Funding
This research was funded by the Research Booster Program and Research Enhancement Program from the University of Wisconsin Green Bay.
Data Availability Statement
The data presented in this study are available upon request from the corresponding author.
Acknowledgments
It is worth noting that the present paper is an extension of the authors’ previous conference article [47]. In comparison to [47], this current work includes a more comprehensive background investigation and a more thorough analysis of the results. Additionally, it encompasses a broader range of climate zones.
Conflicts of Interest
The authors declare no conflict of interest.
Nomenclature
| Abbreviations | CM,WT | maintenance cost of WT | |
| BES | battery energy storage | EBES | battery capacity |
| CHP | combined heat and power | Egen | total electric energy generation by DES |
| DES | distributed energy system | EL | building electric load |
| GHG | greenhouse gas | EL,DES | electricity imported with DES |
| HO | hospital | EPGU | electricity generated by the PGU |
| LCC | life cycle cost | ETES | thermal storage capacity |
| LH | large hotel | EFe | emission factor for grid electricity |
| LO | large office | EFf | emission factor for natural gas |
| MOGA | multi-objective genetic algorithm | f | active surface area fraction |
| PGU | power generation unit | FL,DES | fuel consumed with DES |
| PW | present worth | FPGU | fuel energy required to operate PGU |
| PV | photovoltaic | GT | total solar radiation |
| RCDE | reduction of carbon dioxide emission | NPV | number of PV |
| SOC | state of charge | NSTC | number of STC |
| STC | solar thermal collector | NWT | number of WT |
| TES | thermal energy storage | PBES | rated power of BES |
| WT | wind turbine | PC | charging power |
| PDC | discharging power | ||
| Variables | Pgen | electric generation power by DES | |
| As | surface area of PV module | Pload | building electric power |
| ASTC | surface area of STC | PPGU | rated power of PGU |
| Ccap | specific capacity cost of BES | PPV | PV power generation |
| Cp | rotor power coefficient | PWT | wind turbine power generation |
| CPGU | specific capital cost of PGU | Pr | present worth factor |
| Cpower | specific power cost of BES | Qboiler | thermal energy from boiler |
| CPV | specific capital cost of PV | QC | thermal energy charged by TES |
| CSTC | unit solar thermal collector cost | QDC | thermal energy discharged by TES |
| CTES | specific capacity cost of TES | QL | building heating load |
| CWT | specific capacity cost of WT | QR | recovered thermal energy |
| CapPV | capacity of the PV | QSTC | heat from solar thermal collector |
| CapWT | capacity of WT | Tamb | ambient air temperature |
| CostC | total capital cost of DES | Tin | inlet water temperature |
| Coste | cost of grid electricity | yint | y-intercept of STC |
| Costf | cost of fuel | ||
| CostM | total maintenance cost of DES | Greek | |
| CostO | total operation cost of DES | η | efficiency |
| CostR | total replacement cost of DES | ||
| CostC,BES | capital cost of BES | Subscripts | |
| CostC,PGU | capital cost of PGU | C | battery charging |
| CostC,PV | capital cost of PV | cell | module cell |
| CostC,STC | capital cost of STC | DC | battery discharging |
| CostC,TES | capital cost of TES | inverter | DC to AC conversion |
| CostC,WT | capital cost of WT | TC | TES charging |
| CM,BES | maintenance cost of BES | TDC | TES discharging efficiency |
| CM,PGU | maintenance cost of PGU | HRS | heat recovery system |
| CM,PV | maintenance cost of PV | ||
| CM,STC | maintenance cost of STC | ||
References
- Bouffard, F.; Kirschen, D.S. Centralised and distributed electricity systems. Energy Policy 2008, 36, 4504–4508. [Google Scholar] [CrossRef]
- Ding, F.; Li, P.; Wang, C.; Gao, F. Modeling and Simulation of Grid-Connected Hybrid Photovoltaic/Battery Distributed Generation System RHYTHM View Project Artificial Intelligence Driven Smart Community Control to Accelerate PV Adoption and Enhance Grid Resilience View Project Modeling and Simulation of Grid-Connected Hybrid Photovoltaic/Battery Distributed Generation System. 2010. Available online: https://www.researchgate.net/publication/241180649 (accessed on 24 September 2023).
- Kim, H.; Jung, Y.; Oh, J.; Cho, H.; Heo, J.; Lee, H. Development and evaluation of an integrated operation strategy for a poly-generation system with electrical and thermal storage systems. Energy Convers. Manag. 2022, 256, 115384. [Google Scholar] [CrossRef]
- Chen, Z.; Su, C.; Wu, Z.; Wang, W.; Chen, L.; Yang, L.; Kong, Y.; Du, X. Operation strategy and performance analyses of a distributed energy system incorporating concentrating PV/T and air source heat pump for heating supply. Appl. Energy 2023, 341, 121125. [Google Scholar] [CrossRef]
- Zhang, J.; Cho, H.; Luck, R.; Mago, P.J. Integrated photovoltaic and battery energy storage (PV-BES) systems: An analysis of existing financial incentive policies in the US. Appl. Energy 2018, 212, 895–908. [Google Scholar] [CrossRef]
- Wang, J.; Deng, H.; Qi, X. Cost-based site and capacity optimization of multi-energy storage system in the regional integrated energy networks. Energy 2022, 261, 125240. [Google Scholar] [CrossRef]
- Sameti, M.; Haghighat, F. Integration of distributed energy storage into net-zero energy district systems: Optimum design and operation. Energy 2018, 153, 575–591. [Google Scholar] [CrossRef]
- Liu, Z.; Li, Y.; Fan, G.; Wu, D.; Guo, J.; Jin, G.; Zhang, S.; Yang, X. Co-optimization of a novel distributed energy system integrated with hybrid energy storage in different nearly zero energy community scenarios. Energy 2022, 247, 123553. [Google Scholar] [CrossRef]
- Falke, T.; Krengel, S.; Meinerzhagen, A.K.; Schnettler, A. Multi-objective optimization and simulation model for the design of distributed energy systems. Appl. Energy 2016, 184, 1508–1516. [Google Scholar] [CrossRef]
- Liu, X.; Yan, Z.; Wu, J. Optimal coordinated operation of a multi-energy community considering interactions between energy storage and conversion devices. Appl. Energy 2019, 248, 256–273. [Google Scholar] [CrossRef]
- Zhang, J.; Cho, H.; Mago, P.J.; Zhang, H.; Yang, F. Multi-Objective Particle Swarm Optimization (MOPSO) for a Distributed Energy System Integrated with Energy Storage. J. Therm. Sci. 2019, 28, 1221–1235. [Google Scholar] [CrossRef]
- Wang, B.; Yu, X.; Wu, Q.; Li, Z.; Jiang, R.; Qian, G.; Huang, R. Case studies of a distributed building energy system incorporating with EVs considering effects of random charging behaviors and time-of-use pricing in electricity. Case Stud. Therm. Eng. 2022, 38, 102297. [Google Scholar] [CrossRef]
- Zhang, D.; Zhang, R.; Zhang, B.; Zheng, Y.; An, Z. Environment dominated evaluation modeling and collocation optimization of a distributed energy system based on solar and biomass energy. Renew Energy 2023, 202, 1226–1240. [Google Scholar] [CrossRef]
- Di Somma, M.; Yan, B.; Bianco, N.; Luh, P.B.; Graditi, G.; Mongibello, L.; Naso, V. Multi-objective operation optimization of a Distributed Energy System for a large-scale utility customer. Appl. Therm. Eng. 2016, 101, 752–761. [Google Scholar] [CrossRef]
- Wang, X.; Xu, Y.; Bao, Z.; Li, W.; Liu, F.; Jiang, Y. Operation optimization of a solar hybrid CCHP system for adaptation to climate change. Energy Convers. Manag. 2020, 220, 113010. [Google Scholar] [CrossRef]
- Bahlawan, H.; Morini, M.; Pinelli, M.; Spina, P.R.; Venturini, M. Simultaneous optimization of the design and operation of multi-generation energy systems based on life cycle energy and economic assessment. Energy Convers. Manag. 2021, 249, 114883. [Google Scholar] [CrossRef]
- Huang, C.; Bai, Y.; Yan, Y.; Zhang, Q.; Zhang, N.; Wang, W. Multi-objective co-optimization of design and operation in an independent solar-based distributed energy system using genetic algorithm. Energy Convers. Manag. 2022, 271, 116283. [Google Scholar] [CrossRef]
- Liu, Y.; Wang, Y.; Luo, X. Design and operation optimization of distributed solar energy system based on dynamic operation strategy. Energies 2021, 14, 69. [Google Scholar] [CrossRef]
- Zhang, S.; Hu, W.; Du, J.; Bai, C.; Liu, W.; Chen, Z. Low-carbon optimal operation of distributed energy systems in the context of electricity supply restriction and carbon tax policy: A fully decentralized energy dispatch strategy. J. Clean. Prod. 2023, 396, 136511. [Google Scholar] [CrossRef]
- Wilcox, S.; Marion, W. Users Manual for TMY3 Data Sets. Published 2008. Available online: https://www.nrel.gov/docs/fy08osti/43156.pdf (accessed on 6 January 2022).
- Singh, M.; Santoso, S. Dynamic Models for Wind Turbines and Wind Power Plants; Subcontract Report NREL/SR-5500-52780; National Renewable Energy Laboratory: Golden, CO, USA, 2011. [Google Scholar]
- Spayde, E.; Mago, P.J.; Luck, R. Economic, energetic, and environmental performance of a solar powered organic rankine cycle with electric energy storage in different commercial buildings. Energies 2018, 11, 276. [Google Scholar] [CrossRef]
- Hodge, B.K. Alternative Energy Sources and Applications; John Wiley & Sons: Hoboken, NJ, USA, 2009. [Google Scholar]
- Mitsubishi Electric. Photovoltaic Modules. Available online: https://www.mitsubishi-pv.de/datasheets/mjt-datasheet.pdf (accessed on 3 October 2023).
- Excel 10 off Grid. Bergey Windpower. 2020. Available online: http://www.bergey.com/products/off-grid-turbines/excel-10-off-grid/ (accessed on 7 January 2022).
- Warren, H.; Mago, P.J.; Knizley, A.; Luck, R. Performance enhancement of a power generation unit–organic Rankine cycle system through the addition of electric energy storage. J. Energy Storage 2017, 10, 28–38. [Google Scholar] [CrossRef]
- Certified Solar Collector. Alternate Energy Technologies. Available online: https://alternateenergycompany.com/home/pdf/AE_Collector_Brochure.pdf (accessed on 8 January 2022).
- Brusco, G.; Burgio, A.; Menniti, D.; Pinnarelli, A.; Sorrentino, N. The economic viability of a feed-in tariff scheme that solely rewards self-consumption to promote the use of integrated photovoltaic battery systems. Appl. Energy 2016, 183, 1075–1085. [Google Scholar] [CrossRef]
- Commercial Reference Buildings. U.S. Department of Energy. Available online: https://www.energy.gov/eere/buildings/commercial-reference-buildings (accessed on 9 January 2022).
- Deru, M.; Field, K.; Studer, D.; Benne, K.; Griffith, B.; Torcellini, P.; Liu, B.; Halverson, M.; Winiarski, D.; Rosenberg, M.; et al. U.S. Department of Energy Commercial Reference Building Models of the National Building Stock; National Renewable Energy Laboratory: Golden, CO, USA, 2011. [Google Scholar]
- U.S. Department of Energy (DOE). EnergyPlus Energy Simulation Software. Available online: https://energyplus.net/ (accessed on 7 January 2022).
- Mongird, K.; Viswanathan, V.; Alam, J.; Vartanian, C.; Sprenkle, V.; Baxter, R. 2020 Grid Energy Storage Technology Cost and Performance Assessment; US Department of Energy: Washinghton, DC, USA, 2020. [Google Scholar]
- Average Lifespan of a Hot Water Heater. Oliver Heating & Cooling. Available online: https://www.oliverheatcool.com/about/blog/news-for-homeowners/the-average-lifespan-of-water-heaters/ (accessed on 18 October 2023).
- Chowdhury, M.S.; Rahman, K.S.; Chowdhury, T.; Nuthammachot, N.; Techato, K.; Akhtaruzzaman, M.; Tiong, S.K.; Sopian, K.; Amin, N. An overview of solar photovoltaic panels’ end-of-life material recycling. Energy Strategy Rev. 2020, 27, 100431. [Google Scholar] [CrossRef]
- Combined Heat and Power. Energy Technology Systems Analysis Programme. May 2010. Available online: https://iea-etsap.org/E-TechDS/PDF/E04-CHP-GS-gct_ADfinal.pdf (accessed on 18 October 2023).
- Ziegler, L.; Gonzalez, E.; Rubert, T.; Smolka, U.; Melero, J.J. Lifetime extension of onshore wind turbines: A review covering Germany, Spain, Denmark, and the UK. Renew. Sustain. Energy Rev. 2018, 82, 1261–1271. [Google Scholar] [CrossRef]
- NREL Annual Technology Baseline. Commercial PV. Available online: https://atb.nrel.gov/electricity/2022/commercial_pv (accessed on 16 January 2023).
- Residential Wind Energy Systems. Bergey Windpower. Available online: http://www.bergey.com/wind-school/residential-wind-energy-systems/ (accessed on 12 January 2022).
- EIA U.S. Energy Information Administration. Capital Cost and Performance Characteristic Estimates for Utility Scale Electric Power Generating Technologies. 2020. Available online: https://www.eia.gov/analysis/studies/powerplants/capitalcost/pdf/capital_cost_AEO2020.pdf (accessed on 16 January 2023).
- Distributed Generation Renewable Energy Estimate of Costs. National Renewable Energy Laboratory (NREL). Available online: http://www.nrel.gov/analysis/tech_lcoe_re_cost_est.html (accessed on 12 January 2022).
- Mongird, K.; Fotedar, V.; Viswanathan, V.; Koritarov, V.; Balducci, P.; Hadjerioua, B. Energy Storage Technology and Cost Characterization Report; Pacific Northwest National Lab: Richland, WA, USA, 2019. [Google Scholar]
- Rockenbaugh, C.; Dean, J.; Lovullo, D.; Lisell, L.; Barker, G.; Hanckock, E.; Norton, P. High Performance Flat Plate Solar Thermal Collector Evaluation. 2016. Available online: https://www.nrel.gov/docs/fy16osti/66215.pdf (accessed on 24 September 2023).
- Natural Gas Prices. EIA U.S. Energy Information Administration. Available online: https://www.eia.gov/dnav/ng/ng_pri_sum_a_EPG0_PCS_DMcf_a.htm (accessed on 5 January 2023).
- eGRID Summary Tables 2020. EPA United States Environmental Protection Agency. Available online: https://www.epa.gov/system/files/documents/2022-01/egrid2020_summary_tables.pdf (accessed on 5 January 2023).
- Carbon Dioxide Emissions Coefficients. EIA U.S. Energy Information Administration. 2022. Available online: https://www.eia.gov/environment/emissions/co2_vol_mass.php (accessed on 13 January 2023).
- Satpathy, R.; Pamuru, V. Off-grid solar photovoltaic systems. In Solar PV Power; Elsevier: Amsterdam, The Netherlands, 2021; pp. 267–315. [Google Scholar] [CrossRef]
- Maharjan, K.; Zhang, J.; Cho, H.; Chen, Y. Distributed Energy Systems Design Optimization Based on Life Cycle Environmental and Economic Impacts. In Proceedings of the ASME 2022 16th International Conference on Energy Sustainability, ES 2022, Philadelphia, PA, USA, 11–13 July 2022. [Google Scholar] [CrossRef]


Disclaimer/Publisher’s Note: The statements, opinions and data contained in all publications are solely those of the individual author(s) and contributor(s) and not of MDPI and/or the editor(s). MDPI and/or the editor(s) disclaim responsibility for any injury to people or property resulting from any ideas, methods, instructions or products referred to in the content. |
© 2023 by the authors. Licensee MDPI, Basel, Switzerland. This article is an open access article distributed under the terms and conditions of the Creative Commons Attribution (CC BY) license (https://creativecommons.org/licenses/by/4.0/).