Case Report

An Experimental Study on the Heat and Mass Transfer Characteristics of an Evaporative Cooler

School of Energy and Environmental Engineering, University of Science and Technology Beijing, Beijing 100083, China
*
Author to whom correspondence should be addressed.
Energies 2023, 16(21), 7330; https://doi.org/10.3390/en16217330
Submission received: 26 September 2023 / Revised: 23 October 2023 / Accepted: 27 October 2023 / Published: 29 October 2023
(This article belongs to the Section J1: Heat and Mass Transfer)

Abstract

:
To study the heat and mass transfer characteristics of an evaporative cooler for cooling high-temperature working fluids, an experimental device of the evaporative cooler was built, and a corresponding test system was constructed. Then, the experimental study was carried out based on an orthogonal experimental design, and the law and extent of the influence of water flow in the tube, the spray water flow rate, the inlet water temperature in the tube, and the air flow rate on the heat dissipation, cooling efficiency, and heat and mass transfer coefficients were obtained. The correlation equations of the heat and mass transfer coefficients were obtained by fitting the orthogonal experimental data, and the validity of the correlation equations was confirmed by the verification experiment.

1. Introduction

Evaporative coolers have the advantages of saving water [1], saving energy [2], and having a compact structure, and have been widely used in industrial cooling [2,3,4], heat pump systems [5], refrigeration systems [6], data centers [7], and other fields. To design evaporative coolers reasonably, extensive research has been carried out on the heat and mass transfer of evaporative coolers.
In terms of experimental research, Facão and Oliveira [8] studied an evaporative cooler used for building heat dissipation and gave the correlation equation of the heat and mass transfer coefficients. Hasan and Sirén [9] conducted a comparative study on two evaporative coolers and found that the heat and mass transfer coefficients of finned tubes are lower than those of bare tubes. Yoo et al. [10] studied the influence of the spray water flow rate on the cooling efficiency and heat dissipation of evaporative coolers, gave the correlation equation of the mass transfer coefficient, and carried out experimental verification. Heyns and Kröger [11] found that the heat transfer coefficient of an evaporative cooler is a function of airflow velocity, spray water velocity, and spray water temperature, and the mass transfer coefficient is a function of airflow velocity and spray water velocity. According to the experimental results, the correlation equations of the heat transfer coefficient and mass transfer coefficient were established. Zheng et al. [12,13,14] studied an evaporative cooler using elliptical tubes, analyzed the influence of the parameters of water in the tube, spray water, and airflow on the performance of the evaporative cooler, and obtained the correlation equation of the heat and mass transfer coefficients. Jiang et al. [15] studied an evaporative cooler using plate-finned tubes and obtained the correlation equation of the heat and mass transfer coefficients. Tu et al. [16] experimentally investigated a novel non-packing closed evaporative cooling tower with vertical 3D deformation tubes. The results showed that this cooling tower had higher heat and mass transfer efficiency in dealing with air, resulting in lower water consumption, and avoiding the clogging problem of the packing layer. Yu et al. [17] experimentally evaluated the heat and mass transfer performance and exergy performance of a cooling tower under different inlet parameters. The results indicated that the inlet temperature has a greater impact on the performance of a cooling tower, while the influence of the inlet humidity is relatively small. Ruiz et al. [18] presented a thermal performance and emissions analysis of a new cooling tower prototype. Experimental results showed that the cooling tower had high thermal efficiency, effectively removing heat from the system.
In terms of numerical simulation and algorithm optimization, Stabat and Marchio [19] proposed a simplified model based on the heat transfer unit number method and analyzed the characteristics of the heat and mass transfer process of an evaporative cooler. Papaefthimiou et al. [20] evaluated the sensitivity of the thermal performance characteristics of an evaporative cooler to the inlet air condition based on a thermodynamic model. The study found that the lower the wet bulb temperature of the inlet air, the higher the water temperature drop in the pipe and the evaporation of spray water. Zheng et al. [21] established a mathematical model of an evaporative cooler based on MATLAB R2012b (8.0) software and analyzed the heat and mass transfer mechanisms of the circular tube evaporative cooler. Nasr et al. developed a rapid design algorithm for evaporative coolers with plain tubes [22] and twisted tubes [23], giving the relationship between the heat transfer coefficient, pressure drop, heat transfer area, and mass transfer coefficient. Mahdi and Jaffal [24,25] carried out an exergy analysis on an evaporative cooler and found that the exergy loss is directly proportional to the air flow rate, the water flow rate in the pipe, the water inlet temperature in the pipe, and the wet bulb temperature at the air inlet, and inversely proportional to the spray water flow. The correlation equation of the heat and mass transfer coefficients was established. Wei et al. [26] proposed a simplified calculation method to analyze the performance of two types of evaporative coolers and found that heat dissipation is mainly determined by the air flow rate and the water flow rate in the tube. Xie et al. [27,28,29] carried out numerical simulations on evaporative coolers using plain tubes, elliptical tubes, and finned tubes, and found that the influences of air flow rate, air inlet temperature, and spray water temperature on the heat transfer coefficient decreased in turn, the spray mixing nanoparticles into the water can improve the heat and mass transfer coefficients, and the influence of the air flow rate on heat and mass transfer is higher than that of the spray water flow rate. Lee et al. [30] simulated and experimented with an evaporative cooler using an elliptical tube, mainly studying the influence of the nozzle angle on the heat transfer coefficient. Based on a CFD simulation, Zhu et al. [31] analyzed the influence of the uncertainty of environmental conditions on the performance of evaporative coolers and proposed a multi-scale model for optimizing evaporative coolers and their cooling water systems. Zhao et al. [32] carried out a numerical simulation on an evaporative cooler using elliptical finned tubes, analyzed the influence of wind speed and spray density on the performance of evaporative coolers under different structures, and found that elliptical finned tubes can significantly improve the performance of evaporative coolers. Fang et al. [33] conducted a thermodynamic investigation on the performance of a closed wet cooling tower through experimental and simulation methods. The results indicated that changes in operating temperature and humidity had a significant impact on the cooling tower’s performance. Deng et al. [34] conducted a numerical investigation on the performance of a hybrid mechanical draft wet cooling tower. The results indicated that the cooling tower performed better under higher air flow rates and lower inlet temperature conditions. Xi et al. [35] investigated the heat and mass transfer characteristics of a counterflow wet cooling tower using a new type of straight wave packing by experimental and numerical simulation methods. The results indicated that the cooling tower with the new straight wave packing exhibited good heat and mass transfer performance and low pressure drop. Deng and Sun [36] conducted a performance analysis and multi-objective optimization of mechanical draft wet cooling towers based on their water saving, plume, and cooling characteristics by experimental and simulation methods. The results indicated that appropriate operating strategies can significantly reduce energy consumption and water usage while meeting cooling requirements.
The above literature review summarizes the sensitive factors affecting the heat and mass transfer characteristics of the evaporative cooler as the water flow rate in the pipe, the water temperature in the pipe, the spray water flow rate, the air flow rate, etc., and most of the literature also obtains the correlation equations of the heat and mass transfer coefficients based on sensitivity analyses. However, as shown by Table 1, the temperature of the medium in the pipes involved in the above research is relatively lower (temperature range: around 15–60 °C), so it is necessary to carry out further research on the working condition of the medium in a tube with a high temperature. Therefore, this study focused on the heat and mass transfer characteristics of an evaporative cooler under the condition of high temperature of the medium in the tube (temperature range: 70–110 °C). For example, in transcritical carbon dioxide refrigeration cycles, the cooling temperature can reach about 130 °C, and the cooling process occurs in sensible heat form, resulting in most of the cooler pipes being at high-temperature conditions [37].
First, the experimental device and test system were constructed, and the performance of the evaporative cooler was experimentally studied based on an orthogonal experimental design. Secondly, through the analysis of the experimental results, the sensitive factors of the heat transfer coefficient and the mass transfer coefficient are clarified, and the correlation equations of the heat and mass transfer coefficients are obtained by fitting the experimental data. Finally, the predictive abilities of the correlation equations are verified by verification experiments.

2. Experimental Study

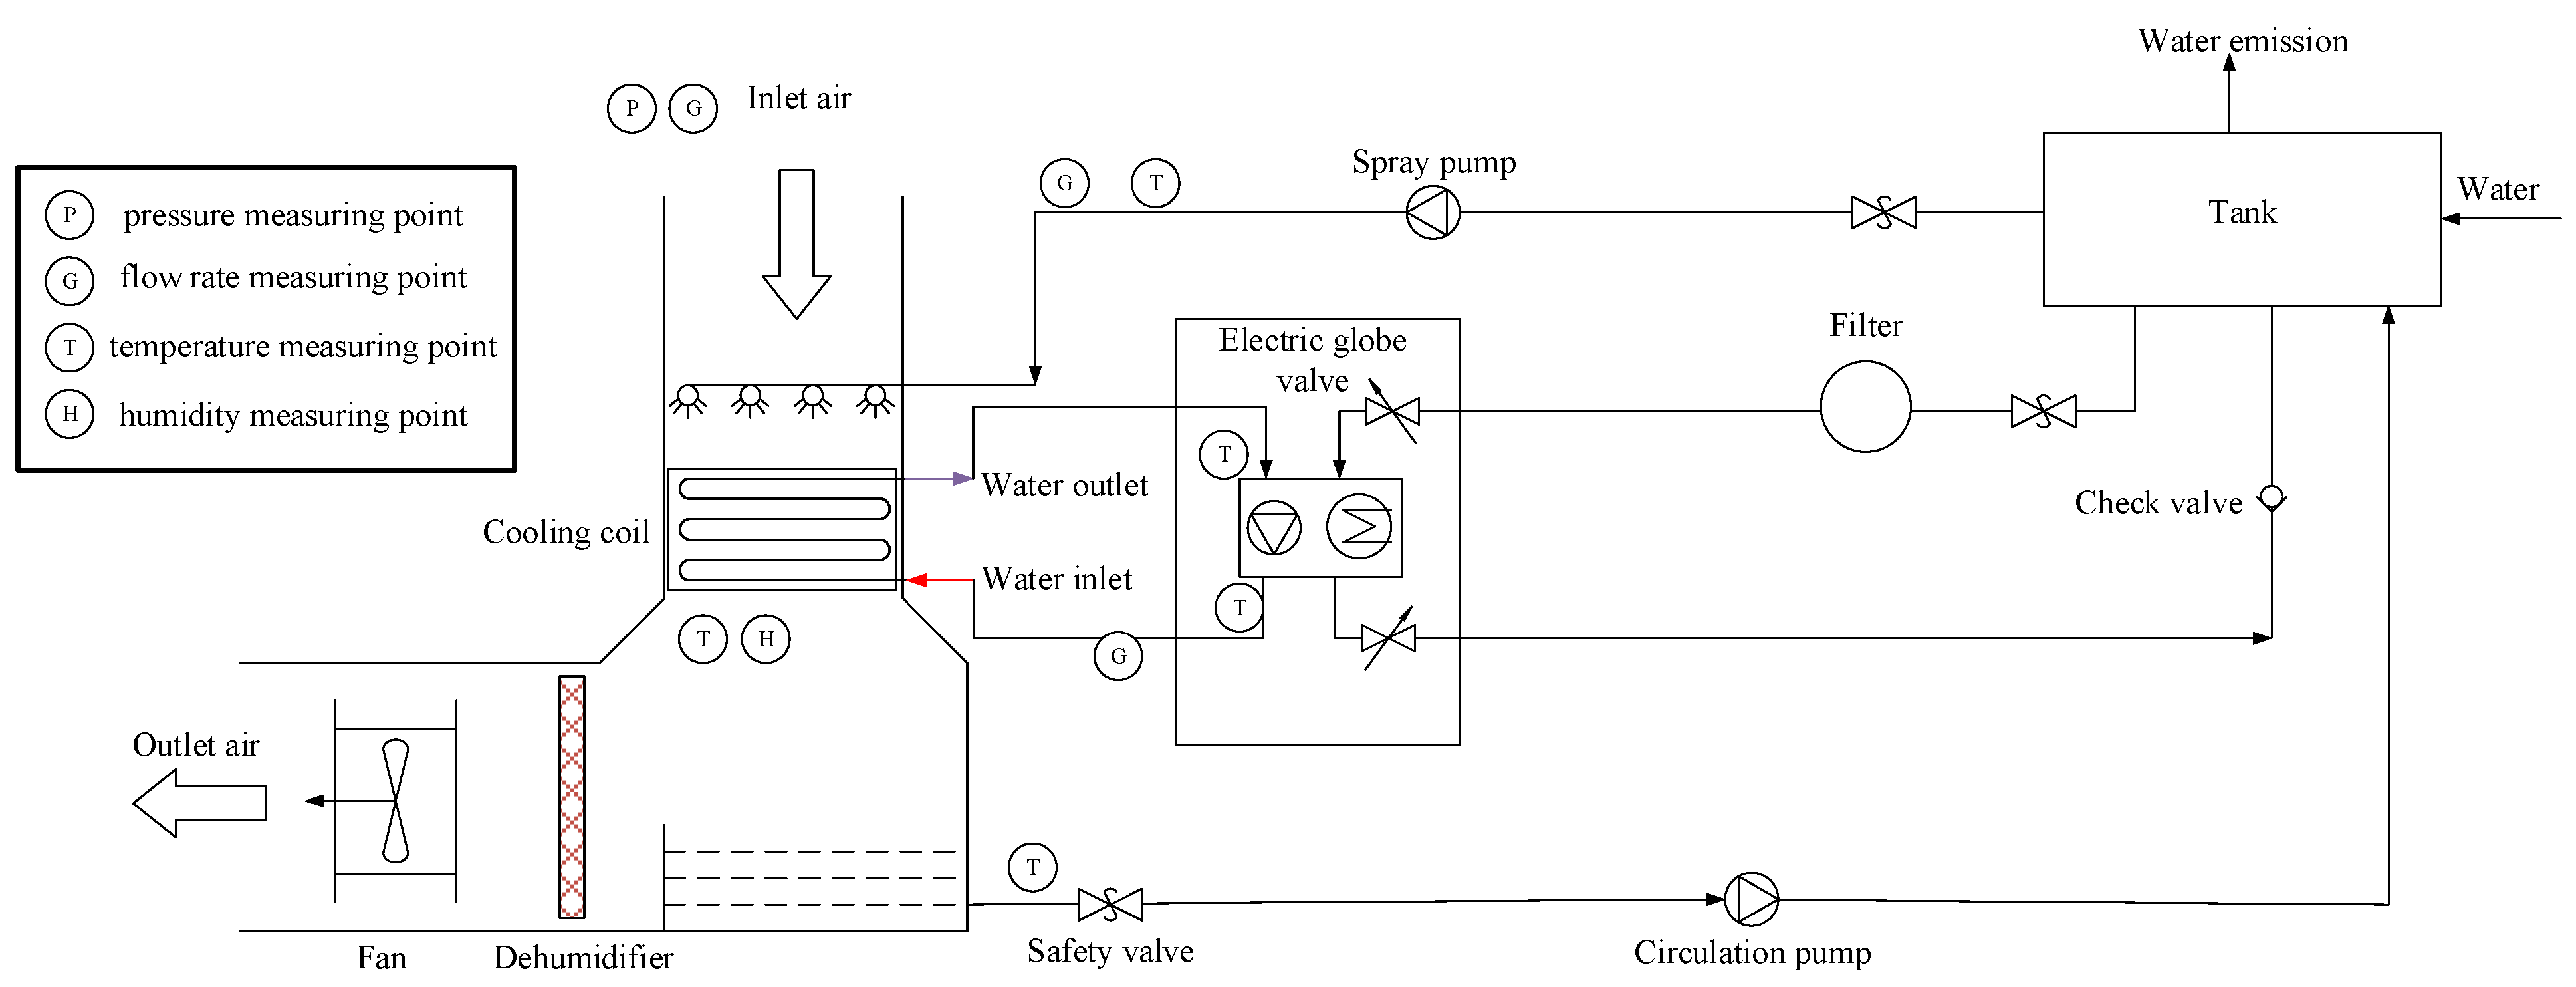
2.1. Experimental Device

Figure 1a,b show the schematic diagram of the experimental setup and the diagram of the actual equipment, respectively. Table 2 shows the structural parameters of the serpentine tubes. The length of the cooling tube bundle (including brackets) was 1020 mm, the width was 610 mm, and the height was 1850 mm. The cooling tubes in the experimental setup were distributed in staggered rows, and two of the columns were taken as characteristic units for the experiment. Each column of tubes contained twenty copper tubes, and the transverse and longitudinal tube spacings were 60 mm and 40 mm, respectively. The material of the coil was copper, and its specifications were ϕ12.0 mm × 1.2 mm. The shell of the experimental device adopted a transparent acrylic plate, to observe the spraying condition and the distribution of the water film outside the tube.

2.2. Test System

Based on the test system shown in Figure 2, the experiment was carried out and completed in an environment with a dry bulb air temperature of 17.0 °C and a wet bulb air temperature of 10.7 °C. In this system, the air flow rate, the spray water flow rate, and the flow rate and the inlet temperature of the water in the tube can be adjusted. The air flow rate is controlled by a fan speed controller. The spray water flow rate is regulated by a valve. The flow rate and the inlet temperature of water in the tube are controlled by a valve and a temperature control unit, respectively. The temperature control unit has a maximum heating power of 20 kW. In addition, the test system also monitors the air outlet temperature and humidity, the outlet temperature of water in the tube, and the inlet and outlet temperatures of the spray water. Table 3 lists the relevant measurement instruments and their parameters.

2.3. Experimental Design

When the experiment involves three or more factors and there may be interactions between the factors, the experimental workload becomes large and even difficult to implement. The application of an orthogonal experimental design [38] has the advantages of high efficiency, speed, and economy. The corresponding orthogonal table can be selected according to the number of factors and the number of levels of the factors in the experiment, and relying on the orthogonality of the orthogonal table to select some representative points for the experiment from full-scale experiments, results equivalent to many full-scale experiments can be achieved with the minimum number of experiments.
An orthogonal experiment design was used to design the experiment scheme, and the heat dissipation, cooling efficiency, heat transfer coefficient, and mass transfer coefficient were used as the investigation indicators. As shown by Table 4, the L25(56) orthogonal table was used to conduct the orthogonal experiment and to analyze the impact of the four factors of (A) the flow rate of water in the tube, (B) the spray water flow rate, (C) the inlet temperature of water in the tube, and (D) the air flow rate at each inspection index. Thereby, the primary and secondary influencing factors affecting each index were screened and obtained. This experiment did not examine the interaction, and the four influencing factors were arranged in the 2nd, 3rd, 4th, and 5th columns of the L25(56) orthogonal table in turn, and the 1st and 6th columns were empty columns for error analysis.

3. Results and Discussion

This chapter analyzes the influence law and influence degree of various influencing factors on the heat dissipation, cooling efficiency, heat transfer coefficient, and mass transfer coefficient. Furthermore, according to the analysis results, the main influencing factors of the heat transfer coefficient and mass transfer coefficient are clarified, and the correlation equations of the heat transfer coefficient and mass transfer coefficient are obtained by fitting the experimental data.

3.1. Effects of Various Influencing Factors on Heat Dissipation

The heat dissipation of the evaporative cooler directly reflects its cooling capacity, and the calculation equation is:
Q t = m t c p ( T ti T to )
where   Q t ,   m t ,   c p ,   T ti , and T to are heat dissipation (kW), the mass flow rate of water in the tube (kg·s−1), the heat capacity of water (kJ·kg−1·°C−1), the inlet temperature of water in the tube (°C), and the outlet temperature of water in the tube (°C), respectively.
Figure 3 shows the relationship between the heat dissipation of the evaporative cooler and various influencing factors. As shown in Figure 3, with an increase in the levels of various influencing factors, heat dissipation is on the rise; that is, heat dissipation is positively correlated with the flow rate of water in the tube, the inlet temperature of water in the tube, the spray water flow rate, and the air flow rate. It shows that increasing the spray water flow rate, the water flow rate in the tube, the water temperature in the tube, and the air flow rate are all conducive to cooling and heat dissipation, but the above factors exert their influence on heat dissipation in different ways, resulting in different degrees of influence. To quantitatively analyze the influence of each influencing factor on heat dissipation, this paper conducts a variance analysis on the experimental data, and the results of the variance analysis based on the F test are shown in Table 5. Statistics usually judge the significance of factors based on a significant level equal to 0.05, so this paper selects a significant level of 0.05 to distinguish whether the influencing factors are significant.
Table 5 shows that the flow rate and the inlet temperature of water in the tube have the most significant influences on heat dissipation, followed by the spray water flow rate, and the air flow rate has no obvious effect. Therefore, to increase the heat dissipation of an evaporative cooler, one can first consider increasing the flow rate and the inlet temperature of water in the tube and then consider increasing the spray water flow rate.

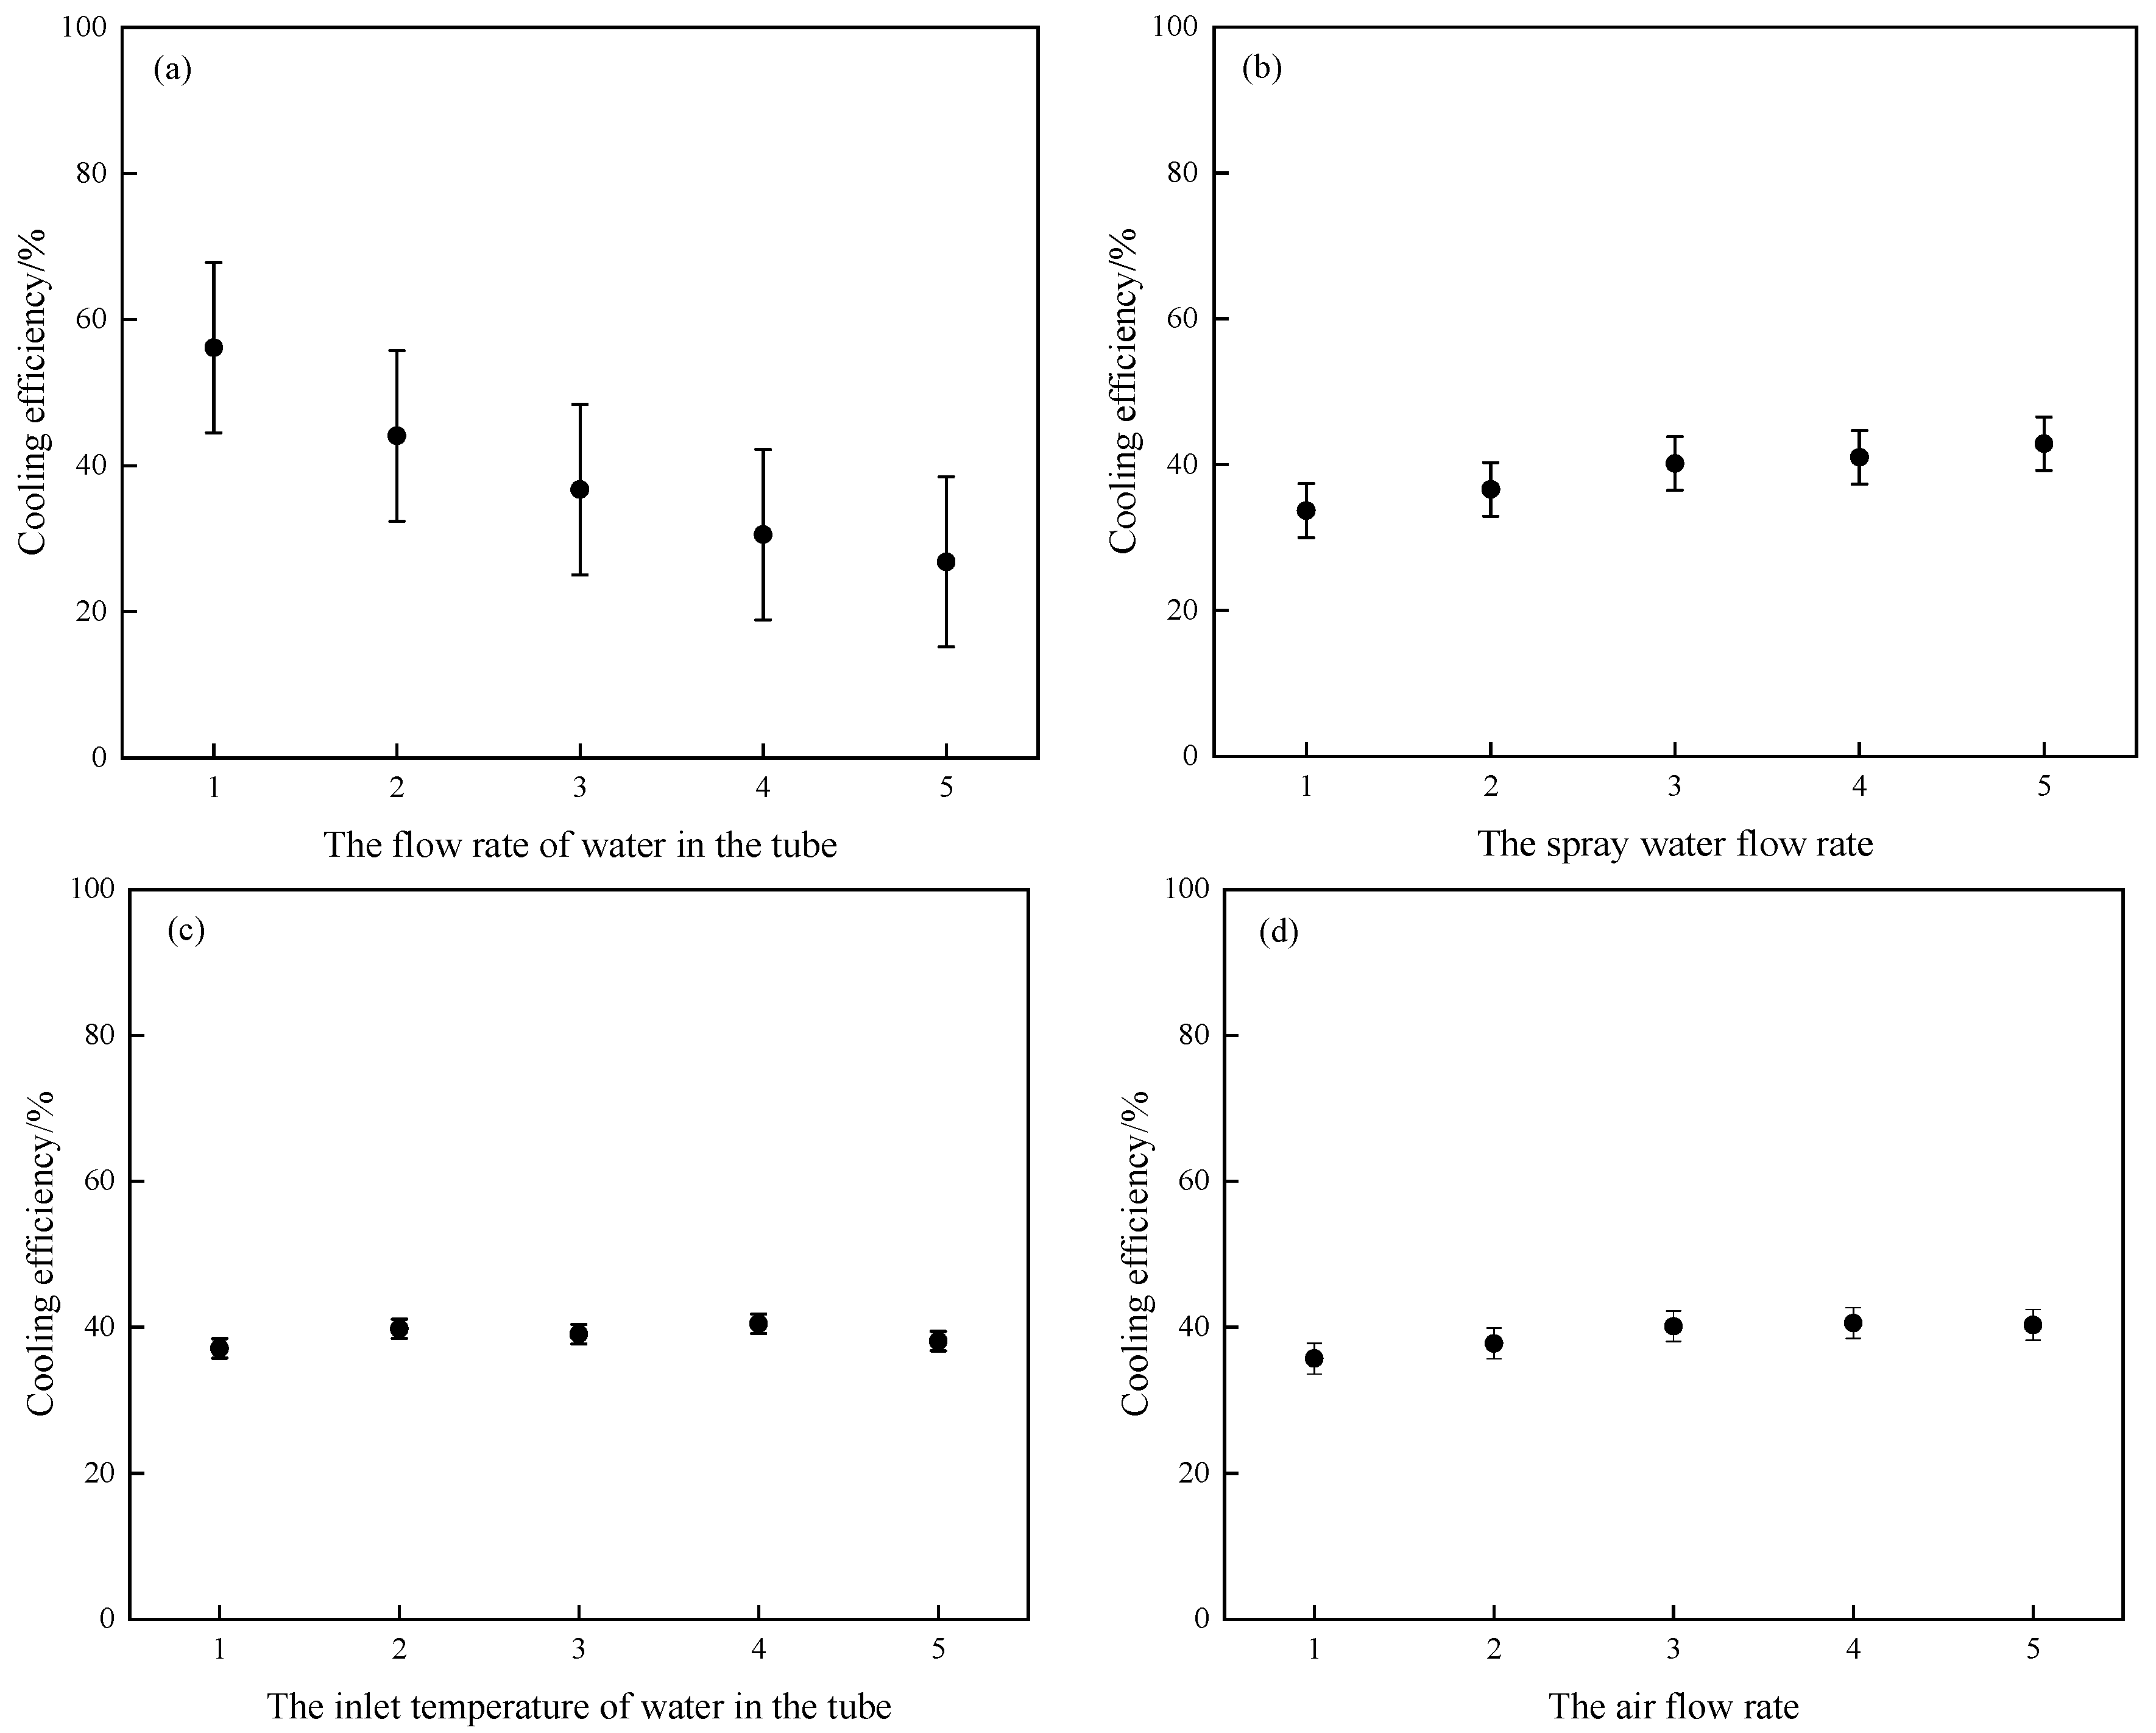
3.2. Effects of Various Influencing Factors on Cooling Efficiency

The limit of the outlet temperature of water in the tube is the ambient wet bulb temperature, and the cooling efficiency can be used to evaluate the difference between the outlet temperature of water in the tube and the ambient wet bulb temperature. The formula for calculating the cooling efficiency is:
ε = T ti T to T ti T a , wb × 100 %  
where ε is the cooling efficiency and T a , wb is the ambient wet bulb temperature (°C).
Figure 4 shows the influence of various influencing factors on the cooling efficiency. As shown in Figure 4a, the cooling efficiency decreases as the flow rate of water in the tube increases. Figure 4b shows that the cooling efficiency increases with an increase in the spray water flow rate. As shown in Figure 4c,d, there is no significant change in the cooling efficiency by changing the inlet temperature of water in the tube and the air flow rate. This is because, as the water flow rate in the tube increases, although it strengthens the cooling capacity, the temperature of the water outlet in the tube increases, leading to a reduction in cooling efficiency. When the spray water flow rate increases, the water film on the surface of the tube enhances the humidity and the heat transfer, the tube outlet temperature decreases, and the cooling efficiency increases. As the air flow increases, strengthening the ability of the air to take away heat, the tube outlet temperature decreases and the cooling efficiency increases, but the air flow can be too high for the wetting humidity of the membrane to have an impact, so there is an optimal air flow. The inlet temperature of the tube has little effect on the cooling efficiency because as the inlet temperature of the tube increases, the outlet temperature also increases, and the cooling efficiency is constant.
To quantitatively analyze the influence of various factors on the cooling efficiency, a variance analysis of the experimental data was conducted. The results of the variance analysis based on the F test are shown in Table 6. According to Table 6, the flow rate of water in the tube has the most significant influence on the cooling efficiency, followed by the spray water flow rate, while both the inlet temperature of water in the tube and the air flow rate have no obvious influence on the cooling efficiency.

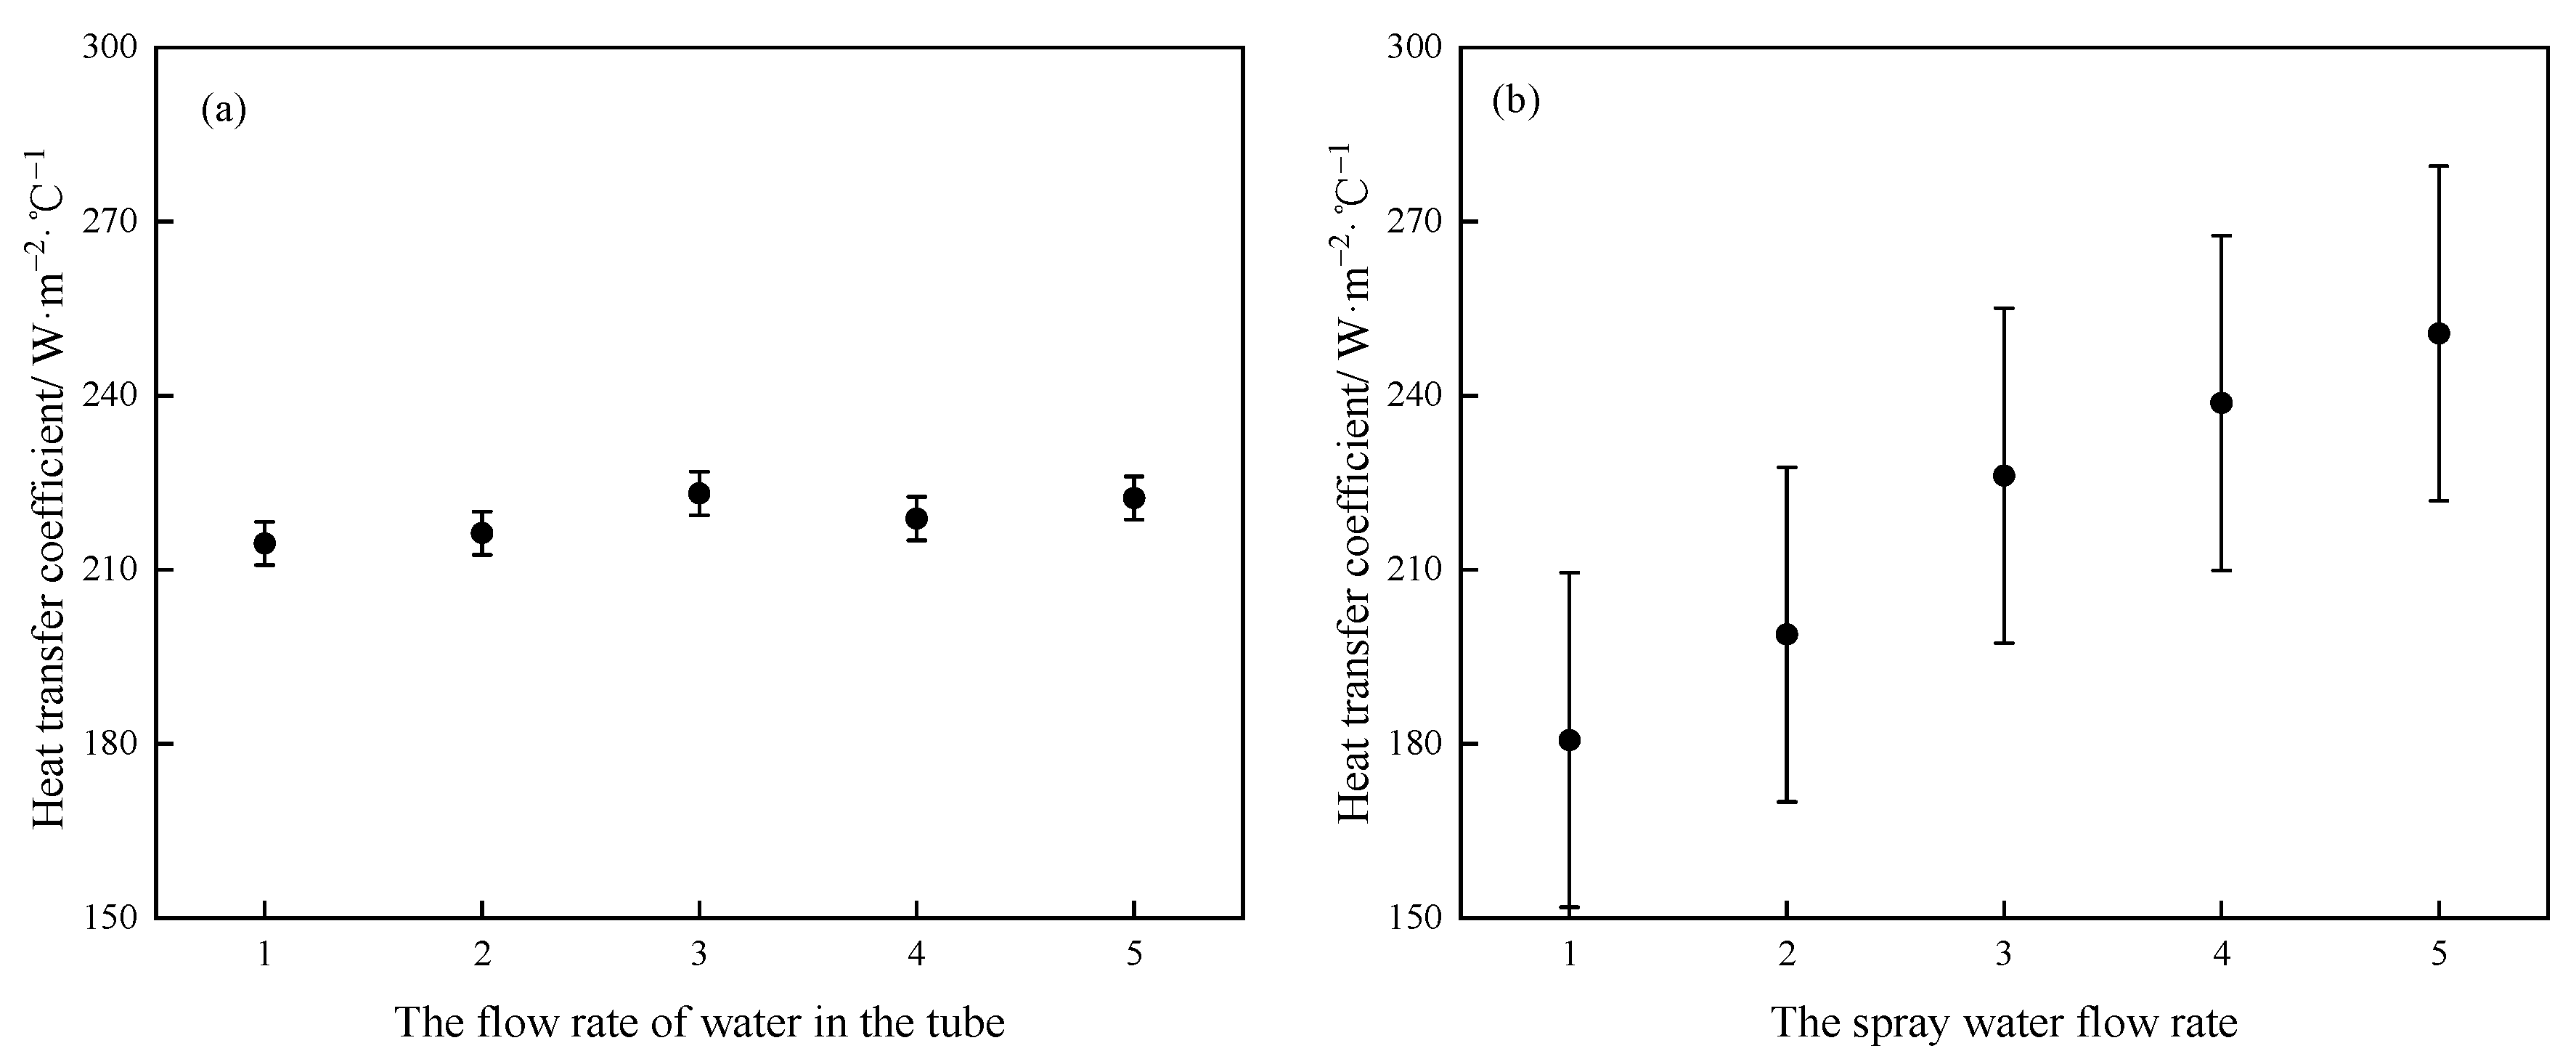
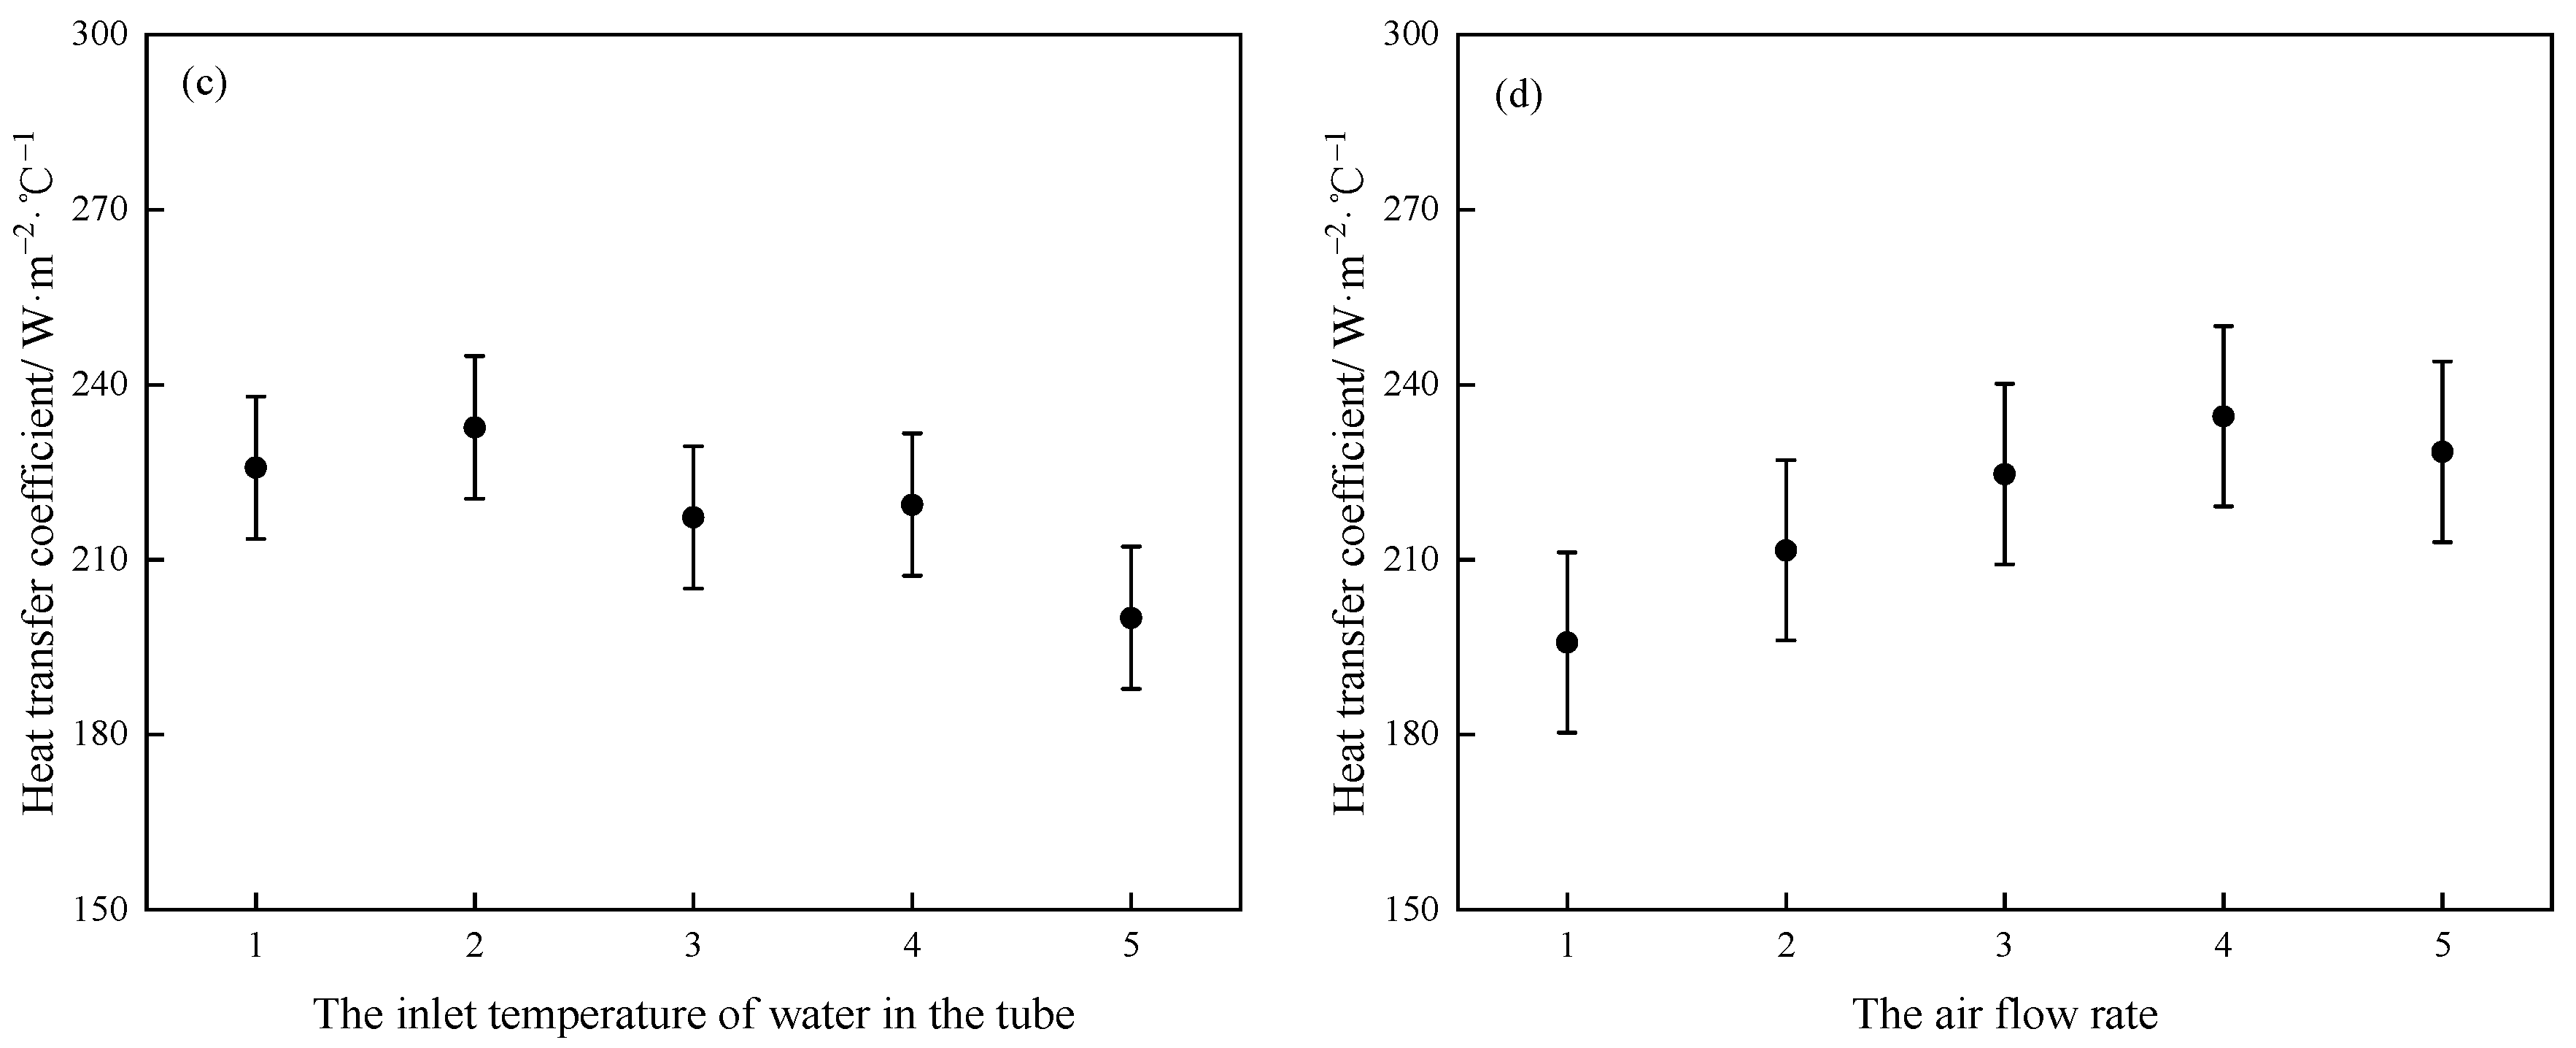
3.3. Effects of Various Influencing Factors on the Heat Transfer Coefficient

The heat transfer coefficient is calculated by:
K = c p m t ( T ti T to ) A o Δ T m
where K is the heat transfer coefficient (W·m−2·°C−1), A o is the external surface area of the tube (m2), and Δ T m is the logarithmic mean temperature difference (°C). Δ T m is calculated by:
Δ T m = ( T ti T w ) ( T to T w ) ln ( T ti T w T to T w )
where T w is the water film temperature outside the tube (°C), which is generally taken as the average value of the inlet and outlet temperatures of the spray water.
Figure 5 shows the relationship between the heat transfer coefficient of the evaporative cooler and various influencing factors. Figure 5a shows that changing the flow rate of water in the tube has no significant effect on the heat transfer coefficient. This description indicates that the main reason for limiting the heat dissipation of the cooler comes from convective heat transfer between the spray water film and the tube wall. As shown in Figure 5b,d, the heat transfer coefficient increases with an increase in the spray water flow rate and the air flow rate, indicating that the heat transfer outside the tube is the dominant factor in the heat transfer of the evaporative cooler. This is because when the flow rate of the spray water increases, the humidity of the evaporative cooler is increased, and the heat transfer area is expanded to a certain extent. Moreover, an increase in the flow rate of the spray water will strengthen the heat convection between the spray water and the pipe wall and take away more heat. When the air flow increases, it allows the spray water to overcome the pipe row resistance, which is favorable to achieve better wetting; if the air flow rate is too high, it will lead to the liquid film shear force becoming higher than the surface tension, so that the wettability is reduced. There is an optimum air flow rate for a given spray water flow rate. As shown in Figure 5c, as the inlet temperature of water in the tube increases, the heat transfer coefficient decreases. This is because although an increase in the inlet temperature of the water in the tube strengthens the cooling and heat dissipation capacity, it is achieved by increasing the heat transfer temperature difference, which is detrimental to the heat transfer coefficient. To quantitatively analyze the influence of various influencing factors on cooling efficiency, a variance analysis of the experimental data was conducted. The results of the variance analysis based on the F test are shown in Table 7. It can be seen from Table 7 that the spray water flow rate has the most significant effect on the heat transfer coefficient, followed by the inlet temperature of water in the tube and the air flow rate, and the flow rate of water in the tube has no obvious effect on the heat transfer coefficient.

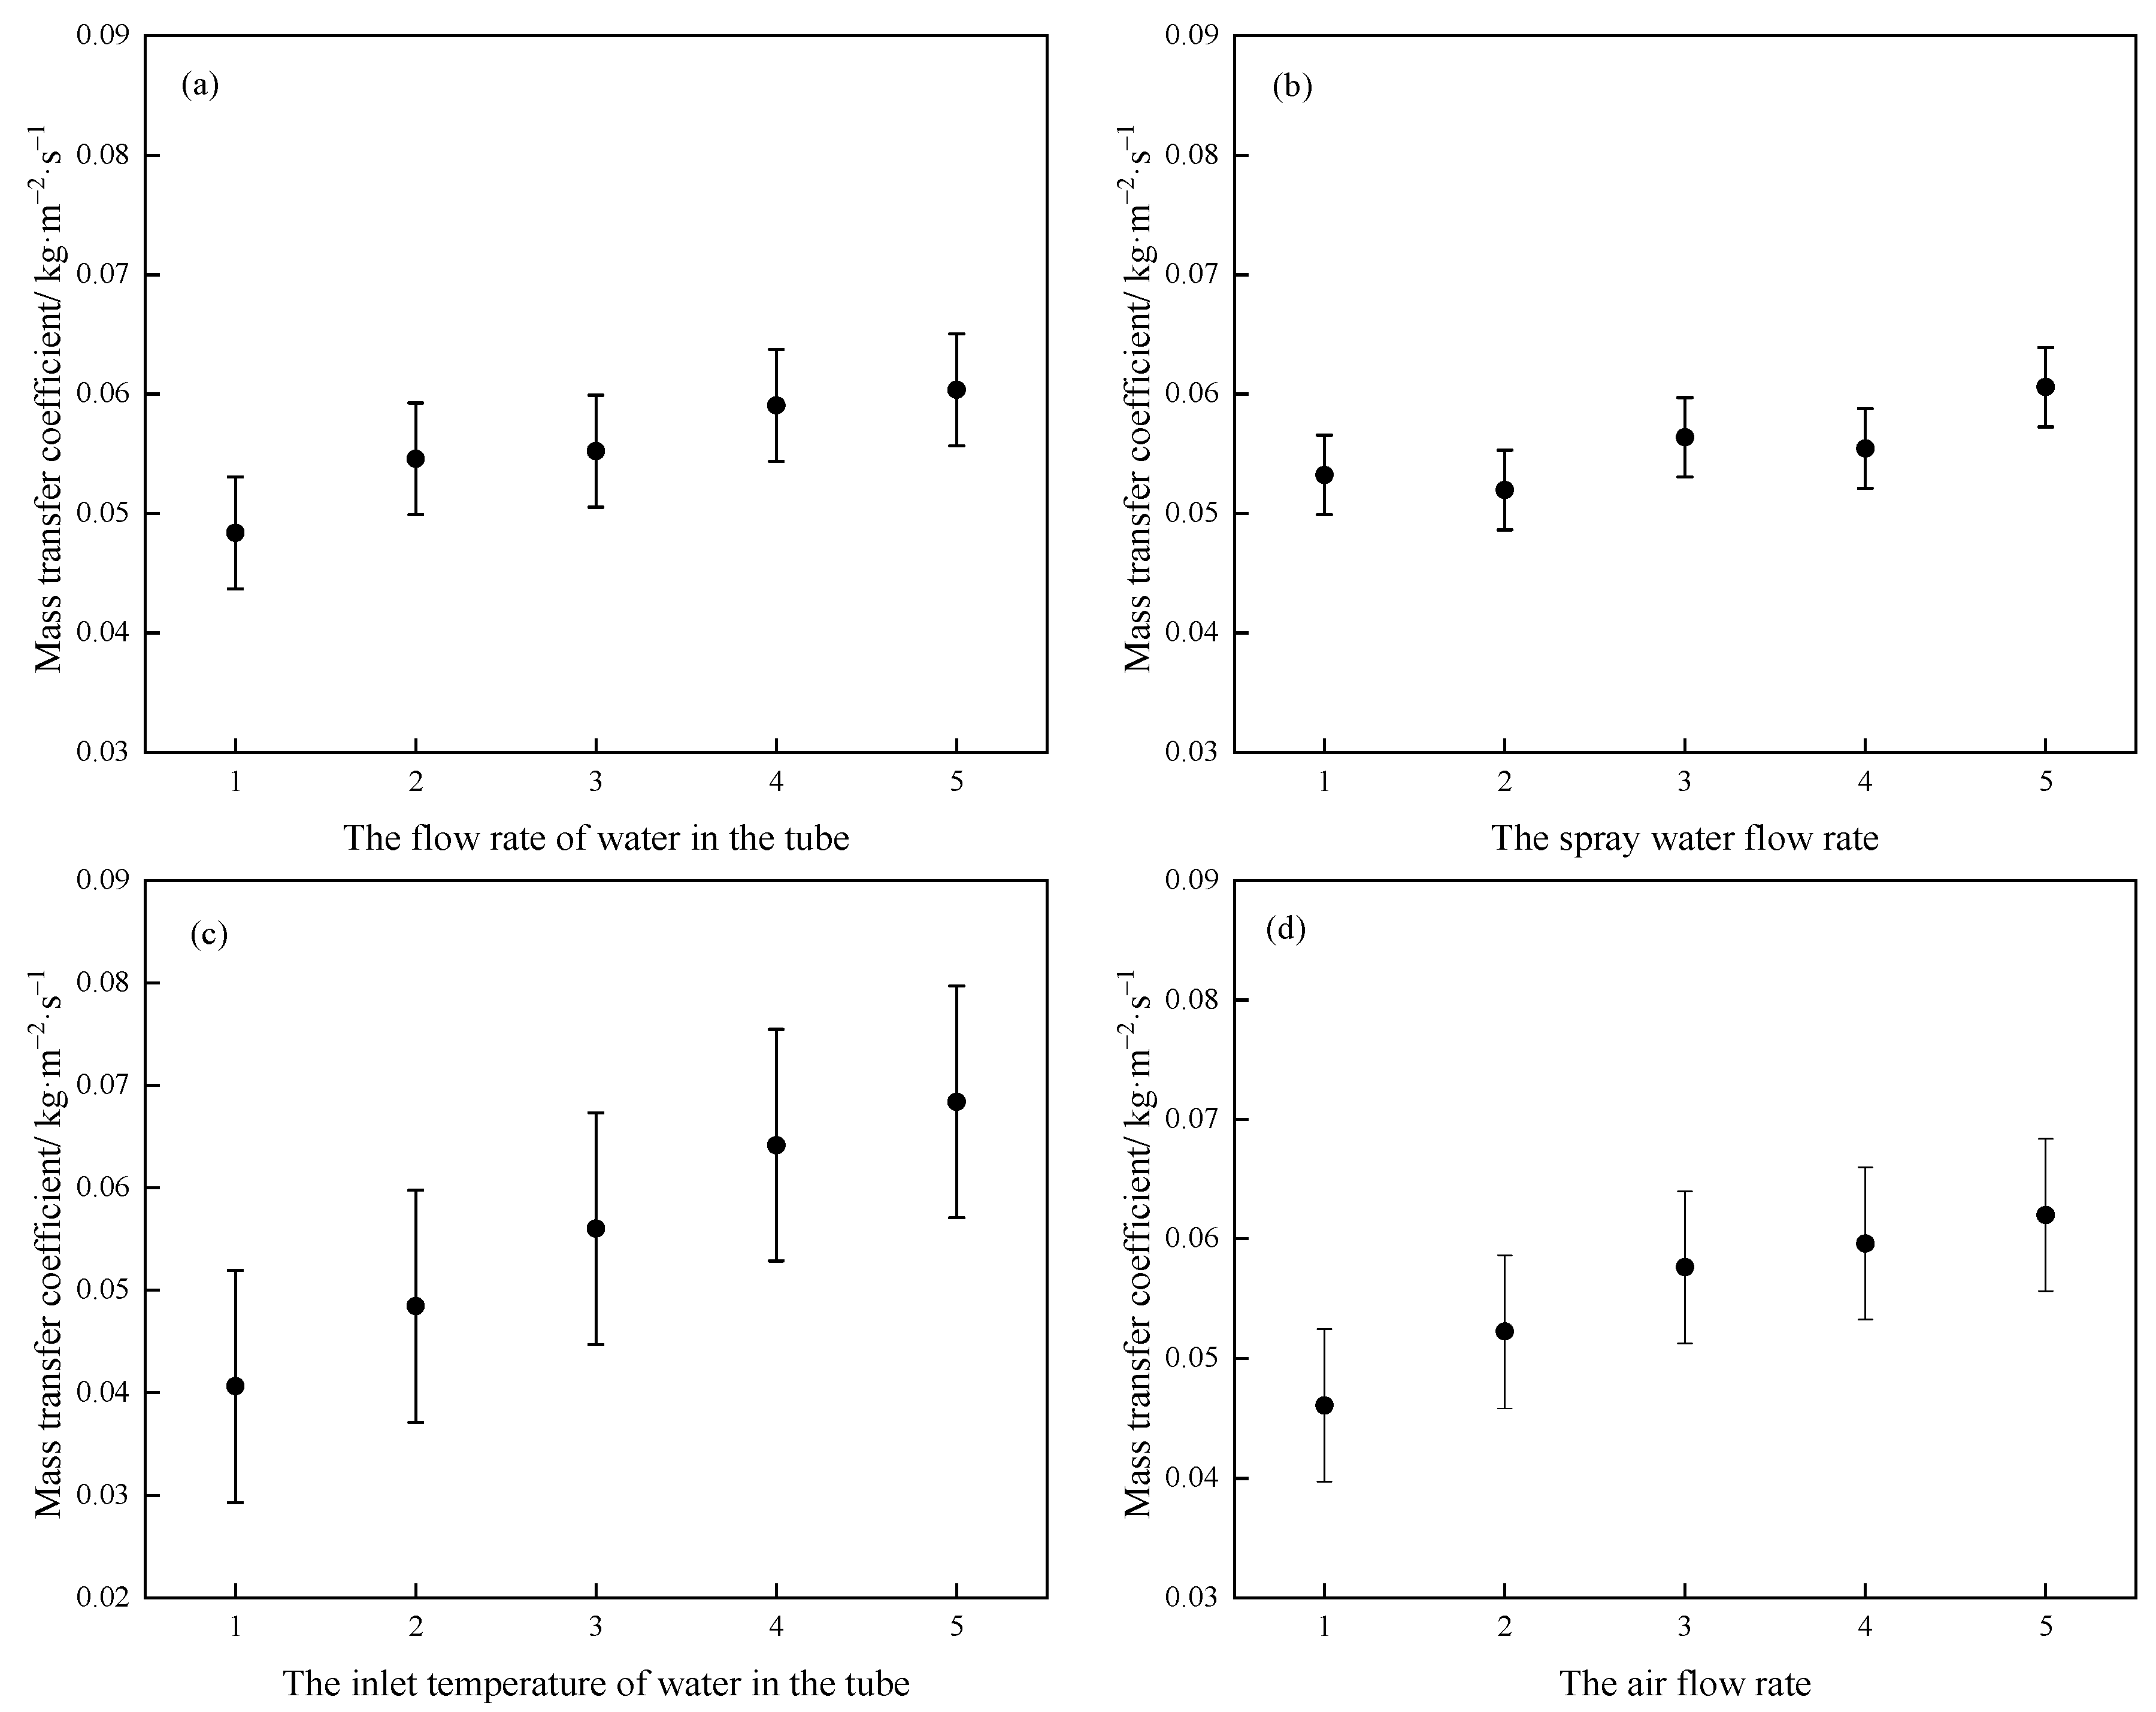
3.4. Effects of Various Influencing Factors on the Mass Transfer Coefficient

The mass transfer coefficient is used to evaluate the mass transfer effect between the air and the liquid film outside the tube. Based on Merkel’s theory [15,39], the mass transfer coefficient is calculated by:
h d = m a A o l n ( i wm i ao i wm i ai )
where h d is the mass transfer coefficient (kg·m−2·s−1), m a is the air flow rate (kg·s−1), i mw is the enthalpy of saturated humid air at the spray water temperature (kJ·kg−1), and i ai and i ao are the enthalpy of the air inlet and outlet (kJ·kg−1), respectively.
Figure 6 shows the relationship between the mass transfer coefficient and various influencing factors. As shown in Figure 6a,b, the mass transfer coefficient does not change significantly with the change of the flow rate of water in the tube and the spray water flow rate. As shown in Figure 6c,d, the greater the inlet temperature of water in the tube and the air flow rate, the greater the mass transfer coefficient. This is because evaporation is more intense in the high-temperature conditions of this study but is limited by the saturation of the air outside the tube. The ability of air to carry water vapor is mainly related to its flow rate, and the mass transfer capacity is mainly affected by the temperature when the air flow rate is determined, so increasing the air flow rate and the temperature of the water in the tube will cause the mass transfer coefficient to have a significant tendency to increase. To quantitatively analyze the influence of various influencing factors on cooling efficiency, a variance analysis of the experimental data was conducted. The results of the variance analysis based on the F test are shown in Table 8. It can be seen from Table 8 that the inlet temperature of water in the tube has the most significant effect on the mass transfer coefficient, followed by the flow rate of water in the tube and the air flow rate, and the spray water flow rate has no obvious effect on the mass transfer coefficient.

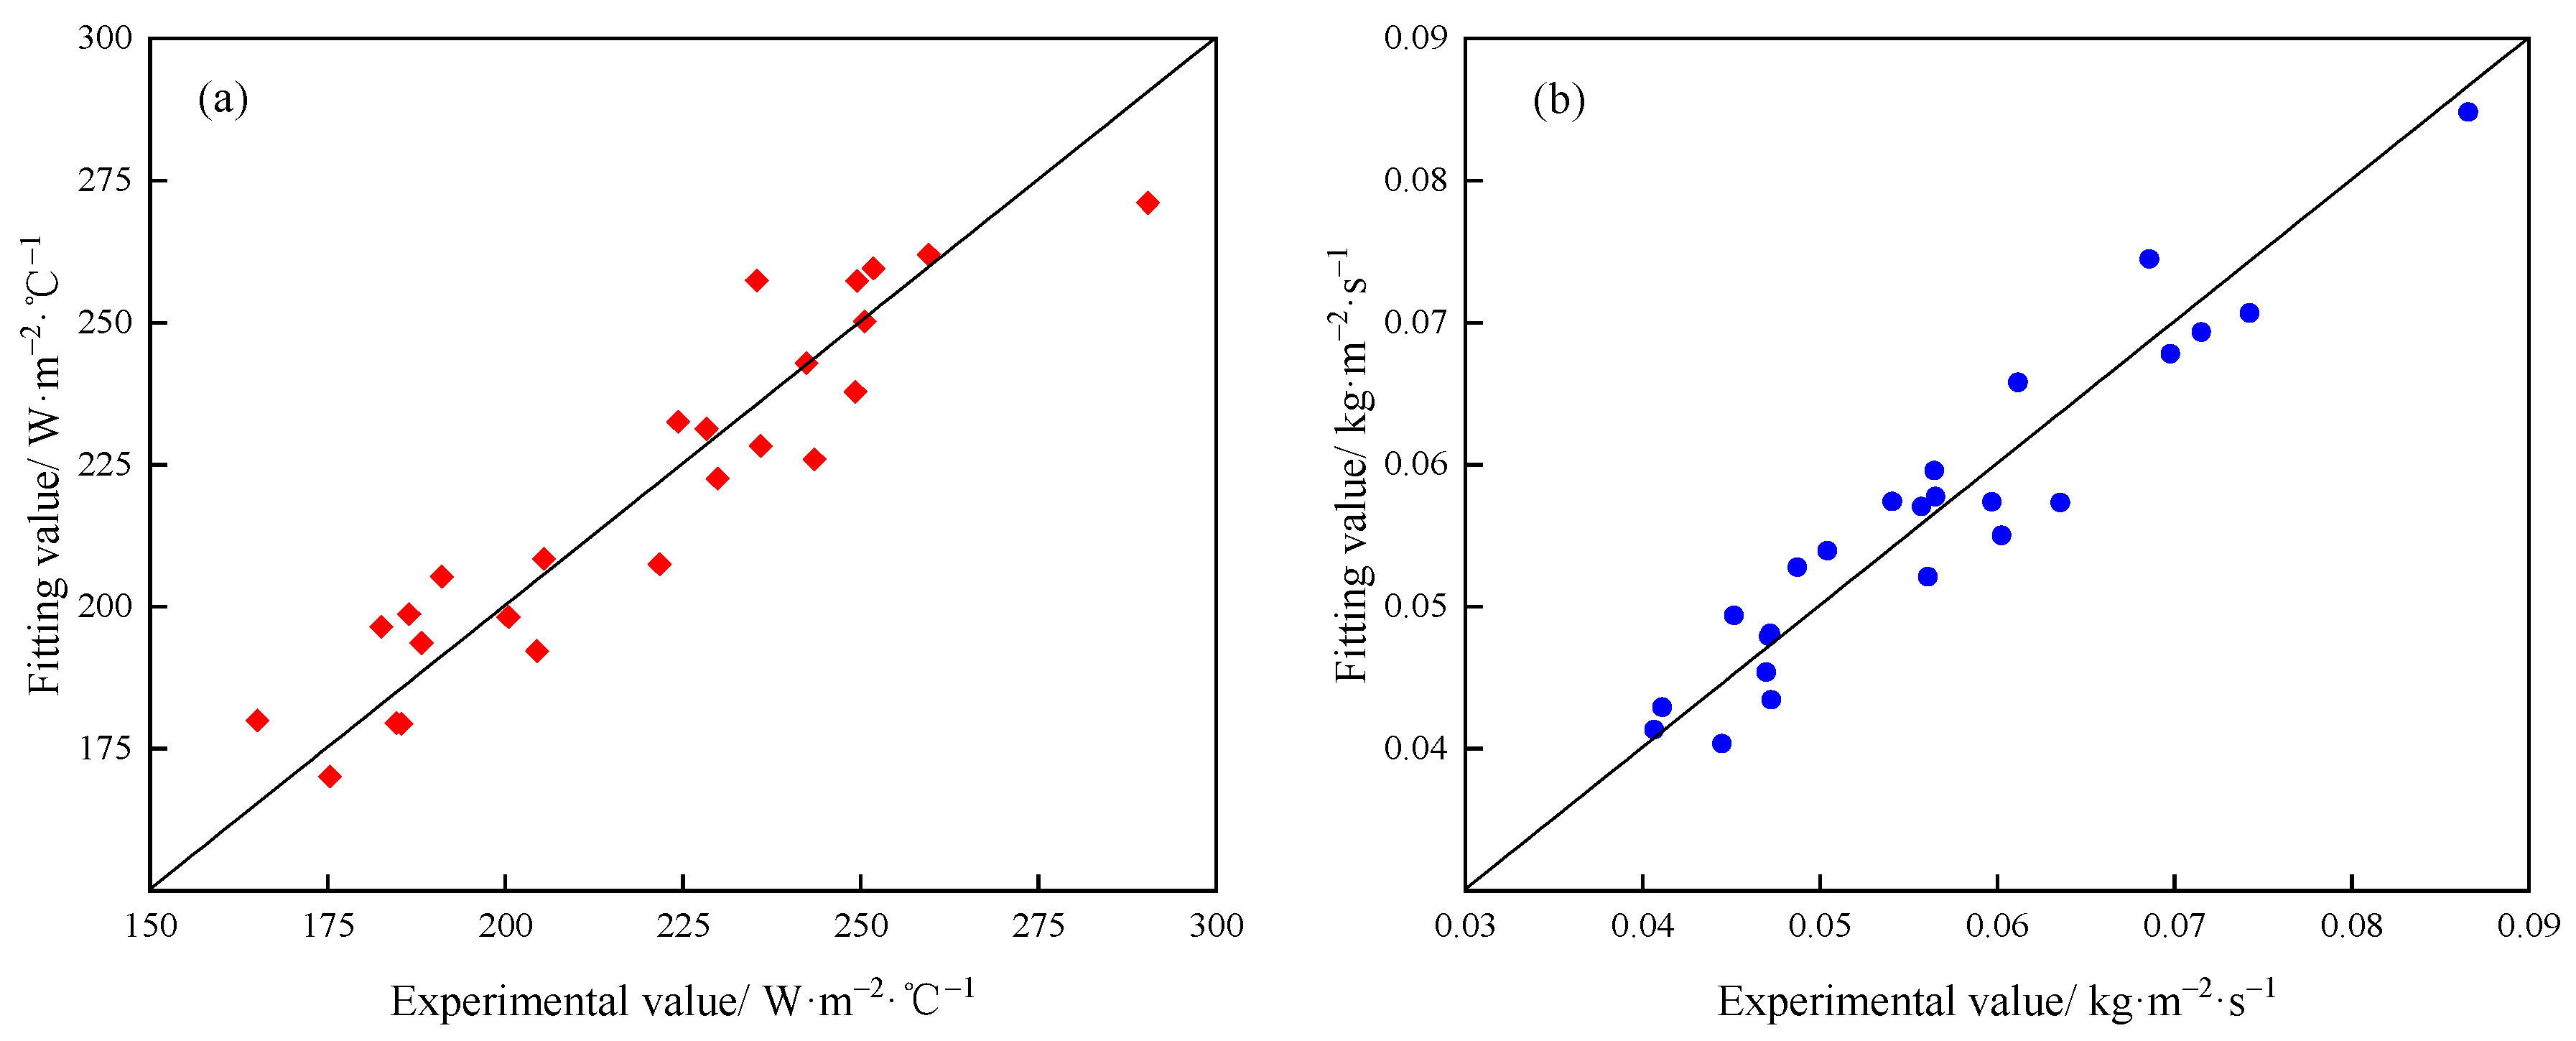
3.5. Correlation Equations of the Heat and Mass Coefficients

From the analysis of the above experimental results, the significant influencing factors of the heat transfer coefficient are the spray water flow rate, the air flow rate, and the inlet temperature of water in the tube, and the influence of the flow rate of water in the tube is not significant. The significant influencing factors of the mass transfer coefficient are the inlet temperature of water in the tube, the air flow rate, and the flow rate of water in the tube, but the influence of the spray water flow rate is not significant. Correlation analysis can be carried out on the heat and mass transfer coefficients based on significant factors.
To facilitate the correlation analysis, the three influencing factors of the spray water flow rate, the air flow rate, and the flow rate of water in the tube need to be fluxed, and the spray water flux, the air flux, and the flux of water in the tube are obtained, respectively.
The spray water flux is calculated by:
G w = m w 2 N 2 L t d o
where Gw is the spray water flux (kg·s−1·m−2), N is the number of tubes in each row, d o is the outer diameter of the tube (m), and L t is the single tube length (m).
The flux of water in the tube is calculated by:
G t = m t 2 N 2 L t d i
where Gt is the flux of water in the tube (kg·s−1 m−2) and d i is the inner diameter of the tube (m).
The air flux is calculated by:
G a = m a [ ( N + 1 / 2 ) S T ( N + 1 ) d o ] L t
where Ga is the air flux (kg·s−1 m−2) and ST is the tube spacing (m).
Referring to the suggestions of Heyns and Kröger [11] and Jiang et al. [15] on the correlation equations of the heat and mass transfer coefficients, the correlation equations in this paper are in the form of power functions. Thus, the correlation Equation (9) of the heat transfer coefficient and the correlation Equation (10) of the mass transfer coefficient were obtained based on the above-mentioned orthogonal experimental data fitting, and the fits of the correlation equations to the orthogonal experimental data are shown in Figure 7.
K = 1799.577 G a 0.283 G w 0.803 T ti 0.272
h d = 0.000332 G a 0.509 G t 0.173 T ti 1.116
To verify the validity of the orthogonal experiment and the correlation equations obtained, 100 sets of verification experiments were further carried out, and the relative errors between the experimental data and the predicted values of the correlation equations were calculated using Equation (11).
δ = | x exp x pre | x exp
where δ is a relative error, x exp is an experimental value, and x pre is the predicted value of the correlation equation.
Figure 8 shows the comparisons between the verification experimental values and the predicted values of the correlation equations, and the relative errors of all data are less than 10%. Among them, the average relative error of the heat transfer coefficient is 4.25%, and the average relative error of the mass transfer coefficient is 5.42%. The above verification experiment results show that the correlation equations can effectively predict the heat and mass transfer coefficients and verify the validity of the orthogonal experiment.
Figure 9 shows the difference between Equations (9) and (10) and the correlation equations given by Heyns and Kröger [11] and Zheng et al. [12,13]. The results show that compared with the evaporative coolers in the literature, the parallel-flow/counter-flow evaporative cooler of the light tube structure studied in this work has a larger mass transfer coefficient. This is because the temperature difference is the driving force for the cooling and heat dissipation of the heat exchanger, and the high temperature difference between the inside and outside of the tube greatly enhances heat and mass transfer. Moreover, a higher temperature difference cyclically enhances cooling and heat dissipation and reduces the heat transfer coefficient. This means that when the water temperature in the tube is lower, the heat transfer coefficient is higher, but when the water temperature in the tube is high, the heat transfer coefficient is not larger than in the other literature.

4. Conclusions

To study the heat and mass transfer characteristics of an evaporative cooler in the cooling process of high-temperature water, an experimental device for evaporative cooling and a test system were constructed, and the experimental research was carried out based on an orthogonal experimental design. The main conclusions are as follows:
(1)
The flow rate and the inlet temperature of water in the tube have the most significant influence on the heat dissipation of the evaporative cooler, followed by the spray water flow rate, and the air flow rate has a weaker effect. If it is necessary to increase the heat dissipation of the evaporative cooler, the flow rate, the inlet temperature of water in the tube, and the spray water flow rate can be increased.
(2)
The spray water flow rate has the most significant effect on the heat transfer coefficient of the evaporative cooler, followed by the inlet temperature of water in the tube and the air flow rate, and the flow rate of water in the tube has no obvious effect on the heat transfer coefficient.
(3)
The inlet temperature of water in the tube has the most significant effect on the mass transfer coefficient of the evaporative cooler, followed by the flow rate of water in the tube and the air flow rate, and the spray water flow rate has no obvious effect on the mass transfer coefficient.
(4)
Under the working conditions of this study, the correlation equations of the heat and mass transfer coefficients for the evaporative cooler are K = 1799.577 G a 0.283 G w 0.803 T ti 0.272 and h d = 0.000332 G a 0.509 G t 0.173 T ti 1.116 , respectively.

Author Contributions

Conceptualization, P.Z. and L.W.; methodology, P.Z.; software, P.Z.; validation, P.Z., B.G. and L.W.; formal analysis, B.G.; investigation, B.G.; resources, L.W.; data curation, B.G.; writing—original draft preparation, P.Z. and B.G.; writing—review and editing, P.Z.; visualization, B.G.; supervision, P.Z.; project administration, P.Z.; funding acquisition, L.W. All authors have read and agreed to the published version of the manuscript.

Funding

This research was funded by National Key R&D Program of China grant number 2022YFE0120900.

Data Availability Statement

Data available on request due to restrictions privacy.

Acknowledgments

Support from the National Key R&D Program of China (Grant No. 2022YFE0120900) is gratefully acknowledged.

Conflicts of Interest

The authors declare no conflict of interest.

References

  1. Zhou, Y.; Zhang, P.; Zhao, J.; Yang, H.; Bai, Y. Experimental study on performance of a closed wet cooling tower for air wet-bulb temperature near 0 °C. J. Therm. Sci. 2019, 28, 1015–1023. [Google Scholar] [CrossRef]
  2. Alhamid, M.I.; Bismo, S.; Nainggolan, F.; Yatim, A. Analysis of the effectiveness of ozonation on corrosion and bacteria on closed system cooling towers. AIP Conf. Proc. 2019, 2062, 020046. [Google Scholar]
  3. Liu, J.; Zhang, L.; Lin, Z.; Gao, M.; Chen, H. Research of technical and economic performance of plastic capillary mats used as the heat exchanger of a closed-circuit cooling tower. Appl. Therm. Eng. 2019, 153, 800–807. [Google Scholar] [CrossRef]
  4. Wagner, T.V.; Parsons, J.R.; Rijnaarts, H.H.M.; de Voogt, P.; Langenhoff, A.A.M. A review on the removal of conditioning chemicals from cooling tower water in constructed wetlands. Crit. Rev. Environ. Sci. Technol. 2018, 48, 1094–1125. [Google Scholar] [CrossRef]
  5. Zhou, Y.; Zhu, X.; Ding, X. Theoretical investigation on thermal performance of new structure closed wet cooling tower. Heat Transf. Eng. 2018, 39, 460–472. [Google Scholar] [CrossRef]
  6. Bhuva, J.H. Improvement in the performance of cooling tower of thermal power plant: A review. Int. J. Res. Appl. Sci. Eng. Technol. 2018, 6, 3043–3046. [Google Scholar] [CrossRef]
  7. Nadjahi, C.; Louahlia, H.; Lemasson, S. A review of thermal management and innovative cooling strategies for data center. Sustain. Comput. Inform. Syst. 2018, 19, 14–28. [Google Scholar] [CrossRef]
  8. Facão, J.; Oliveira, A.C. Thermal behaviour of closed wet cooling towers for use with chilled ceilings. Appl. Therm. Eng. 2000, 20, 1225–1236. [Google Scholar] [CrossRef]
  9. Hasan, A.; Sirén, K. Performance investigation of plain and finned tube evaporatively cooled heat exchangers. Appl. Therm. Eng. 2003, 23, 325–340. [Google Scholar] [CrossRef]
  10. Yoo, S.; Kim, J.; Han, K. Thermal performance analysis of heat exchanger for closed wet cooling tower using heat and mass transfer analogy. J. Mech. Sci. Technol. 2010, 24, 893–898. [Google Scholar] [CrossRef]
  11. Heyns, J.A.; Kröger, D.G. Experimental investigation into the thermal-flow performance characteristics of an evaporative cooler. Appl. Therm. Eng. 2010, 30, 492–498. [Google Scholar] [CrossRef]
  12. Zheng, W.Y.; Zhu, D.S.; Song, J.; Zeng, L. Experimental investigation of heat and mass transfer of novel closed circuit cooling tower. Chem. Eng. 2011, 39, 34–37. [Google Scholar]
  13. Zheng, W.Y.; Zhu, D.S.; Song, J.; Zeng, L.-D.; Zhou, H.-J. Experimental and computational analysis of thermal performance of the oval tube closed wet cooling tower. Appl. Therm. Eng. 2012, 35, 233–239. [Google Scholar] [CrossRef]
  14. Zheng, W.Y. Experimental Investigation and Numerical Simulation of the Heat and Mass Transfer in Evaporative Cooler; East China University of Science and Technology: Shanghai, China, 2013. [Google Scholar]
  15. Jiang, J.; Liu, X.; Jiang, Y. Experimental and numerical analysis of a cross-flow closed wet cooling tower. Appl. Therm. Eng. 2013, 61, 678–689. [Google Scholar] [CrossRef]
  16. Tu, A.; Liu, S.; Mo, X.; Chen, E.; Zhan, X.; Zhu, D. Experimental Study of a Novel Non-Packing Closed Evaporative Cooling Tower with Vertical 3D Deformation Tubes. Energies 2022, 15, 9336. [Google Scholar] [CrossRef]
  17. Yu, Y.; Qi, X.; Hou, X.; Qu, X.; Guo, Q.; Zhu, H. Heat and mass transfer performance and exergy performance evaluation of seawater cooling tower considering different inlet parameters. Thermal Sci. 2022, 26 Pt A, 3715–3728. [Google Scholar] [CrossRef]
  18. Ruiz, J.; Navarro, P.; Hernández, M.; Lucas, M.; Kaiser, A. Thermal performance and emissions analysis of a new cooling tower prototype. Appl. Therm. Eng. 2022, 206, 118065. [Google Scholar] [CrossRef]
  19. Stabat, P.; Marchio, D. Simplified model for indirect-contact evaporative cooling-tower behaviour. Appl. Energy 2004, 78, 433–451. [Google Scholar] [CrossRef]
  20. Papaefthimiou, V.D.; Rogdakis, E.D.; Koronaki, I.P.; Zannis, T. Thermodynamic study of the effects of ambient air conditions on the thermal performance characteristics of a closed wet cooling tower. Appl. Therm. Eng. 2012, 33, 199–207. [Google Scholar] [CrossRef]
  21. Zheng, W.Y.; Zhu, D.S.; Song, J.; Zeng, L.; Zhou, H. Simulation of closed wet cooling towers. J. Chem. Eng. Chin. Univ. 2012, 26, 216–221. [Google Scholar]
  22. Nasr, M.R.J.; Behfar, R. A novel design for evaporative fluid coolers. Appl. Therm. Eng. 2010, 30, 2746–2752. [Google Scholar] [CrossRef]
  23. Nasr, M.R.J.; Jafarifar, S. Extension of the rapid design algorithm for twisted-tube evaporative fluid coolers. Chem. Eng. Technol. 2015, 38, 787–796. [Google Scholar] [CrossRef]
  24. Qasim, S.M.; Hayder, M.J. Investigation of the effect of packing location on performance of closed wet cooling tower based on exergy analysis. IOP Conf. Ser. Mater. Sci. Eng. 2016, 145, 32009–32014. [Google Scholar] [CrossRef]
  25. Mahdi, Q.S.; Jaffal, H.M. Energy and exergy analysis on modified closed wet cooling tower in Iraq. Ai-Khawarizmi Eng. J. 2016, 12, 45–49. [Google Scholar]
  26. Wei, X.; Li, N.; Peng, J.; Cheng, J.; Hu, J.; Wang, M. Performance analyses of counter-flow closed wet cooling towers based on a simplified calculation method. Energies 2017, 10, 282. [Google Scholar] [CrossRef]
  27. Xie, X.; He, C.; Xu, T.; Zhang, B.; Pan, M.; Chen, Q. Deciphering the thermal and hydraulic performances of closed wet cooling towers with plain, oval, and longitudinal fin tubes. Appl. Therm. Eng. 2017, 120, 203–218. [Google Scholar] [CrossRef]
  28. Xie, X.; Zhang, Y.; He, C.; Xu, T.; Zhang, B.; Chen, Q. Bench-scale experimental study on the heat transfer intensification of a closed wet cooling tower using aluminum oxide nanofluids. Ind. Eng. Chem. Res. 2017, 56, 6022–6034. [Google Scholar] [CrossRef]
  29. Xie, X.; Liu, H.; He, C.; Zhang, B.; Chen, Q.; Pan, M. Deciphering the heat and mass transfer behaviors of staggered tube bundles in a closed wet cooling tower using a 3-d vof model. Appl. Therm. Eng. 2019, 161, 114202. [Google Scholar] [CrossRef]
  30. Lee, Y.; Hong, S.; Dang, C.; Chien, L.-H.; Yang, A.-S. Effect of counter current airflow on film dispersion and heat transfer of evaporative falling film over a horizontal elliptical tube. Int. J. Heat Mass Transf. 2019, 141, 964–973. [Google Scholar] [CrossRef]
  31. Zhu, Q.; Zhang, B.; Chen, Q.; He, C.; Foo, D.C.; Ren, J.; Yu, H. Model reductions for multiscale stochastic optimization of cooling water system equipped with closed wet cooling towers. Chem. Eng. Sci. 2020, 224, 115773. [Google Scholar] [CrossRef]
  32. Zhao, R.; Bu, S.; Zhao, X.; Zhang, L.; Xu, W.; Yu, Z.; Fang, J.; Ji, Y.; Hu, Y.; Bao, B. Study on thermal performance of new finned heat exchange tube bundles in cooling tower. Int. J. Therm. Sci. 2021, 168, 107064. [Google Scholar] [CrossRef]
  33. Fang, J.; Zhao, X.; Zhang, L.; Bu, S.; Yu, Z.; Xu, W.; Hu, Y.; Shan, Y.; Li, Y. Thermodynamic Investigation on the Performance of Closed Wet Cooling Tower. J. Therm. Sci. Eng. Appl. 2022, 14, 031010. [Google Scholar] [CrossRef]
  34. Deng, W.; Sun, F.; Chen, K.; Zhang, X. Numerical study on performance of hybrid mechanical draft wet cooling tower. Int. J. Heat Mass Transf. 2023, 201, 123574. [Google Scholar] [CrossRef]
  35. Xi, Y.; Yu, Z.; Zhang, L.; Yu, A.; Liu, L.; Bao, B.; Zhao, Y.; Zhou, C.; Wu, B.; Dong, K. Research on heat and mass transfer characteristics of a counterflow wet cooling tower using a new type of straight wave packing. Int. J. Therm. Sci. 2023, 193, 108540. [Google Scholar] [CrossRef]
  36. Deng, W.; Sun, F. Performance analysis and multi-objective optimization of mechanical draft wet cooling towers based on water saving, plume and cooling characteristics. Int. J. Therm. Sci. 2024, 196, 108656. [Google Scholar] [CrossRef]
  37. Fang, J.; Yin, X.; Wang, A.; Sun, X.; Liu, Y.; Cao, F. Cooling performance enhancement for the automobile transcritical CO2 air conditioning system with various internal heat exchanger effectiveness. Appl. Therm. Eng. 2021, 196, 117274. [Google Scholar] [CrossRef]
  38. Abud-Archila, M.; Vázquez-Mandujano, D.G.; Ruiz-Cabrera, M.A.; Grajales-Lagunes, A.; Moscosa-Santillán, M.; Ventura-Canseco, L.; Gutiérrez-Miceli, F.; Dendooven, L. Optimization of osmotic dehydration of yam bean (Pachyrhizus erosus) using an orthogonal experimental design. J. Food Eng. 2008, 84, 413–419. [Google Scholar] [CrossRef]
  39. Zhu, X.; Chen, S.; Shen, S.; Ni, S.; Shi, X.; Qiu, Q. Experimental study on the heat and mass transfer characteristics of air-water two-phase flow in an evaporative condenser with a horizontal elliptical tube bundle. Appl. Therm. Eng. 2020, 168, 114825. [Google Scholar] [CrossRef]
Figure 1. Evaporative cooler experimental device: (a) the schematic diagram, and (b) the device diagram.
Energies 16 07330 g001
Figure 2. The schematic diagram of the test system.
Energies 16 07330 g002
Figure 3. Influence of various factors on the heat dissipation: (a) the flow rate of water in the tube; (b) the spray water flow rate; (c) the inlet temperature of water in the tube; and (d) the air flow rate.
Energies 16 07330 g003
Figure 4. Influence of various factors on the cooling efficiency: (a) the flow rate of water in the tube; (b) the spray water flow rate; (c) the inlet temperature of water in the tube; and (d) the air flow rate.
Energies 16 07330 g004
Figure 5. Influence of various factors on the heat transfer coefficient: (a) the flow rate of water in the tube; (b) the spray water flow rate; (c) the inlet temperature of water in the tube; and (d) the air flow rate.
Energies 16 07330 g005aEnergies 16 07330 g005b
Figure 6. Influence of various factors on the mass transfer coefficient: (a) the flow rate of water in the tube; (b) the spray water flow rate; (c) the inlet temperature of water in the tube; and (d) the air flow rate.
Energies 16 07330 g006
Figure 7. Comparisons between the orthogonal experimental data and the fitting values of the correlation equation: (a) heat transfer coefficient and (b) mass transfer coefficient.
Energies 16 07330 g007
Figure 8. Comparisons between the verification experimental data and the predicted values of the correlation equation: (a) heat transfer coefficient and (b) mass transfer coefficient.
Energies 16 07330 g008
Figure 9. Comparison of coefficients with the literature [11,12,13]: (a) heat transfer coefficient; (b) mass transfer coefficient.
Energies 16 07330 g009
Table 1. Summary of the temperature conditions in the literature.
AuthorsYearMediumWater Temperature
in the Tube/°C
Spray Water
Temperature/°C
Dry Bulb
Air Temperature/°C
Wet Bulb
Air Temperature/°C
Facão and Oliveira [8]2000Water15–28--10–20
Hasan and Sirén [9]2002Water2117–1819–2016
Stabat and Marchio [19]2004Water23–42--16–24
Nasr and Behfar [22]2010Water15.6-108.5
Yoo et al. [10]2010Water32–42--27
Heyns and Kröger [11]2010Water-35–5316–2214–18
Zheng et al. [12]2011Water13.7–3611–284–152.1–9.6
Zheng et al. [13]2012Water13.7–3611–284–152.1–9.6
Zheng et al. [21]2012Water15–2415.1–25.413.1–32.510.5–19.8
Papaefthimiou et al. [20]2012Water352010–458.1–30.3
Jiang et al. [15]2013Water30.1–36.625–2627.220–25
Zheng et al. [14]2013Water13.7–5511–28-18–28
Nasr and Jafarifar [23]2015Water4513--
Mahdi and Jaffal [24]2016Water35–55--7–24
Wei et al. [26]2017Water16–3713.6–18.1-10–23
Xie et al. [27]2017Water3710–3510–34-
Lee et al. [30]2019Water-252519.5
Zhu et al. [31]2020Water40–57---
Zhao et al. [32]2021Water-35–4125–3728
Tu et al. [16]2022Water32–44-26–3423–28
Yu et al. [17]2022Water-38–5626–3021–25
Ruiz et al. [18]2022Water-28–3323–2819.2–23.2
Fang et al. [33]2022Water35–4232–3732–36-
Deng et al. [34]2023Water27–39-2–281.5–27.0
Xi et al. [35]2023Water-4116-
Deng and Sun [36]2024Water-33–3951.5
Table 2. Serpentine tube structural parameters.
ParameterUnitValue
Outer diameter of the tubemm12.0
Thickness of the tubemm1.2
Length of the tube mm1000
Number of rows in a bundleN/A20
Number of columns of bundlesN/A12
Row spacing of bundlesmm40
Column spacing of bundlesmm60
Table 3. Measurement instruments and parameters.
ParameterSensorAccuracy
The spray water flow rateRotameter (DK800-6, Shuanghuan, Changzhou, China)±2 L/h
The air flow rateVane anemometer (GT8907, Benetech, Shenzhen, China)±0.01 m/s
Ambient temperature and humidity Thermometer (VICTOR 231, Victor, Sehnzhen, China)±0.1 °C/±0.1%RH
Outlet air temperatureThermocouple (K-type, YHT, Beijing, China)±0.75% t
Outlet air humidityHumidity sensor (TH10S-B, Rongchi, Shenzhen, China)±0.1%RH
The inlet temperature of water in the tubeTemperature control unit (MPWT-20T-20, MAIPT, Suzhou, China)±0.1 °C
The outlet temperature of water in the tubeTemperature control unit (MPWT-20T-20, MAIPT, Suzhou, China)±1 °C
The flow rate of water in the tubeRotameter (LZB-25, Shuanghuan, Changzhou, China)±10 L/h
Table 4. Values corresponding to the levels of different influencing factors.
LevelFactor A:
The Flow Rate of Water in the Tube (kg·h−1)
Factor B:
The Spray Water Flow Rate (kg·h−1)
Factor C:
The Inlet Temperature of Water in the Tube (°C)
Factor D:
The Air Flow Rate (m3·h−1)
12004070.083.25
23004580.099.90
34005090.0124.65
450055100.0132.30
560060110.0146.70
Table 5. Variance analysis of heat dissipation.
FactorAverage Deviation Sum of SquaresF0.05(4, 8)F ValueSignificance of Difference
Factor A14.573.8417.43Significant
Factor B6.473.847.74Significant
Factor C33.173.8439.68Significant
Factor D1.533.841.82Not significant
Table 6. Variance analysis of the cooling efficiency.
FactorAverage Deviation Sum of SquaresF0.05(4, 8)F ValueSignificance of Difference
Factor A0.06813.84114.81Significant
Factor B0.00683.8411.38Significant
Factor C0.00093.841.51Not significant
Factor D0.00223.843.75Not significant
Table 7. Variance analysis of the heat transfer coefficient.
FactorAverage Deviation Sum of SquaresF0.05(4, 8)F ValueSignificance of Difference
Factor A69.453.840.51Not significant
Factor B4151.753.8430.61Significant
Factor C745.173.845.49Significant
Factor D1197.633.848.83Significant
Table 8. Variance analysis of the mass transfer coefficient.
FactorAverage Deviation Sum of SquaresF0.05(4, 8)F ValueSignificance of Difference
Factor A0.000113.844.19Significant
Factor B0.000063.842.12Not significant
Factor C0.000643.8424.49Significant
Factor D0.000203.847.78Significant
Disclaimer/Publisher’s Note: The statements, opinions and data contained in all publications are solely those of the individual author(s) and contributor(s) and not of MDPI and/or the editor(s). MDPI and/or the editor(s) disclaim responsibility for any injury to people or property resulting from any ideas, methods, instructions or products referred to in the content.

