Abstract
The displacement efficiency of supercritical CO2 (scCO2) injection in the storage zone and its primary trapping mechanism in the confining zone are strongly tied to the capillary phenomenon. Previous studies have indicated that the capillary phenomenon can be affected by geochemical reactivity induced by scCO2 dissolution in formation brine. To quantify such changes, thin disk samples representing a sandstone storage reservoir, siltstone confining zone, and mudstone confining zone were treated under a scCO2-enriched brine static condition for 21 days at 65 °C and 20.7 MPa. Geochemical alterations were assessed at the surface level using scanning electron microscopy coupled with energy-dispersive X-ray spectroscopy and X-ray fluorescence. Before and after treatment, the wettability of the scCO2–brine–rock systems was determined using the captive-bubble method at fluid-equilibrated conditions. Pore size distributions of the bulk rocks were obtained with mercury injection capillary pressure, nuclear magnetic resonance, and isothermal nitrogen adsorption. The results indicate the dissolution of calcite at the surface, while other potentially reactive minerals (e.g., clays, feldspars, and dolomite) remain preserved. Despite alteration of the surface mineralogy, the measured contact angles in the scCO2–brine–rocks systems do not change significantly. Contact angle values of 42 ± 2° for sandstone and 36 ± 2° for clay-rich siltstone/calcite-rich mudstone were determined before and after treatment. The rocks studied here maintained their water-wettability at elevated conditions and after geochemical reactivity. It is also observed that surface alteration by geochemical effects did not impact the pore size distributions or porosities of the thin disk samples after treatment. These results provide insights into understanding the impact of short-term geochemical reactions on the scCO2–brine capillary displacement in the storage zone and the risks associated with scCO2 breakthrough in confining zones.
1. Introduction
Carbon geostorage (CGS) is considered a primary solution to limit the global average temperature according to Paris Agreement and achieve net-zero emissions [1]. In CGS, gaseous CO2 is captured at large-scale point sources and injected in porous geological formations at depths beyond 800 m to ensure a supercritical state (scCO2), hence maximizing storage resources [2]. Sandstones are frequently chosen as host rocks for CGS because of their high injectivity and storage capacity [3,4], whereas siltstones [5,6,7,8] and mudstones [9,10], characterized by low permeability, are well-suited as confining zones. In addition to the macroscopic fluid displacement within the host rock, which is a function of its heterogeneity, the efficiency of the storage process is intricately linked to microscopic displacement factors such as interfacial tension (IFT), wettability, and pore size distribution [11,12,13]. During and after brine displacement, scCO2 is primarily trapped by capillary forces acting on the confining zone (structural trapping) and in the storage zone (residual trapping) [14]. Secondary immobilization of scCO2 occurs by long-term geochemical interactions with formation fluids and rock, including dissolution in fluid (solubility trapping) and formation of stable mineral species (mineral trapping) [15]. Understanding the outcomes of these chemical reactions to the scCO2 microscopic displacement and trapping mechanisms is a challenge, which requires exposure experiments to be conducted at different conditions representing time-spatial distribution within the storage and confining zones [16,17].
The influencing factors on the scCO2 microscopic displacement and its primary trapping mechanisms can be simplified by the capillary phenomenon [17,18]. The net pressure required to displace a non-wetting phase (e.g., scCO2) through a pore throat saturated by a wetting phase (e.g., brine) is given by the Laplace equation [19,20] (Equation (1)):
where is the capillary pressure, is the scCO2–brine interfacial tension, is the contact angle, and is the pore throat radius. As described in Equation (1), the capillary pressure is directly proportional to the product of the tension formed between the fluid phases and the cosine of the contact angle, and inversely proportional to the pore size. If the scCO2 pressure exceeds the breakthrough pressure in the confining zone, upward fluid migration takes place, and the maximum scCO2 height that can be stored in the caprock () is given by Equation (2):
where is the difference in fluid densities between scCO2 and brine, is the gravity constant, and is the connected pore throat radius during breakthrough [21]. Equation (2) shows that in addition to the capillary properties, knowledge of fluid densities in scCO2–brine systems is essential to determine the capillary seal capability [22].
Regarding the interfacial tension, several authors have shown that the IFT of CO2–H2O systems is primarily controlled by the density difference of the two fluid phases [23,24,25,26]. It is generally agreed that the IFT follows a bilinear trend with ∆ρ. For gaseous CO2, the IFT decreases steeply and linearly with decreasing ∆ρ (alternatively, increasing pressure) due to an increase in gas solubility [21]. Above the scCO2 condition (∆ρ~600 kg/m3, ~7.3 MPa, ~31 °C), the IFT decreases mildly, reaching a pseudo plateau at ~26 ± 2 mN/m [23,27]. The pseudo-plateau IFT is independent of temperature [23], increases linearly with salt molality [23,28,29], and is more pronounced in the presence of bivalent cations [23,28,29].
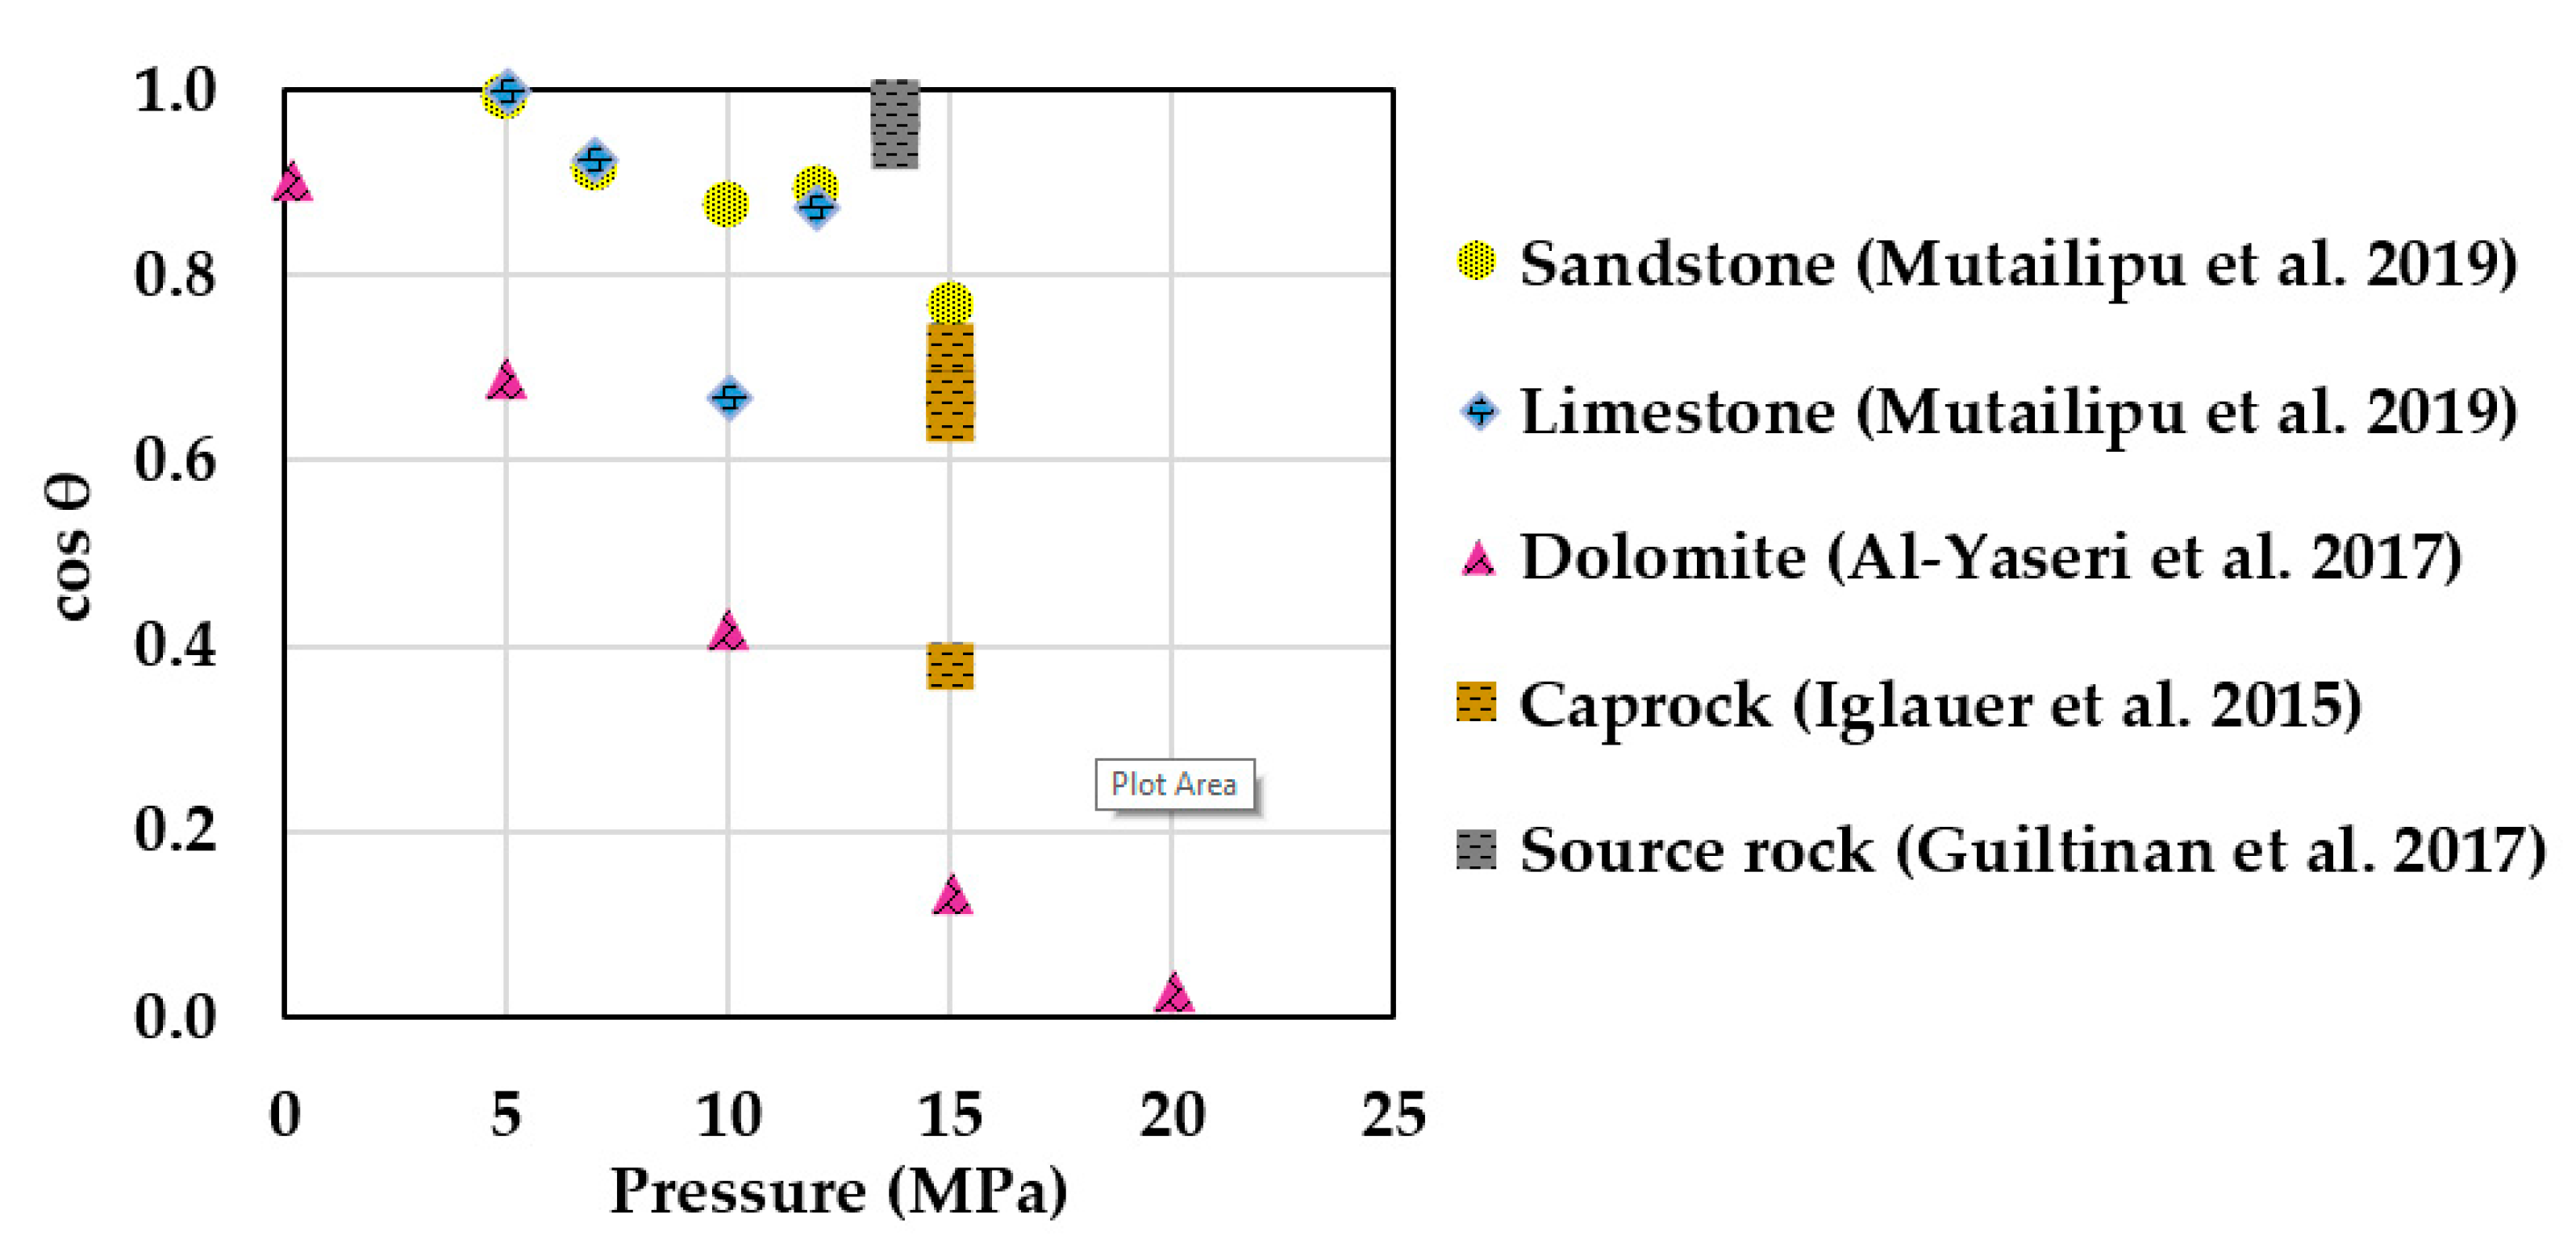
Numerous authors have described the wettability of scCO2–brine–rock systems [30,31,32,33,34,35,36,37,38,39,40,41,42,43,44,45,46,47,48,49,50,51,52,53,54,55,56,57,58,59,60,61,62,63,64,65,66,67,68,69,70,71,72,73,74]. During CGS, water-wettability over scCO2 is often preferred because it limits upward vertical migration and increases residual trapping in the reservoir [75,76,77], as well as increasing structural trapping, thus reducing the risk of scCO2 breakthrough in the confining zone [78,79]. Figure 1 shows a literature compilation of scCO2–brine–rock contact angles as a function of pressure for sandstone [66], limestone [66], dolomite [55], fine-grained caprocks [49], and source rock [58], measured at similar temperatures (~50 °C). A water-wet behavior with respect to scCO2 is observed for most rocks. An exception is dolomite, which has lower hydrophilicity and shows strong negative pressure dependence with cos θ [55]. Aside from pressure, other parameters such as temperature and salinity exhibit less clear influence on θ. Studies conducted on quartz show increasing θ with increasing temperatures [40,44,51,66]; sandstones exhibit no clear trend [62,66]; whereas calcite [56] and carbonate [32] show decreasing θ trends with increasing temperature. Regarding salinity, some papers report quartz and calcite surfaces becoming slightly less water-wet in high salinity [38,56,66]. However, studies conducted on real rocks show either no trend in θ with salinity for a silica/dolomite-rich shale caprock [54], or a slight decrease with salinity for sandstone [62]. Inconsistencies in θ values are mostly attributed to differences in surface cleaning methods [44,71], rock heterogeneity [31], and surface roughness [57,62].
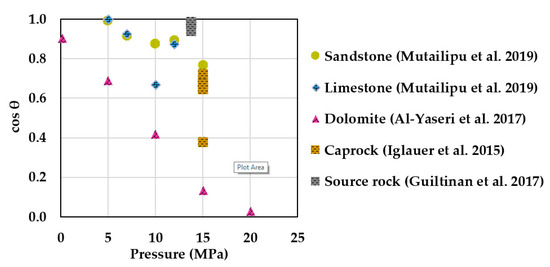
Figure 1.
ScCO2–brine–rock wettability as function of pressure at similar temperature (~50 °C) and salinity conditions. Most rocks exhibit water-wettability with respect to scCO2 even at elevated pressures. An exception is dolomite, showing strong negative pressure dependence on θ (lower hydrophilicity). Note: sandstone [66], limestone [66], and source rock [58] contact angle values were conducted in static measurements. Caprock [49] represents receding contact angles, while dolomite [55] is an average of retreating and advancing values.
The interaction between scCO2 and brine in the subsurface can trigger geochemical reactions with the rock and potentially impact the microscopic displacement and trapping mechanisms during CGS. These geochemical reactions are generally classified as short- and long-term reactions [80,81]. At the early stage, the dissolution of CO2 in brine occurs, generating carbonic acid, which further ionizes into carbonate and bicarbonate ions, ultimately reducing the pH down to ~3 [80,82,83]:
CO2 (gas) + H2O ⇌ H2CO3
H2CO3 ⇌ H+ + HCO3−
HCO3− ⇌ H+ + CO3−
The increase in H+ species in the brine accelerates carbonate dissolution given their fast reactivity in acidic environments [84]. Among carbonates, calcite exhibits the largest dissolution rate, being ~2–3 and ~3–4 orders of magnitude faster than dolomite and siderite, respectively [85,86,87]. During calcite dissolution, the reactant is consumed quickly, and the reaction ceases at an equilibrium pH of 4.5–5.0 [80,83]:
CaCO3 (calcite) + H+ ⇌ Ca2+ + HCO3−
Alternatively, aluminosilicates such as feldspars, micas, and clays can yield more cations in the brine and buffer the pH up to ~8.0. However, their reaction rates are small and can take up to thousands of years to occur [80,83]. A secondary alteration of feldspars can occur when the concentration of calcium ions deriving from the dissolution of carbonates plus originally occurring in the brine is considerable [80,88]. An example is the dissolution of albite consuming Ca2+ and leading to the precipitation of calcite and kaolinite [80]:
2NaAlSi3O8 (albite) + CO2 + 2H2O + Ca2+ > 4SiO2 (chalcedony) + CaCO3 (calcite) + Al2Si2O5(OH)4 (kaolinite) + 2Na+
Recent studies have evaluated the role of geochemical alterations induced by scCO2–brine interactions in the capillary properties of the storage zone [89,90,91] and confining zone [60,69,73,92,93,94,95,96,97,98]. Due to their high reactivity, limestones are generally the storage rock of focus, given that the reactivity of sandstones (mainly quartz) is extremely slow and pH-independent [16,83]. Dynamic scCO2-enriched brine injection tests on limestone cores show strong calcite dissolution and enlargement of pore throats in the inlet of the core, followed by slight mineral precipitation in the far region [89,90]. Additionally, an increase in the limestone scCO2-wettability was observed after scCO2-enriched brine treatment [90,91].
With respect to confining zones, most scCO2 treatment studies were conducted on crushed samples, observing significant geochemical alteration in the form of dissolution and/or precipitation of preferentially carbonate minerals [92,94,95,98,99]. Mouzakis, et al. [92] reported an increase in porosity and connectivity in all pore length scales of a carbonate-rich shale. Sanguinito, et al. [94], Goodman, et al. [95] performed experiments on the same Utica Shale (clay/calcite-rich) but varying reactor fluid, from dry scCO2 to scCO2-enriched deionized water (DIW), respectively. They reported increased reactivity when water was introduced into the system. Some studies indicate that dry scCO2 can also affect the hydration of clays by possibly releasing interstitial water [60,94]. Regarding wettability alteration, Qin, et al. [60] described an increase in water contact angles (57 ± 2° to 69 ± 2°) on quartz/clay-rich shales after exposure to dry scCO2 for 12 days. However, their θ measurements were conducted at ambient conditions and do not reflect the equilibrium between scCO2–brine in the subsurface [76]. Conversely, Gholami, et al. [69] conducted equilibrated scCO2–DIW θ measurements on quartz/clay-rich shales exposed to scCO2 for 6 months. They reported an average increase from 40 ± 5° to 49 ± 5°, along with surface dissolution of quartz and precipitation of kaolinite. To the best of our knowledge, changes in scCO2–brine–rock wettability by geochemical reactivity of carbonates present in confining zones and the extent of reactivity in the pore size distributions of intact rock samples have not been addressed.
The principal aim of this study is to evaluate the impact of geochemical reactivity on the scCO2–brine–rock wettability and pore size distribution (PSD) of quartz, clay, and carbonate-rich intact rocks, both before and after treatment with scCO2. The specific objectives are as follows: (i) assess geochemical alterations on thin disk samples after exposing to scCO2-enriched brine environment at 20.7 MPa and 65 °C for 21 days, (ii) monitor changes in fluid-equilibrated scCO2–brine–rock contact angles, with a particular emphasis on the impact of surface reactivity on the wettability of the scCO2–brine–rock system under elevated pressure conditions (~20 MPa), and (iii) determine alterations in PSD using three different methods: mercury injection capillary pressure (MICP), nuclear magnetic resonance (NMR), and isothermal nitrogen (N2) adsorption, and analyze the resulting data to assess the effects of geochemical reactions on the PSD of the thin disk samples. This study aims to provide insights into how geochemical reactions occurring within an experimental timeframe may influence the wettability and pore structure of rocks relevant to carbon geostorage (CGS).
2. Materials and Methods
2.1. Samples Description
For this study, we selected potential storage and confining zone rock samples varying in mineralogy and petrophysical properties (Table 1). The core samples were obtained from drilling sites where horizontal plugs (~2.5 cm diameter and length) were extracted in the “as-received” state. The plugs were cleaned using Soxhlet extraction with 80/20 toluene/methanol solution to remove hydrocarbons, water, and salt, and dried at 100 °C until weight stabilized. Total porosity was measured using the protocol described in our previous work [100]. Mineralogy determined using transmission Fourier transform infrared spectroscopy (FTIR) [101,102] and microstructural examination with scanning electron microscopy (SEM) indicates that sample S1 is a quartz-rich sandstone, S2 is a quartz/clay-rich siltstone, and S3 is a finer-grained carbonate/clay-rich mudstone. Total organic carbon (TOC) measured with the LECO® method on the mudstone (S3) shows low TOC (~2.0%). To prepare the sample for our measurements, four adjacent thin disks (~0.6 cm length) were cut from each plug. Vertical heterogeneity from the same plug was minimized by conducting several X-ray fluorescence (XRF) measurements on the surface of each disk and confirming low elemental variation. To minimize surface roughness, the measurement surface of each disk was subjected to fine polishing up to 2400 grit sandpaper followed by ion-milling (Fischione 1060 SEM, Export, USA). Then, MICP data were taken on one “untreated” disk from each sample (Table 1). The other disks were used in other pre-treatment measurements such as (1) surface characterization using SEM coupled with energy dispersive X-ray spectroscopy (EDS) (detailed imaging procedure can be found in Curtis, et al. [103]), (2) fluid-equilibrated scCO2–brine–rock captive-bubble contact angle (θ) measurements, (3) NMR T2 porosity measurements, and (4) isothermal N2 adsorption. After initial measurements, the samples were exposed to static scCO2-enriched brine. The same measurements were conducted after exposure to assess changes in the samples due to scCO2-enriched brine exposure.

Table 1.
Mineralogy, porosity, TOC, and MICP measurements on the samples used in this study.
2.2. scCO2-Enriched Brine Treatment
According to Gaus, et al. [80], most caprock reactivity induced by scCO2 will occur close to the boundary of the reservoir. For that reason, the samples used in this study were treated in a scCO2-enriched brine condition in order to maintain maximum brine saturation and avoid undesirable effects such as drying out by CO2 [104,105]. The brine was synthetically formulated using a 2.5 wt.% KCl solution (DIW). For the scCO2-enriched brine treatments, each sample was exposed in individual reactors (Parr Instrument, Moline, IL, USA) that can operate in pressure and temperature conditions up to 58 MPa and 350 °C, respectively. The reactors were cleaned between each test with toluene, isopropanol, and acetone to avoid cross-contamination. To determine the experimental conditions, a desirable injection depth of 2000 m was selected [106]. Assuming a hydrostatic pressure gradient for brine of ~ and temperature gradient of ~, experimental conditions of ~20.7 MPa and ~65 °C were determined. The exposure time selected was 21 days, which, according to previous studies, is sufficient to observe geochemical reactions such as carbonate dissolution/precipitation [92,94,95,98,99] and clay reactivity [60,94]. Note that given the mineral reaction rates, quartz dissolution [69] and secondary feldspar alteration [80] are not expected to be observed since they could take up to 180 days and 19 months to experimentally occur, respectively. After selecting the exposure conditions, the samples were placed in the reactors inside an oven and immersed in brine at a ~10:1 brine/rock volume ratio. Then, scCO2 was slowly introduced into the system using a piston pump (Teledyne ISCO, Lincoln, Dearborn, MI, USA) at a ~0.4 MPa/h pressure gradient to avoid microfracturing of samples. Pressure and temperature were monitored during the process. After exposure, the system was cooled and depressurized at the same gradient as injection and the samples were sequentially used in further measurements.
2.3. scCO2–Brine–Rock Contact Angle Measurement
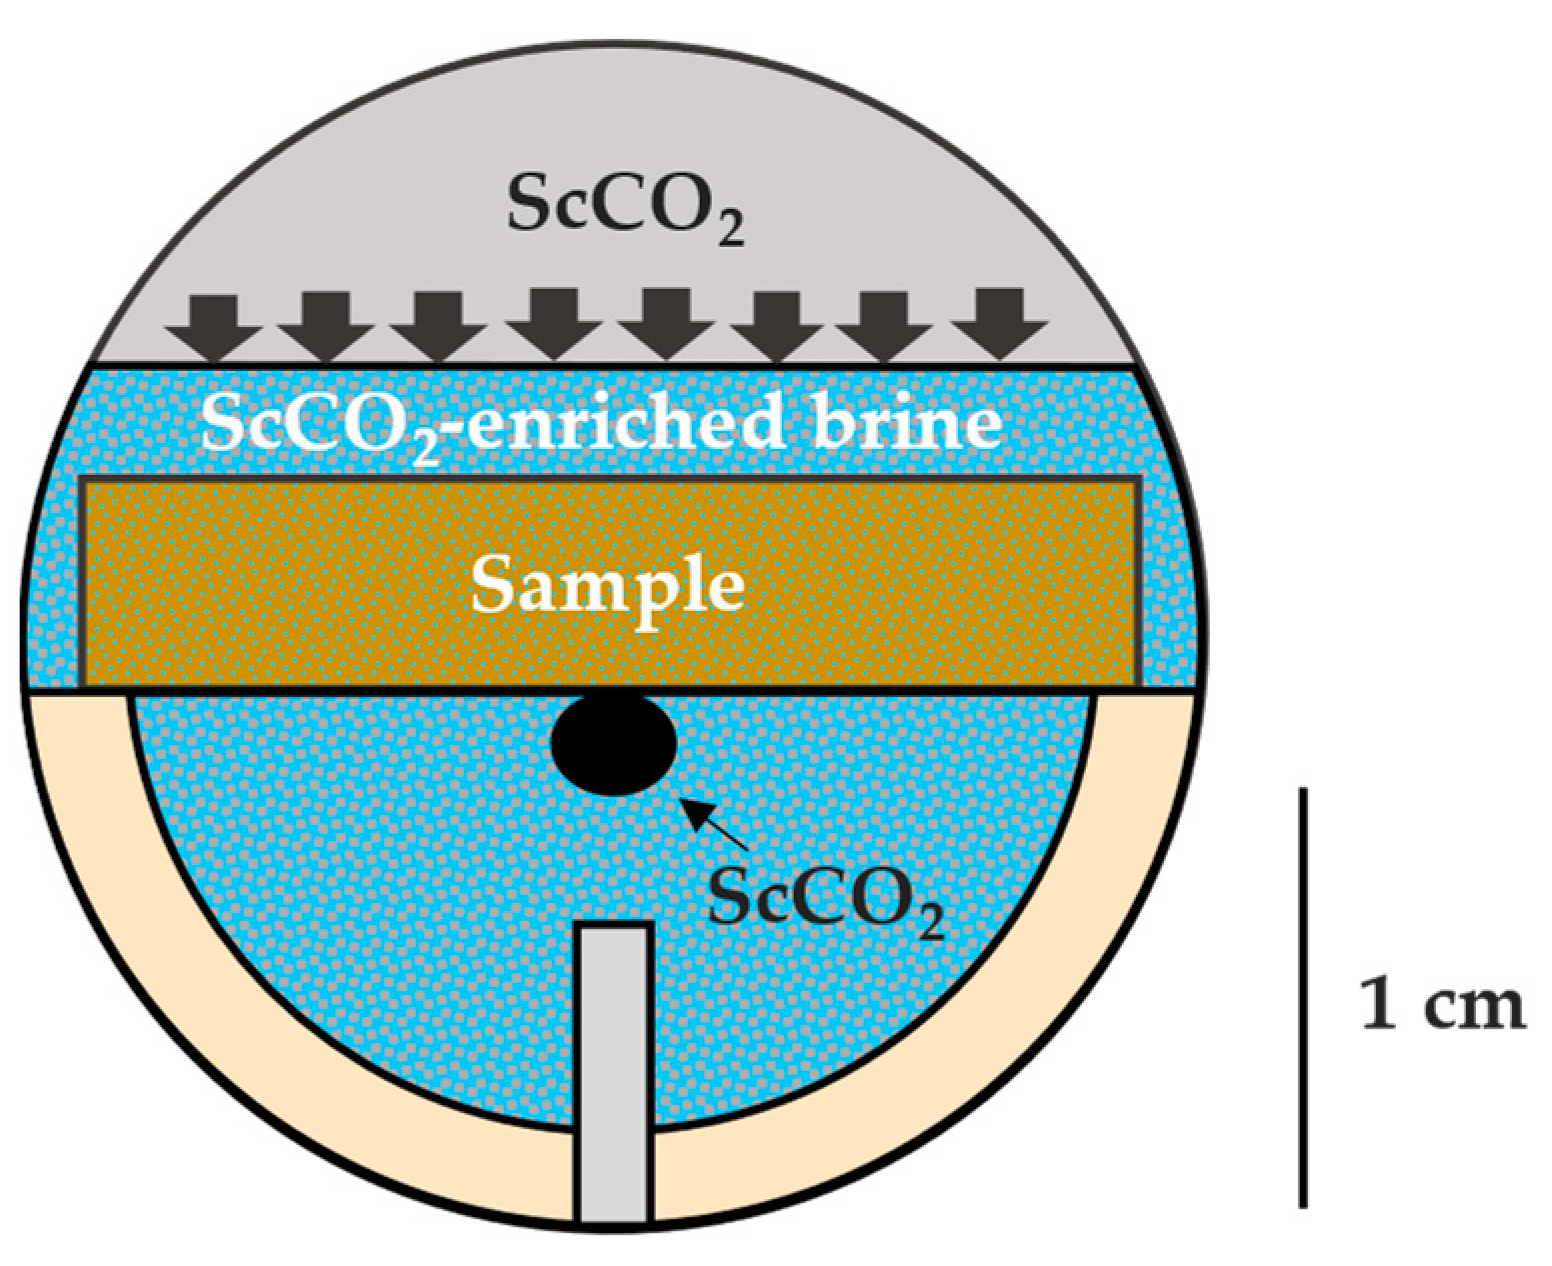
Several configurations have been used to measure the contact angle of scCO2–brine–rock systems in subsurface conditions [64]. The captive-bubble technique was chosen (Figure 2) in order to keep the brine sample saturated during the measurement and avoid possible drying out if surrounded by a scCO2 environment. The measurements were conducted using a drop shape analyzer (DSA100, Krüss GmbH, Hamburgh, Germany) coupled with an HPHT unit (Eurotechnica, Bargteheide, Germany) with a maximum working pressure and cell temperature of 69 MPa and 200 °C, respectively. Prior to the measurement, a brine-saturated sample was mounted on a custom-made, chemically inert holder (PEEK) that slides through a known outside diameter needle (~1.587 mm) that orients with the center of the sample. This orientation step allows the scCO2 bubble to contact the ion-milled surface of the sample, reducing the roughness impact on θ and minimizing lateral heterogeneity. Then, roughly 30 mL of brine was introduced into the system until it covered the top surface of the sample. The unit was heated slowly up to 65 °C. ScCO2 was injected from the top (gas cap), allowing diffusion into the brine and maintaining a constant pressure of 20.7 MPa, which was also monitored. After the fluid equilibration had taken place (~2 h), one scCO2 bubble was carefully extruded from the needle using a separate dosing unit. Image calibration was performed, and the software (ADVANCE, version 1.10.0) recorded the static scCO2–brine–rock contact angle over time. The exact same procedure was conducted on the samples after scCO2–brine–rock treatment.
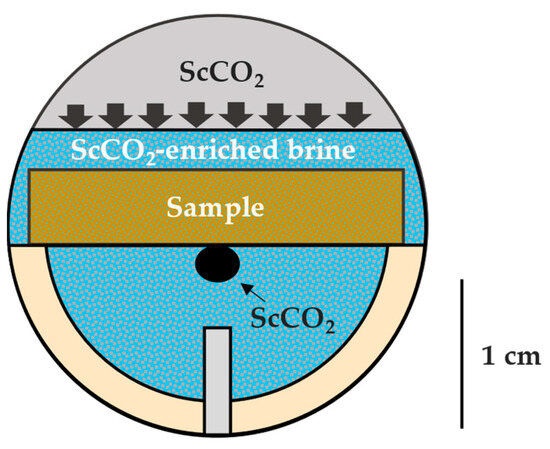
Figure 2.
Schematic of the scCO2–brine–rock captive-bubble measurement including approximate scale in centimeters. The brine surrounding the rock sample is enriched in scCO2 diffusing downward from the “gas-cap” at desired pressure and temperature conditions. After equilibration, one scCO2 bubble is carefully extruded from the needle (bottom), contacting the center of the ion-milled bottom surface of the sample.
2.4. Pore Size Distribution Measurements
Porosity and pore size distribution measurements were conducted before and after scCO2 treatment. Pore throat size distributions (PTSDs) were obtained on clean and dried thin disk samples using MICP measurements (AutoPore IV, Micromeritics, Norcross, GA, USA). The AutoPore IV mercury porosimeter has a capability of 60,000 psi, which covers a nanopore throat radius of up to 1.5 nm [107]. For porosity, 12 MHz NMR T2 measurements (GeoSpec II, Oxford Instruments, Abindgon, UK) were conducted on 2.5 wt.% KCl brine-saturated disk samples. In the NMR measurements, three disks were stacked in order to increase volume and enhance the signal-to-noise ratio (SNR). Echo spacing of 200 μs was selected for sample S1 (storage zone), while 100 μs was used in samples S2 and S3 (confining zone). Isothermal N2 adsorption measurements (TriStar II, Micromeritics, Norcross, GA, USA) were conducted on the confining zones (S2 and S3) to assess changes in the nanopore structure. For the N2 adsorption measurements, each sample was crushed, homogenized, and sieved into micrometer sizes (250–425 μm). N2 adsorption pore size distributions were obtained with the density functional theory (DFT) using a slit-shaped model. Specific surface areas were determined with the Brunauer–Emmett–Teller (BET) method, fitting the adsorption data in the low relative pressure range (0.5–0.35).
3. Results
3.1. Geochemical Alteration
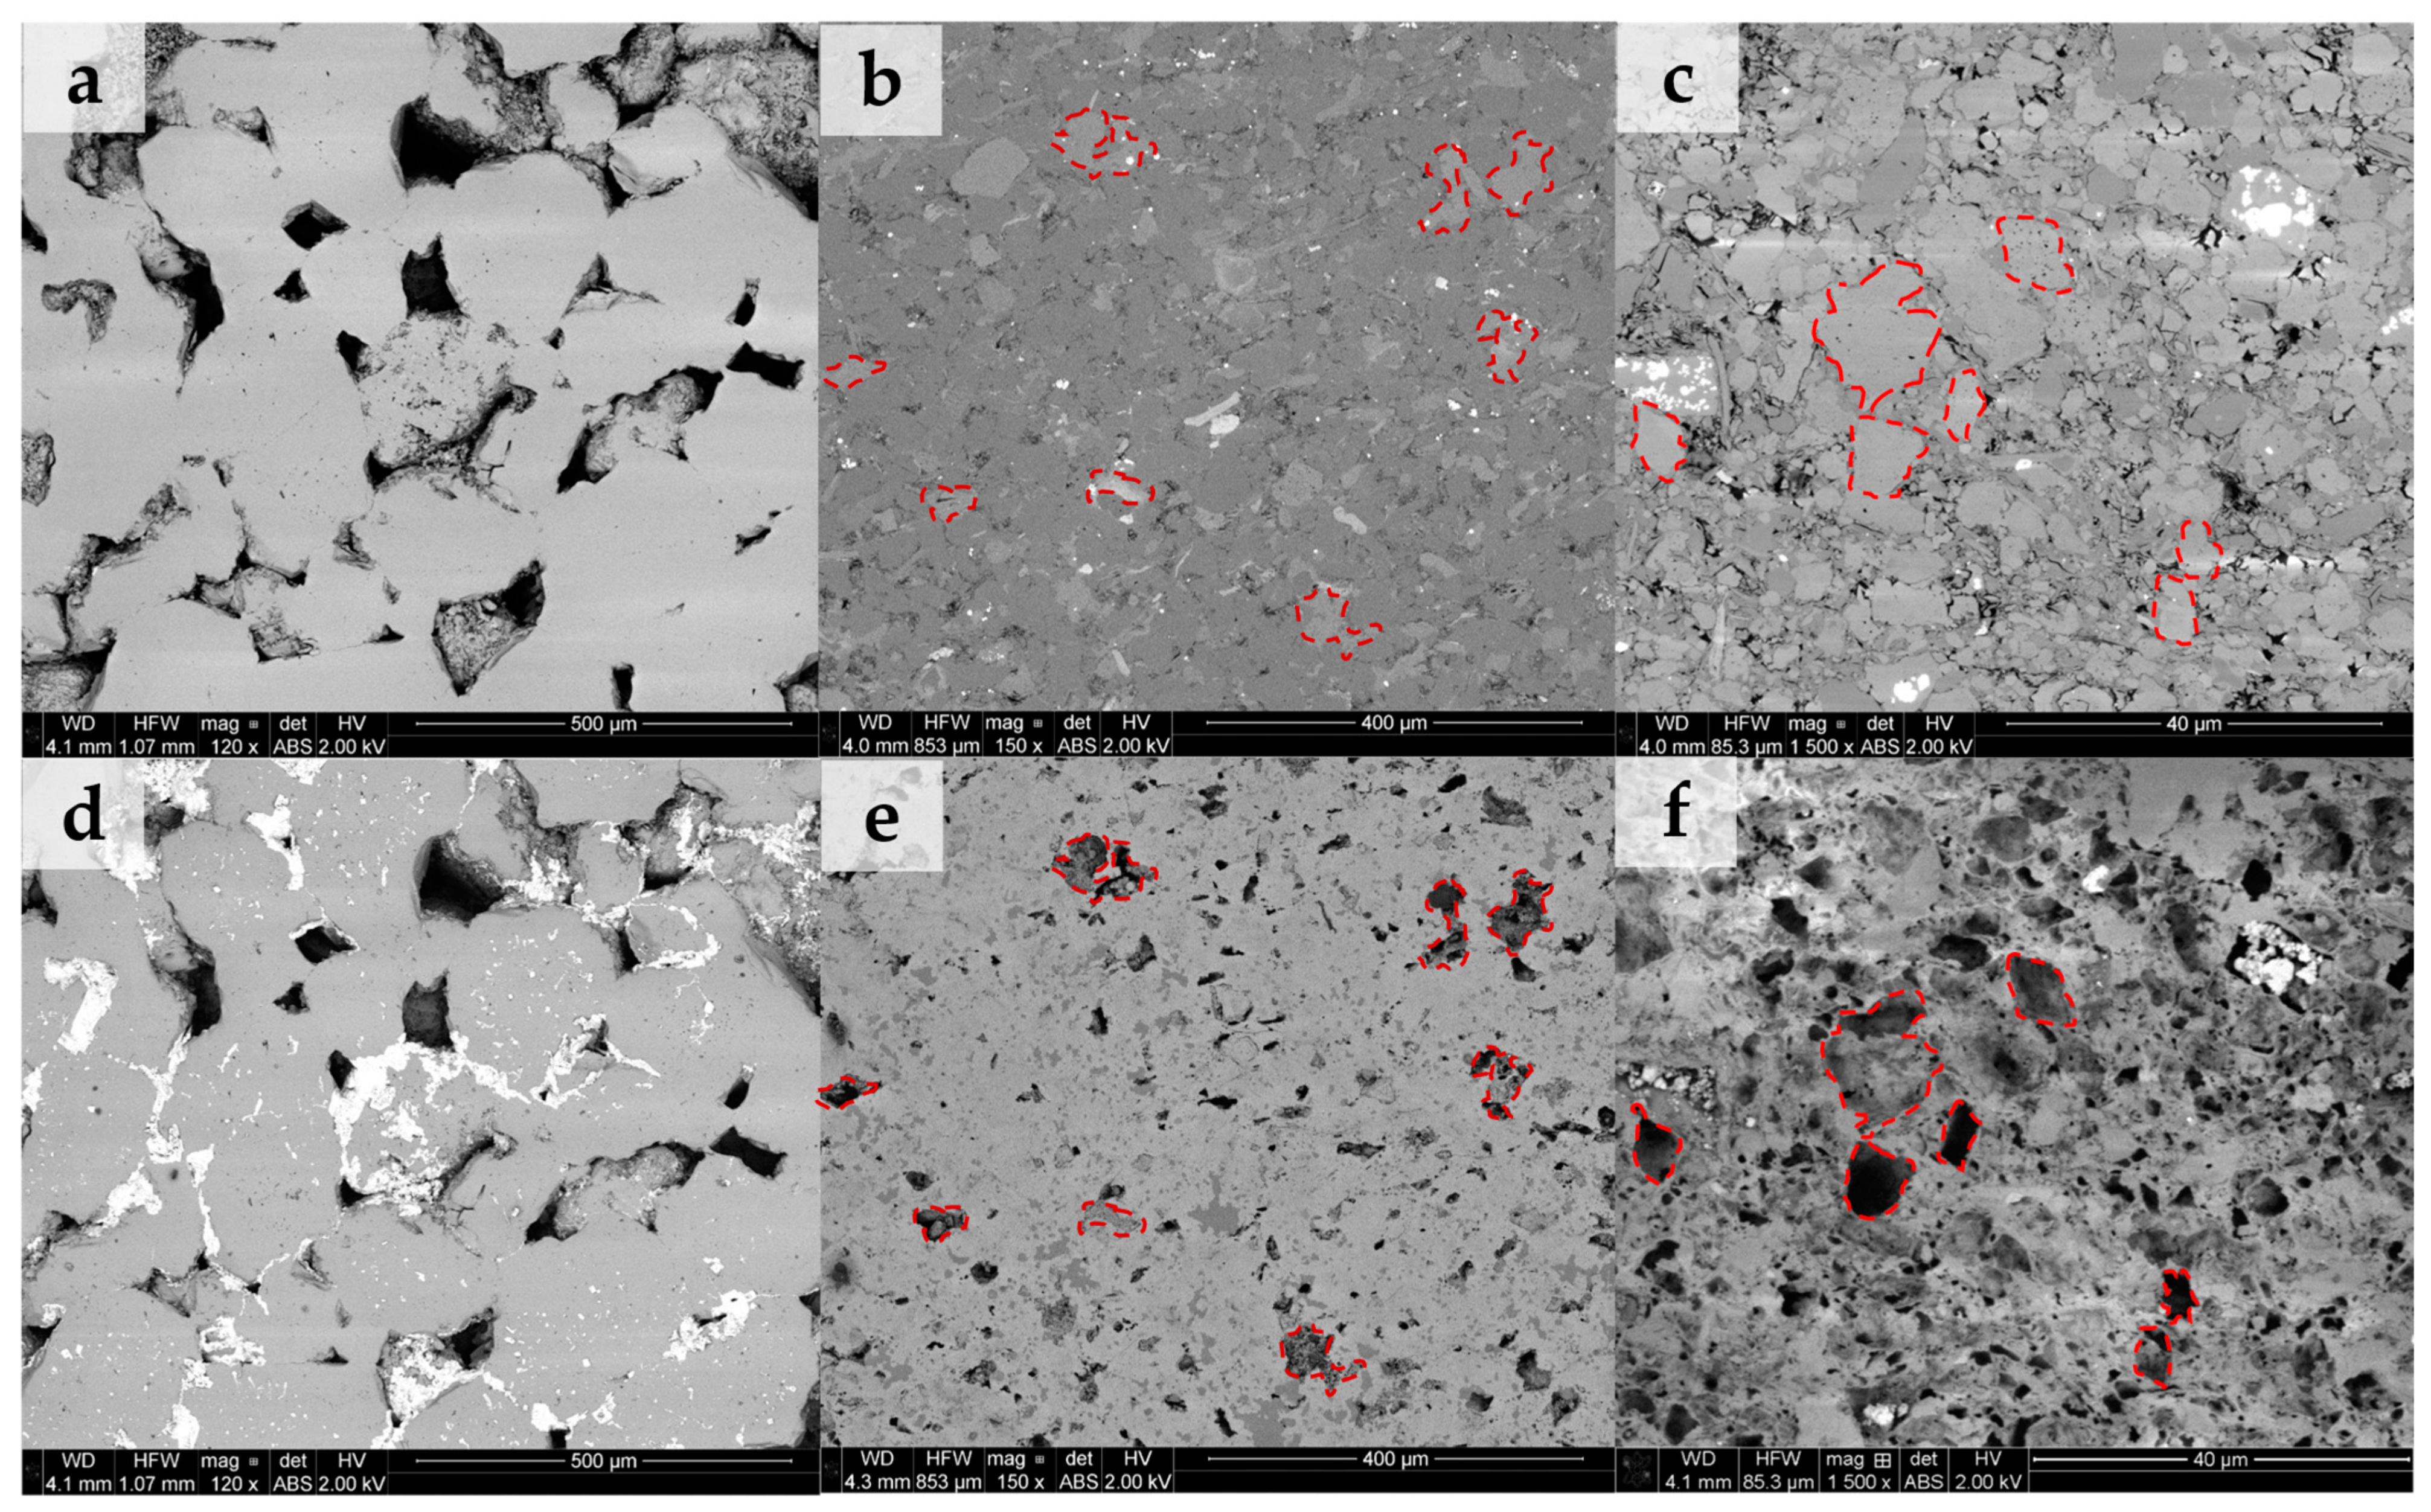
Figure 3 shows the backscattered electron (BSE) images of the three samples obtained over the same areas before and after scCO2-enriched brine treatment. Figure 3a–c represent the microstructure before treatment of samples S1, S2, and S3, respectively. Images of the same areas for each sample after treatment are sequentially shown in Figure 3d–f. Before treatment, sample S1 is composed mainly of quartz grains and some clays (illite, chlorite, and kaolinite) filling the pore spaces. Sample S2 is covered by silicates, aluminosilicates, and minor carbonates. S3 is predominantly carbonate-rich, including clays, minor silicates, and pyrite (white). After treatment, no geochemical reactivity is observed on sample S1, except for salt precipitation. Conversely, sample S2 exhibits preferential dissolution of carbonate minerals (highlighted in red), while the main silicate and aluminosilicate framework remains preserved. Given the larger carbonate content of sample S3 (Table 1), it shows significant surface alteration by dissolution of carbonates after treatment. It is observed that other potentially reactive minerals such as clays and pyrite (white) are unaltered during this process.
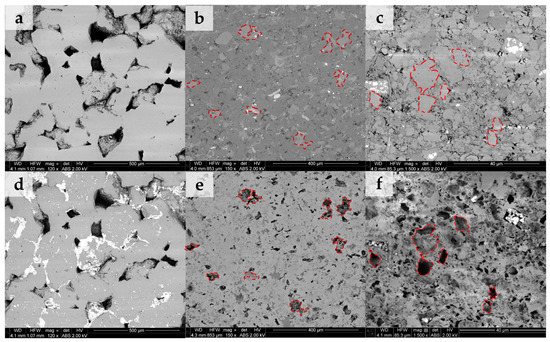
Figure 3.
Backscattered images (BSEs) of the same sample area before and after scCO2-enriched brine treatment. (a–c) represent areas before treatment for samples S1, S2, and S3, respectively. Their same areas after treatment are sequentially shown in (d–f). Sample S1 indicates no geochemical reactivity aside from salt precipitation. Sample S2 shows preferential dissolution of carbonates (highlighted in red), while the silicate/aluminosilicate framework remains preserved. Sample S3 reveals intense surface alteration by dissolution of carbonates, which was expected given their larger initial carbonate content. Other potentially reactive minerals such as clays and pyrite were little affected during the process.
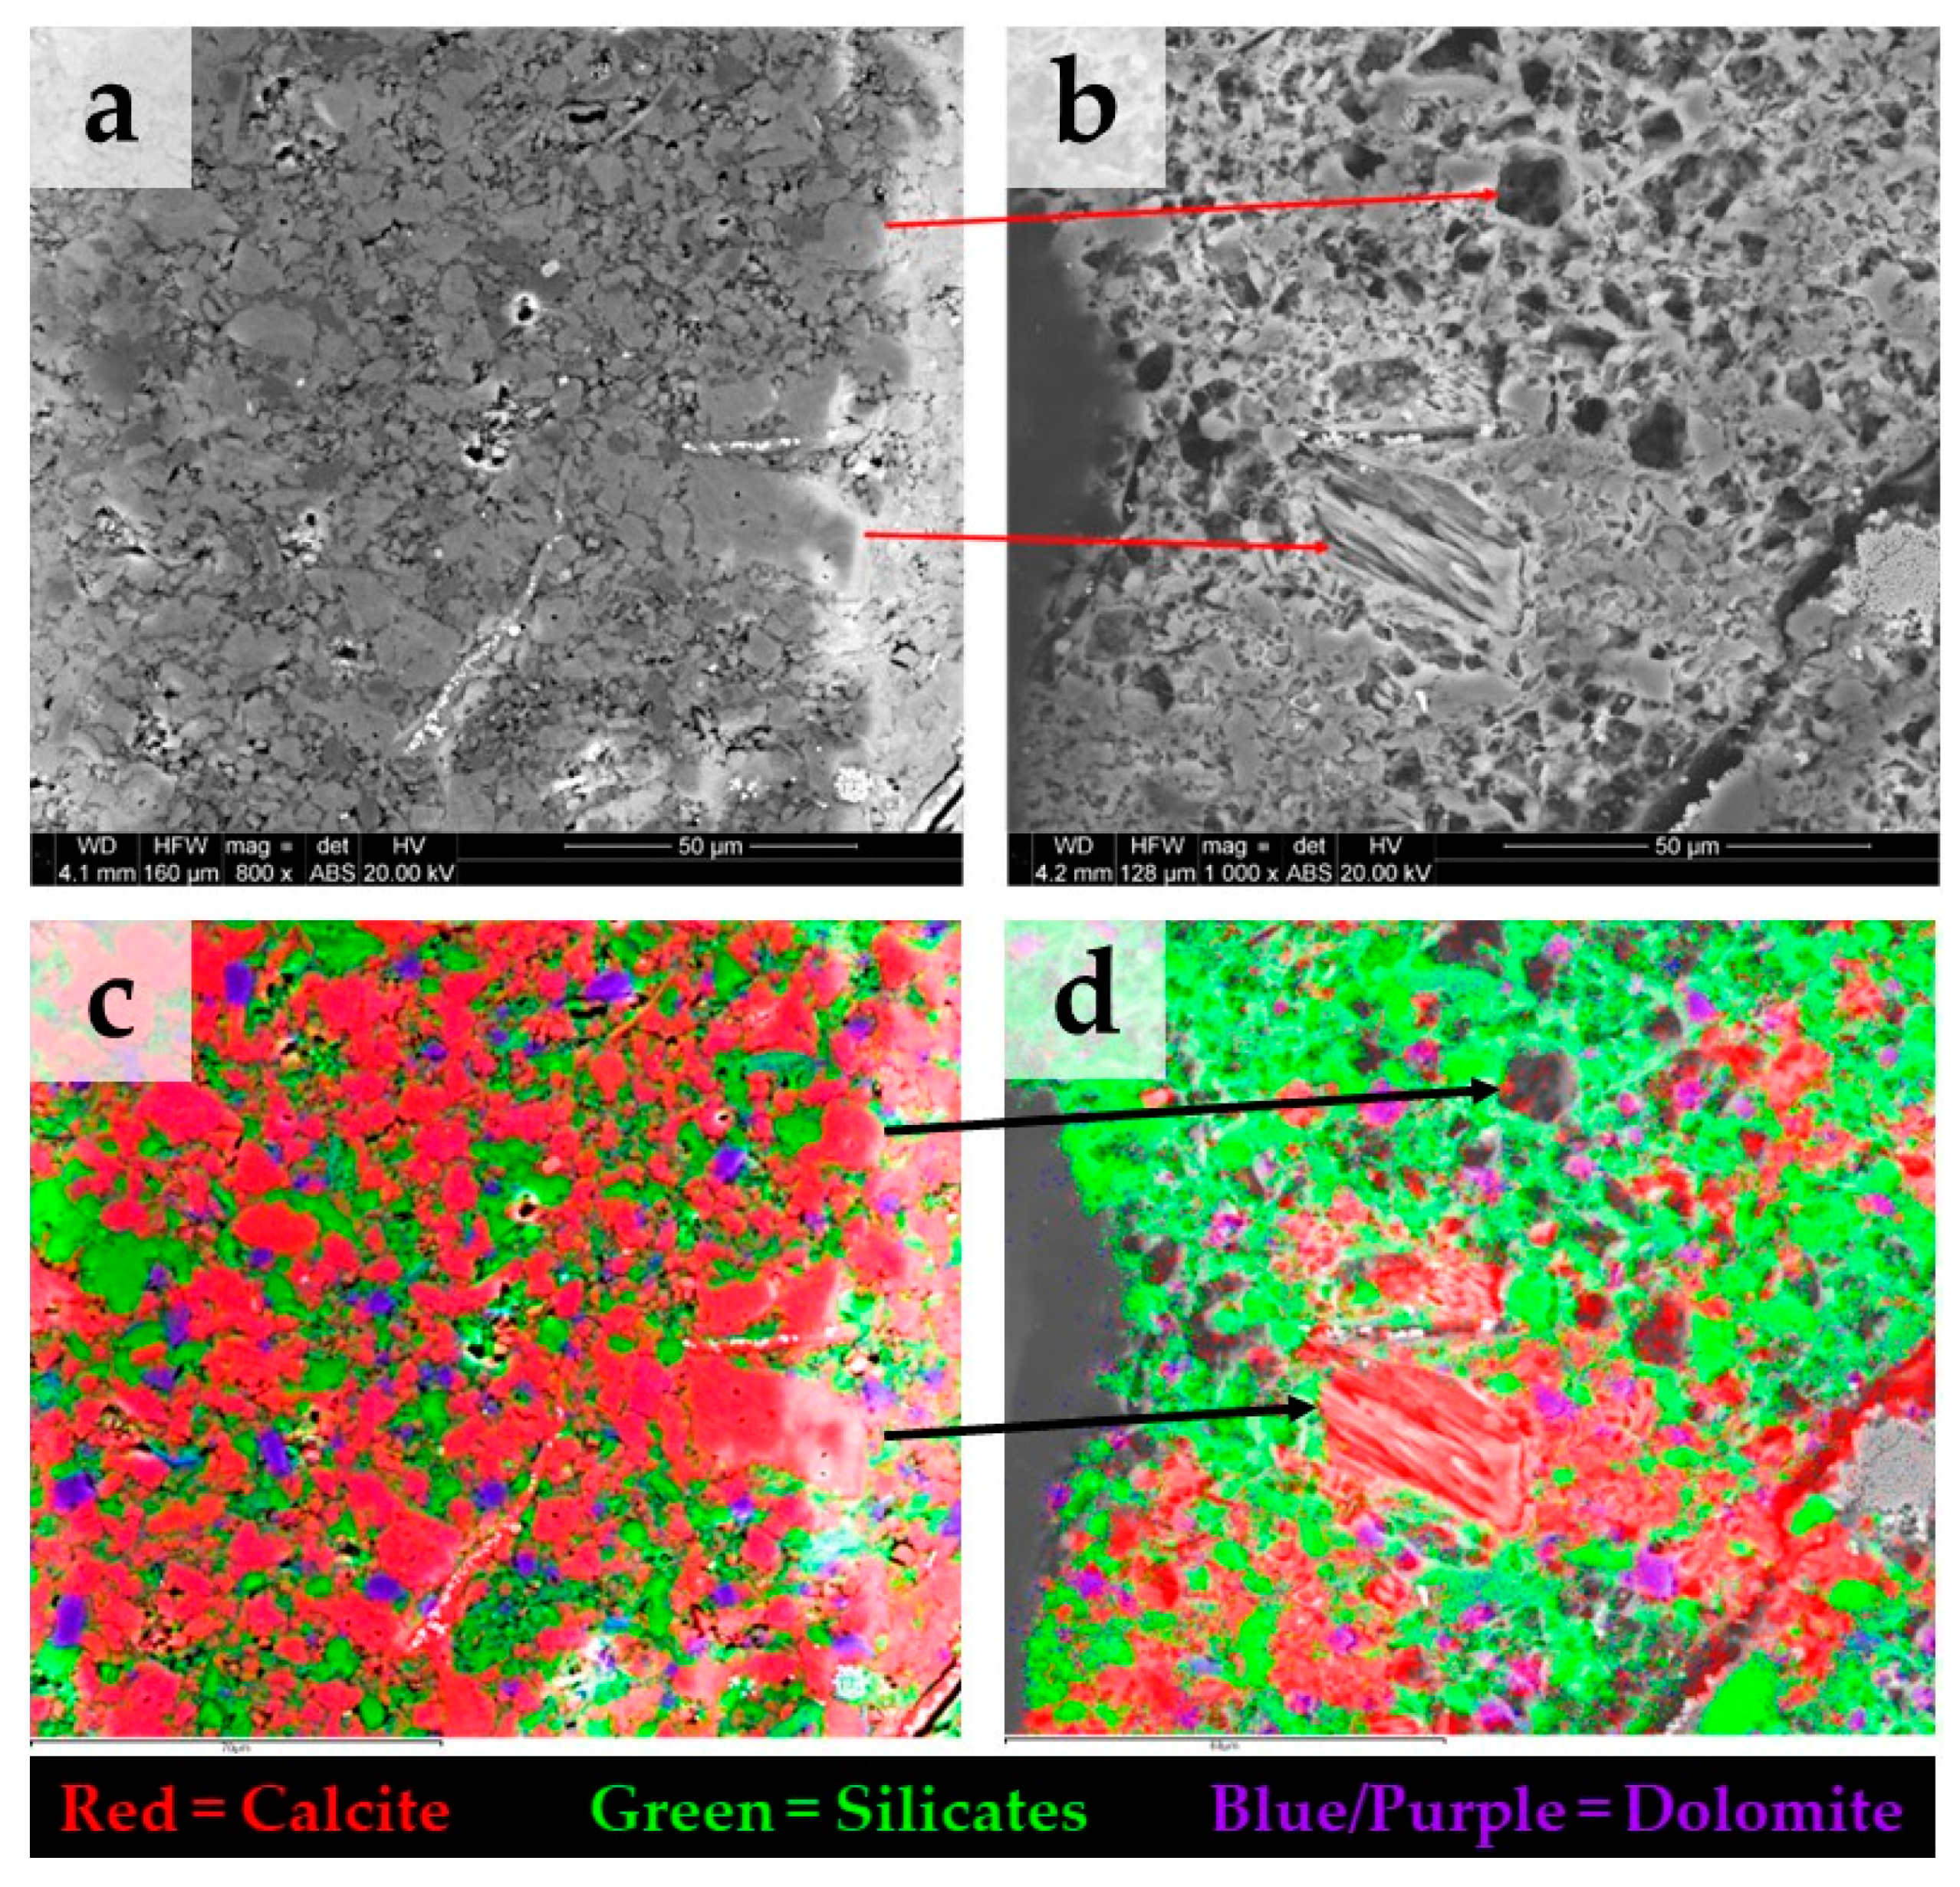
Figure 4 shows BSE images on a strongly reacting area of the sample S3 before (Figure 4a) and after (Figure 4b) treatment. In Figure 4c, the spatial elemental mapping before treatment obtained with EDS shows predominantly calcite with minor amounts of silicate and dolomite. Figure 4d shows that, after treatment, calcite is the only carbonate mineral dissolved, whereas dolomite remains unaltered. XRF measurements performed before and after treatment at the surface of sample S3 indicate a reduction in the relative content of calcium oxide (CaO) from 55 wt.% to 14 wt.%, respectively.

Figure 4.
BSE images before (a) and after (b) treatment on the same area of sample S3 showing strong alteration due to carbonate dissolution. Note: in (b), the depicted image exhibits a slight displacement relative to (a), while the arrows serve to locate the same calcite grains. (c) spatial elemental mapping with EDS before treatment, the area has predominantly calcite with minor amount of dolomite. (d) after treatment, calcite appears as the only mineral dissolved, while dolomite remains unaltered.
3.2. ScCO2–Brine–Rock Wettability
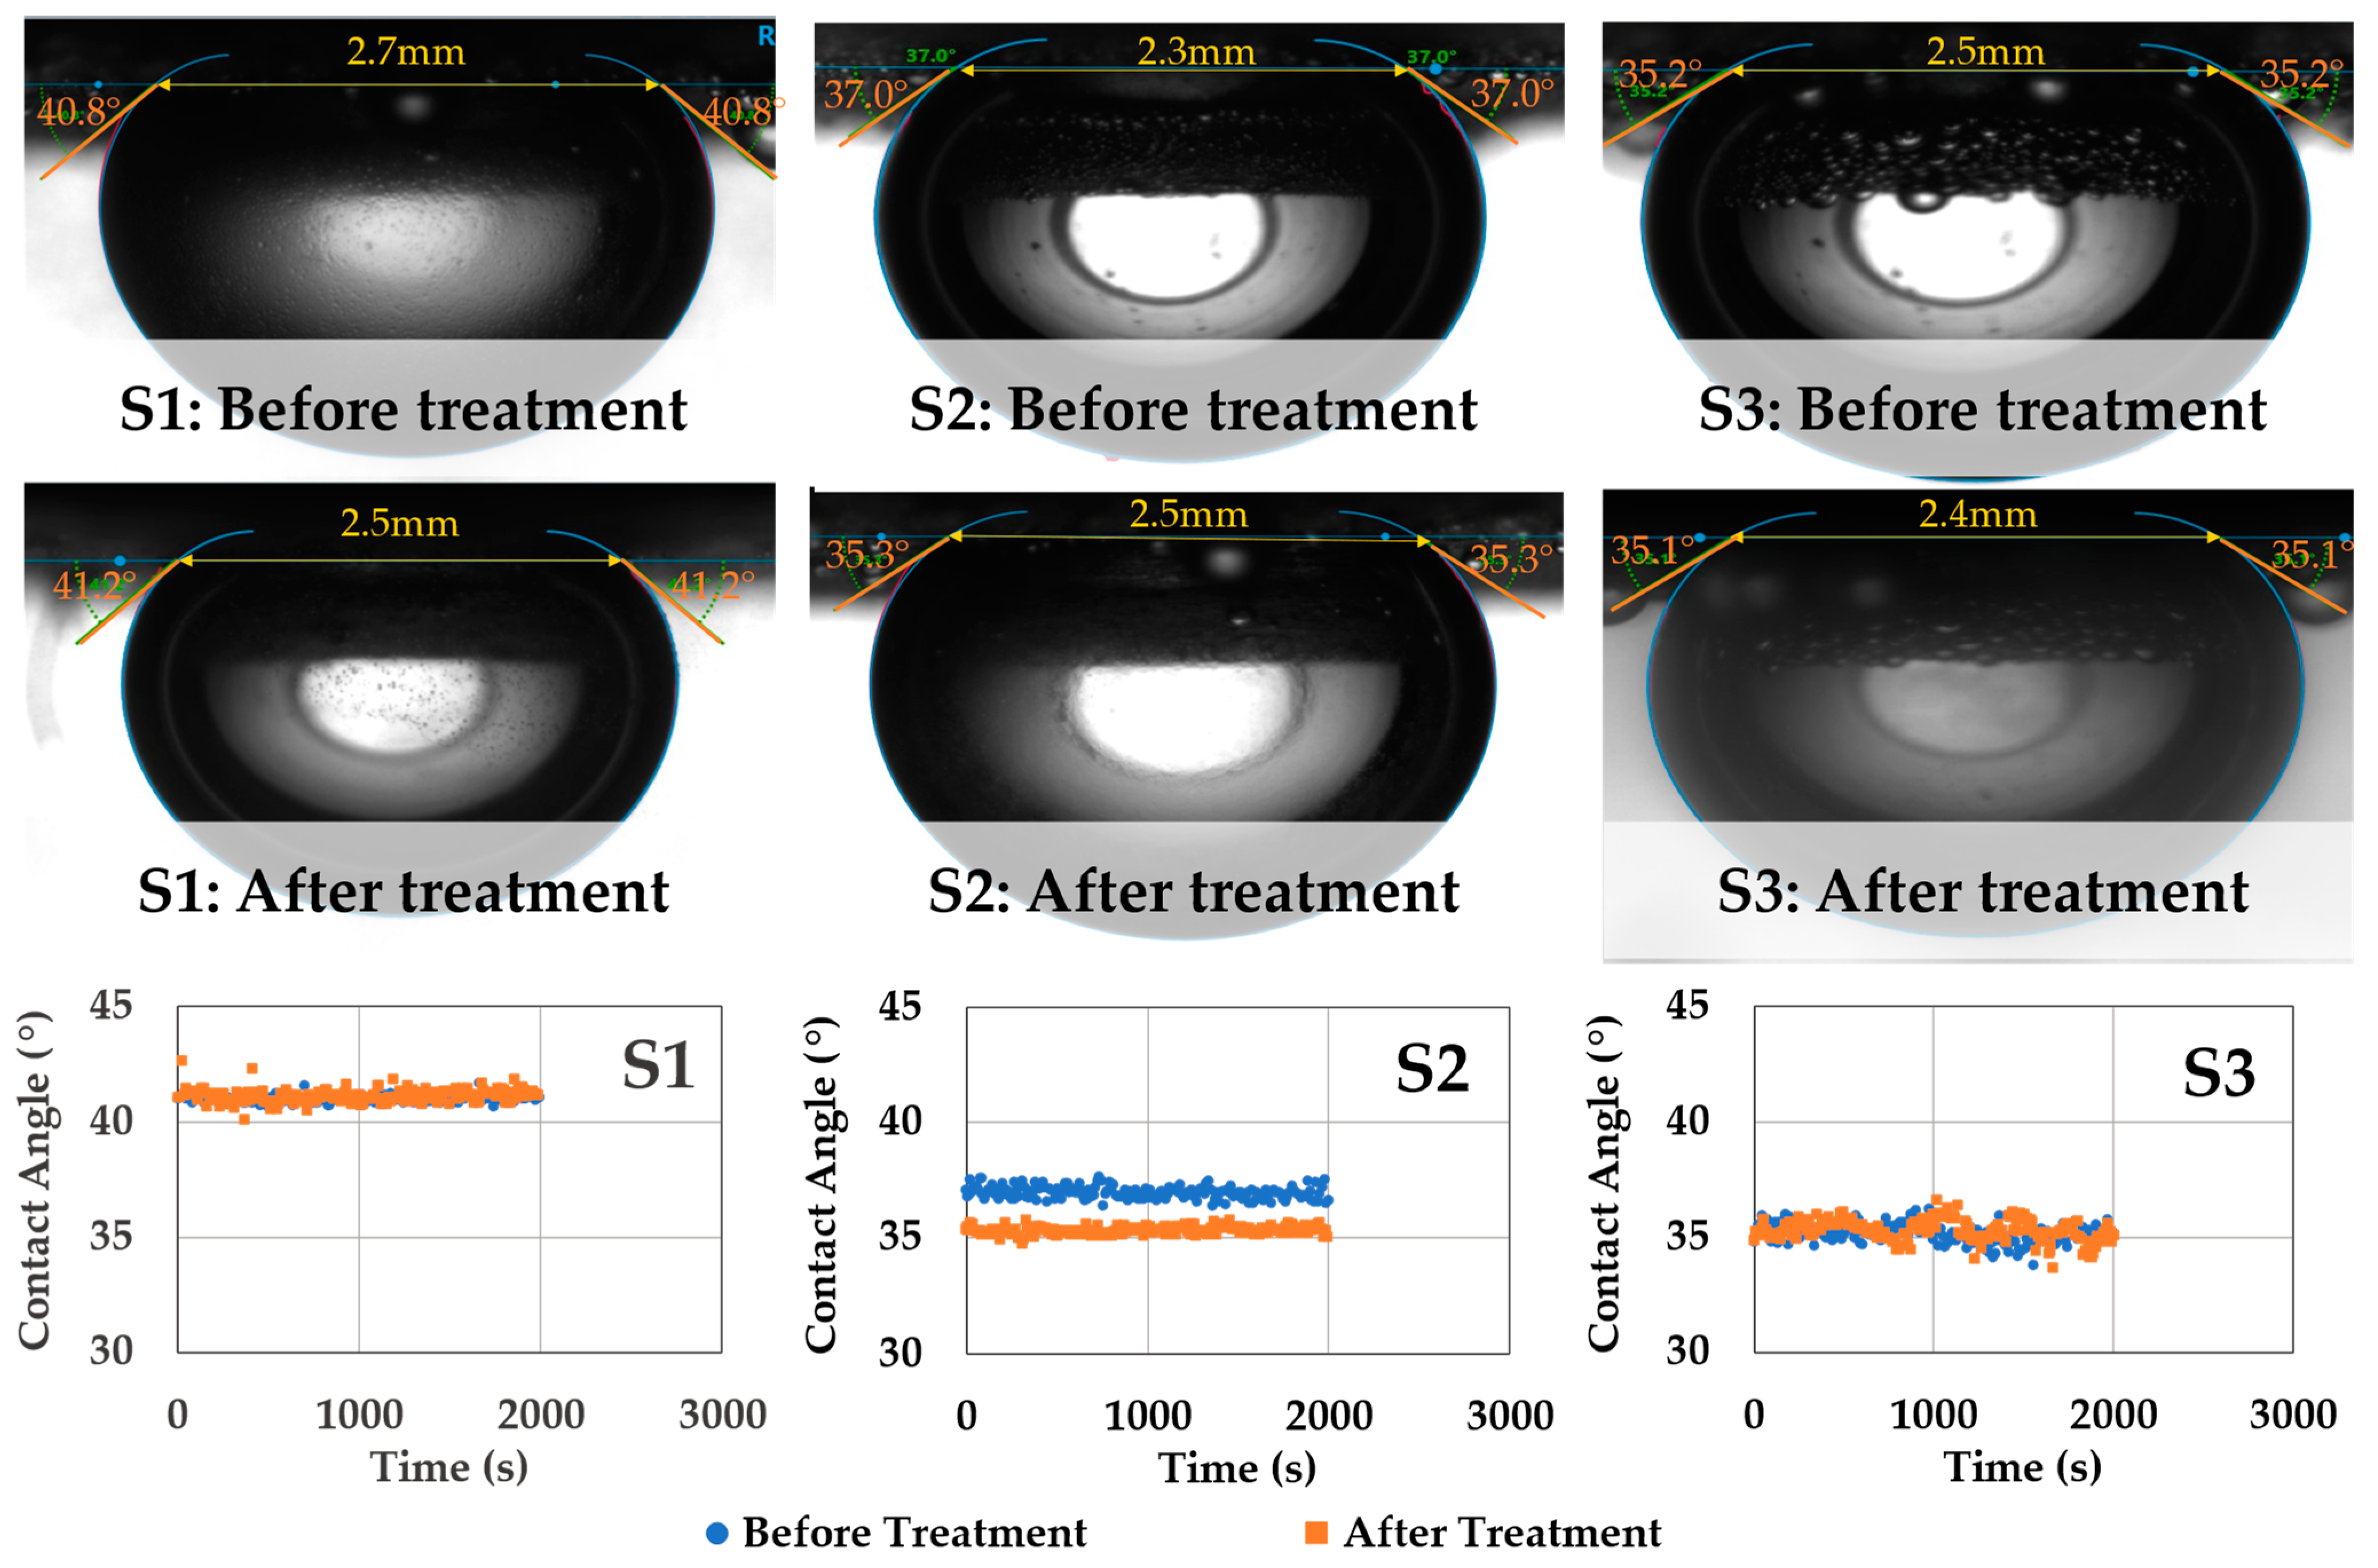
Figure 5 shows the summary of the captive-scCO2 bubble–brine–rock contact angle measurements conducted at the same experimental conditions (20.7 MPa, 65 °C) before and after scCO2-enriched-brine treatment. Before treatment, contact angles of 42 ± 1°, 37 ± 1°, and 35 ± 2° are observed for samples S1, S2, and S3, respectively. These contact angle values are comparable to ones reported in the literature for sandstones, caprock, and source rocks at similar experimental conditions (Figure 1) [49,55,58,66]. It can be observed that these rocks maintain their water-wettability even at larger pressures up to ~20 MPa. After scCO2-enriched brine treatment, negligible changes in contact angles are observed, despite the surface reactivity (primarily S3) shown in Figure 3. Trapping of surface bubbles can also be noted on sample S3, which develops during the fluid-equilibration phase and indicates that in-situ reactions could be taking place as the brine becomes saturated in scCO2.
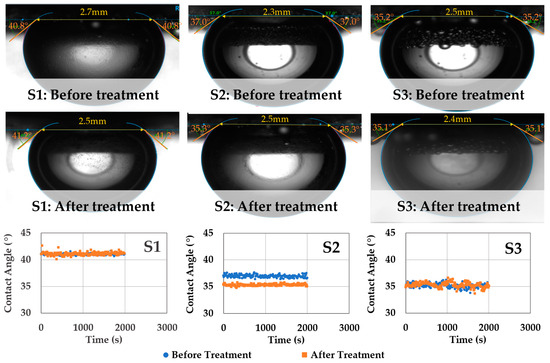
Figure 5.
Summary of the scCO2–brine–rock captive-bubble contact angle measurements before and after scCO2 enriched brine treatment. The equilibrated contact angles remain unaltered despite surface alteration (primarily S3). The samples maintain their water-wettability even at elevated pressure (~20 MPa) and temperature (65 °C) conditions and after geochemical reactivity.
3.3. Pore Size Distribution
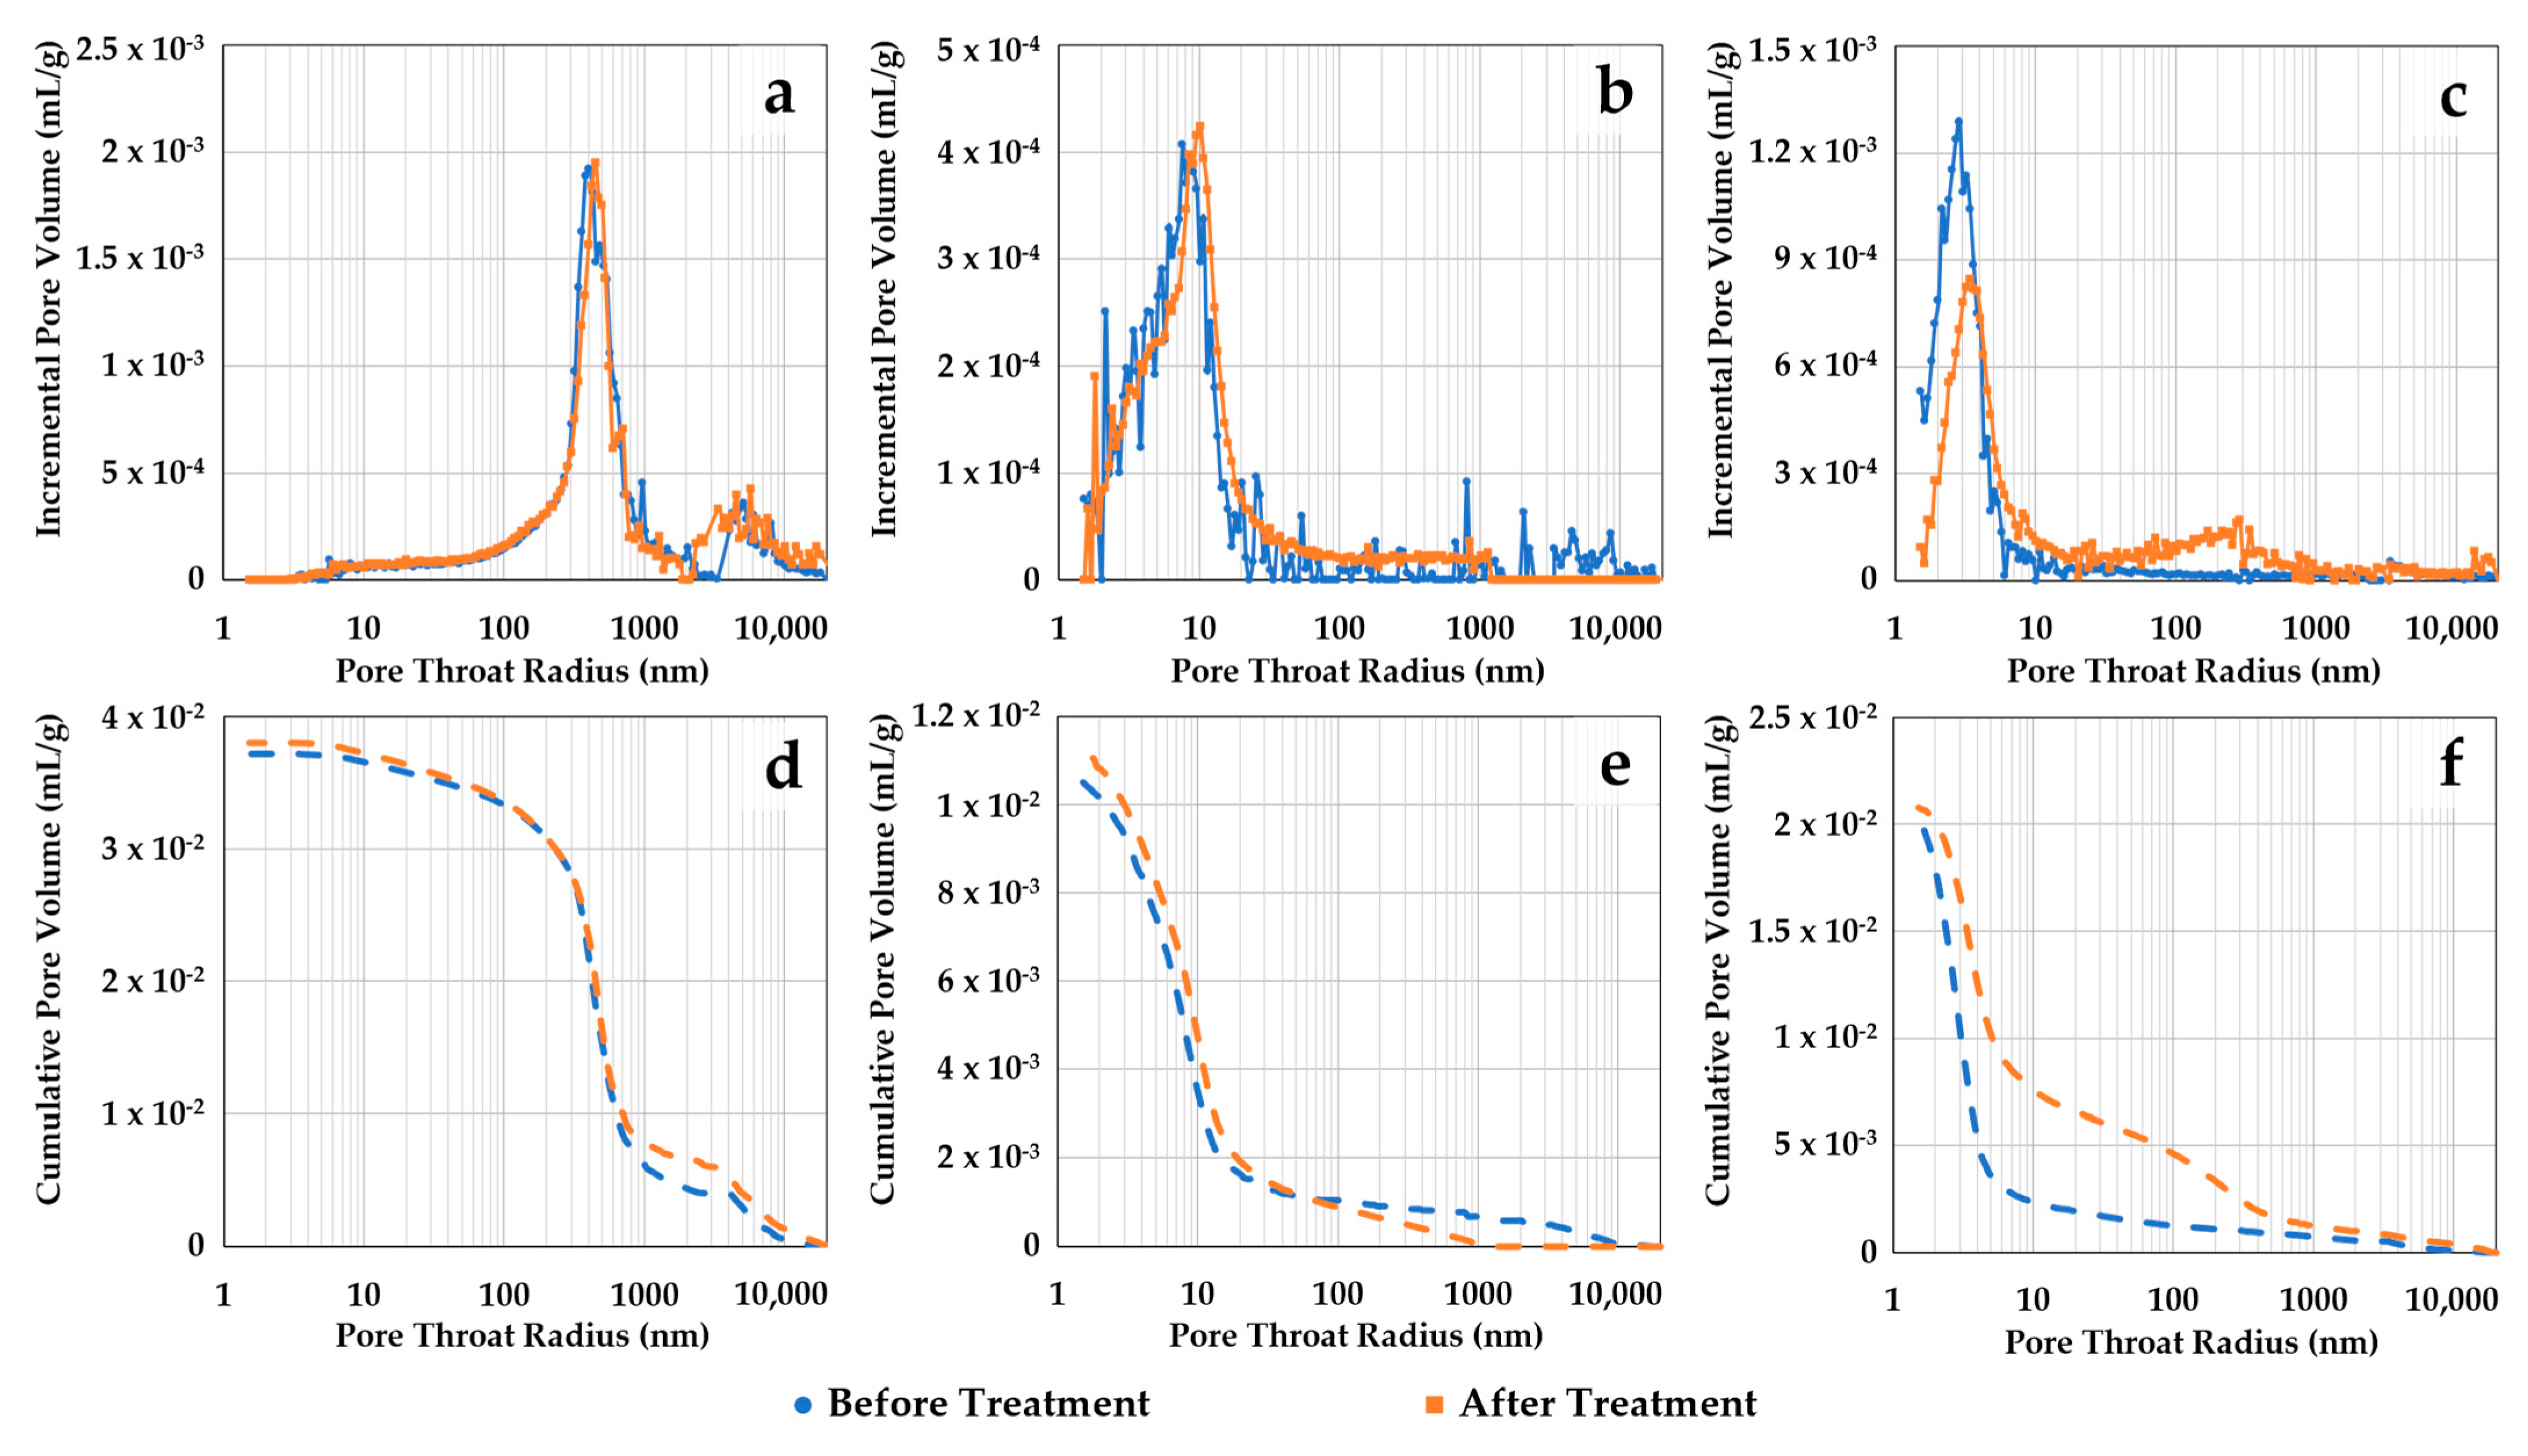
Pore size distribution alterations of the thin disk samples were assessed before and after scCO2-enriched brine treatment with three different techniques. Figure 6 shows MICP incremental and cumulative pore throat size distributions (PTSDs) of the samples before and after treatment. Figure 6a–c represent the incremental curves for samples S1, S2, and S3, respectively. Their cumulative curves are sequentially shown in Figure 6d–f. The PTSD for sample S1 (storage zone) indicates initial intrusion in the 2–10 µm pore throat size range followed by a main peak between 200 and 600 nm. Conversely, the main peaks for the confining zone samples S2 and S3 are considerably lower, at around 6–10 nm and 2–4 nm, respectively. After treatment, little alteration is observed in the PTSD of samples S1 and S2. Sample S3 indicates minor changes, aside from a slight increase in amplitude in the pore range of 100–1000 nm, followed by a drop in the main peak at 1–10 nm.
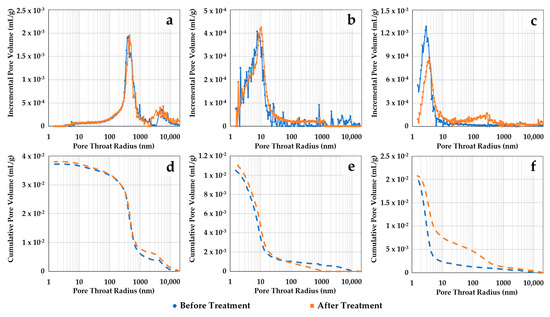
Figure 6.
Pore throat size distributions (PTSDs) obtained with MICP before and after scCO2-enriched brine treatment. The incremental curves for samples S1, S2, and S3 are shown in (a–c), respectively. Their cumulative curves are sequentially represented in (d–f). Little alteration is observed in the PTSD of the samples, aside from a small increase in amplitude in the 100–1000 nm range for sample S3 followed by a drop in the 1–10 nm range.
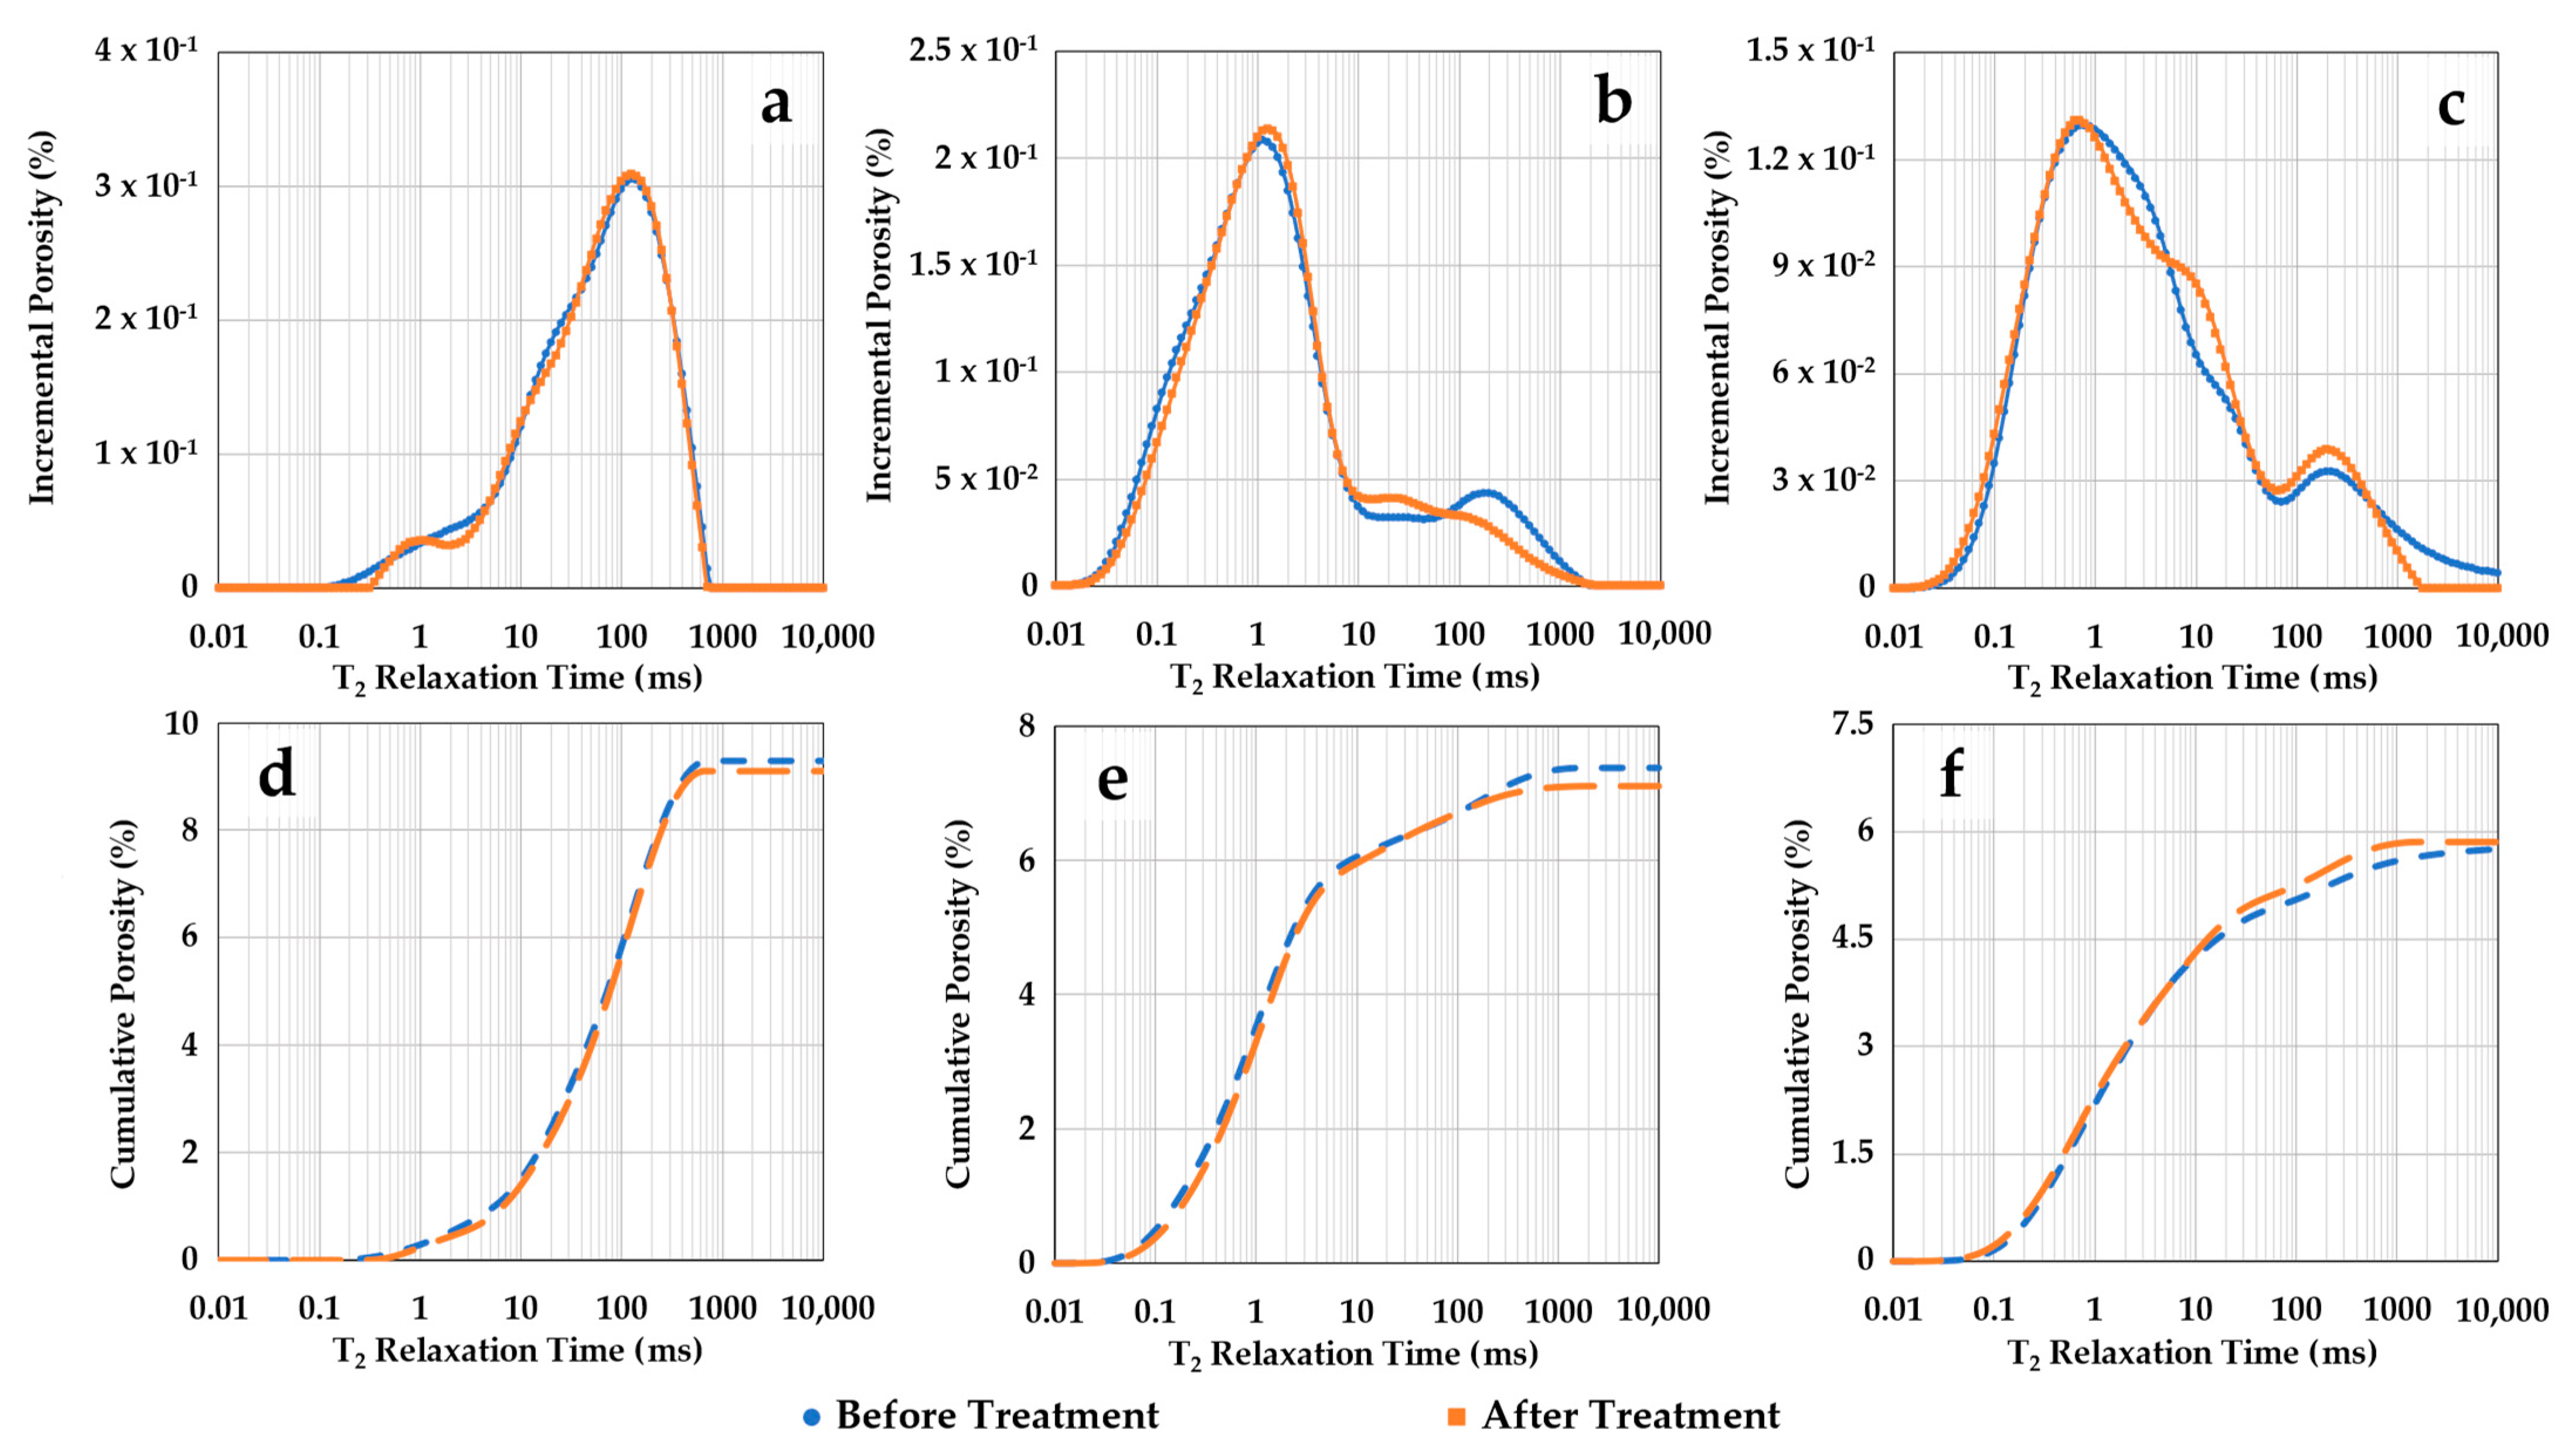
Figure 7 shows NMR T2 porosity distributions of the three samples before and after scCO2-enriched-brine treatment. Figure 7a–c represent the incremental curves for samples S1, S2, and S3, respectively. Their cumulative curves are sequentially shown in Figure 7d–f. Before treatment, sample S1 (storage zone) shows a main peak around 100 ms T2 relaxation, while the main peaks for the confining samples S2 and S3 are in shorter T2 times of ~1.1 ms and 0.8 ms, respectively. For the confining zone samples, the second small peak above 100 ms represents brine trapped in the surface irregularities of the samples. Nevertheless, the porosity distributions obtained with NMR indicate no significant alteration in the three samples after treatment. Sample S3 exhibits a small inflection in the spectrum after treatment around 1–20 ms, which does not impact the cumulative porosity within this range.
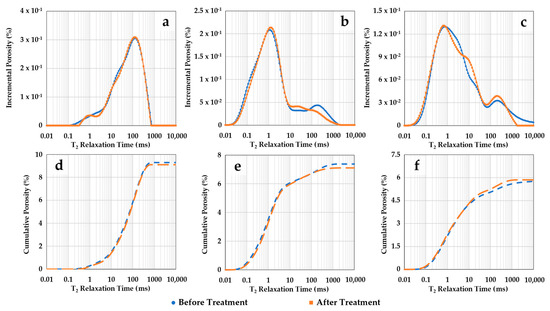
Figure 7.
NMR porosities as function of T2 relaxation time before and after scCO2-enriched brine treatment. The incremental curves for samples S1, S2, and S3 are shown in (a–c), respectively. Their cumulative curves are sequentially represented in (d–f). Negligible alteration in the NMR porosity distributions is observed, aside from a small inflection around 1–20 ms for sample S3, which does not affect its cumulative porosity.
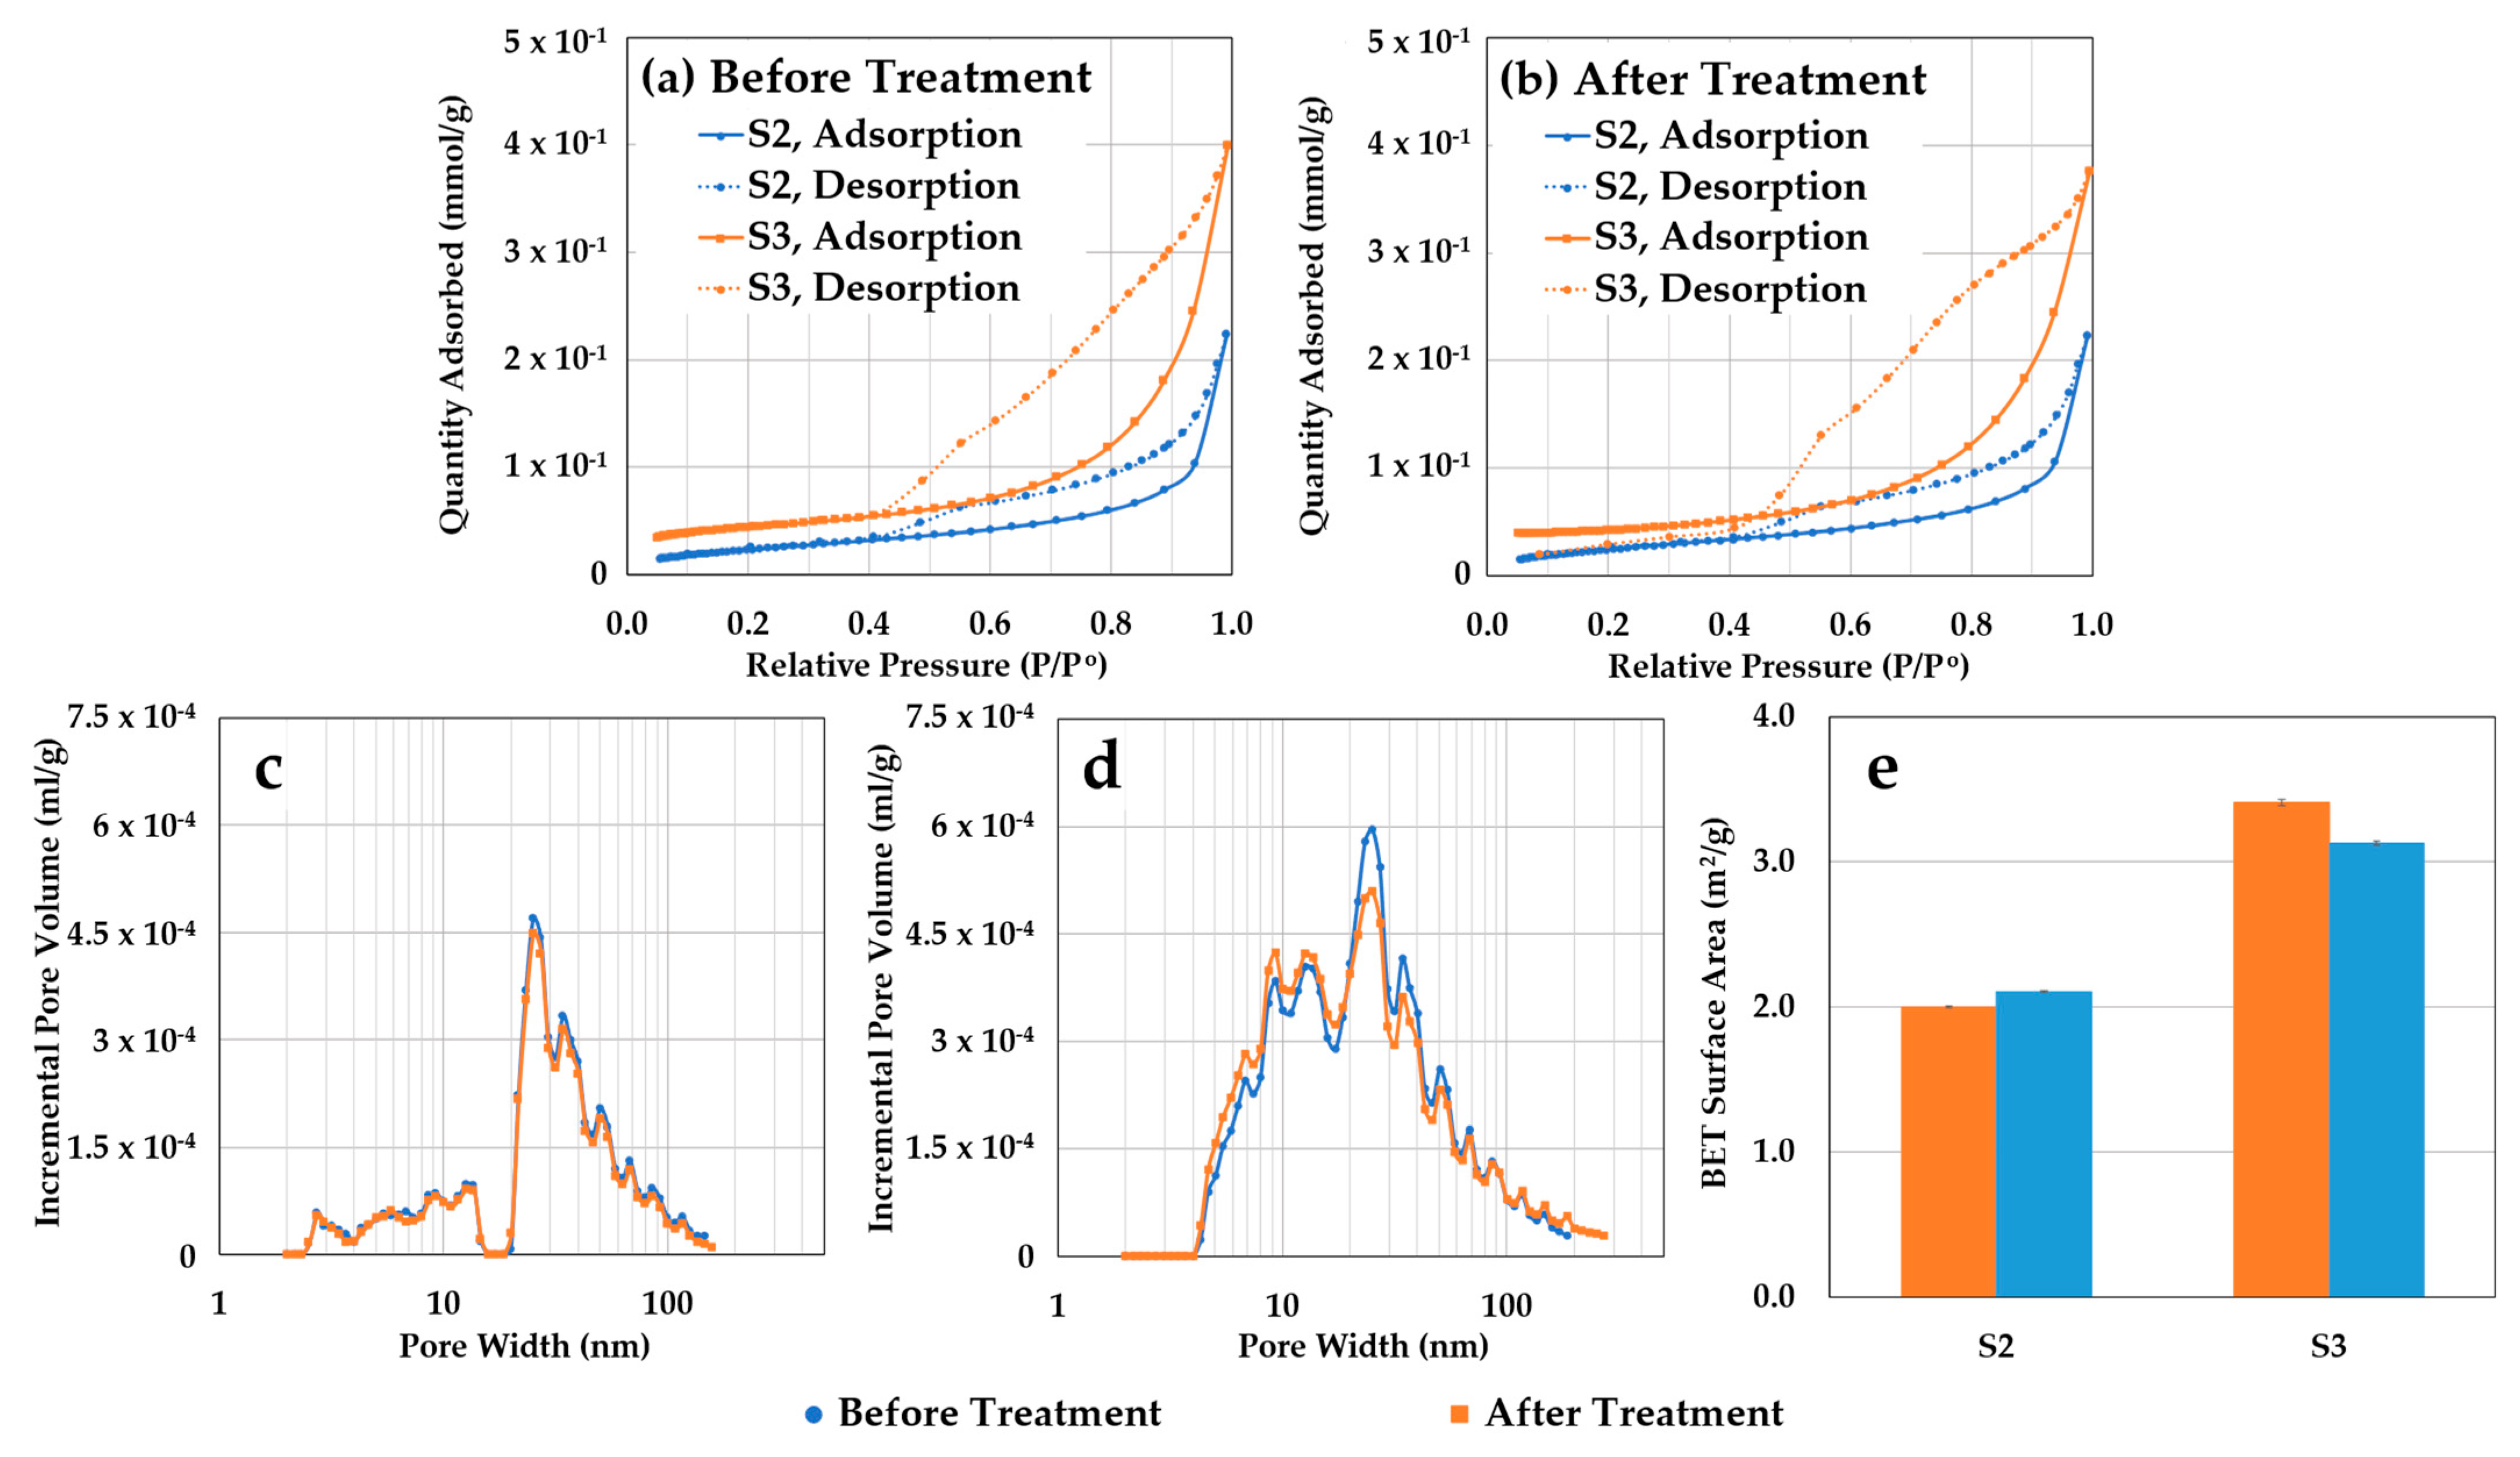
Figure 8 displays N2 adsorption and desorption isotherms for confining zone samples S2 and S3 before (Figure 8a) and after (Figure 8b) scCO2-enriched-brine treatment. These curves, along with hysteresis loop analysis, yield insights into pore structure and connectivity in tight porous media, such as shales [108,109,110]. Before treatment, both samples exhibited type IV isotherm characteristics with a distinctive hysteresis loop, indicating capillary condensation in meso/macro-pores [111]. There is no limiting uptake at high relative pressures (p/p0), indicating an H3 hysteresis loop with slit-shaped pores forming plate-like structures [112]. A wider hysteresis loop for sample S3 is also observed, suggesting a more complex pore network. After treatment, isotherm shapes indicate minimal changes in adsorption behavior. PSDs were extracted using the density functional theory (DFT) with a slit-shaped model. Incremental pore volume curves of S2 (Figure 8c) and S3 (Figure 8d) show a main peak in the mesopore region (20–40 nm) and broader distribution for S3, with a larger fine-mesopore volume (2–20 nm) than S2. The increase in fine mesopores for S3 results in a larger BET surface area (Figure 8e). After treatment, no significant alterations in PSD or BET surface areas are observed. Sample S3 exhibits a slight decrease in mesopore volume followed by a minor increase in the fine-mesopore range, resulting in a slight decrease in surface area, but these differences are small and do not significantly impact cumulative pore volumes in the nanopore range.
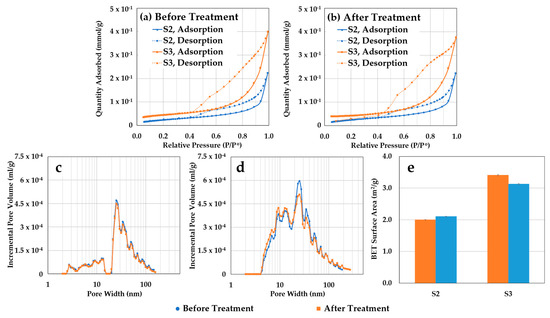
Figure 8.
Isothermal N2 adsorption results for the confining zone samples S2 and S3 before and after scCO2-enriched brine treatment. (a) Before treatment, both samples exhibit type IV isotherms with distinctive hysteresis loops and larger adsorption for sample S3. (b) After treatment, isotherm shapes remain stable, indicating minimal changes in adsorption behavior. (c) Incremental pore volume curves for S2 show a main peak in the mesopore region (20–40 nm) and constant PSD after treatment. (d) Incremental pore volume curves for S3 reveal a broader distribution, with a larger fine mesopore volume (2–20 nm) compared to S2, and slight alteration in PSD. (e) The increase in fine mesopores for S3 results in a larger BET surface area and slight alteration after treatment.
4. Discussion
Geochemical reactions arising from the dissolution of scCO2 in brine have been experimentally proven to impact the microstructure of storage zones [89,90,91] and confining zones [60,69,73,92,93,94,95,96,97,98] even at short treatment times of typically few weeks. The impact on storage zones is commonly observed by dynamic injection flooding of scCO2-enriched brine in limestone core samples. Significant dissolution (wormholes) has been reported on the inlet of the core plugs, followed by a small amount of precipitation in the far region. Although dynamic tests are important to evaluate geochemical effects in high flow regions (i.e., around injection wells), the extent of reactivity is prolonged because “fresh” reactant species (e.g., H+) are continuously fed in open flow systems. On the other hand, geochemical alteration of confining zones is generally assessed by static scCO2 treatments in closed systems conducted on crushed (micrometer size) samples. Significant geochemical reactivity has been reported by preferential dissolution (and precipitation) of carbonate minerals, which impact pore size distributions. However, the ultra-low transport properties of nanoporous confining zones imply concentration profiles of reactant species (e.g., H+) across the samples [113,114]. Such concentration profiles favor surface reactivity and augment reactions on crushed samples due to their higher specific surface areas as compared to core plugs. In addition, the brine/rock volume ratio and brine composition selected in experiments can also impact reactivity [94,95,99]. When a large brine/rock volume ratio or calcium-depleted brines are used in closed systems, a higher Ca2+ uptake from calcite dissolution is needed before the reaction ceases (pH~4.5–5). Nonetheless, reactive transport studies show that geochemical reactions driven by diffusion in nanoporous confining zones are expected to impact properties on the scale of hundreds to thousands of years [80]. A strategy to overcome long experimental times is the combination of quantitative tools that can simultaneously resolve such alterations at the surface level up to the nanometer, micrometer, and millimeter depth of invasion.
Here, the impact of geochemical reactions is quantified by both surface characterization and three different PSD measurements conducted on thin disk samples. SEM/EDS images reveal surface dissolution of calcite grains after treatment, while other potentially reactive minerals remain unaltered (e.g., dolomite, clays, pyrite). Although surface reactivity occurred, little alteration is seen on the PSDs obtained with MICP, NMR, and N2 adsorption after treatment. Minor changes were consistently observed in sample S3: MICP indicated a small amplitude increase in the 100–1000 nm range, followed by an amplitude drop in the main peak at 1–10 nm; the NMR T2 spectrum exhibited a small inflection around 1–20 ms; and N2 adsorption showed a slight increase in the main peak at 20–40 nm followed by small reduction at fine mesopores (1–20 nm). Combined with SEM/EDS data, it is understood that the small changes in PSD of sample S3 could be indicative of the surface dissolution of calcite. Potential precipitation below the surface that can cause a reduction in micropore volume is possible due to a local increase in the concentration of Ca2+ driven by surface dissolution (Equation (6)). Based on this study’s experimental conditions, the geochemical reactivity on the confining zone samples preferentially occurs at the surface and does not impact pore size distributions or porosities at a core scale.
The alteration in surface mineralogy by calcite dissolution could change surface hydrophilicity and impact the wettability and hence the trapping mechanisms in the scCO2–brine–rock system. However, the fluid-equilibrated scCO2–brine–rock contact angles (θ) reported here are little influenced by the reactivity occurring at the surface. The rocks studied here maintain their water-wettability at high-pressure conditions (~20 MPa) and even after moderate or strong surface reactivity. Calcite dissolution in the forms of etching and pitting could locally increase the surface roughness (Figure 3f), which has been found to decrease θ in hydrophilic surfaces of pure minerals (e.g., quartz, calcite) [51,56]. In fine-grained heterogeneous surfaces such as confining zones, the large difference in scale between the static scCO2 bubble (millimeter size) and grain size (micrometer to nanometer) accounts for small roughness changes due to dissolution that could impact the contact angle. It is also found that using NMR to assess wettability alteration due to dissolution in nanoporous media [115,116] is experimentally challenging because the geochemical reactivity shown here does not appear to influence the surface relaxivity of the bulk rock (Figure 8).
The microscopic displacement efficiency and primary trapping mechanisms during scCO2 storage are tied to capillary properties including interfacial tension (IFT), wettability, and pore size. Miller, et al. [99] showed that the aqueous geochemistry of high-concentration analytes that could impact the IFT remains fairly constant during scCO2 treatment. Therefore, changes in brine ionic concentration due to dissolution or precipitation of species are not expected to alter the scCO2–brine–rock IFT. Regarding wettability, this work demonstrated that contact angles are barely affected by induced geochemical reactions in scCO2–brine–rock systems. With the contact angles reported here and knowledge of the scCO2–brine IFT at subsurface conditions, Hg–air capillary pressure measurements can be converted to subsurface scCO2–brine conditions:
assuming a scCO2–brine IFT for this work experimental conditions of 27 mN/m [23], θ of the sample S3 (35°), Hg–air θ of 130°, and surface tension of 485 mN/m (laboratory conditions). Equation (8) indicates that the scCO2–brine capillary pressure (Pc) at subsurface conditions for the confining zone S3 is about ~14 times smaller than laboratory Hg–air Pc.
During the short-term experiments, the predominant geochemical reactions were directed toward altering carbonate minerals, leaving the capillary properties of the quartz-rich sandstone largely unaffected within the experimental duration. The sandstone exhibited minimal reactivity, which aligns with findings in similar studies conducted over comparable timeframes and under analogous experimental conditions [91,117,118,119,120]. It is conceivable that extended treatment periods (0.5–1.5 years) might reveal some level of reactivity with quartz [69,104], although this is less likely to substantially influence surface wettability, as suggested by the consistently unaltered contact angles reported in this study.
Conversely, the main implication of such reactions for the capillary displacement of the confining zone appears to be an increase in pore size at the surface due to calcite dissolution followed by possible precipitation. The preferential reactivity of confining zones toward carbonate minerals agrees with literature experiments on crushed samples conducted in similar timescales [92,94,95,98,99]. Although these experiments also reported alterations in pore size distributions (PSDs) of crushed samples, we observed that the PSDs of intact samples obtained with three different methods remained unaltered. It is understood that the propagation of the geochemical reactions is controlled not only by mineralogy but experimental conditions (dynamic vs static exposure, water/rock brine ratio) as well as surface area and matrix transport properties. Therefore, short-term geochemical reactions do not seem to significantly impact the capillary displacement in quartz-rich storage reservoirs or primary capillary trapping mechanisms in either siltstone or mudstone confining zones in the condition studied.
5. Conclusions
In this experimental study, sandstone (storage zone), clay-rich siltstone, and carbonate-rich mudstone (confining zones) thin disk samples were treated under a scCO2-enriched brine condition (10:1 brine/rock volume ratio) for 21 days at 20.7 MPa and 65 °C using a 2.5 wt.% KCl brine solution. Before and after treatment, geochemical alterations were assessed at the surface level using scanning electron microscopy (SEM) coupled with energy-dispersive X-ray spectroscopy (EDS) and X-ray fluorescence (XRF). Fluid-equilibrated scCO2–brine–rock contact angle measurements were conducted to monitor wettability changes using the captive-bubble method. Pore size alterations were determined using mercury injection capillary pressure (MICP), nuclear magnetic resonance (NMR), and isothermal N2 adsorption. The main conclusions of this work are as follows:
- Carbonate minerals preferentially react at the surface level in the form of calcite dissolution, while other potentially reactive minerals such as feldspars, clays, dolomite, and pyrite remain preserved. A reduction in the relative content of calcium oxide (CaO) from 55 wt.% to 14 wt.% is observed at the surface.
- Before treatment, fluid-equilibrated scCO2–brine–rock contact angles are comparable with the literature values for storage and confining zones. Contact angles of 42 ± 1°, 37 ± 1°, and 35 ± 2° were determined for sandstone, siltstone, and mudstone, respectively. After treatment, negligible alteration in the contact angles is observed, despite surface dissolution in the forms of etching and pitting for the carbonate-rich mudstone (S3). The rocks studied here maintain their water-wettability after geochemical reactivity and at elevated pressures (~20 MPa).
- Although reactions are observed at the surface, the pore size distributions (PSDs) of the thin disk samples obtained with three different methods (MICP, NMR, and N2 adsorption) show little alteration. Minor changes are consistently observed for the carbonate-rich mudstone (S3). Coupled with SEM/EDS images, these changes could be indicative of surface dissolution of calcite followed by possible precipitation. Overall, the short-term geochemical reactions observed here did not significantly impact the cumulative porosities or PSD of the three samples.
Our research demonstrates that short-term geochemical reactions do not substantially impact the capillary displacement mechanism in the studied quartz-rich sandstone storage reservoirs and siltstone/mudstone confining zones. These findings contribute valuable insights into the behavior of scCO2–brine–rock systems and highlight the preservation of rock properties under the conditions examined.
Author Contributions
Conceptualization, F.C.; Methodology, F.C.; Validation, F.C. and S.D.; Formal analysis, F.C.; Investigation, F.C.; Resources, S.D. and M.C.; Data curation, F.C.; Writing—original draft, F.C.; Writing—review & editing, S.D., M.C. and C.R.; Visualization, F.C.; Supervision, S.D.; Project administration, C.R.; Funding acquisition, F.C. All authors have read and agreed to the published version of the manuscript.
Funding
Financial support for publication was provided by the University of Oklahoma Libraries’ Open Access Fund.
Data Availability Statement
The data will be made available on specific user request.
Acknowledgments
We would like to thank the experimental efforts of Micaela Langevin, Gary Stowe, Sidi Mamoudou, Abdelali Guezei, Quan Nguyen, and Abdullah Al Raisi. Integrated Core Characterization Center (IC3) contribution (#198).
Conflicts of Interest
The authors declare no conflict of interest.
References
- Davis, S.J.; Lewis, N.S.; Shaner, M.; Aggarwal, S.; Arent, D.; Azevedo, I.L.; Benson, S.M.; Bradley, T.; Brouwer, J.; Chiang, Y.-M.; et al. Net-zero emissions energy systems. Science 2018, 360, eaas9793. [Google Scholar] [CrossRef] [PubMed]
- Zhao, H. Phase Equilibria in CO2-Brine System for CO2 Storage; ProQuest Dissertations Publishing: Ann Arbor, MI, USA, 2014. [Google Scholar]
- Heinemann, N.; Wilkinson, M.; Pickup, G.E.; Haszeldine, R.S.; Cutler, N.A. CO2 storage in the offshore UK Bunter Sandstone Formation. Int. J. Greenh. Gas Control 2012, 6, 210–219. [Google Scholar] [CrossRef]
- Medici, G.; West, L.J. Reply to discussion on ‘Review of groundwater flow and contaminant transport modelling approaches for the Sherwood Sandstone aquifer, UK insights from analogous successions worldwide’ by Medici and West (QJEGH, 55, qjegh2021-176). Q. J. Eng. Geol. Hydrogeol. 2023, 56, qjegh2022-097. [Google Scholar] [CrossRef]
- Zhang, C.P.; Ranjith, P.G.; Perera, M.S.A.; Zhao, J.; Zhang, D.; Wanniarachchi, W.A.M. A novel approach to precise evaluation of carbon dioxide flow behaviour in siltstone under tri-axial drained conditions. J. Nat. Gas Sci. Eng. 2016, 34, 331–340. [Google Scholar] [CrossRef]
- Jayasekara, D.W.; Ranjith, P.G.; Wanniarachchi, W.A.M.; Rathnaweera, T.D.; Chaudhuri, A. Effect of salinity on supercritical CO2 permeability of caprock in deep saline aquifers: An experimental study. Energy 2020, 191, 116486. [Google Scholar] [CrossRef]
- Lima, V.d.; Einloft, S.; Ketzer, J.M.; Jullien, M.; Bildstein, O.; Petronin, J.-C. CO2 Geological storage in saline aquifers: Paraná Basin caprock and reservoir chemical reactivity. Energy Procedia 2011, 4, 5377–5384. [Google Scholar] [CrossRef]
- Shi, J.-Q.; Sinayuc, C.; Durucan, S.; Korre, A. Assessment of carbon dioxide plume behaviour within the storage reservoir and the lower caprock around the KB-502 injection well at In Salah. Int. J. Greenh. Gas Control 2012, 7, 115–126. [Google Scholar] [CrossRef]
- Zhang, K.; Sang, S.; Zhou, X.; Liu, C.; Ma, M.; Niu, Q. Influence of supercritical CO2-H2O-caprock interactions on the sealing capability of deep coal seam caprocks related to CO2 geological storage: A case study of the silty mudstone caprock of coal seam no. 3 in the Qinshui Basin, China. Int. J. Greenh. Gas Control 2021, 106, 103282. [Google Scholar] [CrossRef]
- Lu, J.; Wilkinson, M.; Haszeldine, R.S.; Fallick, A.E. Long-term performance of a mudrock seal in natural CO2 storage. Geology 2009, 37, 35–38. [Google Scholar] [CrossRef]
- Lake, L.W. Enhanced Oil Recovery; Prentice Hall: Saddle River, NJ, USA, 1989. [Google Scholar]
- Bachu, S.; Bonijoly, D.; Bradshaw, J.; Burruss, R.; Holloway, S.; Christensen, N.P.; Mathiassen, O.M. CO2 storage capacity estimation: Methodology and gaps. Int. J. Greenh. Gas Control 2007, 1, 430–443. [Google Scholar] [CrossRef]
- Bachu, S. Review of CO2 storage efficiency in deep saline aquifers. Int. J. Greenh. Gas Control 2015, 40, 188–202. [Google Scholar] [CrossRef]
- Al Hameli, F.; Belhaj, H.; Al Dhuhoori, M. CO2 Sequestration Overview in Geological Formations: Trapping Mechanisms Matrix Assessment. Energies 2022, 15, 7805. [Google Scholar] [CrossRef]
- Ajayi, T.; Gomes, J.S.; Bera, A. A review of CO2 storage in geological formations emphasizing modeling, monitoring and capacity estimation approaches. Pet. Sci. 2019, 16, 1028–1063. [Google Scholar] [CrossRef]
- Kaszuba, J.; Yardley, B.; Andreani, M. Experimental perspectives of mineral dissolution and precipitation due to carbon dioxide-water-rock interactions. Rev. Mineral. Geochem. 2013, 77, 153–188. [Google Scholar] [CrossRef]
- Song, J.; Zhang, D. Comprehensive Review of Caprock-Sealing Mechanisms for Geologic Carbon Sequestration. Environ. Sci. Technol. 2013, 47, 9–22. [Google Scholar] [CrossRef] [PubMed]
- Abidoye, L.K.; Khudaida, K.J.; Das, D.B. Geological Carbon Sequestration in the Context of Two-Phase Flow in Porous Media: A Review. Crit. Rev. Environ. Sci. Technol. 2015, 45, 1105–1147. [Google Scholar] [CrossRef]
- Cai, J.; Jin, T.; Kou, J.; Zou, S.; Xiao, J.; Meng, Q. Lucas–Washburn Equation-Based Modeling of Capillary-Driven Flow in Porous Systems. Langmuir 2021, 37, 1623–1636. [Google Scholar] [CrossRef]
- Behroozi, F. A Fresh Look at the Young-Laplace Equation and Its Many Applications in Hydrostatics. Phys. Teach. 2022, 60, 358–361. [Google Scholar] [CrossRef]
- Chiquet, P.; Daridon, J.-L.; Broseta, D.; Thibeau, S. CO2/water interfacial tensions under pressure and temperature conditions of CO2 geological storage. Energy Convers. Manag. 2007, 48, 736–744. [Google Scholar] [CrossRef]
- Van der Meer, L.G.H.; Hofstee, C.; Orlic, B. The fluid flow consequences of CO2 migration from 1000 to 600 metres upon passing the critical conditions of CO2. Energy Procedia 2009, 1, 3213–3220. [Google Scholar] [CrossRef]
- Chalbaud, C.; Robin, M.; Lombard, J.M.; Martin, F.; Egermann, P.; Bertin, H. Interfacial tension measurements and wettability evaluation for geological CO2 storage. Adv. Water Resour. 2009, 32, 98–109. [Google Scholar] [CrossRef]
- Bikkina, P.K.; Shoham, O.; Uppaluri, R. Equilibrated Interfacial Tension Data of the CO2–Water System at High Pressures and Moderate Temperatures. J. Chem. Eng. Data 2011, 56, 3725–3733. [Google Scholar] [CrossRef]
- Li, X.; Boek, E.; Maitland, G.C.; Trusler, J.P.M. Interfacial Tension of (Brines + CO2): (0.864 NaCl + 0.136 KCl) at Temperatures between (298 and 448) K, Pressures between (2 and 50) MPa, and Total Molalities of (1 to 5) mol·kg−1. J. Chem. Eng. Data 2012, 57, 1078–1088. [Google Scholar] [CrossRef]
- Pereira, L.M.C.; Chapoy, A.; Burgass, R.; Oliveira, M.B.; Coutinho, J.A.P.; Tohidi, B. Study of the impact of high temperatures and pressures on the equilibrium densities and interfacial tension of the carbon dioxide/water system. J. Chem. Thermodyn. 2016, 93, 404–415. [Google Scholar] [CrossRef]
- Hebach, A.; Oberhof, A.; Dahmen, N.; Kögel, A.; Ederer, H.; Dinjus, E. Interfacial Tension at Elevated PressuresMeasurements and Correlations in the Water + Carbon Dioxide System. J. Chem. Eng. Data 2002, 47, 1540–1546. [Google Scholar] [CrossRef]
- Aggelopoulos, C.A.; Robin, M.; Perfetti, E.; Vizika, O. CO2/CaCl2 solution interfacial tensions under CO2 geological storage conditions: Influence of cation valence on interfacial tension. Adv. Water Resour. 2010, 33, 691–697. [Google Scholar] [CrossRef]
- Aggelopoulos, C.A.; Robin, M.; Vizika, O. Interfacial tension between CO2 and brine (NaCl + CaCl2) at elevated pressures and temperatures: The additive effect of different salts. Adv. Water Resour. 2011, 34, 505–511. [Google Scholar] [CrossRef]
- Bennion, B.; Bachu, S. Relative Permeability Characteristics for Supercritical CO2 Displacing Water in a Variety of Potential Sequestration Zones in the Western Canada Sedimentary Basin. In Proceedings of the SPE Annual Technical Conference and Exhibition, Dallas, TX, USA, 9–12 October 2005. [Google Scholar]
- Chiquet, P.; Broseta, D.; Thibeau, S. Wettability alteration of caprock minerals by carbon dioxide. Geofluids 2007, 7, 112–122. [Google Scholar] [CrossRef]
- Yang, D.; Gu, Y.; Tontiwachwuthikul, P. Wettability Determination of the Reservoir Brine−Reservoir Rock System with Dissolution of CO2 at High Pressures and Elevated Temperatures. Energy Fuels 2008, 22, 504–509. [Google Scholar] [CrossRef]
- Espinoza, D.N.; Santamarina, J.C. Water-CO2-mineral systems: Interfacial tension, contact angle, and diffusion-Implications to CO2 geological storage. Water Resour. Res. 2010, 46. [Google Scholar] [CrossRef]
- Bikkina, P. Contact angle measurements of CO2-water-quartz/calcite systems in the perspective of carbon sequestration. Int. J. Greenh. Gas Control 2011, 5, 1259–1271. [Google Scholar] [CrossRef]
- Mills, J.; Riazi, M.; Sohrabi, M. Wettability of Common Rock-Forming Minerals in a CO2-Brine System at Reservoir Conditions; Society of Core Analysts Fredericton, Canada: Fredericton, NJ, Canada, 2011. [Google Scholar]
- Tonnet, N.; Mouronval, G.; Chiquet, P.; Broseta, D. Petrophysical assessment of a carbonate-rich caprock for CO2 geological storage purposes. Energy Procedia 2011, 4, 5422–5429. [Google Scholar] [CrossRef]
- Broseta, D.; Tonnet, N.; Shah, V. Are rocks still water-wet in the presence of dense CO2 or H2S? Geofluids 2012, 12, 280–294. [Google Scholar] [CrossRef]
- Jung, J.-W.; Jiamin, W.A.N. Supercritical CO2 and Ionic Strength Effects on Wettability of Silica Surfaces: Equilibrium Contact Angle Measurements. Energy Fuels 2012, 26, 6053–6059. [Google Scholar] [CrossRef]
- Kim, Y.; Wan, J.; Kneafsey, T.J.; Tokunaga, T.K. Dewetting of Silica Surfaces upon Reactions with Supercritical CO2 and Brine: Pore-Scale Studies in Micromodels. Environ. Sci. Technol. 2012, 46, 4228–4235. [Google Scholar] [CrossRef]
- Farokhpoor, R.; Bjørkvik, B.J.A.; Lindeberg, E.; Torsæter, O. CO2 Wettability Behavior During CO2 Sequestration in Saline Aquife—An Experimental Study on Minerals Representing Sandstone and Carbonate. Energy Procedia 2013, 37, 5339–5351. [Google Scholar] [CrossRef]
- Saraji, S.; Goual, L.; Piri, M.; Plancher, H. Wettability of Supercritical Carbon Dioxide/Water/Quartz Systems: Simultaneous Measurement of Contact Angle and Interfacial Tension at Reservoir Conditions. Langmuir 2013, 29, 6856–6866. [Google Scholar] [CrossRef] [PubMed]
- Wang, S.; Edwards, I.M.; Clarens, A.F. Wettability Phenomena at the CO2–Brine–Mineral Interface: Implications for Geologic Carbon Sequestration. Environ. Sci. Technol. 2013, 47, 234–241. [Google Scholar] [CrossRef]
- Andrew, M.; Bijeljic, B.; Blunt, M.J. Pore-scale contact angle measurements at reservoir conditions using X-ray microtomography. Adv. Water Resour. 2014, 68, 24–31. [Google Scholar] [CrossRef]
- Iglauer, S.; Salamah, A.; Sarmadivaleh, M.; Liu, K.; Phan, C. Contamination of silica surfaces: Impact on water-CO2-quartz and glass contact angle measurements. Int. J. Greenh. Gas Control 2014, 22, 325–328. [Google Scholar] [CrossRef]
- Kaveh, N.S.; Rudolph, E.S.J.; van Hemert, P.; Rossen, W.R.; Wolf, K.H. Wettability Evaluation of a CO2/Water/Bentheimer Sandstone System: Contact Angle, Dissolution, and Bubble Size. Energy Fuels 2014, 28, 4002–4020. [Google Scholar] [CrossRef]
- Saraji, S.; Piri, M.; Goual, L. The effects of SO2 contamination, brine salinity, pressure, and temperature on dynamic contact angles and interfacial tension of supercritical CO2/brine/quartz systems. Int. J. Greenh. Gas Control 2014, 28, 147–155. [Google Scholar] [CrossRef]
- Al-Yaseri, A.; Sarmadivaleh, M.; Saeedi, A.; Lebedev, M.; Barifcani, A.; Iglauer, S. N2 + CO2 + NaCl brine interfacial tensions and contact angles on quartz at CO2 storage site conditions in the Gippsland basin, Victoria/Australia. J. Pet. Sci. Eng. 2015, 129, 58–62. [Google Scholar] [CrossRef]
- Chaudhary, K.; Guiltinan, E.J.; Cardenas, M.B.; Maisano, J.A.; Ketcham, R.A.; Bennett, P.C. Wettability measurement under high P-T conditions using X-ray imaging with application to the brine-supercritical CO2 system. Geochem. Geophys. Geosystems G3 2015, 16, 2858–2864. [Google Scholar] [CrossRef]
- Iglauer, S.; Al-Yaseri, A.Z.; Rezaee, R.; Lebedev, M. CO2 wettability of caprocks: Implications for structural storage capacity and containment security. Geophys. Res. Lett. 2015, 42, 9279–9284. [Google Scholar] [CrossRef]
- Liu, Y.; Mutailipu, M.; Jiang, L.; Zhao, J.; Song, Y.; Chen, L. Interfacial tension and contact angle measurements for the evaluation of CO2-brine two-phase flow characteristics in porous media. Environ. Prog. Sustain. Energy 2015, 34, 1756–1762. [Google Scholar] [CrossRef]
- Al-Yaseri, A.Z.; Lebedev, M.; Barifcani, A.; Iglauer, S. Receding and advancing (CO2 + brine + quartz) contact angles as a function of pressure, temperature, surface roughness, salt type and salinity. J. Chem. Thermodyn. 2016, 93, 416–423. [Google Scholar] [CrossRef]
- Lv, P.; Liu, Y.; Jiang, L.; Song, Y.; Wu, B.; Zhao, J.; Zhang, Y. Experimental determination of wettability and heterogeneity effect on CO2 distribution in porous media. Greenh. Gases Sci. Technol. 2016, 6, 401–415. [Google Scholar] [CrossRef]
- Roshan, H.; Al-Yaseri, A.Z.; Sarmadivaleh, M.; Iglauer, S. On wettability of shale rocks. J. Colloid. Interface Sci. 2016, 475, 104–111. [Google Scholar] [CrossRef]
- Shojai Kaveh, N.; Barnhoorn, A.; Wolf, K.H. Wettability evaluation of silty shale caprocks for CO2 storage. Int. J. Greenh. Gas Control 2016, 49, 425–435. [Google Scholar] [CrossRef]
- Al-Yaseri, A.Z.; Roshan, H.; Zhang, Y.; Rahman, T.; Lebedev, M.; Barifcani, A.; Iglauer, S. Effect of the Temperature on CO2/Brine/Dolomite Wettability: Hydrophilic versus Hydrophobic Surfaces. Energy Fuels 2017, 31, 6329–6333. [Google Scholar] [CrossRef]
- Arif, M.; Lebedev, M.; Barifcani, A.; Iglauer, S. CO2 storage in carbonates: Wettability of calcite. Int. J. Greenh. Gas Control 2017, 62, 113–121. [Google Scholar] [CrossRef]
- Botto, J.; Fuchs, S.J.; Fouke, B.W.; Clarens, A.F.; Freiburg, J.T.; Berger, P.M.; Werth, C.J. Effects of Mineral Surface Properties on Supercritical CO2 Wettability in a Siliciclastic Reservoir. Energy Fuels 2017, 31, 5275–5285. [Google Scholar] [CrossRef]
- Guiltinan, E.J.; Cardenas, M.B.; Bennett, P.C.; Zhang, T.; Espinoza, D.N. The effect of organic matter and thermal maturity on the wettability of supercritical CO2 on organic shales. Int. J. Greenh. Gas Control 2017, 65, 15–22. [Google Scholar] [CrossRef]
- Lv, P.; Liu, Y.; Wang, Z.; Liu, S.; Jiang, L.; Chen, J.; Song, Y. In Situ Local Contact Angle Measurement in a CO2–Brine–Sand System Using Microfocused X-ray CT. Langmuir 2017, 33, 3358–3366. [Google Scholar] [CrossRef]
- Qin, C.; Jiang, Y.; Luo, Y.; Xian, X.; Liu, H.; Li, Y. Effect of Supercritical Carbon Dioxide Treatment Time, Pressure, and Temperature on Shale Water Wettability. Energy Fuels 2017, 31, 493–503. [Google Scholar] [CrossRef]
- Tudek, J.; Crandall, D.; Fuchs, S.; Werth, C.J.; Valocchi, A.J.; Chen, Y.; Goodman, A. In situ contact angle measurements of liquid CO2, brine, and Mount Simon sandstone core using micro X-ray CT imaging, sessile drop, and Lattice Boltzmann modeling. J. Pet. Sci. Eng. 2017, 155. [Google Scholar] [CrossRef]
- Alnili, F.; Al-Yaseri, A.; Roshan, H.; Rahman, T.; Verall, M.; Lebedev, M.; Sarmadivaleh, M.; Iglauer, S.; Barifcani, A. Carbon dioxide/brine wettability of porous sandstone versus solid quartz: An experimental and theoretical investigation. J. Colloid. Interface Sci. 2018, 524, 188–194. [Google Scholar] [CrossRef]
- Pan, B.; Li, Y.; Wang, H.; Jones, F.; Iglauer, S. CO2 and CH4 Wettabilities of Organic-Rich Shale. Energy Fuels 2018, 32, 1914–1922. [Google Scholar] [CrossRef]
- Prem, B.; Imran, S. Interfacial Tension and Contact Angle Data Relevant to Carbon Sequestration. In Carbon Capture, Utilization and Sequestration; Ramesh, K.A., Ed.; IntechOpen: Rijeka, Croatia, 2018; p. 10. [Google Scholar]
- Arif, M.; Abu-Khamsin, S.A.; Iglauer, S. Wettability of rock/CO2/brine and rock/oil/CO2-enriched-brine systems:Critical parametric analysis and future outlook. Adv. Colloid. Interface Sci. 2019, 268, 91–113. [Google Scholar] [CrossRef]
- Mutailipu, M.; Liu, Y.; Jiang, L.; Zhang, Y. Measurement and estimation of CO2–brine interfacial tension and rock wettability under CO2 sub- and super-critical conditions. J. Colloid. Interface Sci. 2019, 534, 605–617. [Google Scholar] [CrossRef] [PubMed]
- Yekeen, N.; Padmanabhan, E.; Sevoo, T.A.L.; Kanesen, K.A.L.; Okunade, O.A. Wettability of rock/CO2/brine systems: A critical review of influencing parameters and recent advances. J. Ind. Eng. Chem. 2020, 88, 1–28. [Google Scholar] [CrossRef]
- Baban, A.; Al-Yaseri, A.; Keshavarz, A.; Amin, R.; Iglauer, S. CO2—brine—sandstone wettability evaluation at reservoir conditions via Nuclear Magnetic Resonance measurements. Int. J. Greenh. Gas Control 2021, 111, 103435. [Google Scholar] [CrossRef]
- Gholami, R.; Raza, A.; Andersen, P.; Escalona, A.; Cardozo, N.; Marín, D.; Sarmadivaleh, M. Long-term integrity of shaly seals in CO2 geo-sequestration sites: An experimental study. Int. J. Greenh. Gas Control 2021, 109, 103370. [Google Scholar] [CrossRef]
- Hashemi, L.; Glerum, W.; Farajzadeh, R.; Hajibeygi, H. Contact angle measurement for hydrogen/brine/sandstone system using captive-bubble method relevant for underground hydrogen storage. Adv. Water Resour. 2021, 154, 103964. [Google Scholar] [CrossRef]
- Al-Yaseri, A.; Abbasi, G.R.; Yekeen, N.; Al-Shajalee, F.; Giwelli, A.; Xie, Q. Effects of cleaning process using toluene and acetone on water-wet-quartz/CO2 and oil-wet-quartz/CO2 wettability. J. Pet. Sci. Eng. 2022, 208, 109555. [Google Scholar] [CrossRef]
- Baban, A.; Keshavarz, A.; Amin, R.; Iglauer, S. Impact of Wettability Alteration on CO2 Residual Trapping in Oil-Wet Sandstone at Reservoir Conditions Using Nuclear Magnetic Resonance. Energy Fuels 2022, 36, 13722–13731. [Google Scholar] [CrossRef]
- Qin, C.; Jiang, Y.; Zhou, J.; Zuo, S.; Chen, S.; Liu, Z.; Yin, H.; Li, Y. Influence of supercritical CO2 exposure on water wettability of shale: Implications for CO2 sequestration and shale gas recovery. Energy 2022, 242, 122551. [Google Scholar] [CrossRef]
- Song, J.Y.; Jeong, Y.J.; Yun, T.S. Effects of Anisotropy and CO2 Wettability on CO2 Storage Capacity in Sandstone. Geofluids 2022, 2022, 5900255. [Google Scholar] [CrossRef]
- Al-Khdheeawi, E.A.; Vialle, S.; Barifcani, A.; Sarmadivaleh, M.; Iglauer, S. Effect of wettability heterogeneity and reservoir temperature on CO2 storage efficiency in deep saline aquifers. Int. J. Greenh. Gas Control 2018, 68, 216–229. [Google Scholar] [CrossRef]
- Iglauer, S.; Pentland, C.H.; Busch, A. CO2 wettability of seal and reservoir rocks and the implications for carbon geo-sequestration. Water Resour. Res. 2015, 51, 729–774. [Google Scholar] [CrossRef]
- Rahman, T.; Lebedev, M.; Barifcani, A.; Iglauer, S. Residual trapping of supercritical CO2 in oil-wet sandstone. J. Colloid. Interface Sci. 2016, 469, 63. [Google Scholar] [CrossRef]
- Espinoza, D.N.; Santamarina, J.C. CO2 breakthrough—Caprock sealing efficiency and integrity for carbon geological storage. Int. J. Greenh. Gas Control 2017, 66, 218–229. [Google Scholar] [CrossRef]
- Stavropoulou, E.; Laloui, L. Evaluating CO2 breakthrough in a shaly caprock material: A multi-scale experimental approach. Sci. Rep. 2022, 12, 10706. [Google Scholar] [CrossRef]
- Gaus, I.; Azaroual, M.; Czernichowski-Lauriol, I. Reactive transport modelling of the impact of CO2 injection on the clayey cap rock at Sleipner (North Sea). Chem. Geol. 2005, 217, 319–337. [Google Scholar] [CrossRef]
- Gaus, I. Role and impact of CO2–rock interactions during CO2 storage in sedimentary rocks. Int. J. Greenh. Gas Control 2010, 4, 73–89. [Google Scholar] [CrossRef]
- Rosenbauer, R.J.; Koksalan, T.; Palandri, J.L. Experimental investigation of CO2-brine-rock interactions at elevated temperature and pressure: Implications for CO2 sequestration in deep-saline aquifers. Fuel Process. Technol. 2005, 86, 1581–1597. [Google Scholar] [CrossRef]
- Espinoza, D.N.; Kim, S.H.; Santamarina, J.C. CO2 geological storage—Geotechnical implications. KSCE J. Civ. Eng. 2011, 15, 707–719. [Google Scholar] [CrossRef]
- Palandri, J.L.; Kharaka, Y.K. A Compilation of Rate Parameters of Water—Mineral Interaction Kinetics for Application to Geochemical Modeling; U.S. Geological Survey: Reston, VA, USA, 2004.
- Pokrovsky, O.S.; Golubev, S.V.; Schott, J.; Castillo, A. Calcite, dolomite and magnesite dissolution kinetics in aqueous solutions at acid to circumneutral pH, 25 to 150 °C and 1 to 55 atm pCO2: New constraints on CO2 sequestration in sedimentary basins. Chem. Geol. 2009, 260, 317. [Google Scholar] [CrossRef]
- Golubev, S.V.; Bénézeth, P.; Schott, J.; Dandurand, J.L.; Castillo, A. Siderite dissolution kinetics in acidic aqueous solutions from 25 to 100 °C and 0 to 50 atm pCO2. Chem. Geol. 2009, 265, 13–19. [Google Scholar] [CrossRef]
- Dresel, P.E. The Dissolution Kinetics of Siderite and its Effect on Acid Mine Drainage. Ph.D. Thesis, The Pennsylvania State University, State College, PA, USA, 1989. [Google Scholar]
- Gunter, W.D.; Wiwehar, B.; Perkins, E.H. Aquifer disposal of CO2-rich greenhouse gases: Extension of the time scale of experiment for CO2-sequestering reactions by geochemical modelling. Mineral. Petrol. 1997, 59, 121–140. [Google Scholar] [CrossRef]
- Seyyedi, M.; Mahmud, H.K.B.; Verrall, M.; Giwelli, A.; Esteban, L.; Ghasemiziarani, M.; Clennell, B. Pore Structure Changes Occur During CO2 Injection into Carbonate Reservoirs. Sci. Rep. 2020, 10, 3624. [Google Scholar] [CrossRef]
- Wang, H.; Alvarado, V.; Smith, E.R.; Kaszuba, J.P.; Bagdonas, D.A.; McLaughlin, J.F.; Quillinan, S.A. Link Between CO2-Induced Wettability and Pore Architecture Alteration. Geophys. Res. Lett. 2020, 47. [Google Scholar] [CrossRef]
- Kim, K.; Kundzicz, P.M.; Makhnenko, R.Y. Effect of CO2 Injection on the Multiphase Flow Properties of Reservoir Rock. Transp. Porous Media 2023, 147, 429–461. [Google Scholar] [CrossRef]
- Mouzakis, K.M.; Navarre-Sitchler, A.K.; Rother, G.; Bañuelos, J.L.; Wang, X.; Kaszuba, J.P.; Heath, J.E.; Miller, Q.R.S.; Alvarado, V.; McCray, J.E. Experimental Study of Porosity Changes in Shale Caprocks Exposed to CO2-Saturated Brines I: Evolution of Mineralogy, Pore Connectivity, Pore Size Distribution, and Surface Area. Environ. Eng. Sci. 2016, 33, 725–735. [Google Scholar] [CrossRef]
- Pan, Y.; Hui, D.; Luo, P.; Zhang, Y.; Sun, L.; Wang, K. Experimental Investigation of the Geochemical Interactions between Supercritical CO2 and Shale: Implications for CO2 Storage in Gas-Bearing Shale Formations. Energy Fuels 2018, 32, 1963–1978. [Google Scholar] [CrossRef]
- Sanguinito, S.; Goodman, A.; Tkach, M.; Kutchko, B.; Culp, J.; Natesakhawat, S.; Fazio, J.; Fukai, I.; Crandall, D. Quantifying dry supercritical CO2-induced changes of the Utica Shale. Fuel 2018, 226, 54–64. [Google Scholar] [CrossRef]
- Goodman, A.; Sanguinito, S.; Tkach, M.; Natesakhawat, S.; Kutchko, B.; Fazio, J.; Cvetic, P. Investigating the role of water on CO2-Utica Shale interactions for carbon storage and shale gas extraction activities—Evidence for pore scale alterations. Fuel 2019, 242, 744–755. [Google Scholar] [CrossRef]
- Fatah, A.; Mahmud, H.B.; Bennour, Z.; Hossain, M.; Gholami, R. Effect of supercritical CO2 treatment on physical properties and functional groups of shales. Fuel 2021, 303, 121310. [Google Scholar] [CrossRef]
- Medina, B.X.; Kohli, A.; Kovscek, A.R.; Alvarado, V. Effects of Supercritical CO2 Injection on the Shale Pore Structures and Mass Transport Rates. Energy Fuels 2023, 37, 1151–1168. [Google Scholar] [CrossRef]
- Wang, S.; Zhou, S.; Pan, Z.; Elsworth, D.; Yan, D.; Wang, H.; Liu, D.; Hu, Z. Response of pore network fractal dimensions and gas adsorption capacities of shales exposed to supercritical CO2: Implications for CH4 recovery and carbon sequestration. Energy Rep. 2023, 9, 6461–6485. [Google Scholar] [CrossRef]
- Miller, Q.R.S.; Wang, X.; Kaszuba, J.P.; Mouzakis, K.M.; Navarre-Sitchler, A.K.; Alvarado, V.; McCray, J.E.; Rother, G.; Bañuelos, J.L.; Heath, J.E. Experimental Study of Porosity Changes in Shale Caprocks Exposed to Carbon Dioxide-Saturated Brine II: Insights from Aqueous Geochemistry. Environ. Eng. Sci. 2016, 33, 736–744. [Google Scholar] [CrossRef]
- Cruz, F.; Tinni, A.; Brackeen, S.; Sondergeld, C.; Rai, C. Impact of Capillary Pressure on Total Porosity in Unconventional Shales. In Proceedings of the SPE/AAPG/SEG Unconventional Resources Technology Conference, Online, 20–22 July 2020. [Google Scholar]
- Sondergeld, C.H.; Rai, C.S. A New Exploration Tool: Quantitative Core Characterization. In Experimental Techniques in Mineral and Rock Physics: The Schreiber Volume; Liebermann, R.C., Sondergeld, C.H., Eds.; Birkhäuser Basel: Basel, Switzerland, 1994; pp. 249–268. [Google Scholar]
- Ballard, B. Quantitative Mineralogy of Reservoir Rocks Using Fourier Transform Infrared Spectroscopy. In Proceedings of the SPE Annual Technical Conference and Exhibition, Anaheim, CA, USA, 1 January 2007; p. 8. [Google Scholar]
- Curtis, M.; Mamoudou, S.; Cruz, F.; Dang, S.; Rai, C.; Devegowda, D. Effects of CO2 Exposure on Unconventional Reservoir Rock Microstructure. In Proceedings of the SPE/AAPG/SEG Unconventional Resources Technology Conference, Denver, CO, USA, 13–15 June 2023. [Google Scholar]
- Rathnaweera, T.D.; Ranjith, P.G.; Perera, M.S.A. Experimental investigation of geochemical and mineralogical effects of CO2 sequestration on flow characteristics of reservoir rock in deep saline aquifers. Sci. Rep. 2016, 6, 19362. [Google Scholar] [CrossRef] [PubMed]
- Sokama-Neuyam, Y.A.; Boakye, P.; Aggrey, W.N.; Obeng, N.O.; Adu-Boahene, F.; Woo, S.H.; Ursin, J.R. Theoretical Modeling of the Impact of Salt Precipitation on CO2 Storage Potential in Fractured Saline Reservoirs. ACS Omega 2020, 5, 14776–14785. [Google Scholar] [CrossRef]
- Vilarrasa, V.; Rutqvist, J. Thermal effects on geologic carbon storage. Earth-Sci. Rev. 2017, 165, 245–256. [Google Scholar] [CrossRef]
- Comisky, J.T.; Santiago, M.; McCollom, B.; Buddhala, A.; Newsham, K.E. Sample Size Effects on the Application of Mercury Injection Capillary Pressure for Determining the Storage Capacity of Tight Gas and Oil Shales. In Proceedings of the Canadian Unconventional Resources Conference, Calgary, AB, Canada, 1 January 2011; p. 23. [Google Scholar]
- Wang, R.; Sang, S.; Zhu, D.; Liu, S.; Yu, K. Pore characteristics and controlling factors of the Lower Cambrian Hetang Formation shale in Northeast Jiangxi, China. Energy Explor. Exploit. 2017, 36, 43–65. [Google Scholar] [CrossRef]
- Tian, Y.; Chen, Q.; Yan, C.; Deng, H.; He, Y. Classification of Adsorption Isotherm Curves for Shale Based on Pore Structure. Petrophysics 2020, 61, 417–433. [Google Scholar] [CrossRef]
- Fuhua, S.; Ke, M.; Yanming, Z.H.U.; Meng, W.; Xin, T.; Yang, W.; Haitao, G.A.O.; Guangjun, F.; Wentian, M.I. Pore structure, adsorption capacity and their controlling factors of shale in complex structural area. Méitàn Kēxué Jìshù 2023, 51, 269–282. [Google Scholar] [CrossRef]
- Thommes, M.; Kaneko, K.; Neimark, A.V.; Olivier, J.P.; Rodriguez-Reinoso, F.; Rouquerol, J.; Sing, K.S.W. Physisorption of gases, with special reference to the evaluation of surface area and pore size distribution (IUPAC Technical Report). Pure Appl. Chem. 2015, 87, 1051–1069. [Google Scholar] [CrossRef]
- Sing, K.S.W. Reporting physisorption data for gas/solid systems with special reference to the determination of surface area and porosity (Recommendations 1984). Pure Appl. Chem. 1985, 57, 603–619. [Google Scholar] [CrossRef]
- Dang, S.; Mukherjee, S.; Sondergeld, C.; Rai, C. Measurement of Effective Tortuosity in Unconventional Tight Rock using Nuclear Magnetic Resonance. In Proceedings of the SPE/AAPG/SEG Unconventional Resources Technology Conference, Online, 26–28 July 2021. [Google Scholar]
- Odiachi, J.; Cruz, F.; Tinni, A. Diffusional and Electrical Tortuosity in Unconventional Shale Reservoirs. In Proceedings of the SPE Annual Technical Conference and Exhibition, Houston, TX, USA, 3–5 October 2022. [Google Scholar]
- Tinni, A.; Odusina, E.; Sulucarnain, I.; Sondergeld, C.; Rai, C.S. Nuclear-Magnetic-Resonance Response of Brine, Oil, and Methane in Organic-Rich Shales. SPE Reserv. Eval. Eng. 2015, 18, 400–406. [Google Scholar] [CrossRef]
- Mukherjee, S.; Dang, S.T.; Rai, C.; Sondergeld, C. Revisiting the Concept of Wettability for Organic-Rich Tight Rocks: Application in Formation Damage-Water Blockage. Petrophysics 2020, 61, 473–481. [Google Scholar] [CrossRef]
- Wigand, M.; Carey, J.W.; SchÜTt, H.; Spangenberg, E.; Erzinger, J. Geochemical effects of CO2 sequestration in sandstones under simulated in situ conditions of deep saline aquifers. Appl. Geochem. 2008, 23, 2735–2745. [Google Scholar] [CrossRef]
- Lu, J.; Kharaka, Y.K.; Thordsen, J.J.; Horita, J.; Karamalidis, A.; Griffith, C.; Hakala, J.A.; Ambats, G.; Cole, D.R.; Phelps, T.J.; et al. CO2–rock–brine interactions in Lower Tuscaloosa Formation at Cranfield CO2 sequestration site, Mississippi, USA. Chem. Geol. 2012, 291, 269–277. [Google Scholar] [CrossRef]
- Shi, Z.; Sun, L.; Haljasmaa, I.; Harbert, W.; Sanguinito, S.; Tkach, M.; Goodman, A.; Tsotsis, T.T.; Jessen, K. Impact of Brine/CO2 exposure on the transport and mechanical properties of the Mt Simon sandstone. J. Pet. Sci. Eng. 2019, 177, 295–305. [Google Scholar] [CrossRef]
- Kim, K.; Makhnenko, R.Y. Short- and Long-Term Responses of Reservoir Rock Induced by CO2 Injection. Rock. Mech. Rock. Eng. 2022, 55, 6605–6625. [Google Scholar] [CrossRef]
Disclaimer/Publisher’s Note: The statements, opinions and data contained in all publications are solely those of the individual author(s) and contributor(s) and not of MDPI and/or the editor(s). MDPI and/or the editor(s) disclaim responsibility for any injury to people or property resulting from any ideas, methods, instructions or products referred to in the content. |
© 2023 by the authors. Licensee MDPI, Basel, Switzerland. This article is an open access article distributed under the terms and conditions of the Creative Commons Attribution (CC BY) license (https://creativecommons.org/licenses/by/4.0/).