

Biomass Amounts of Spontaneous Vegetation on Post-Coal Mine Novel Ecosystem in Relation to Biotic Parameters


Abstract
:1. Introduction
2. Materials and Methods
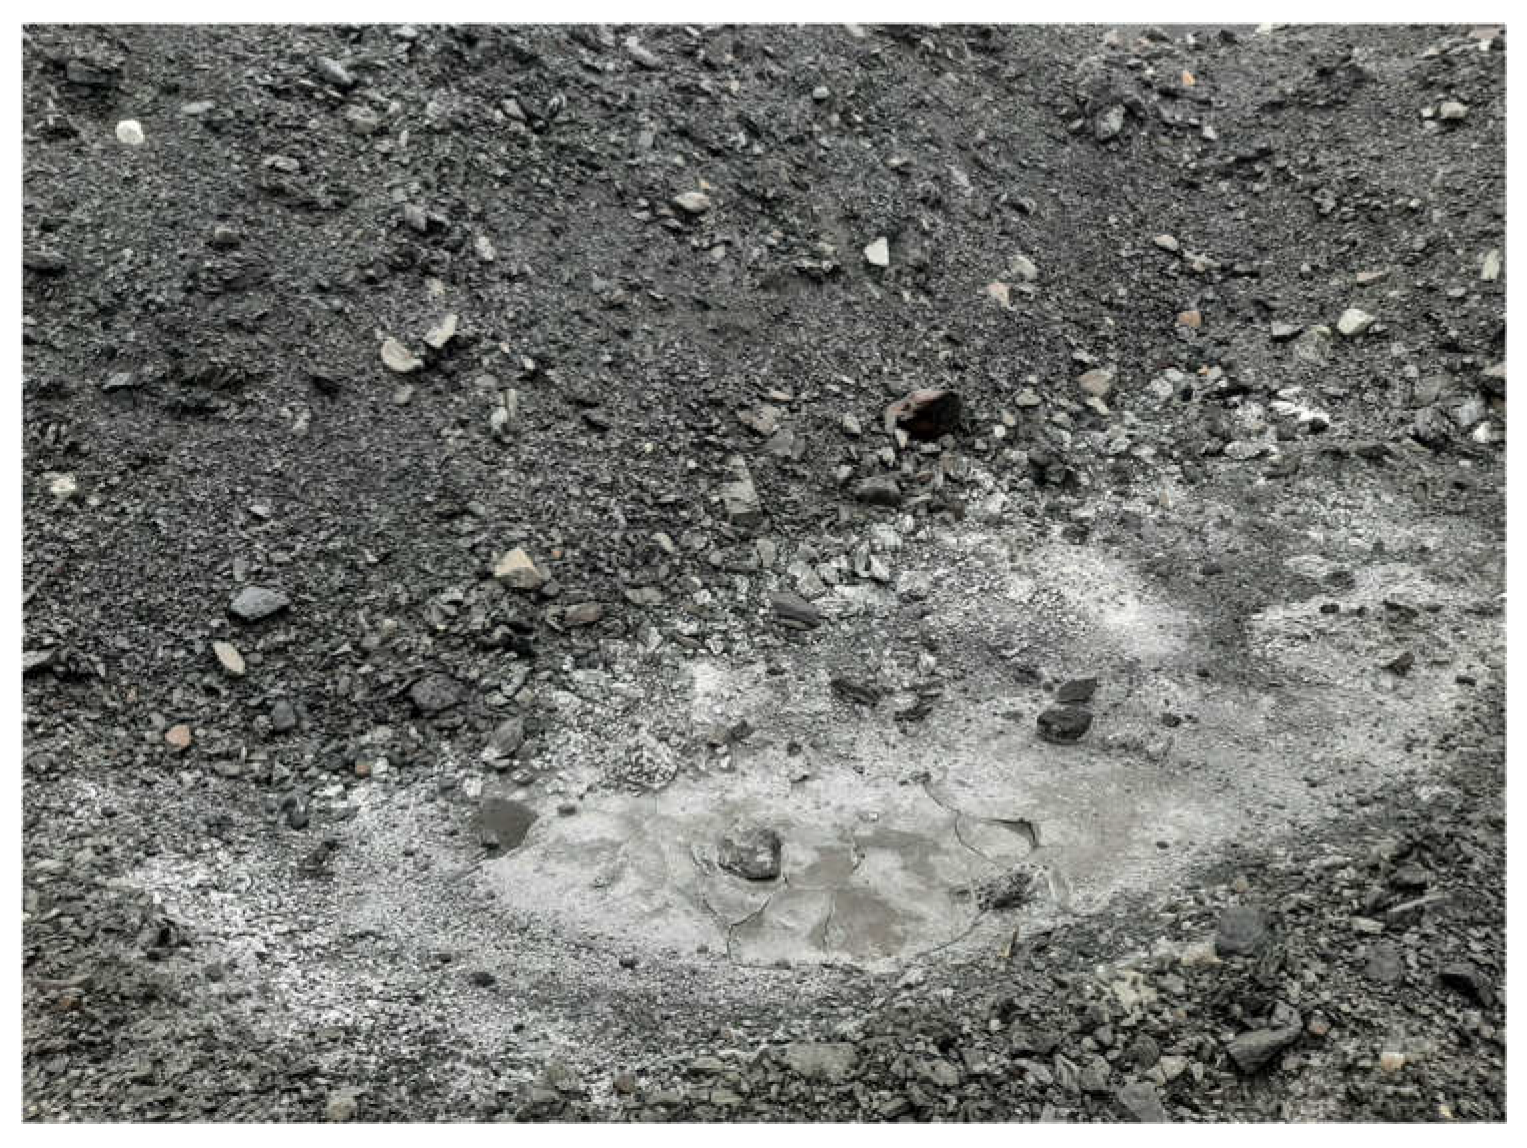
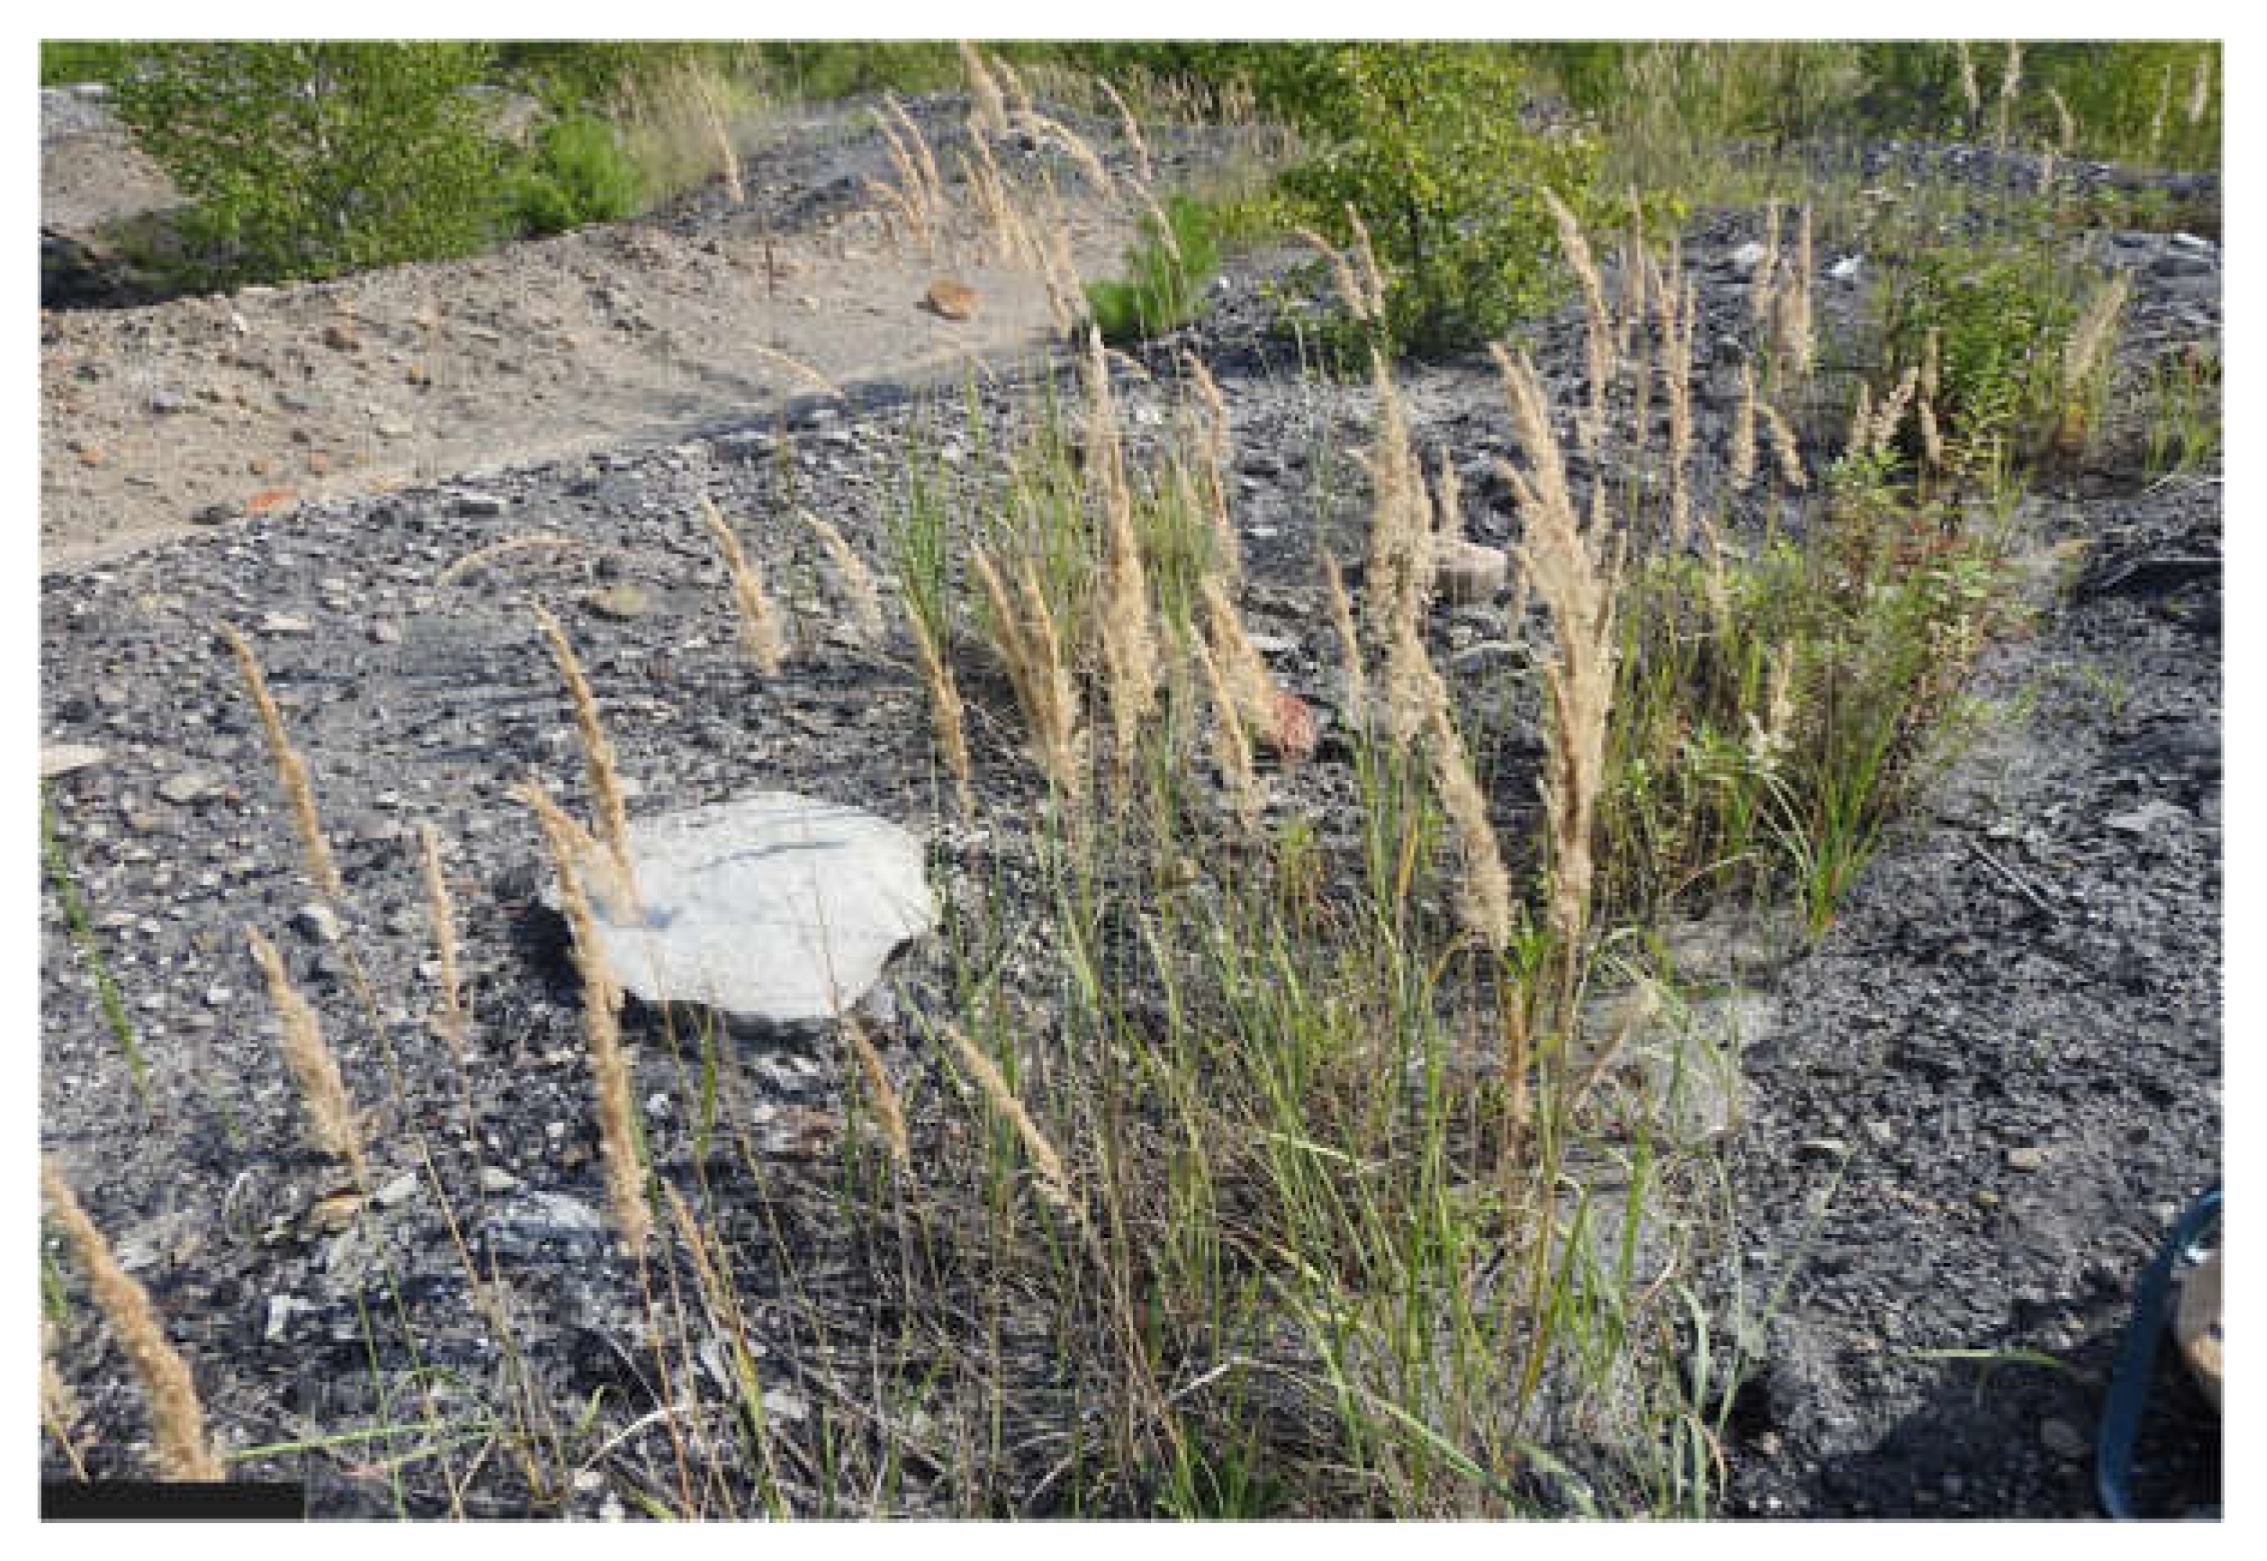
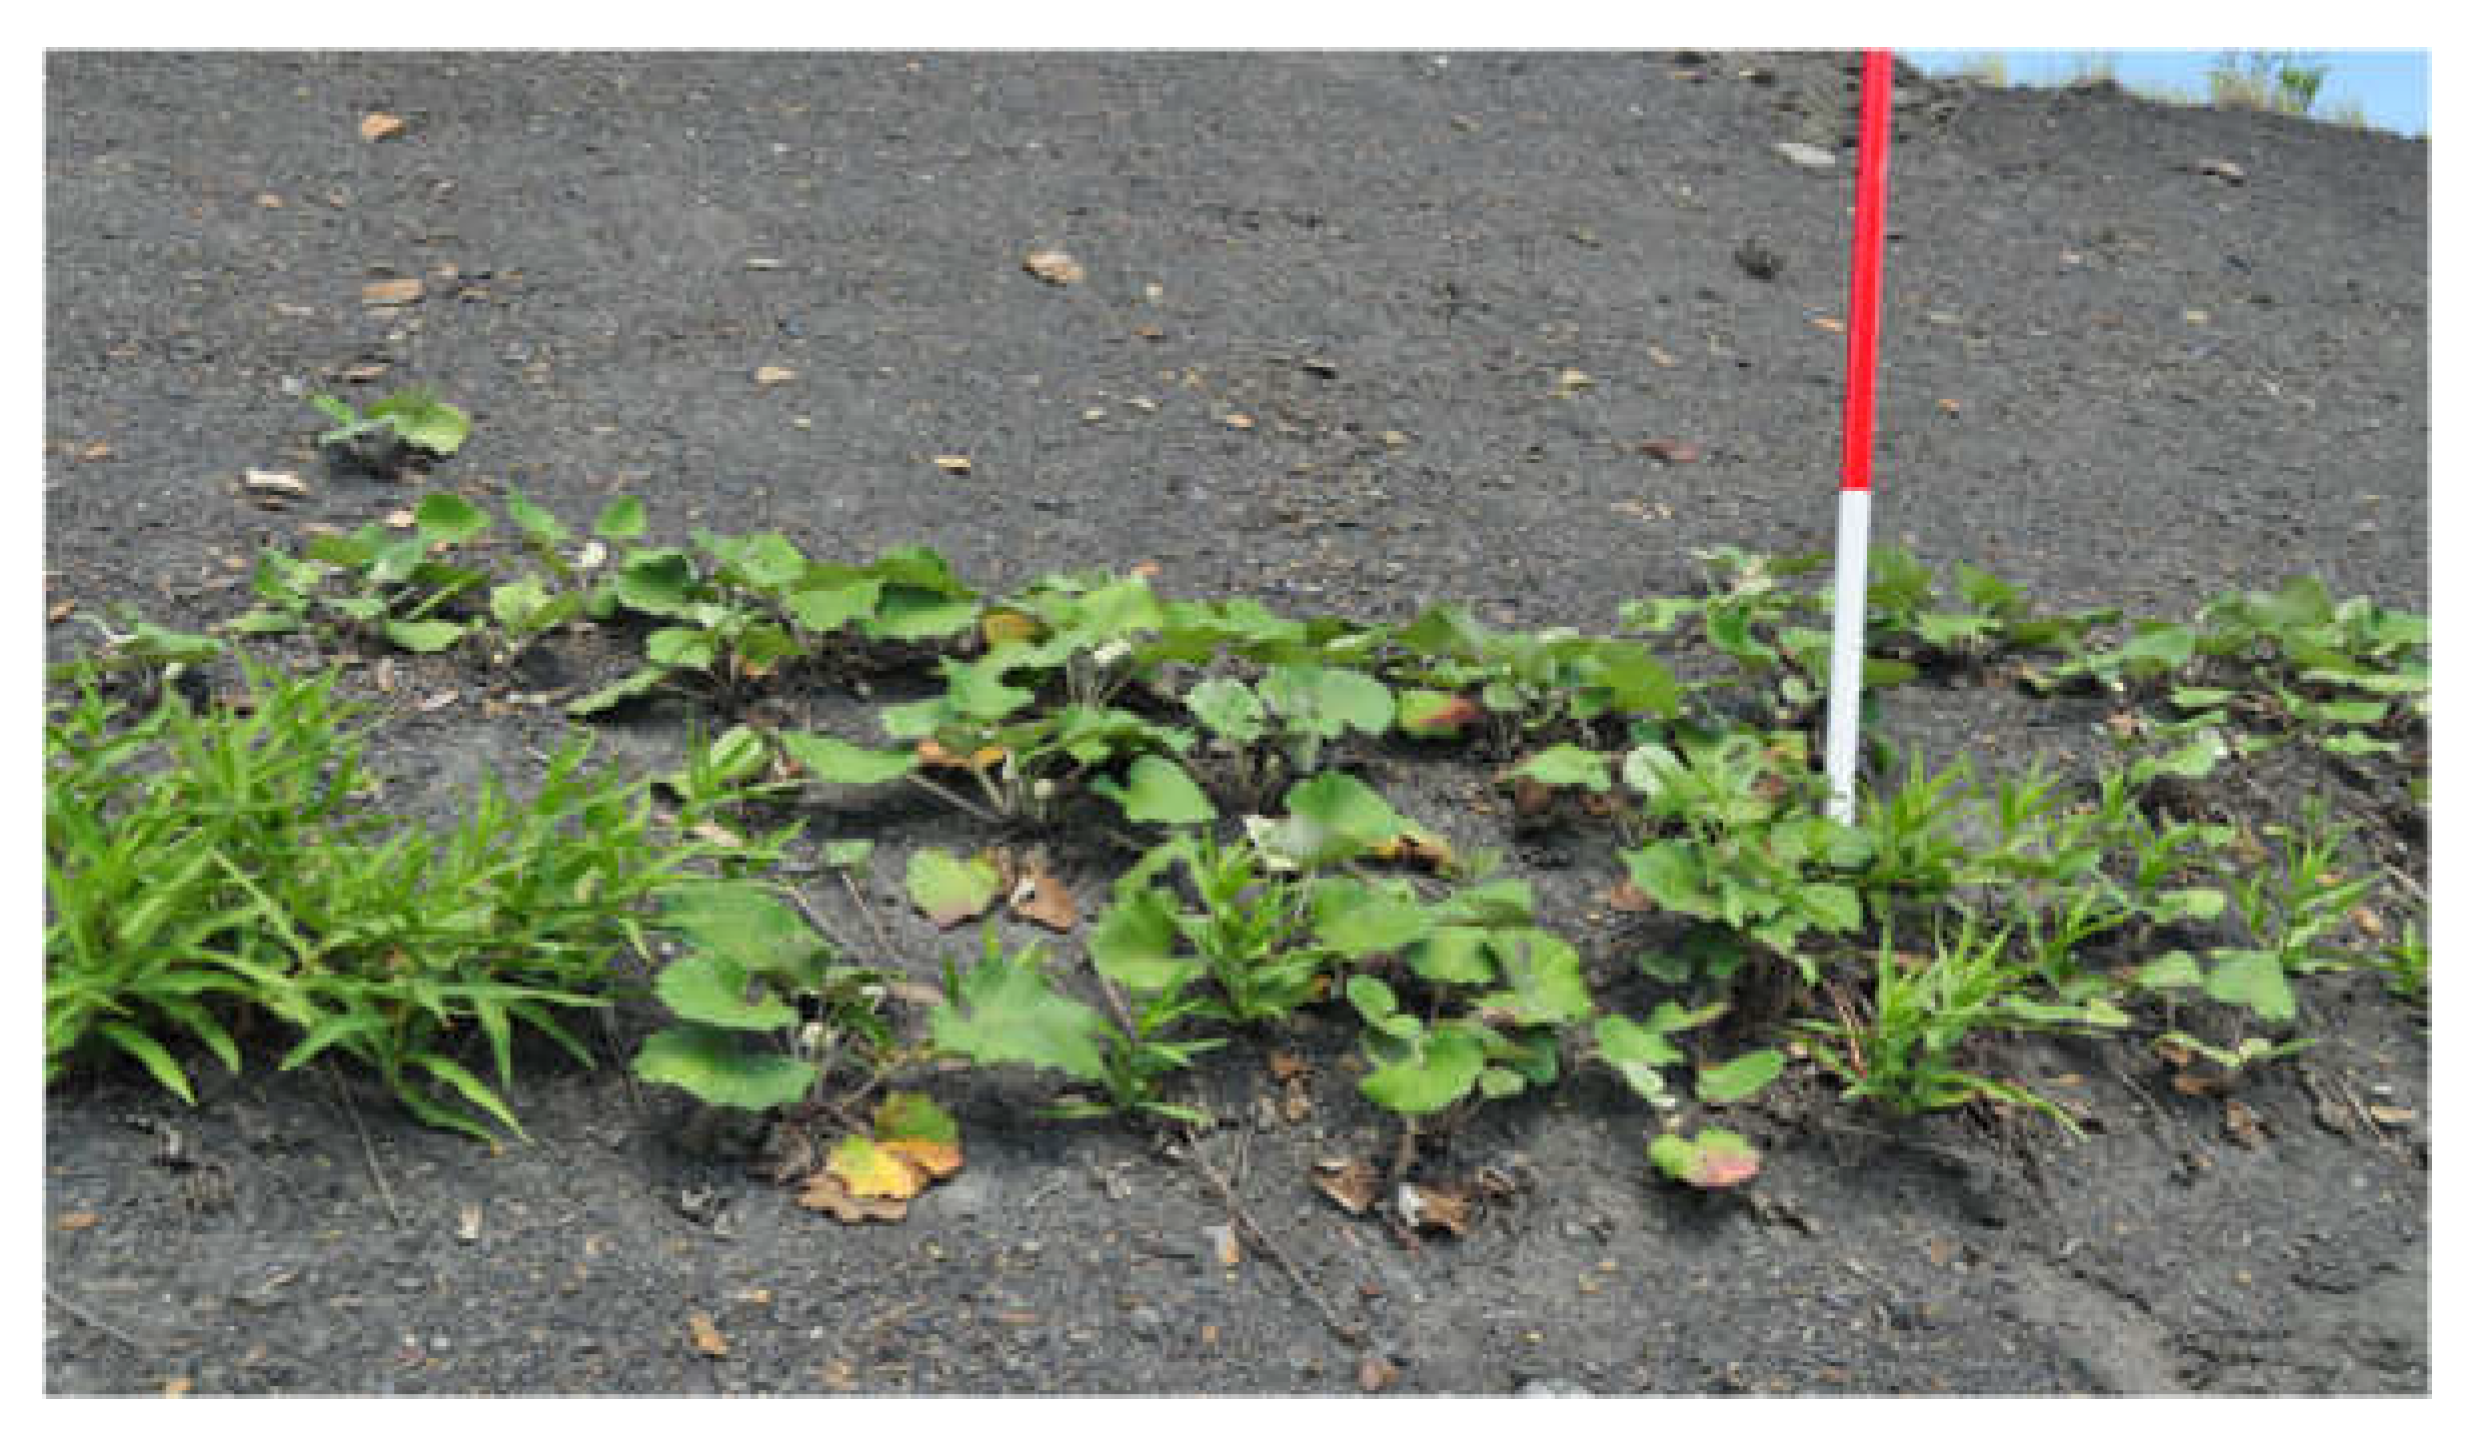
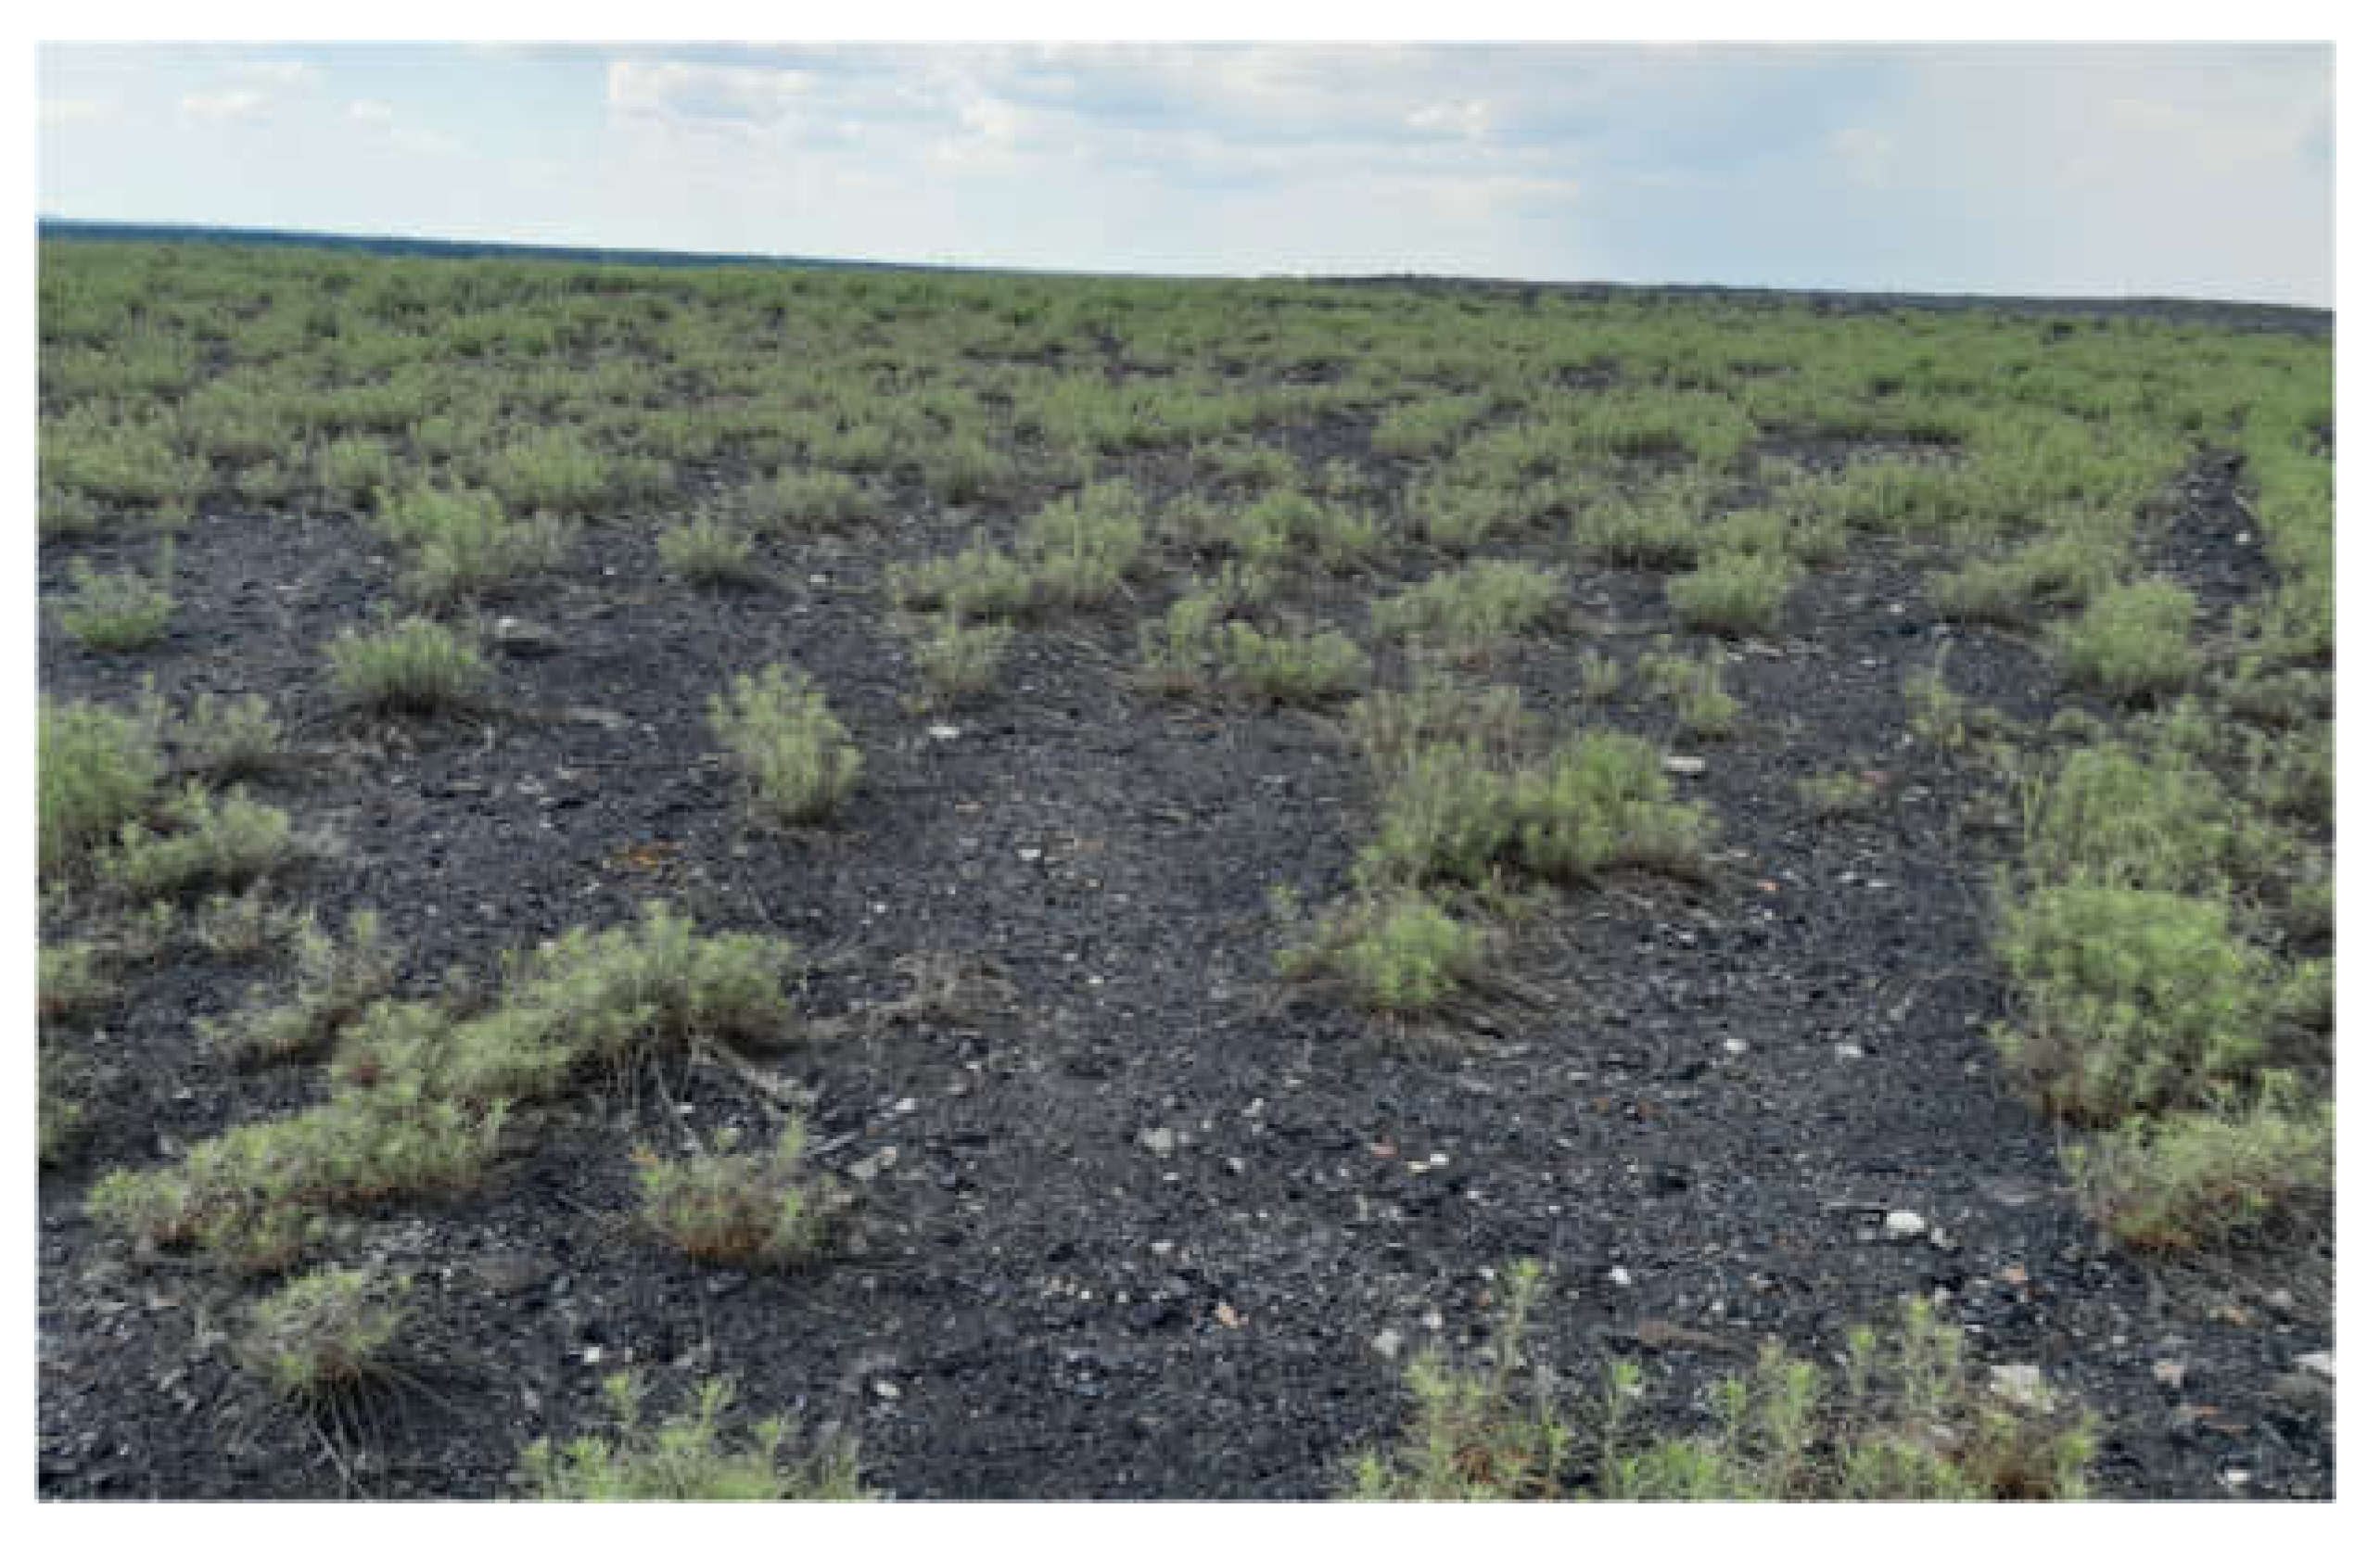
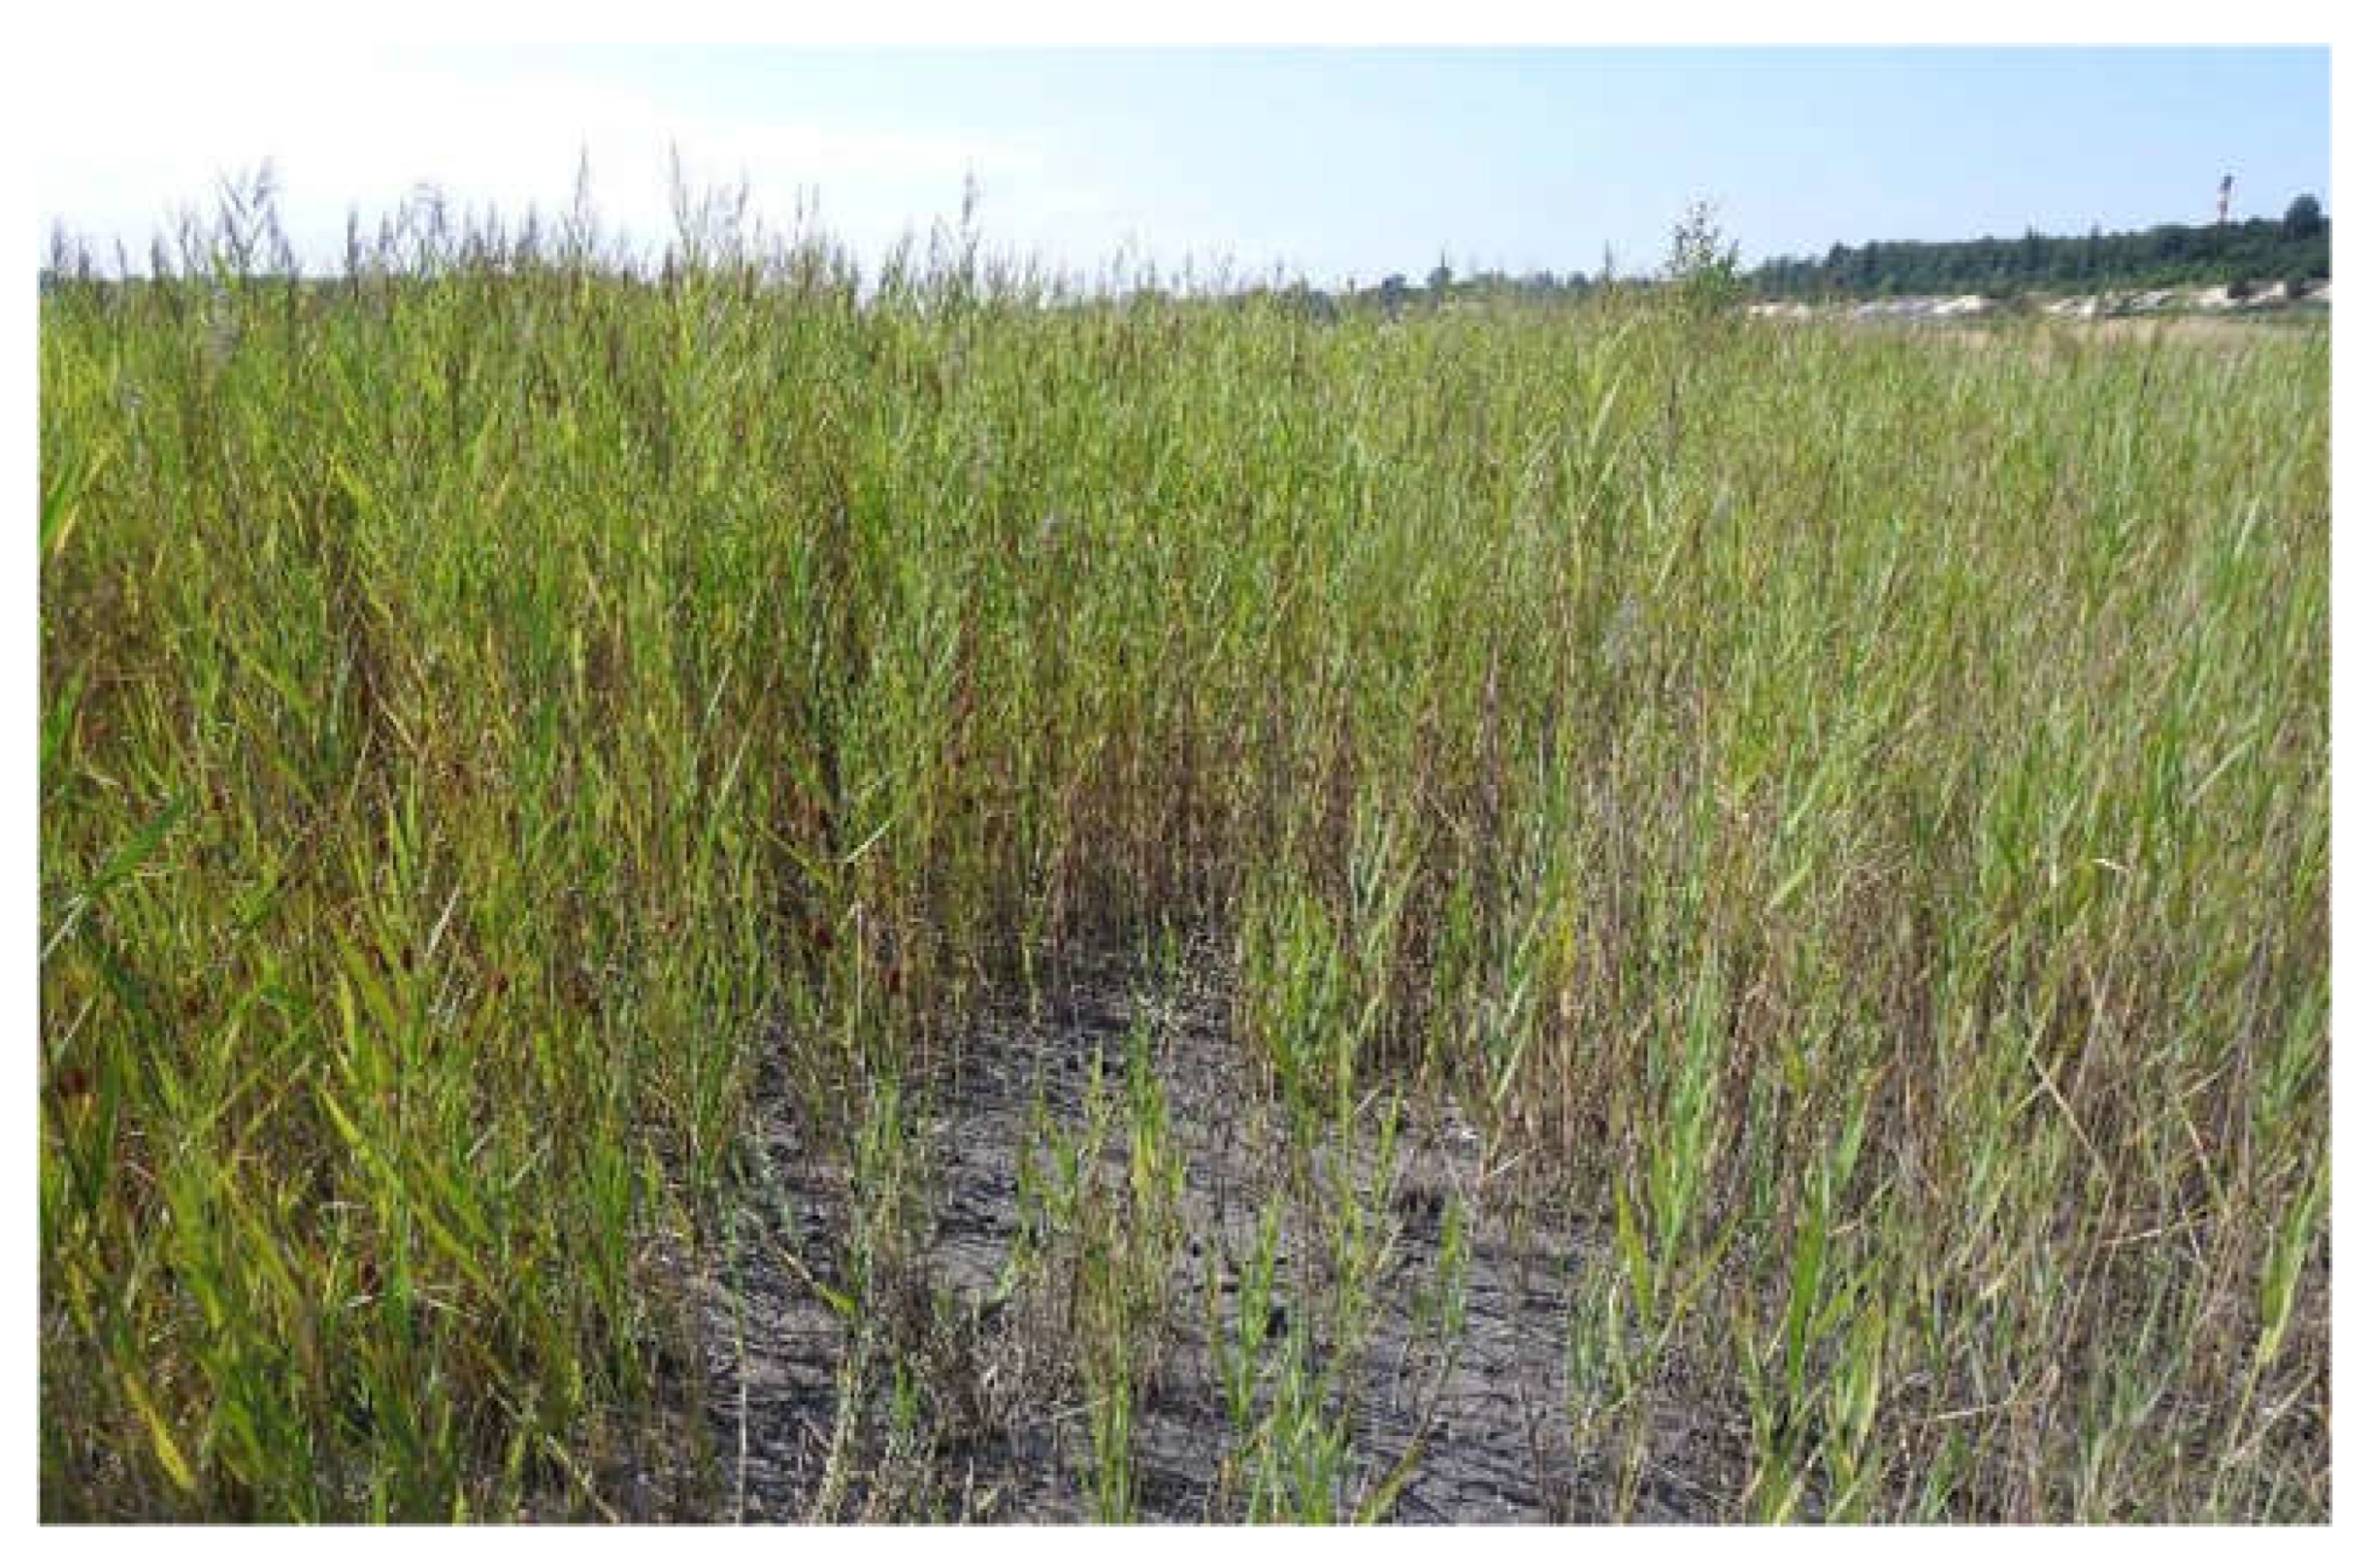
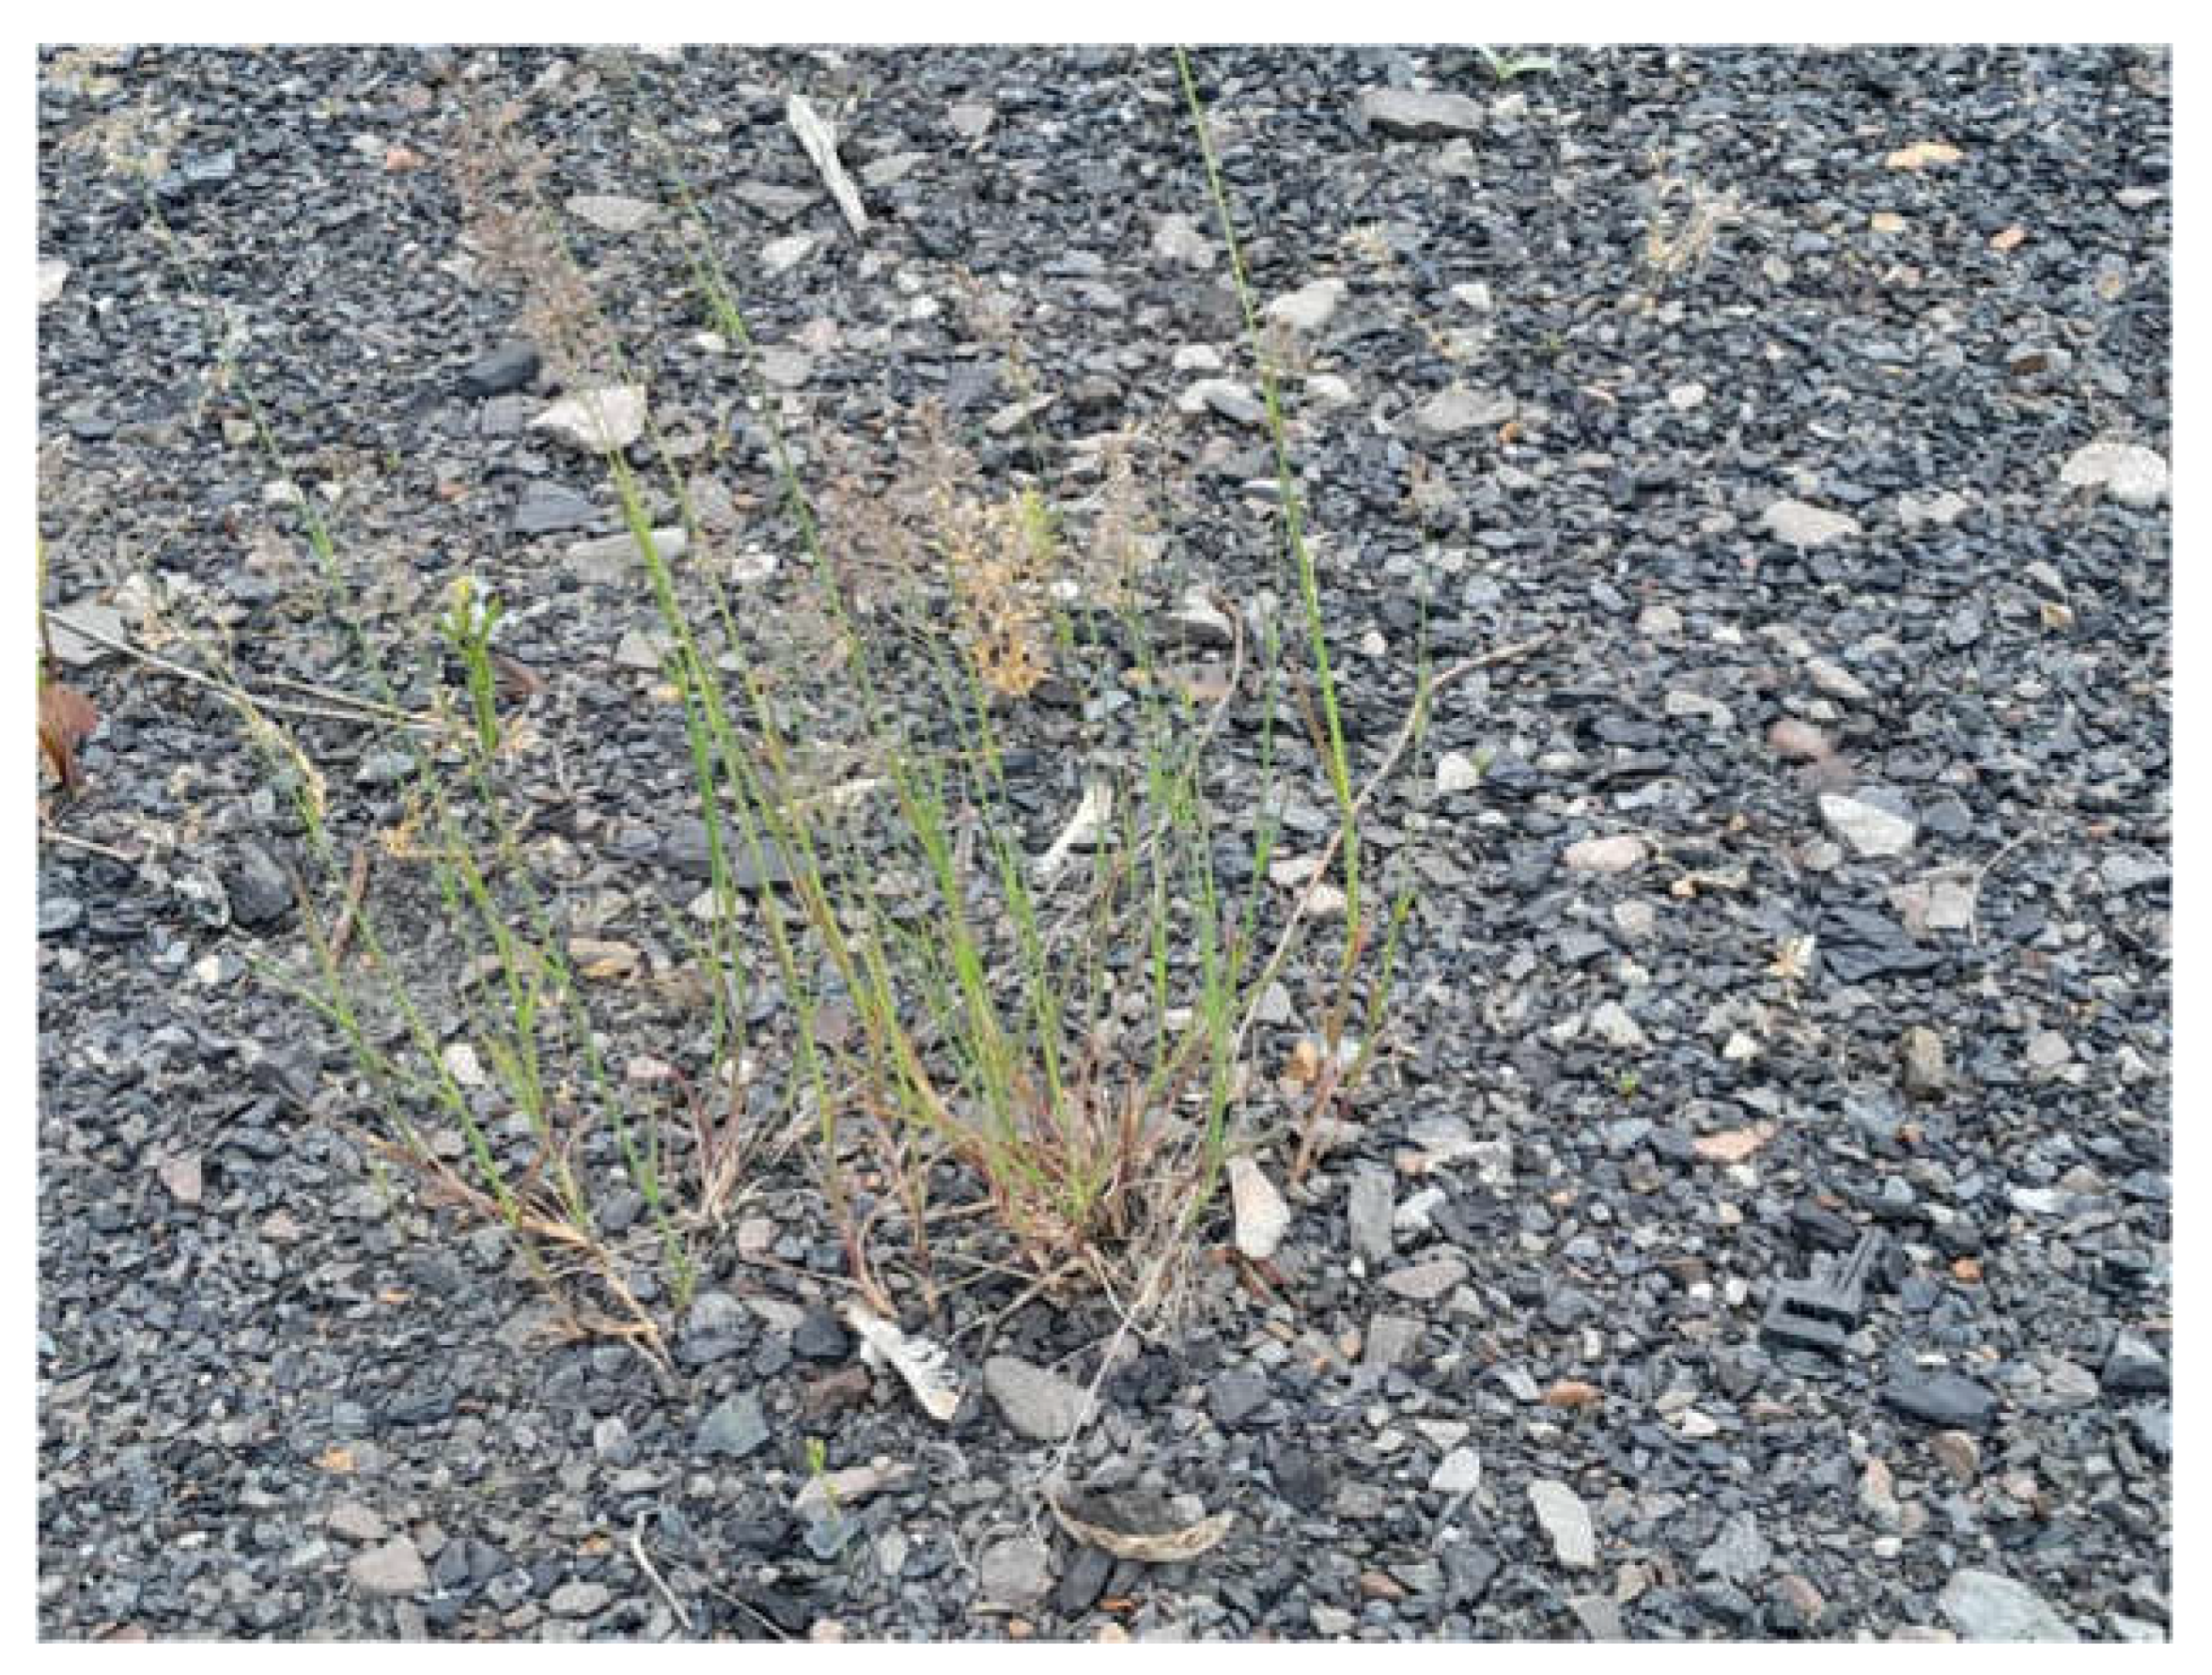
2.1. Study Site Description
2.2. Vegetation Data Collection
2.3. Vegetation Diversity Measurements
2.4. Biomass Collection
2.5. Enzyme Activity Measurement
2.6. Soil Fauna Samples
2.7. Respiration Measurement
2.8. Data Analysis
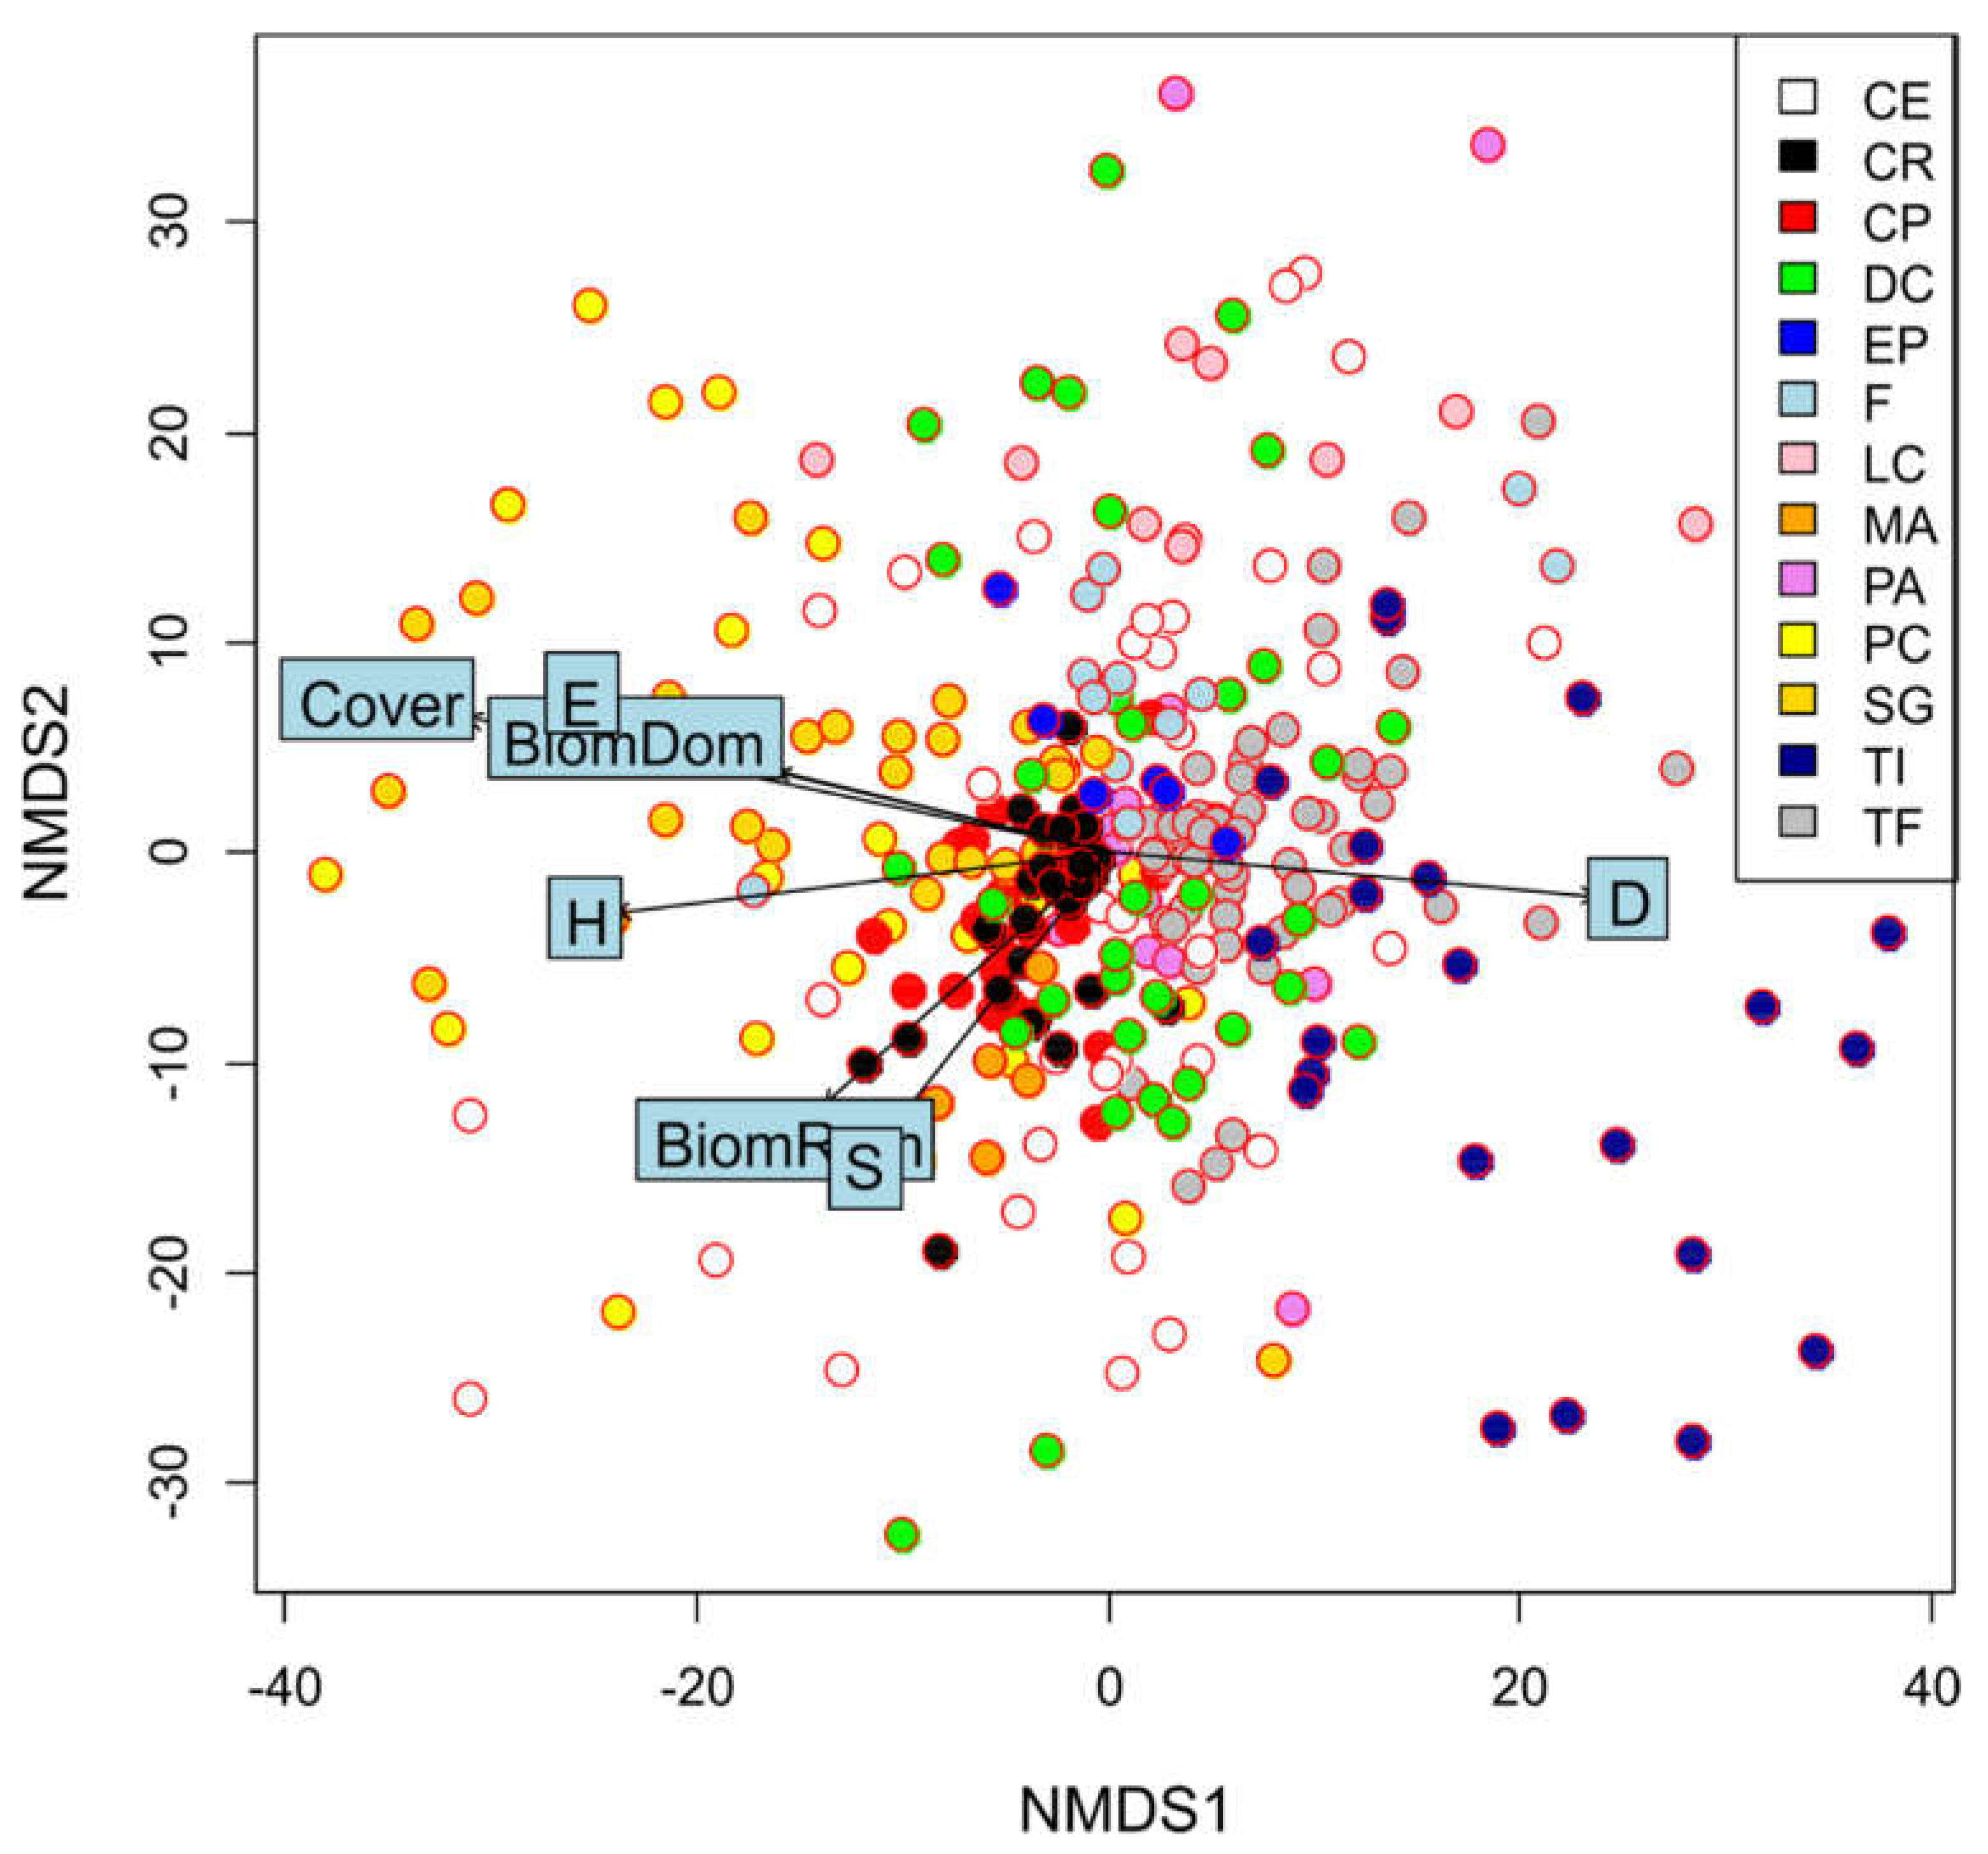
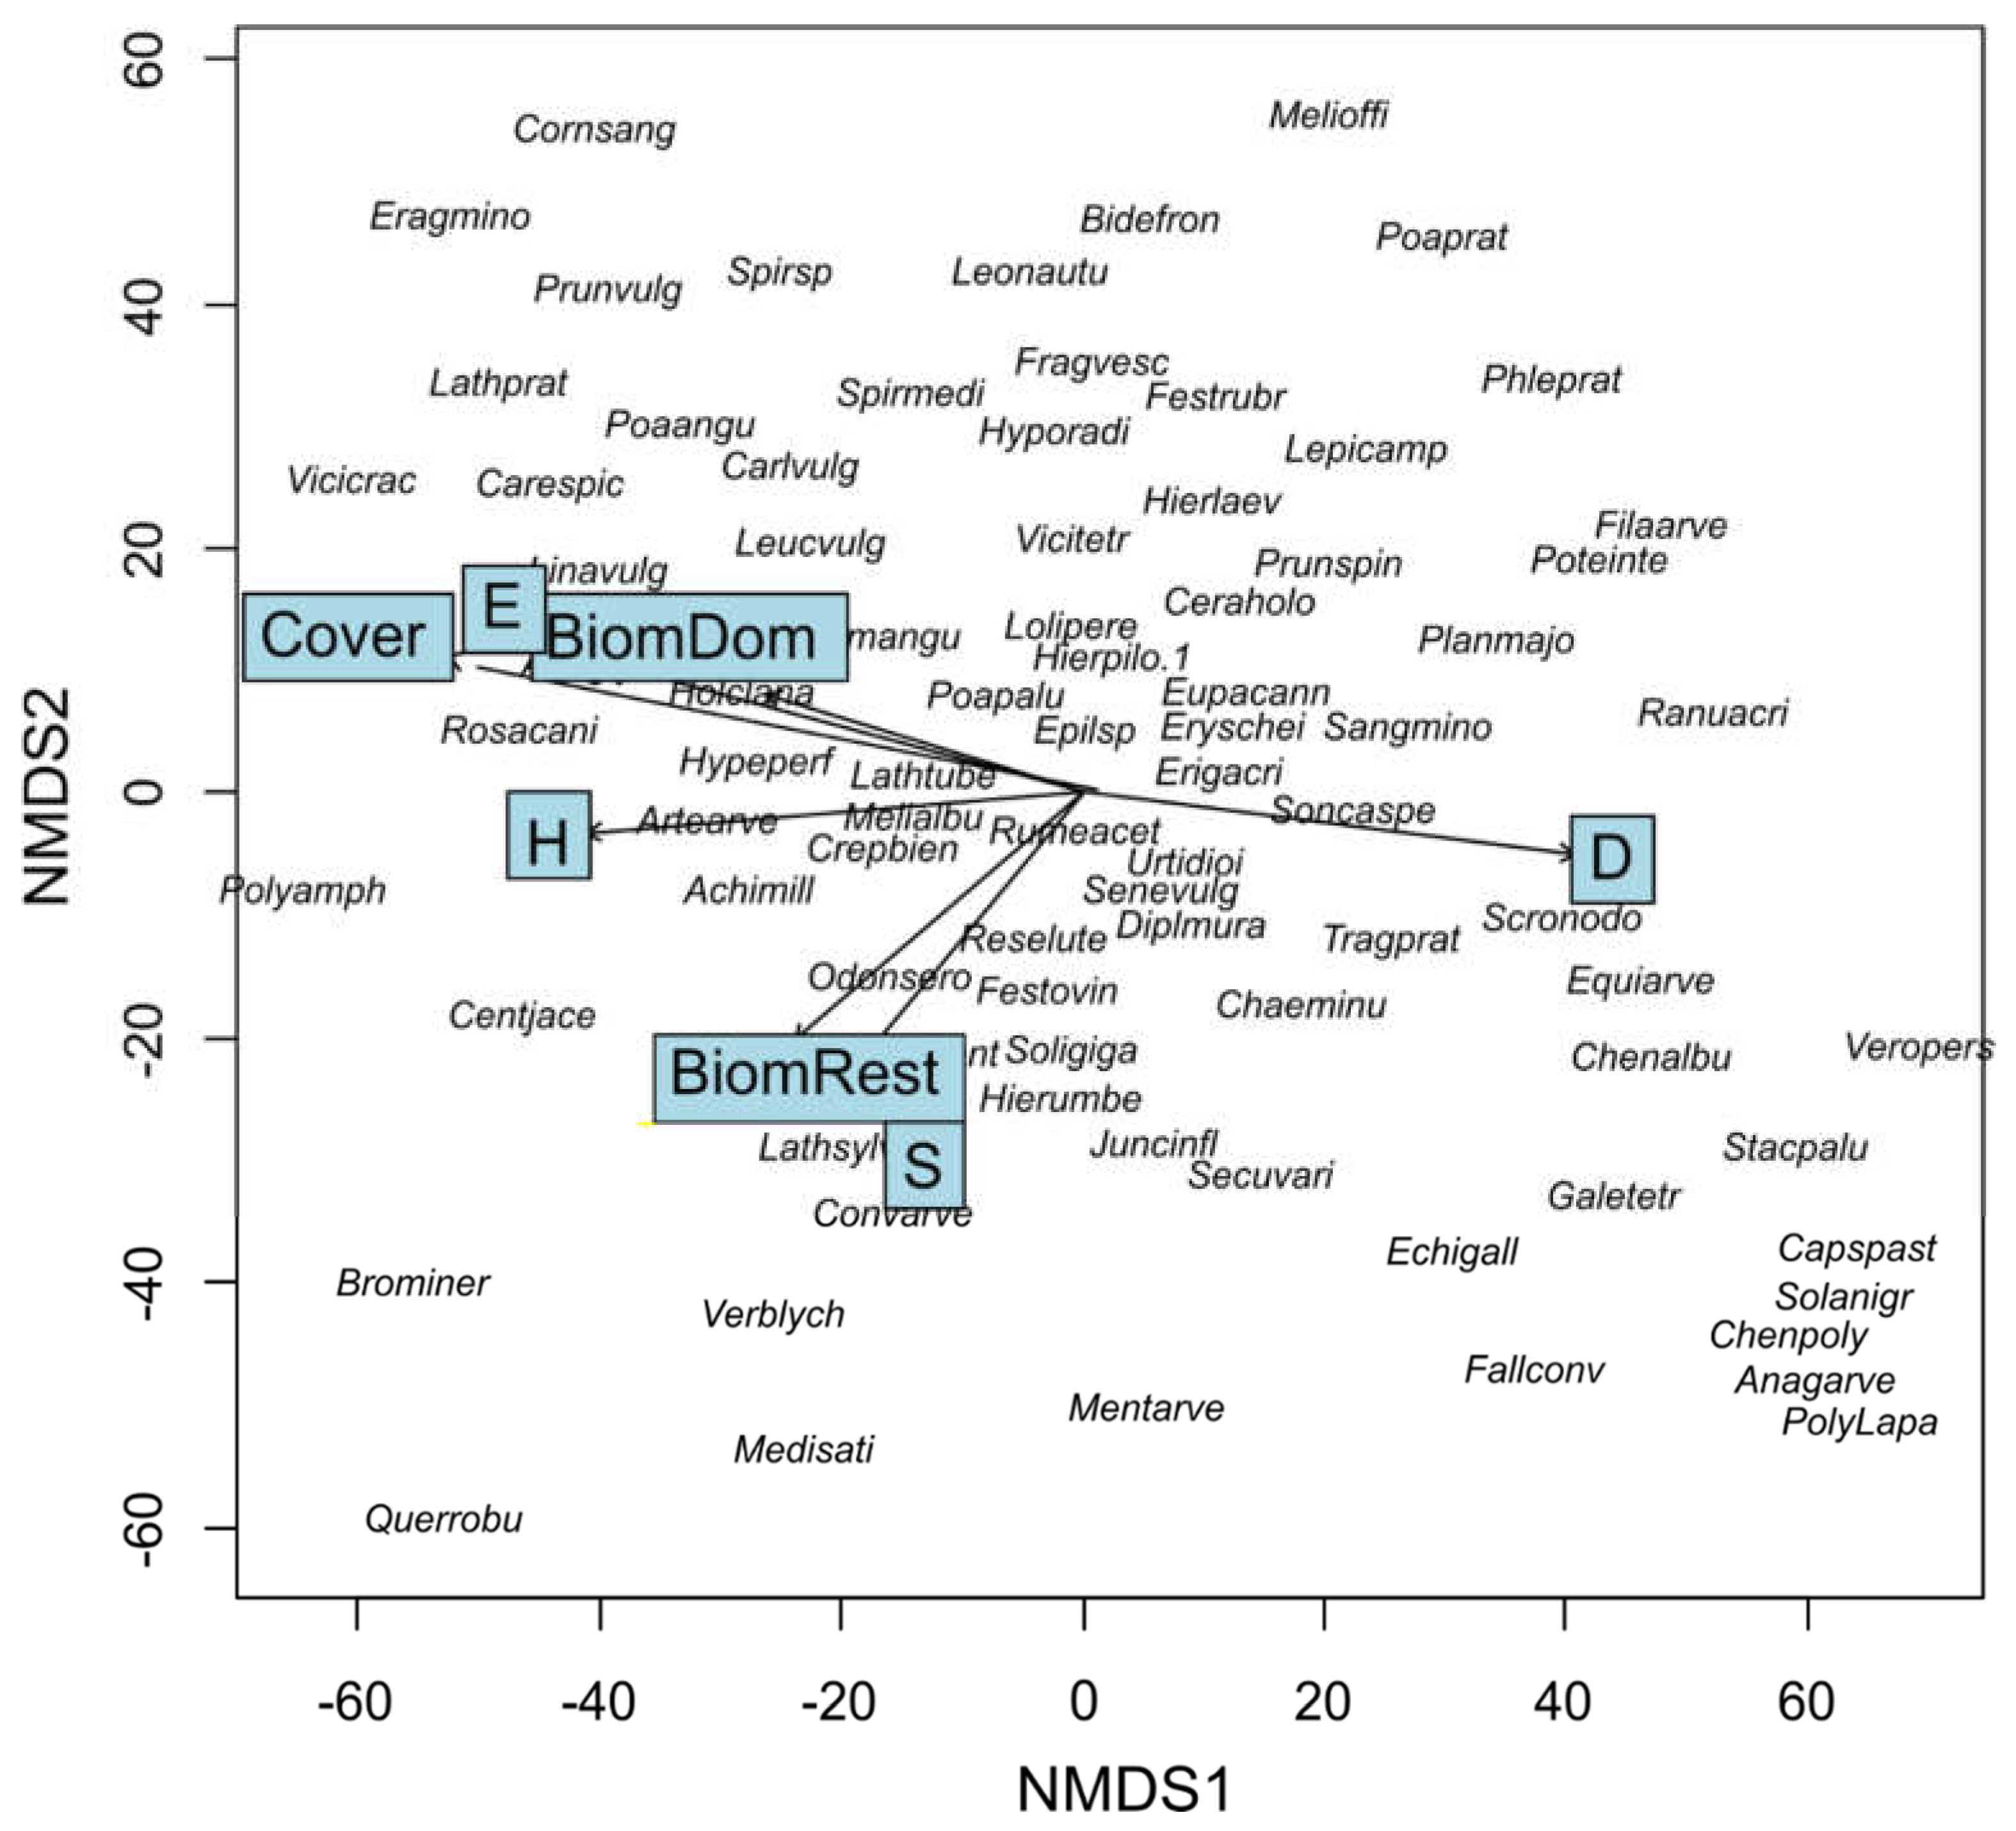
3. Results
4. Discussion
4.1. Plant Species Composition Diversity and the Amount of Biomass
4.2. The Relationship between the Amount of Biomass and the Soil Organic Matter (SOM) in the Studied Vegetation Types of Novel Ecosystems on Post-Black Coal Mine Heaps
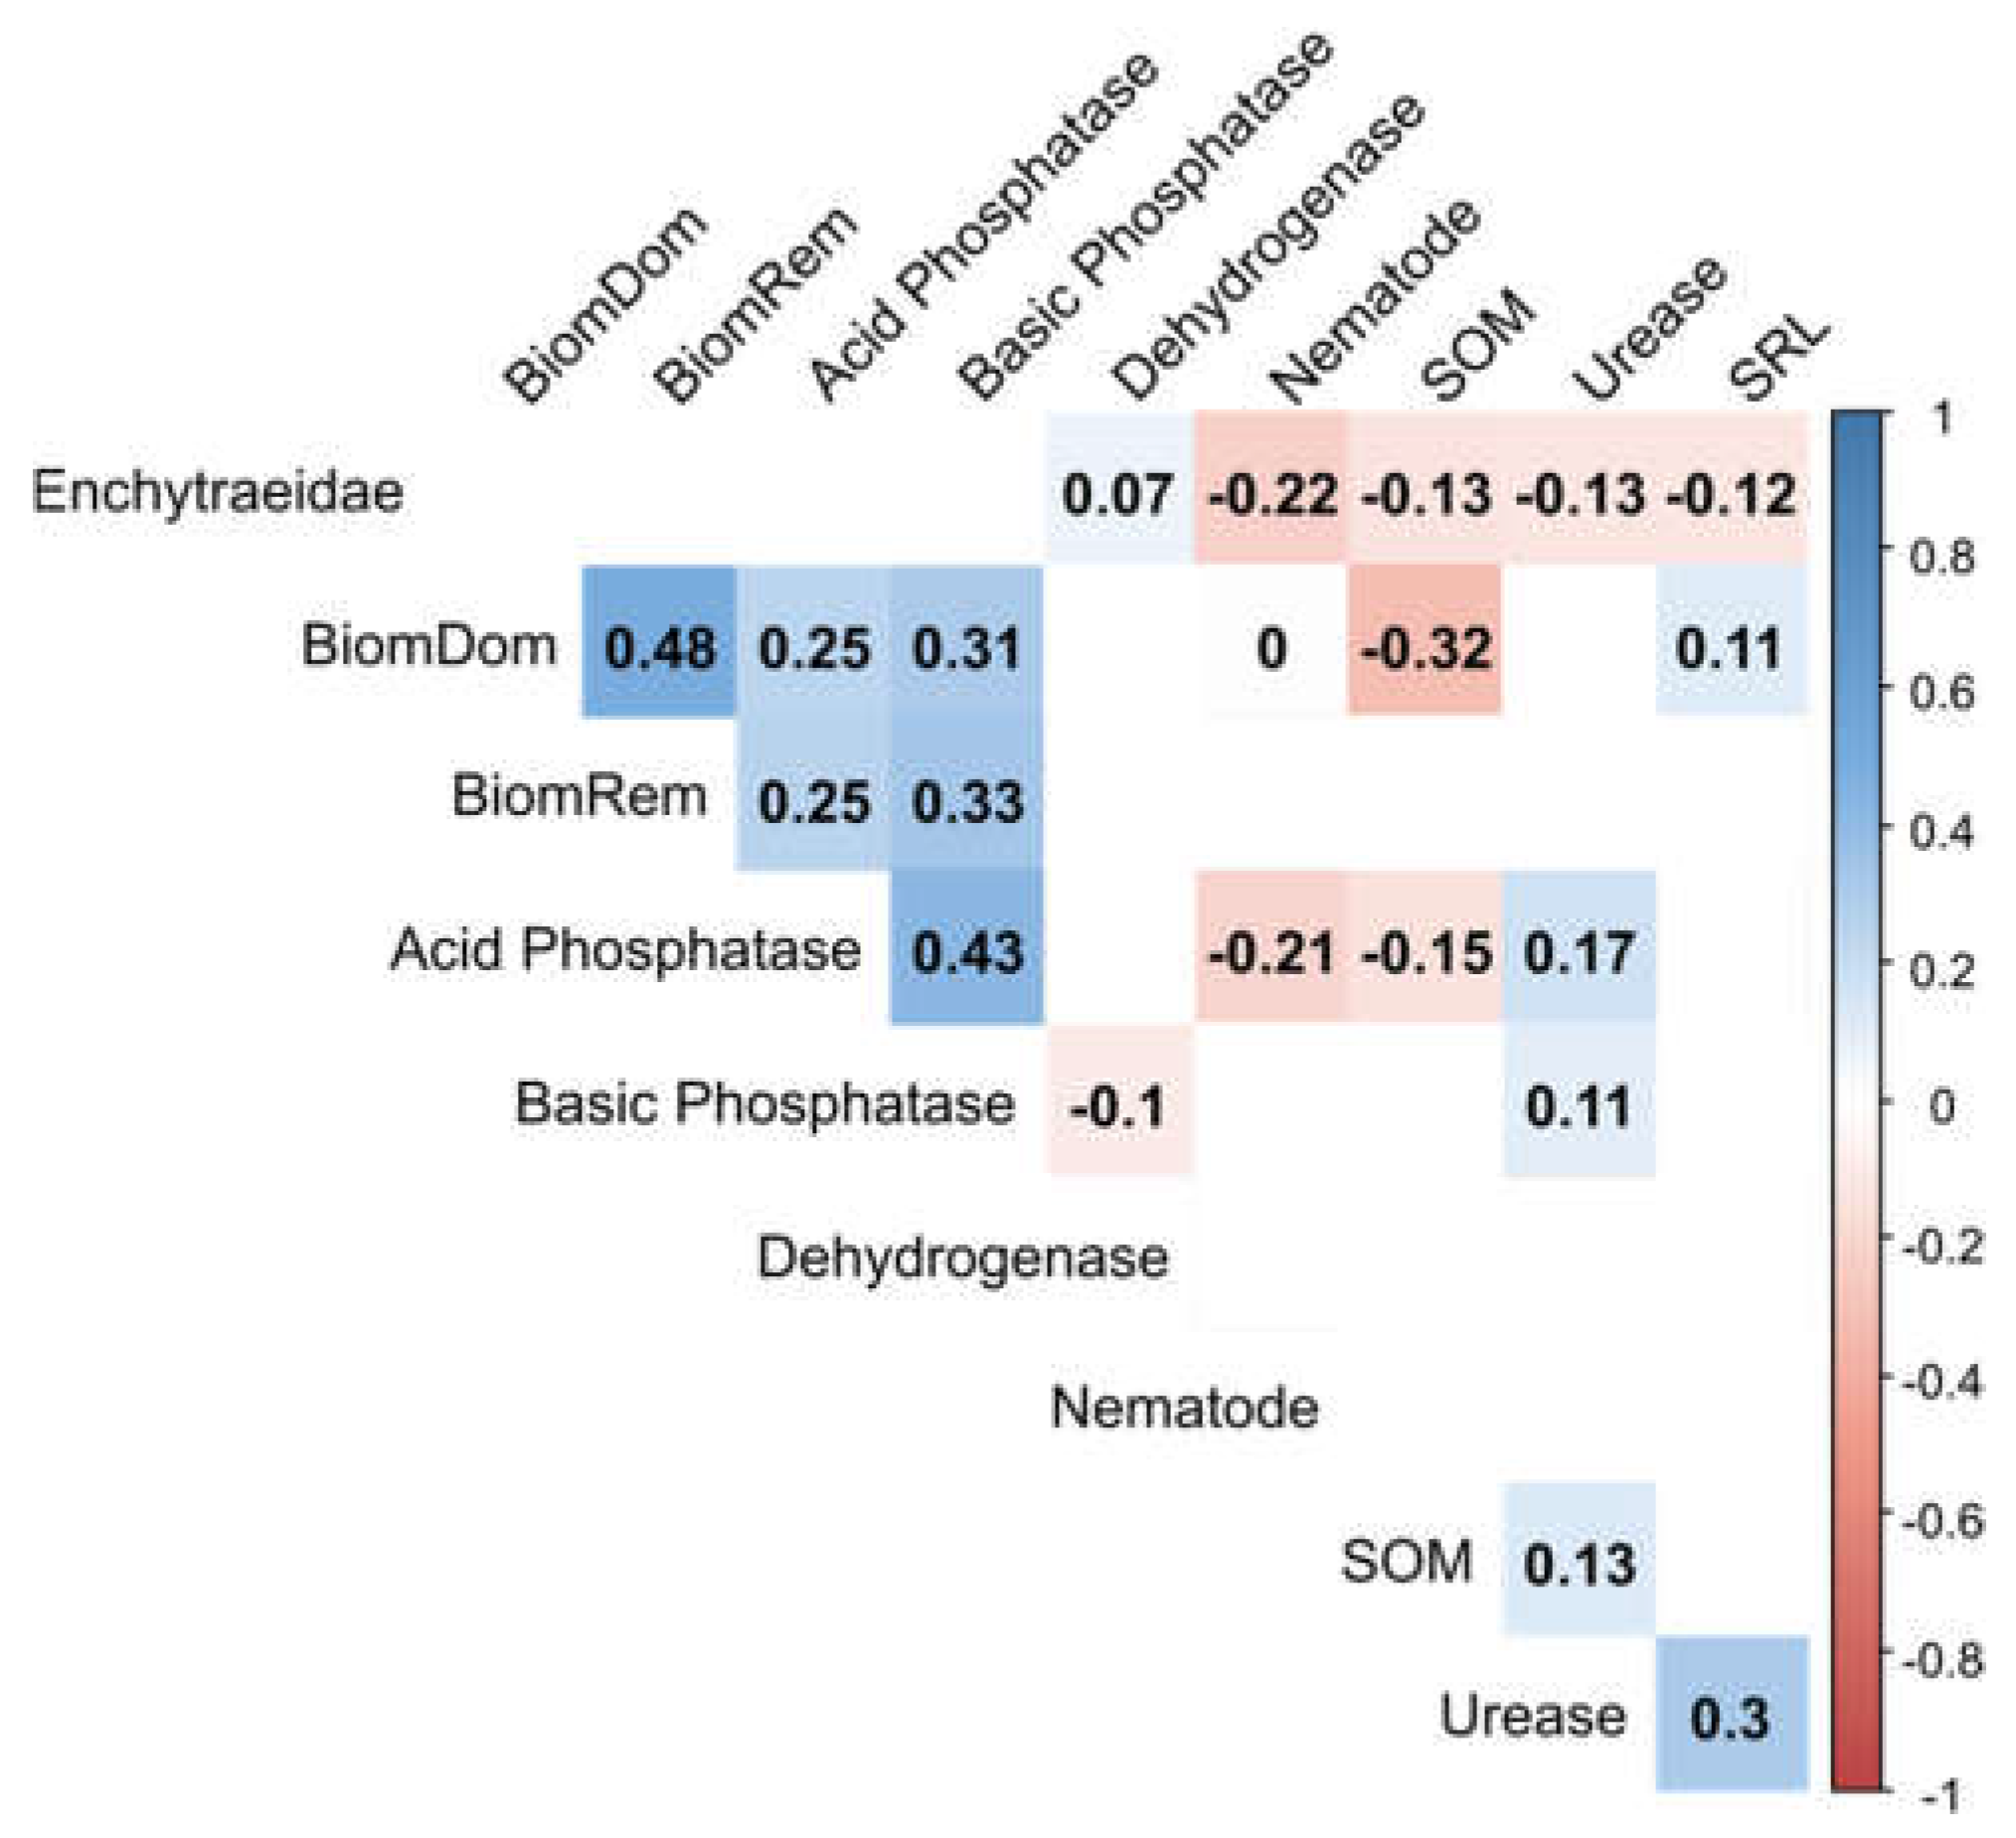
4.3. Soil Enzyme Activities and the Amount of Biomass
4.4. Soil Fauna Diversity and the Amount of Biomass in the Studied Vegetation Patches
4.5. The Amount of Biomass and Soil Respiration
4.6. Specific Habitat Conditions of Mine Heaps (The Low Albedo of Mineral Deposits)
4.7. The Understanding of the Biomass Relationships to the Biotic Conditions of Novel Ecosystems on Coal Mine Heaps
5. Conclusions
Author Contributions
Funding
Data Availability Statement
Conflicts of Interest
References
- Cardinale, B.J.; Wright, J.P.; Cadotte, M.W.; Carroll, I.T.; Hector, A.; Srivastava, D.S.; Loreau, M.; Weis, J.J. Impacts of Plant Diversity on Biomass Production Increase through Time Because of Species Complementarity. Proc. Natl. Acad. Sci. USA 2007, 104, 18123–18128. [Google Scholar] [CrossRef] [PubMed]
- Adler, P.B.; Seabloom, E.W.; Borer, E.T.; Hillebrand, H.; Hautier, Y.; Hector, A.; Stanley Harpole, W.; O’Halloran, L.R.; Grace, J.B.; Michael Anderson, T.; et al. Productivity Is a Poor Predictor of Plant Species Richness. Science 2011, 333, 1750–1753. [Google Scholar] [CrossRef] [PubMed]
- Naeem, S.; Håkansson, K.; Lawton, J.H.; Crawley, M.J.; Thompson, L.J.; Hakansson, K. Biodiversity and Plant Productivity in a Model Assemblage of Plant Species. Oikos 1996, 76, 259. [Google Scholar] [CrossRef]
- Tilman, D. The Ecological Consequences of Changes in Biodiversity: A Search for General Principles. Ecology 1999, 80, 1455. [Google Scholar] [CrossRef]
- Loreau, M.; Naeem, S.; Inchausti, P.; Bengtsson, J.; Grime, J.P.; Hector, A.; Hooper, D.U.; Huston, M.A.; Raffaelli, D.; Schmid, B.; et al. Biodiversity and Ecosystem Functioning: Current Knowledge and Future Challenges. Science 2001, 294, 804–808. [Google Scholar] [CrossRef] [PubMed]
- Morin, X.; Fahse, L.; Jactel, H.; Scherer-Lorenzen, M.; García-Valdés, R.; Bugmann, H. Long-Term Response of Forest Productivity to Climate Change Is Mostly Driven by Change in Tree Species Composition. Sci. Rep. 2018, 8, 5627. [Google Scholar] [CrossRef] [PubMed]
- Fraser, L.H.; Pither, J.; Jentsch, A.; Sternberg, M.; Zobel, M.; Askarizadeh, D.; Bartha, S.; Beierkuhnlein, C.; Bennett, J.A.; Bittel, A.; et al. Plant Ecology. Worldwide Evidence of a Unimodal Relationship between Productivity and Plant Species Richness. Science 2015, 349, 302–305. [Google Scholar] [CrossRef] [PubMed]
- Gross, K.; Cardinale, B.J. Does Species Richness Drive Community Production or Vice Versa? Reconciling Historical and Contemporary Paradigms in Competitive Communities. Am. Nat. 2007, 170, 207–220. [Google Scholar] [CrossRef] [PubMed]
- Wheeler, B.D.; Giller, K.E. Species Richness of Herbaceous Fen Vegetation in Broadland, Norfolk in Relation to the Quantity of Above-Ground Plant Material. J. Ecol. 1982, 70, 179. [Google Scholar] [CrossRef]
- Kelemen, A.; Török, P.; Valkó, O.; Miglécz, T.; Tóthmérész, B. Mechanisms Shaping Plant Biomass and Species Richness: Plant Strategies and Litter Effect in Alkali and Loess Grasslands. J. Veg. Sci. 2013, 24, 1195–1203. [Google Scholar] [CrossRef]
- Mittelbach, G.G.; Steiner, C.F.; Scheiner, S.M.; Gross, K.L.; Reynolds, H.L.; Waide, R.B.; Willig, M.R.; Dodson, S.I.; Gough, L. What Is the Observed Relationship between Species Richness and Productivity? Ecology 2001, 82, 2381–2396. [Google Scholar] [CrossRef]
- Cardinale, B.J.; Bennett, D.M.; Nelson, C.E.; Gross, K. Does Productivity Drive Diversity or Vice Versa? A Test of the Multivariate Productivity-Diversity Hypothesis in Streams. Ecology 2009, 90, 1227–1241. [Google Scholar] [CrossRef] [PubMed]
- Li, F.; Liu, M.; Li, Z.; Jiang, C.; Han, F.; Che, Y. Changes in Soil Microbial Biomass and Functional Diversity with a Nitrogen Gradient in Soil Columns. Appl. Soil Ecol. 2013, 64, 1–6. [Google Scholar] [CrossRef]
- Bowles, T.M.; Acosta-Martínez, V.; Calderón, F.; Jackson, L.E. Soil Enzyme Activities, Microbial Communities, and Carbon and Nitrogen Availability in Organic Agroecosystems across an Intensively-Managed Agricultural Landscape. Soil Biol. Biochem. 2014, 68, 252–262. [Google Scholar] [CrossRef]
- Kompała-Bąba, A.; Sierka, E.; Dyderski, M.K.; Bierza, W.; Magurno, F.; Besenyei, L.; Błońska, A.; Ryś, K.; Jagodziński, A.M.; Woźniak, G. Do the Dominant Plant Species Impact the Substrate and Vegetation Composition of Post-Coal Mining Spoil Heaps? Ecol. Eng. 2020, 143, 105685. [Google Scholar] [CrossRef]
- Wu, J.; Wang, H.; Li, G.; Ma, W.; Wu, J.; Gong, Y.; Xu, G. Vegetation Degradation Impacts Soil Nutrients and Enzyme Activities in Wet Meadow on the Qinghai-Tibet Plateau. Sci. Rep. 2020, 10, 21271. [Google Scholar] [CrossRef] [PubMed]
- Caldwell, B.A. Enzyme Activities as a Component of Soil Biodiversity: A Review. Pedobiologia 2005, 49, 637–644. [Google Scholar] [CrossRef]
- Wang, B.; Xue, S.; Liu, G.; Bin; Zhang, G.H.; Li, G.; Ren, Z.P. Changes in Soil Nutrient and Enzyme Activities under Different Vegetations in the Loess Plateau Area, Northwest China. Catena 2012, 92, 186–195. [Google Scholar] [CrossRef]
- Singh, D.K.; Kumar, S. Nitrate Reductase, Arginine Deaminase, Urease and Dehydrogenase Activities in Natural Soil (Ridges with Forest) and in Cotton Soil after Acetamiprid Treatments. Chemosphere 2008, 71, 412–418. [Google Scholar] [CrossRef]
- Frouz, J.; Prach, K.; Pižl, V.; Háněl, L.; Starý, J.; Tajovský, K.; Materna, J.; Balík, V.; Kalčík, J.; Řehounková, K. Interactions between Soil Development, Vegetation and Soil Fauna during Spontaneous Succession in Post Mining Sites. Eur. J. Soil Biol. 2008, 44, 109–121. [Google Scholar] [CrossRef]
- Wozniak, G.; Markowicz, A.; Borymski, S.; Piotrowska-Seget, Z.; Chmura, D.; Besenyei, L. The Relationship between Successional Vascular Plant Assemblages and Associated Microbial Communities on Coal Mine Spoil Heaps. Community Ecol. 2015, 16, 23–32. [Google Scholar] [CrossRef]
- Kompała-Bąba, A.; Bierza, W.; Sierka, E.; Błońska, A.; Besenyei, L.; Woźniak, G. The Role of Plants and Soil Properties in the Enzyme Activities of Substrates on Hard Coal Mine Spoil Heaps. Sci. Rep. 2021, 11, 5155. [Google Scholar] [CrossRef] [PubMed]
- Bierza, W.; Czarnecka, J.; Błońska, A.; Kompała-Bąba, A.; Hutniczak, A.; Jendrzejek, B.; Bakr, J.; Jagodziński, A.M.; Prostański, D.; Woźniak, G. Plant Diversity and Species Composition in Relation to Soil Enzymatic Activity in the Novel Ecosystems of Urban-Industrial Landscapes. Sustainability 2023, 15, 7284. [Google Scholar] [CrossRef]
- Blagodatskaya, E.; Blagodatsky, S.; Khomyakov, N.; Myachina, O.; Kuzyakov, Y. Temperature Sensitivity and Enzymatic Mechanisms of Soil Organic Matter Decomposition along an Altitudinal Gradient on Mount Kilimanjaro. Sci. Rep. 2016, 6, 22240. [Google Scholar] [CrossRef] [PubMed]
- Yao, Y.; Shao, M.; Fu, X.; Wang, X.; Wei, X. Effects of Shrubs on Soil Nutrients and Enzymatic Activities over a 0-100 Cm Soil Profile in the Desert-Loess Transition Zone. Catena 2018, 174, 362–370. [Google Scholar] [CrossRef]
- Bartkowiak, A.; Lemanowicz, J. Effect of Forest Fire on Changes in the Content of Total and Available Forms of Selected Heavy Metals and Catalase Activity in Soil. Soil Sci. Annu. 2017, 68, 140–148. [Google Scholar] [CrossRef]
- Chen, S.-K.; Edwards, C.A.; Subler, S. The Influence of Two Agricultural Biostimulants on Nitrogen Transformations, Microbial Activity, and Plant Growth in Soil Microcosms. Soil Biol. Biochem. 2003, 35, 9–19. [Google Scholar] [CrossRef]
- Baum, C.; Leinweber, P.; Schlichting, A. Effects of Chemical Conditions in Re-Wetted Peats on Temporal Variation in Microbial Biomass and Acid Phosphatase Activity within the Growing Season. Appl. Soil Ecol. 2003, 22, 167–174. [Google Scholar] [CrossRef]
- Štursová, M.; Baldrian, P. Effects of Soil Properties and Management on the Activity of Soil Organic Matter Transforming Enzymes and the Quantification of Soil-Bound and Free Activity. Plant Soil 2011, 338, 99–110. [Google Scholar] [CrossRef]
- Frouz, J.; Frouz, J. Effects of Change in Soil Substrate Quality, and Microbial Community Composition on the Plant Community during Primary Succession. In Proceedings of the 20th EGU General Assembly, Vienna, Austria, 4–13 April 2018; p. 5336. [Google Scholar]
- Hicks, L.C.; Rahman, M.M.; Carnol, M.; Verheyen, K.; Rousk, J. The Legacy of Mixed Planting and Precipitation Reduction Treatments on Soil Microbial Activity, Biomass and Community Composition in a Young Tree Plantation. Soil Biol. Biochem. 2018, 124, 227–235. [Google Scholar] [CrossRef]
- Bardgett, R.D.; van der Putten, W.H. Belowground Biodiversity and Ecosystem Functioning. Nature 2014, 515, 505–511. [Google Scholar] [CrossRef] [PubMed]
- Lavelle, P.; Bignell, D.; Lepage, M.; Wolters, V.; Roger, P.; Ineson, P.; Heal, O.W.; Dhillion, S. Soil Function in a Changing World: The Role of Invertebrate Ecosystem Engineers. Eur. J. Soil Biol. 1997, 33, 159–193. [Google Scholar]
- West, G.B.; Brown, J.H.; Enquist, B.J. The Fourth Dimension of Life: Fractal Geometry and Allometric Scaling of Organisms. Science 1999, 284, 1677–1679. [Google Scholar] [CrossRef] [PubMed]
- Reich, P.B.; Tjoelker, M.G.; Machado, J.L.; Oleksyn, J. Universal Scaling of Respiratory Metabolism, Size and Nitrogen in Plants. Nature 2006, 439, 457–461. [Google Scholar] [CrossRef] [PubMed]
- Reich, P.B.; Tjoelker, M.G.; Pregitzer, K.S.; Wright, I.J.; Oleksyn, J.; Machado, J.L. Scaling of Respiration to Nitrogen in Leaves, Stems and Roots of Higher Land Plants. Ecol. Lett. 2008, 11, 793–801. [Google Scholar] [CrossRef] [PubMed]
- Friedlingstein, P.; Meinshausen, M.; Arora, V.K.; Jones, C.D.; Anav, A.; Liddicoat, S.K.; Knutti, R. Uncertainties in CMIP5 Climate Projections Due to Carbon Cycle Feedbacks. J. Clim. 2014, 27, 511–526. [Google Scholar] [CrossRef]
- Collalti, A.; Tjoelker, M.G.; Hoch, G.; Mäkelä, A.; Guidolotti, G.; Heskel, M.; Petit, G.; Ryan, M.G.; Battipaglia, G.; Matteucci, G.; et al. Plant Respiration: Controlled by Photosynthesis or Biomass? Glob. Change Biol. 2020, 26, 1739–1753. [Google Scholar] [CrossRef]
- Kompala-Baba, A.; Bąba, W.; Kompała-Bąba, A. The Spontaneous Succession in a Sand-Pit-the Role of Life History Traits and Species Habitat Preferences. Pol. J. Ecol. 2013, 61, 13–22. [Google Scholar]
- Rahmonov, O.; Pukowiec-Kurda, K.; Banaszek, J.; Brom, K. Floristic Diversity in Selected City Parks in Southern Poland. Environ. Prot. Nat. Resour. 2020, 30, 8–17. [Google Scholar] [CrossRef]
- Aon, M.A.; Colaneri, A.C., II. Temporal and Spatial Evolution of Enzymatic Activities and Physico-Chemical Properties in an Agricultural Soil. Appl. Soil Ecol. 2001, 18, 255–270. [Google Scholar] [CrossRef]
- Baldrian, P.; Trögl, J.; Frouz, J.; Šnajdr, J.; Valášková, V.; Merhautová, V.; Cajthaml, T.; Herinková, J. Enzyme Activities and Microbial Biomass in Topsoil Layer during Spontaneous Succession in Spoil Heaps after Brown Coal Mining. Soil Biol. Biochem. 2008, 40, 2107–2115. [Google Scholar] [CrossRef]
- Yang, Z.X.; Liu, S.Q.; Zheng, D.W.; Feng, S.D. Effects of Cadium, Zinc and Lead on Soil Enzyme Activities. J. Environ. Sci. 2006, 18, 1135–1141. [Google Scholar] [CrossRef] [PubMed]
- Błońska, E.; Januszek, K. Usability of Enzyme Activity in Estimation of Forest Soil Quality. Folia For. Pol. 2013, 55, 18–26. [Google Scholar] [CrossRef]
- Heděnec, P.; Vindušková, O.; Kukla, J.; Šnajdr, J.; Baldrian, P.; Frouz, J. Enzyme Activity of Topsoil Layer on Reclaimed and Unreclaimed Post-Mining Sites. Biol. Commun. 2017, 62, 19–25. [Google Scholar] [CrossRef]
- Li, J.; Zhou, X.; Yan, J.; Li, H.; He, J. Effects of Regenerating Vegetation on Soil Enzyme Activity and Microbial Structure in Reclaimed Soils on a Surface Coal Mine Site. Appl. Soil Ecol. 2015, 87, 56–62. [Google Scholar] [CrossRef]
- Woźniak, G. Zróznnicowanie Roślinności Na Zwałach Pogórniczych Górnego śląska = Diversity of Vegetation on Coal-Mine Heaps of the Upper Silesia (Poland); Instytut Botaniki: Kraków, Poland, 2010. [Google Scholar]
- Woźniak, G.; Chmura, D.; Błońska, A.; Tokarska-Guzik, B.; Sierka, E. Applicability of Functional Groups Concept in Analysis of Spatiotemporal Vegetation Changes on Manmade Habitats. Pol. J. Environ. Stud. 2011, 20, 623–631. [Google Scholar]
- Błońska, A.; Kompała-Baba, A.; Sierka, E.; Bierza, W.; Magurno, F.; Besenyei, L.; Ryś, K.; Woźniak, G. Diversity of Vegetation Dominated by Selected Grass Species on Coal-Mine Spoil Heaps in Terms of Reclamation of Post-Industrial Areas. J. Ecol. Eng. 2019, 20, 209–217. [Google Scholar] [CrossRef]
- Keith, S.A.; Newton, A.C.; Herbert, R.J.H.; Morecroft, M.D.; Bealey, C.E. Non-Analogous Community Formation in Response to Climate Change. J. Nat. Conserv. 2009, 17, 228–235. [Google Scholar] [CrossRef]
- Tropek, R.; Kadlec, T.; Hejda, M.; Kocarek, P.; Skuhrovec, J.; Malenovsky, I.; Vodka, S.; Spitzer, L.; Banar, P.; Konvicka, M. Technical Reclamations Are Wasting the Conservation Potential of Post-Mining Sites. A Case Study of Black Coal Spoil Dumps. Ecol. Eng. 2012, 43, 13–18. [Google Scholar] [CrossRef]
- Hobbs, R.J.; Arico, S.; Aronson, J.; Baron, J.S.; Bridgewater, P.; Cramer, V.A.; Epstein, P.R.; Ewel, J.J.; Klink, C.A.; Lugo, A.E.; et al. Novel Ecosystems: Theoretical and Management Aspects of the New Ecological World Order. Glob. Ecol. Biogeogr. 2006, 15, 1–7. [Google Scholar] [CrossRef]
- Pełka-Gościniak, J.J. Plany Zagospodarowania Zwałowisk Odpadów Powęglowych KWK. Acta Geogr. Silesiana 2015, 18, 59–67. [Google Scholar]
- Galos, K.; Szlugaj, J. Management of Hard Coal Mining and Processing Wastes in Poland. Miner. Resour. Manag. 2014, 30, 51–64. [Google Scholar] [CrossRef]
- Markowicz, A.; Woźniak, G.; Borymski, S.; Piotrowska-Seget, Z.; Chmura, D. Links in the Functional Diversity between Soil Microorganisms and Plant Communities during Natural Succession in Coal Mine Spoil Heaps. Ecol. Res. 2015, 30, 1005–1014. [Google Scholar] [CrossRef]
- Schinner, F.; Ohlinger, R.; Kandeler, E.; Margesin, R. Methods in Soil Biology; Springer: Berlin/Heidelberg, Germany, 1996. [Google Scholar]
- Burmeier, H. Methods in Applied Soil Microbiology and Biochemistry: Bioremediation of Soil; Academic Press: Cambridge, MA, USA, 1995; ISBN 9780125138406. [Google Scholar]
- Whittaker, R.H.; Robert, H. Communities and Ecosystems; Macmillan: London, UK, 1970. [Google Scholar]
- Symonides, E. Floristic Richness, Diversity, Dominance and Species Evenness in Old-Field Succession Ecosystems. Ekol. Pol. 1985, 33, 61–79. [Google Scholar]
- Tilman, D. On the Meaning of Competition and the Mechanisms of Competitive Superiority. Funct. Ecol. 1987, 1, 304–315. [Google Scholar] [CrossRef]
- Grace, J.B.; Anderson, T.M.; Seabloom, E.W.; Borer, E.T.; Adler, P.B.; Harpole, W.S.; Hautier, Y.; Hillebrand, H.; Lind, E.M.; Pärtel, M.; et al. Integrative modelling reveals mechanisms linking productivity and plant species richness. Nature 2016, 529, 390–393. [Google Scholar] [CrossRef] [PubMed]
- Spehn, E.M.; Hector, A.; Joshi, J.; Scherer-Lorenzen, M.; Schmid, B.; Bazeley-White, E.; Beierkuhnlein, C.; Caldeira, M.C.; Diemer, M.; Dimitrakopoulos, P.G.; et al. Ecosystem Effects of Biodiversity Manipulations in European Grasslands. Ecol. Monogr. 2005, 75, 37–63. [Google Scholar] [CrossRef]
- Tilman, D.; Wedin, D.; Knops, J. Productivity and Sustainability Influenced by Biodiversity in Grassland Ecosystems. Nature 1996, 379, 718–720. [Google Scholar] [CrossRef]
- Van Ruijven, J.; Berendse, F. Diversity-Productivity Relationships: Initial Effects, Long-Term Patterns, and Underlying Mechanisms. Proc. Natl. Acad. Sci. USA 2005, 102, 695–700. [Google Scholar] [CrossRef]
- Sonkoly, J.; Kelemen, A.; Valkó, O.; Deák, B.; Kiss, R.; Tóth, K.; Miglécz, T.; Tóthmérész, B.; Török, P. Both Mass Ratio Effects and Community Diversity Drive Biomass Production in a Grassland Experiment. Sci. Rep. 2019, 9, 1848. [Google Scholar] [CrossRef]
- Hector, A. The Effect of Diversity on Productivity: Detecting the Role of Species Complementarity. Oikos 1998, 82, 597. [Google Scholar] [CrossRef]
- Kelemen, A.; Lazzaro, L.; Besnyői, V.; Albert, Á.-J.; Konečná, M.; Dobay, G.; Memelink, I.; Adamec, V.; Götzenberger, L.; de Bello, F.; et al. Net Outcome of Competition and Facilitation in a Wet Meadow Changes with Plant’s Life Stage and Community Productivity. Preslia 2015, 87, 347–361. [Google Scholar]
- Kelemen, A.; Török, P.; Valkó, O.; Deák, B.; Tóth, K.; Tóthmérész, B. Both Facilitation and Limiting Similarity Shape the Species Coexistence in Dry Alkali Grasslands. Ecol. Complex. 2015, 21, 34–38. [Google Scholar] [CrossRef]
- Loreau, M. Separating Sampling and Other Effects in Biodiversity Experiments. Oikos 1998, 82, 600. [Google Scholar] [CrossRef]
- Leps, J.; de Bello, F.; Lavorel, S.; Berman, S. Quantifying and Interpreting Functional Diversity of Natural Communities: Practical Considerations Matter. Preslia 2006, 78, 481–501. [Google Scholar]
- Roscher, C.; Temperton, V.M.; Scherer-Lorenzen, M.; Schmitz, M.; Schumacher, J.; Schmid, B.; Buchmann, N.; Weisser, W.W.; Schulze, E.D. Overyielding in Experimental Grassland Communities—Irrespective of Species Pool or Spatial Scale. Ecol. Lett. 2005, 8, 419–429. [Google Scholar] [CrossRef]
- Hector, A.; Schmid, B.; Beierkuhnlein, C.; Caldeira, M.C.; Diemer, M.; Dimitrakopoulos, P.G.; Finn, J.A.; Freitas, H.; Giller, P.S.; Good, J.; et al. Plant Diversity and Productivity Experiments in European Grasslands. Science 1999, 286, 1123–1127. [Google Scholar] [CrossRef] [PubMed]
- Tilman, D.; Reich, P.B.; Knops, J.; Wedin, D.; Mielke, T.; Lehman, C. Diversity and Productivity in a Long-Term Grassland Experiment. Science 2001, 294, 843–845. [Google Scholar] [CrossRef]
- Pesiu, E.; Lee, G.E.; Salam, M.R.; Salim, J.M.; Lau, K.H.; Yong, J.W.H.; Abdullah, M.T. Species Composition, Diversity, and Biomass Estimation in Coastal and Marine Protected Areas of Terengganu, Peninsular Malaysia. Agronomy 2022, 12, 2380. [Google Scholar] [CrossRef]
- Heng, R.K.; Tsai, L.M. An Estimate of Forest Biomass in Ayer Hitam Forest Reserve. Pertanika J. Trop. Agric. Sci. 1999, 22, 117–123. [Google Scholar]
- Hikmat, A. Biomass Estimation, Carbon Storage and Energy Content of Three Virgin Jungle Reserves in Peninsular Malaysia. Media Konserv. 2005, 10, 231430. [Google Scholar] [CrossRef]
- Kowarik, I. Novel Urban Ecosystems, Biodiversity, and Conservation. Environ. Pollut. 2011, 159, 1974–1983. [Google Scholar] [CrossRef] [PubMed]
- Milewska-Hendel, A.; Chmura, D.; Wyrwał, K.; Kurczyńska, E.U.; Kompała-Bąba, A.; Jagodziński, A.M.; Woźniak, G. Cell Wall Epitopes in Grasses of Different Novel Ecosystem Habitats on Post-Industrial Sites. Land Degrad. Dev. 2021, 32, 1680–1694. [Google Scholar] [CrossRef]
- German, D.P.; Marcelo, K.R.B.; Stone, M.M.; Allison Allison, S.D. The Michaelis-Menten Kinetics of Soil Extracellular Enzymes in Response to Temperature: A Cross-Latitudinal Study. Glob. Chang. Biol. 2012, 18, 1468–1479. [Google Scholar] [CrossRef]
- Liljedahl, A.K.; Boike, J.; Daanen, R.P.; Fedorov, A.N.; Frost, G.V.; Grosse, G.; Hinzman, L.D.; Iijma, Y.; Jorgenson, J.C.; Matveyeva, N.; et al. Pan-Arctic Ice-Wedge Degradation in Warming Permafrost and Its Influence on Tundra Hydrology. Nat. Geosci. 2016, 9, 312–318. [Google Scholar] [CrossRef]
- Hao, L.; Pan, C.; Fang, D.; Zhang, X.; Zhou, D.; Liu, P.; Liu, Y.; Sun, G. Quantifying the Effects of Overgrazing on Mountainous Watershed Vegetation Dynamics under a Changing Climate. Sci. Total Environ. 2018, 639, 1408–1420. [Google Scholar] [CrossRef] [PubMed]
- Wen, L.; Dong, S.; Li, Y.; Wang, X.; Li, X.; Shi, J.; Dong, Q. The Impact of Land Degradation on the C Pools in Alpine Grasslands of the Qinghai-Tibet Plateau. Plant Soil 2013, 368, 329–340. [Google Scholar] [CrossRef]
- Zhang, W.Y.; Yao, D.X.; Zhang, Z.G.; Yang, Q.; Zhao, K.; An, S.K. Characteristics of Soil Enzymes and the Dominant Species of Repair Trees in the Reclamation of Coal Mine Area. J. Coal Sci. Eng. 2013, 19, 256–261. [Google Scholar] [CrossRef]
- Zhang, W.; Xue, X.; Peng, F.; You, Q.; Hao, A. Meta-Analysis of the Effects of Grassland Degradation on Plant and Soil Properties in the Alpine Meadows of the Qinghai-Tibetan Plateau. Glob. Ecol. Conserv. 2019, 20. [Google Scholar] [CrossRef]
- Che, R.; Wang, F.; Wang, W.; Zhang, J.; Zhao, X.; Rui, Y.; Xu, Z.; Wang, Y.; Hao, Y.; Cui, X. Increase in Ammonia-Oxidizing Microbe Abundance during Degradation of Alpine Meadows May Lead to Greater Soil Nitrogen Loss. Biogeochemistry 2017, 136, 341–352. [Google Scholar] [CrossRef]
- Tietjen, B.; Schlaepfer, D.R.; Bradford, J.B.; Lauenroth, W.K.; Hall, S.A.; Duniway, M.C.; Hochstrasser, T.; Jia, G.; Munson, S.M.; Pyke, D.A.; et al. Climate Change-Induced Vegetation Shifts Lead to More Ecological Droughts despite Projected Rainfall Increases in Many Global Temperate Drylands. Glob. Chang. Biol. 2017, 23, 2743–2754. [Google Scholar] [CrossRef] [PubMed]
- Körschens, M. Importance of Soil Organic Matter (SOM) for Biomass Production and Environment (a Review). Arch. Agron. Soil Sci. 2002, 21, 89–94. [Google Scholar] [CrossRef]
- Franko, U. Modellierung Des Umsatzes Der Organischen Bodensubstanz. Arch. Agron. Soil Sci. 1997, 41, 527–547. [Google Scholar] [CrossRef]
- Körschens, M. Abhängigkeit Der Organischen Bodensubstanz (OBS) von Standort Und Bewirtschaftung Sowie Ihr Einfluss Auf Ertrag Und Bodeneigenschaften. Arch. Agron. Soil. Sci. 1997, 41, 435–463. [Google Scholar] [CrossRef]
- Wolińska, A.; Stępniewska, Z. Dehydrogenase Activity in the Soil Environment. Dehydrogenases 2012, 10, 183–210. [Google Scholar] [CrossRef]
- Chodak, M.; Niklińska, M. Effect of Texture and Tree Species on Microbial Properties of Mine Soils. Appl. Soil Ecol. 2010, 46, 268–275. [Google Scholar] [CrossRef]
- Ciarkowska, K.; Sołek-Podwika, K.; Wieczorek, J. Enzyme Activity as an Indicator of Soil-Rehabilitation Processes at a Zinc and Lead Ore Mining and Processing Area. J. Environ. Manag. 2014, 132, 250–256. [Google Scholar] [CrossRef]
- Loinaz, G.R.; Onaindia, M.; Amezaga, I.; Mijangos, I.; Garbisu, C. Relationship between Vegetation Diversity and Soil Functional Diversity in Native Mixed-Oak Forests. Soil. Biol. Biochem. 2008, 40, 49–60. [Google Scholar] [CrossRef]
- Šantrůčková, H.; Vrba, J.; Picek, T.; Kopáček, J. Soil Biochemical Activity and Phosphorus Transformations and Losses from Acidified Forest Soils. Soil Biol. Biochem. 2004, 36, 1569–1576. [Google Scholar] [CrossRef]
- Abakumov, E.; Frouz, J. Humus Accumulation and Humification during Soil Development in Post-Mining Soil. In Soil Biota and Ecosystem Development in Post Mining Sites; CRC Press: Boca Raton, FL, USA, 2013; pp. 19–37. [Google Scholar] [CrossRef]
- Stefanowicz, A.M.; Kapusta, P.; Błońska, A.; Kompała-Baba, A.; Woźniak, G. Effects of Calamagrostis Epigejos, Chamaenerion Palustre and Tussilago Farfara on Nutrient Availability and Microbial Activity in the Surface Layer of Spoil Heaps after Hard Coal Mining. Ecol. Eng. 2015, 83, 328–337. [Google Scholar] [CrossRef]
- Hooper, D.U.; Chapin, F.S.; Ewel, J.J.; Hector, A.; Inchausti, P.; Lavorel, S.; Lawton, J.H.; Lodge, D.M.; Loreau, M.; Naeem, S.; et al. Effects of biodiversity on ecosystem functioning: A consensus of current knowledge. Ecol. Monogr. 2005, 75, 3–35. [Google Scholar] [CrossRef]
- Lauber, C.L.; Hamady, M.; Knight, R.; Fierer, N. Pyrosequencing-Based Assessment of Soil PH as a Predictor of Soil Bacterial Community Structure at the Continental Scale. Appl. Environ. Microbiol. 2009, 75, 5111–5120. [Google Scholar] [CrossRef] [PubMed]
- Frouz, J.; Roubíčková, A.; Heděnec, P.; Tajovský, K. Do Soil Fauna Really Hasten Litter Decomposition? A Meta-Analysis of Enclosure Studies. Eur. J. Soil Biol. 2015, 68, 18–24. [Google Scholar] [CrossRef]
- Schmidt, M.W.I.; Torn, M.S.; Abiven, S.; Dittmar, T.; Guggenberger, G.; Janssens, I.A.; Kleber, M.; Kögel-Knabner, I.; Lehmann, J.; Manning, D.A.C.; et al. Persistence of Soil Organic Matter as an Ecosystem Property. Nature 2011, 478, 49–56. [Google Scholar] [CrossRef] [PubMed]
- García-Palacios, P.; Maestre, F.T.; Kattge, J.; Wall, D.H. Climate and Litter Quality Differently Modulate the Effects of Soil Fauna on Litter Decomposition across Biomes. Ecol. Lett. 2013, 16, 1045–1053. [Google Scholar] [CrossRef] [PubMed]
- Wardle, D.A.; Bardgett, R.D.; Klironomos, J.N.; Setälä, H.; Van Der Putten, W.H.; Wall, D.H. Ecological Linkages Between Aboveground and Belowground Biota. Science 2004, 304, 1629–1633. [Google Scholar] [CrossRef] [PubMed]
- Dominati, E.; Patterson, M.; Mackay, A. A Framework for Classifying and Quantifying the Natural Capital and Ecosystem Services of Soils. Ecol. Econ. 2010, 69, 1858–1868. [Google Scholar] [CrossRef]
- Hättenschwiler, S.; Gasser, P. Soil Animals Alter Plant Litter Diversity Effects on Decomposition. Proc. Natl. Acad. Sci. USA 2005, 102, 1519–1524. [Google Scholar] [CrossRef]
- Meier, C.L.; Bowman, W.D. Links between Plant Litter Chemistry, Species Diversity, and below-Ground Ecosystem Function. Proc. Natl. Acad. Sci. USA 2008, 105, 19780–19785. [Google Scholar] [CrossRef]
- McCay, T.S.; Cardelús, C.L.; Neatrour, M.A. Rate of Litter Decay and Litter Macroinvertebrates in Limed and Unlimed Forests of the Adirondack Mountains, USA. For. Ecol. Manag. 2013, 304, 254–260. [Google Scholar] [CrossRef]
- Lützow, M.V.; Kögel-Knabner, I.; Ekschmitt, K.; Matzner, E.; Guggenberger, G.; Marschner, B.; Flessa, H. Stabilization of Organic Matter in Temperate Soils: Mechanisms and Their Relevance under Different Soil Conditions—A Review. Eur. J. Soil Sci. 2006, 57, 426–445. [Google Scholar] [CrossRef]
- Anderson, J.M.; Ineson, P. Interactions between Microorganisms and Soil Invertebrates in Nutrient Flux Pathways of Forest Ecosystems. Symposium Series-British Mycological Society; Cambridge University Press: Cambridge, UK, 1984. [Google Scholar]
- Aubert, M.; Margerie, P.; Trap, J.; Bureau, F. Aboveground-Belowground Relationships in Temperate Forests: Plant Litter Composes and Microbiota Orchestrates. For. Ecol. Manag. 2010, 259, 563–572. [Google Scholar] [CrossRef]
- Frouz, J.; Šimek, M. Short Term and Long Term Effects of Bibionid (Diptera: Bibionidae) Larvae Feeding on Microbial Respiration and Alder Litter Decomposition. Eur. J. Soil Biol. 2009, 45, 192–197. [Google Scholar] [CrossRef]
- Lavelle, P.; Martin, A. Small-scale and large-scale effects of endogeic earthworms on soil organic matter dynamics in soils of the humid tropics. Soil Biol. Biochem. 1992, 24, 1491–1498. [Google Scholar] [CrossRef]
- Kaneda, S.; Frouz, J.; Baldrian, P.; Cajthaml, T.; Krištůfek, V. Does the Addition of Leaf Litter Affect Soil Respiration in the Same Way as Addition of Macrofauna Excrements (of Bibio Marci Diptera Larvae) Produced from the Same Litter? Appl. Soil Ecol. 2013, 72, 7–13. [Google Scholar] [CrossRef]
- Bohlen, P.J.; Scheu, S.; Hale, C.M.; McLean, M.A.; Migge, S.; Groffman, P.M.; Parkinson, D. Non-Native Invasive Earthworms as Agents of Change in Northern Temperate Forests. Front. Ecol. Environ. 2004, 2, 427. [Google Scholar] [CrossRef]
- Hartley, I.P.; Armstrong, A.F.; Murthy, R.; Barron-Gafford, G.; Ineson, P.; Atkin, O.K. The Dependence of Respiration on Photosynthetic Substrate Supply and Temperature: Integrating Leaf, Soil and Ecosystem Measurements. Glob. Change Biol. 2006, 12, 1954–1968. [Google Scholar] [CrossRef]
- Högberg, P.; Read, D.J. Towards a More Plant Physiological Perspective on Soil Ecology. Trends Ecol. Evol. 2006, 21, 548–554. [Google Scholar] [CrossRef]
- Neff, J.C.; Hooper, D.U. Vegetation and Climate Controls on Potential CO2, DOC and DON Production in Northern Latitude Soils. Glob. Change Biol. 2002, 8, 872–884. [Google Scholar] [CrossRef]
- Subke, J.A.; Bahn, M. On the “temperature Sensitivity” of Soil Respiration: Can We Use the Immeasurable to Predict the Unknown? Soil Biol. Biochem. 2010, 42, 1653–1656. [Google Scholar] [CrossRef]
- Reichstein, M.; Kätterer, T.; Andrén, O.; Ciais, P.; Schulze, E.-D.; Cramer, W.; Papale, D.; Valentini, R. Temperature Sensitivity of Decomposition in Relation to Soil Organic Matter Pools: Critique and Outlook. Biogeosciences 2005, 2, 317–321. [Google Scholar] [CrossRef]
- Frouz, J.; Nováková, A. Development of Soil Microbial Properties in Topsoil Layer during Spontaneous Succession in Heaps after Brown Coal Mining in Relation to Humus Microstructure Development. Geoderma 2005, 129, 54–64. [Google Scholar] [CrossRef]
- Kałucka, I.L.; Jagodziński, A.M. Successional Traits of Ectomycorrhizal Fungi in Forest Reclamation after Surface Mining and Agricultural Disturbances: A Review. Dendrobiology 2016, 76, 91–104. [Google Scholar] [CrossRef]
- Hobbs, R.J.; Higgs, E.S.; Hall, C.M. (Eds.) Novel Ecosystems: Intervening in the New Ecological World Order; John Wiley & Sons, Ltd.: Hoboken, NJ, USA, 2013; pp. 1–368. [Google Scholar] [CrossRef]
- Novák, J.; Prach, K. Vegetation Succession in Basalt Quarries: Pattern on a Landscape Scale. Appl. Veg. Sci. 2003, 6, 111–116. [Google Scholar] [CrossRef]
- Woźniak, G.; Jagodziński, A.M. Post-Mineral Excavation Sites as Novel Ecosystems and Examples of Socio-Environmental Resilience. In Green Scenarios: Mining Industry Responses to Environmental Challenges of the Anthropocene Epoch; CRC Press: Boca Raton, FL, USA, 2022; pp. 57–68. [Google Scholar] [CrossRef]
- Woźniak, G.; Chmura, D.; Małkowski, E.; Zieleźnik-Rusinowska, P.; Sitko, K.; Ziemer, B.; Błońska, A. Is the Age of Novel Ecosystem the Factor Driving Arbuscular Mycorrhizal Colonization in Poa Compressa and Calamagrostis Epigejos? Plants 2021, 10, 949. [Google Scholar] [CrossRef] [PubMed]
- Chmura, D.; Jagodziński, A.M.; Hutniczak, A.; Dyczko, A.; Woźniak, G. Novel Ecosystems in the Urban-Industrial Landscape-Interesting Aspects of Environmental Knowledge Requiring Broadening: A Review. Sustainability 2022, 14, 10829. [Google Scholar] [CrossRef]
- Błońska, A.; Chmura, D.; Hutniczak, A.; Wilczek, Z.; Jarosz, J.; Besenyei, L.; Woźniak, G. The Plant Species Composition of an Abandoned Meadow as an Element of an Ecosystem Mosaic within an Urban-Industrial Landscape. Sustainability 2022, 14, 11851. [Google Scholar] [CrossRef]
- Morse, N.B.; Pellissier, P.A.; Cianciola, E.N.; Brereton, R.L.; Sullivan, M.M.; Shonka, N.K.; Wheeler, T.B.; McDowell, W.H. Novel Ecosystems in the Anthropocene: A Revision of the Novel Ecosystem Concept for Pragmatic Applications. Ecol. Soc. 2014, 19, 12. [Google Scholar] [CrossRef]
- Woźniak, G.; Malicka, M.; Kasztowski, J.; Radosz, Ł.; Czarnecka, J.; Vangronsveld, J.; Prostański, D. How Important Are the Relations between Vegetation Diversity and Bacterial Functional Diversity for the Functioning of Novel Ecosystems? Sustainability 2023, 15, 678. [Google Scholar] [CrossRef]


| Species | Dominant Cluster | Indicator Value | Probability |
|---|---|---|---|
| Chamaenerion palustre | 2 | 0.1882 | 0.008 |
| Echium vulgare | 3 | 0.1974 | 0.003 |
| Arrhenatherum elatius | 5 | 0.1221 | 0.04 |
| Trifolium arvense | 6 | 0.2004 | 0.002 |
| Symphytum officinale | 6 | 0.1263 | 0.005 |
| Trifolium pratense | 7 | 0.2591 | 0.001 |
| Taraxacum officinale | 7 | 0.2397 | 0.001 |
| Erigeron acris | 7 | 0.1095 | 0.02 |
| Crepis biennis | 8 | 0.1371 | 0.013 |
| Poa palustris | 9 | 0.3227 | 0.001 |
| Bidens frondosa | 9 | 0.1333 | 0.007 |
| Lathyrus sylvestris | 9 | 0.1333 | 0.011 |
| Phalaris arundinacea | 9 | 0.1125 | 0.012 |
| Urtica dioica | 9 | 0.1081 | 0.034 |
| Agrostis gigantea | 9 | 0.1043 | 0.042 |
| Plantago major | 9 | 0.0988 | 0.047 |
| Erigeron annuus | 10 | 0.2691 | 0.001 |
| Achillea millefolium | 10 | 0.2657 | 0.001 |
| Plantago lanceolata | 10 | 0.1828 | 0.003 |
| Tanacetum vulgare | 11 | 0.167 | 0.005 |
| Hypericum perforatum | 11 | 0.1565 | 0.006 |
| Carex spicata | 11 | 0.1333 | 0.011 |
| Astragalus glycyphyllos | 11 | 0.1325 | 0.015 |
| Deschampsia caespitosa | 11 | 0.1151 | 0.025 |
| Melandrium album | 11 | 0.1 | 0.044 |
| Tripleurospermum inodorum | 12 | 0.8519 | 0.001 |
| Polygonum aviculare | 12 | 0.5694 | 0.001 |
| Cirsium vulgare | 12 | 0.1842 | 0.005 |
| Senecio viscosus | 12 | 0.1603 | 0.011 |
| Capsella bursa pastoris | 12 | 0.1364 | 0.012 |
| Solanum nigrum | 12 | 0.1364 | 0.011 |
| Lepidium ruderale | 12 | 0.1297 | 0.014 |
| Stachys palustris | 12 | 0.1214 | 0.012 |
| Echinochloa crus galli | 12 | 0.1108 | 0.027 |
| Conyza canadensis | 12 | 0.1059 | 0.043 |
| Chenopodium album | 12 | 0.0861 | 0.044 |
| Tussilago farfara | 13 | 0.8582 | 0.001 |
| Species | CE | CR | CP | DC | EP | F | LC | MA | PA | PC | SG | TI | TF |
|---|---|---|---|---|---|---|---|---|---|---|---|---|---|
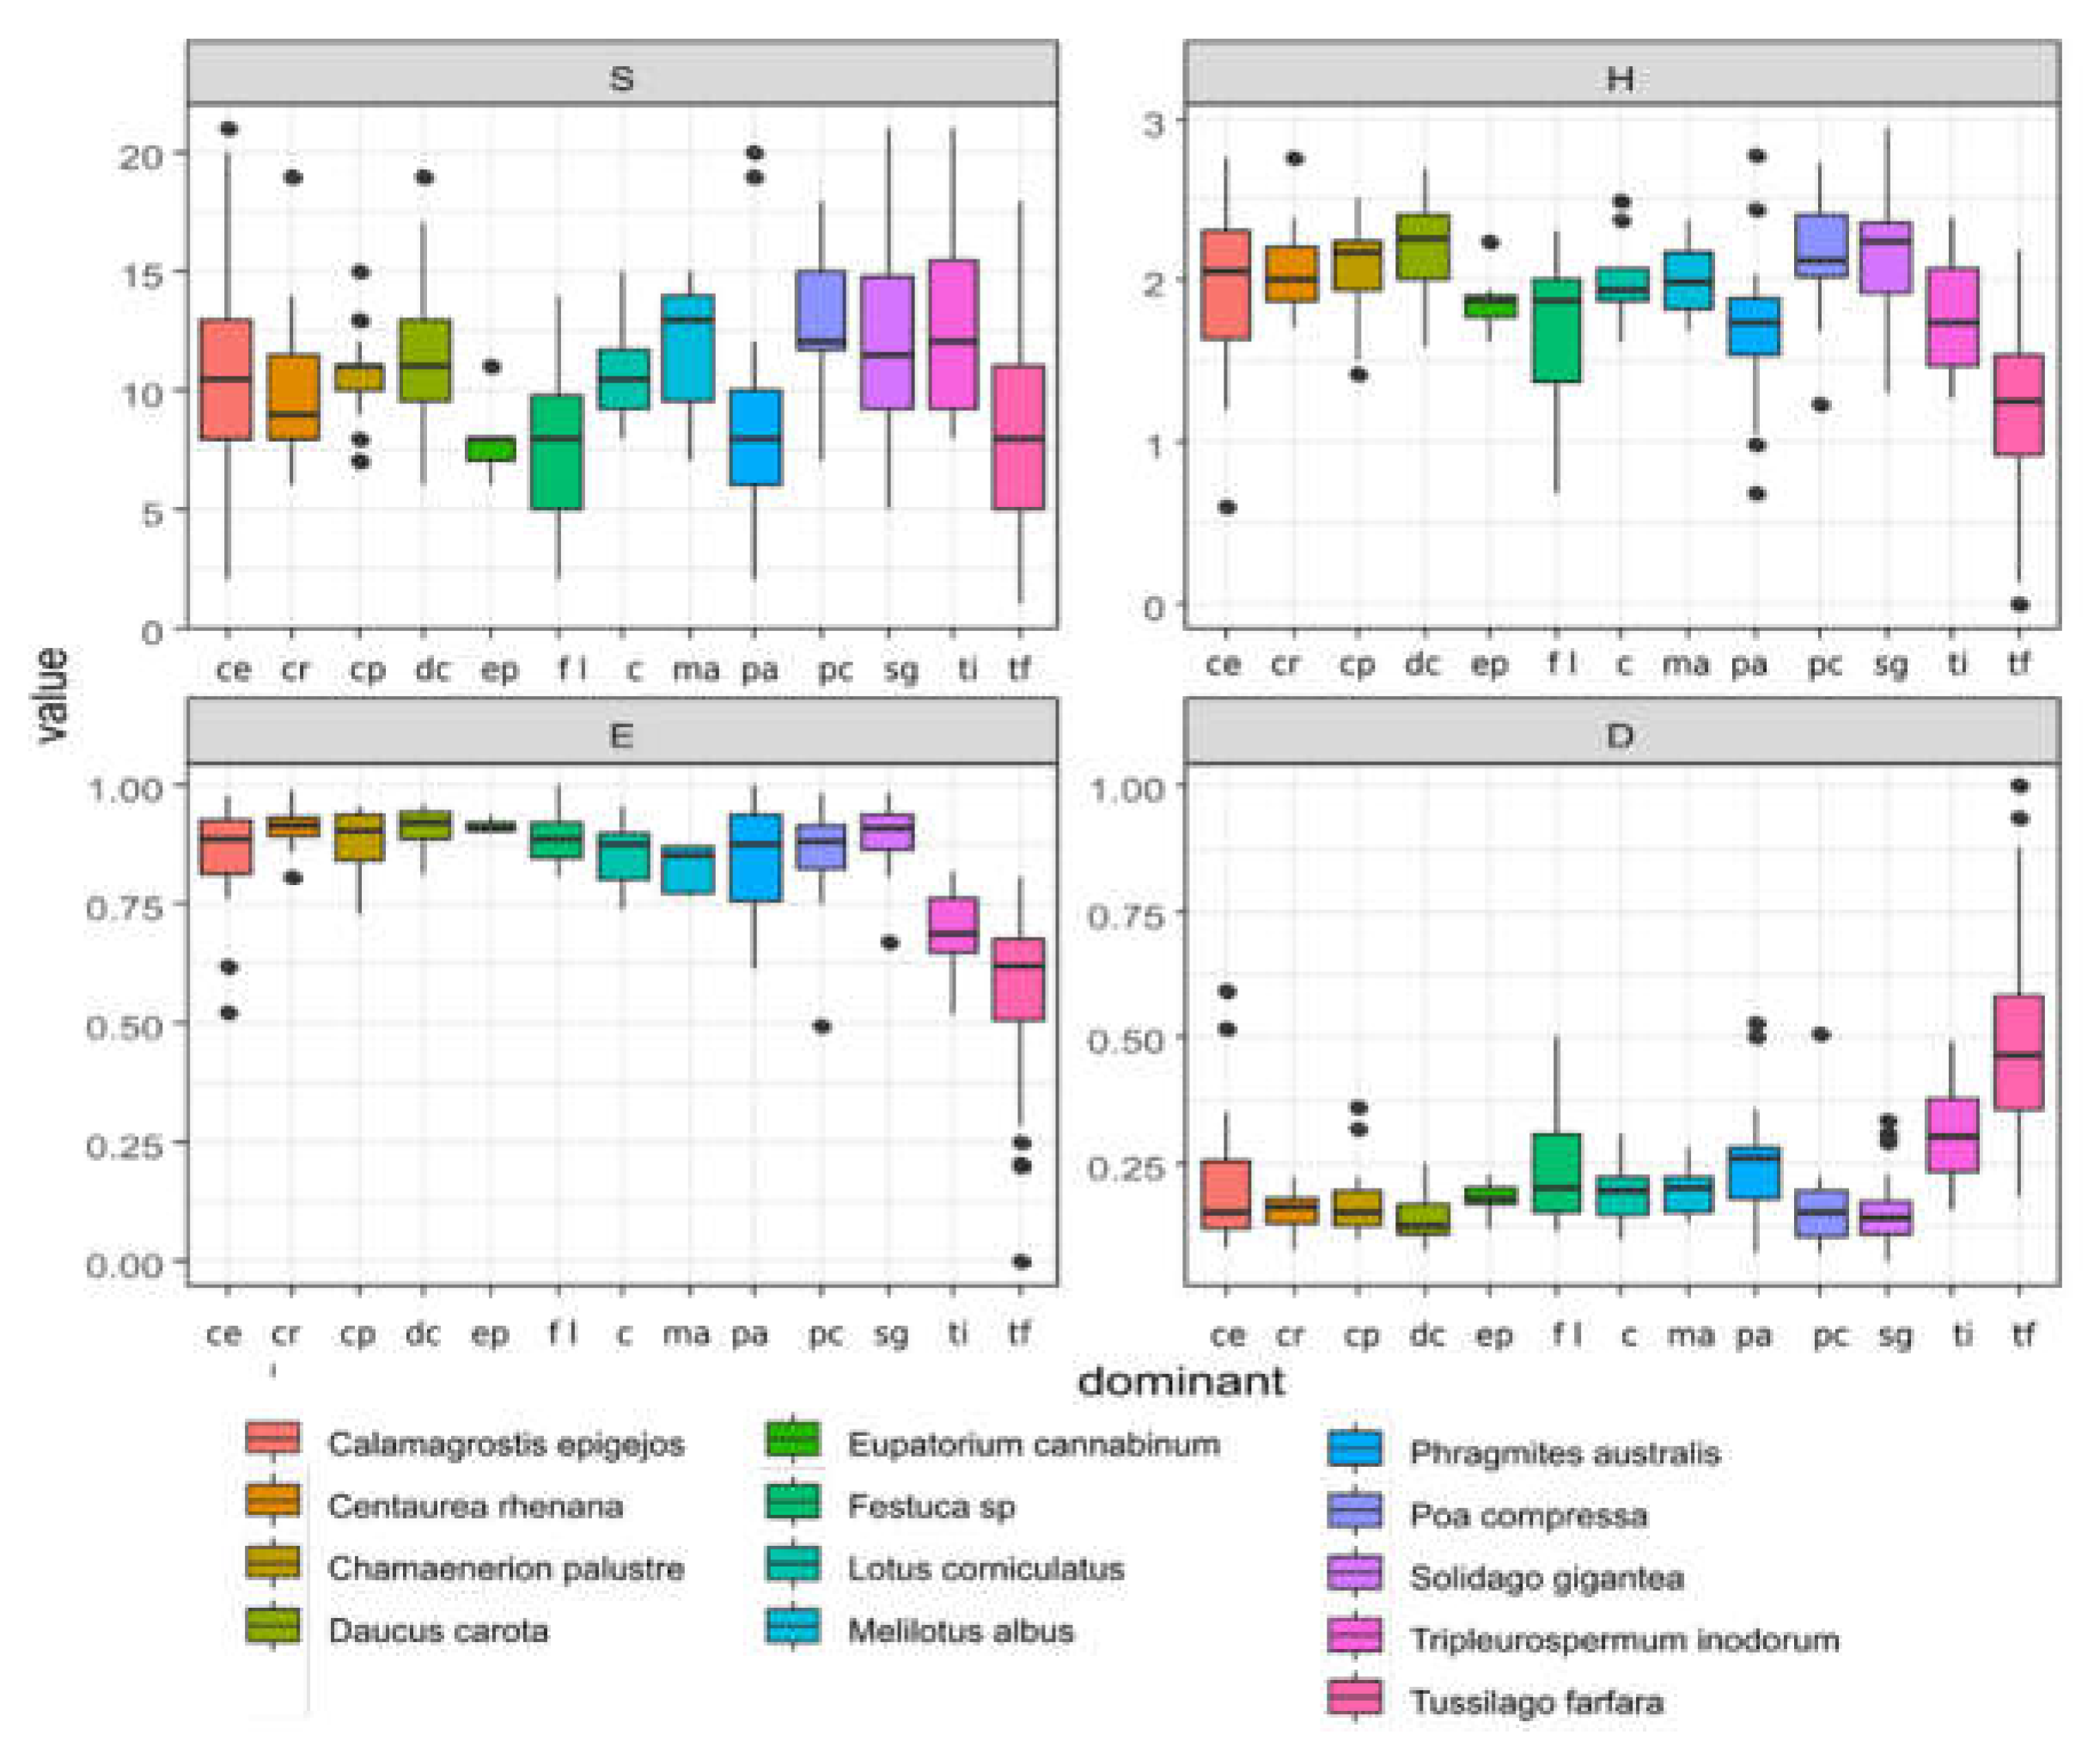
| S | bcd | cde | bcd | abc | e | e | abcd | abc | de | a | ab | ab | e |
| H | bc | bc | ab | a | cd | d | bcd | bcd | d | ab | ab | d | e |
| E | bc | a | abc | a | ab | abc | cd | d | bcd | cd | ab | e | e |
| D | def | efg | efg | g | cdef | cd | cdef | cde | bc | efg | fg | b | a |
| Species | CE | CR | CP | DC | EP | F | LC | MA | PA | PC | SG | TI | TF |
|---|---|---|---|---|---|---|---|---|---|---|---|---|---|
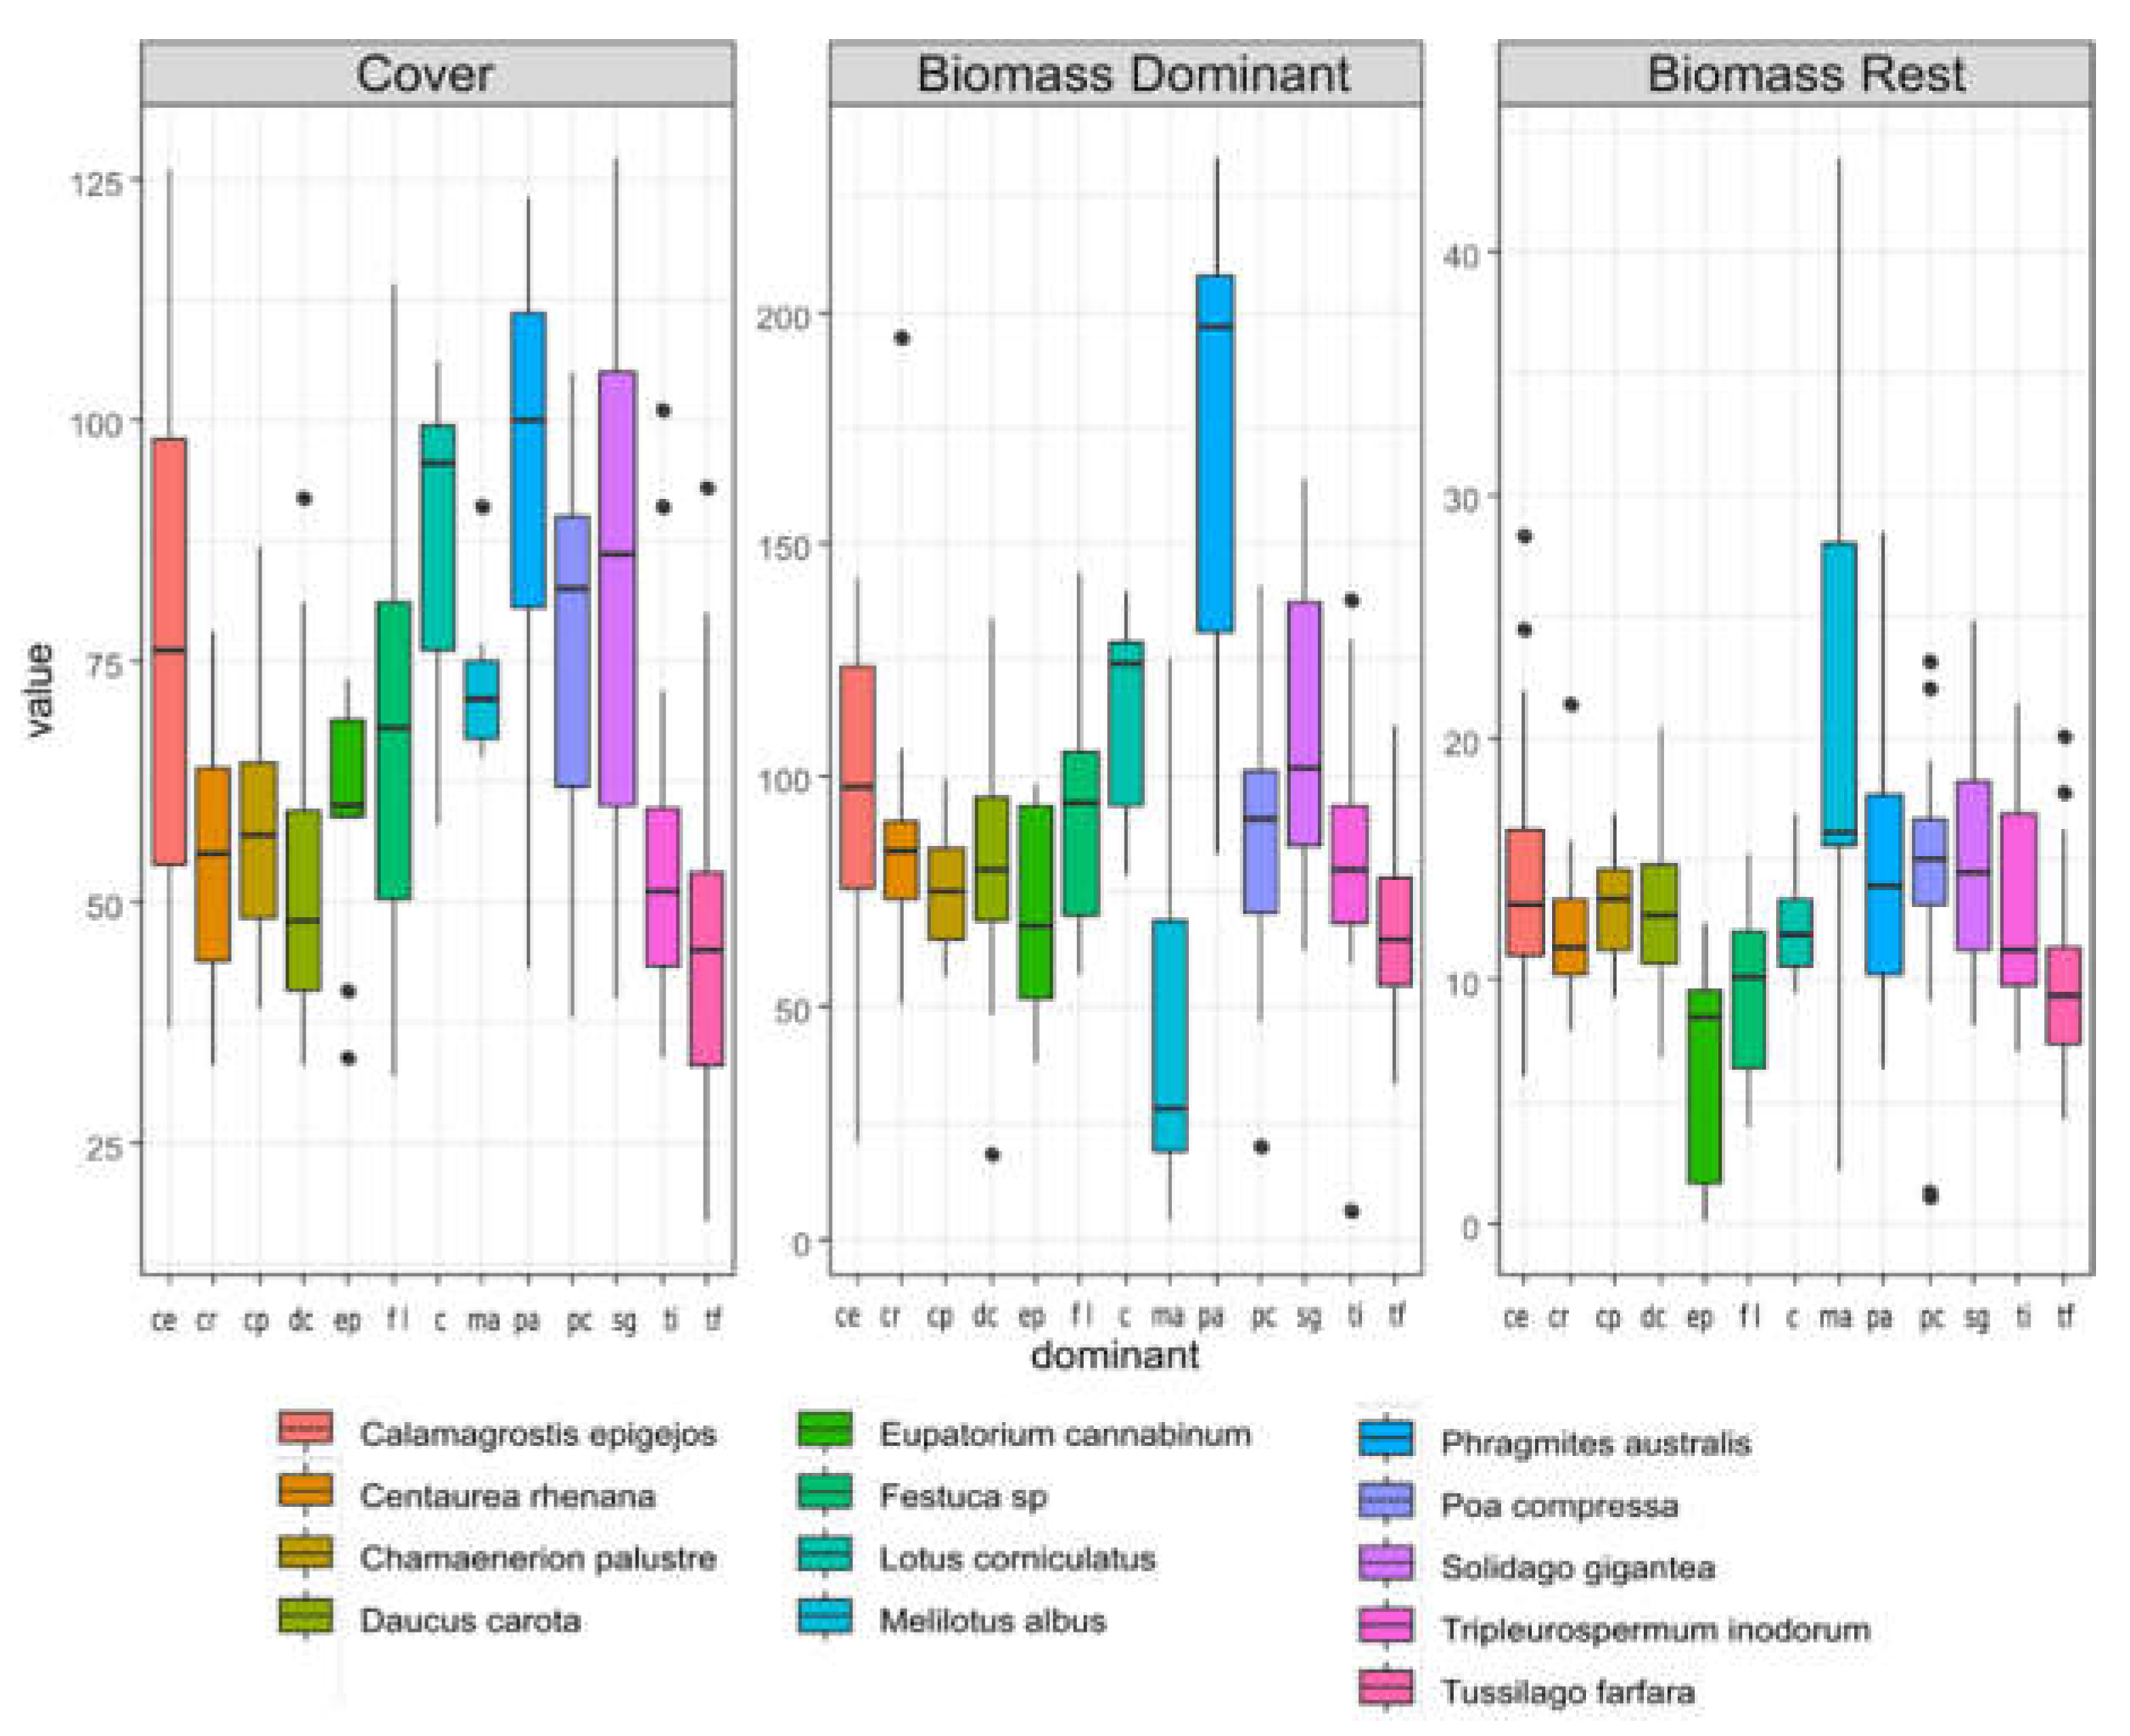
| Cover | ab | cd | cd | de | bcd | bc | a | ab | a | ab | a | de | e |
| Biomass Dom | bc | de | e | de | ef | bcd | ab | f | a | cde | b | de | f |
| Biomass Rest | abc | cd | abc | bc | e | de | bcd | a | abc | ab | ab | bc | e |
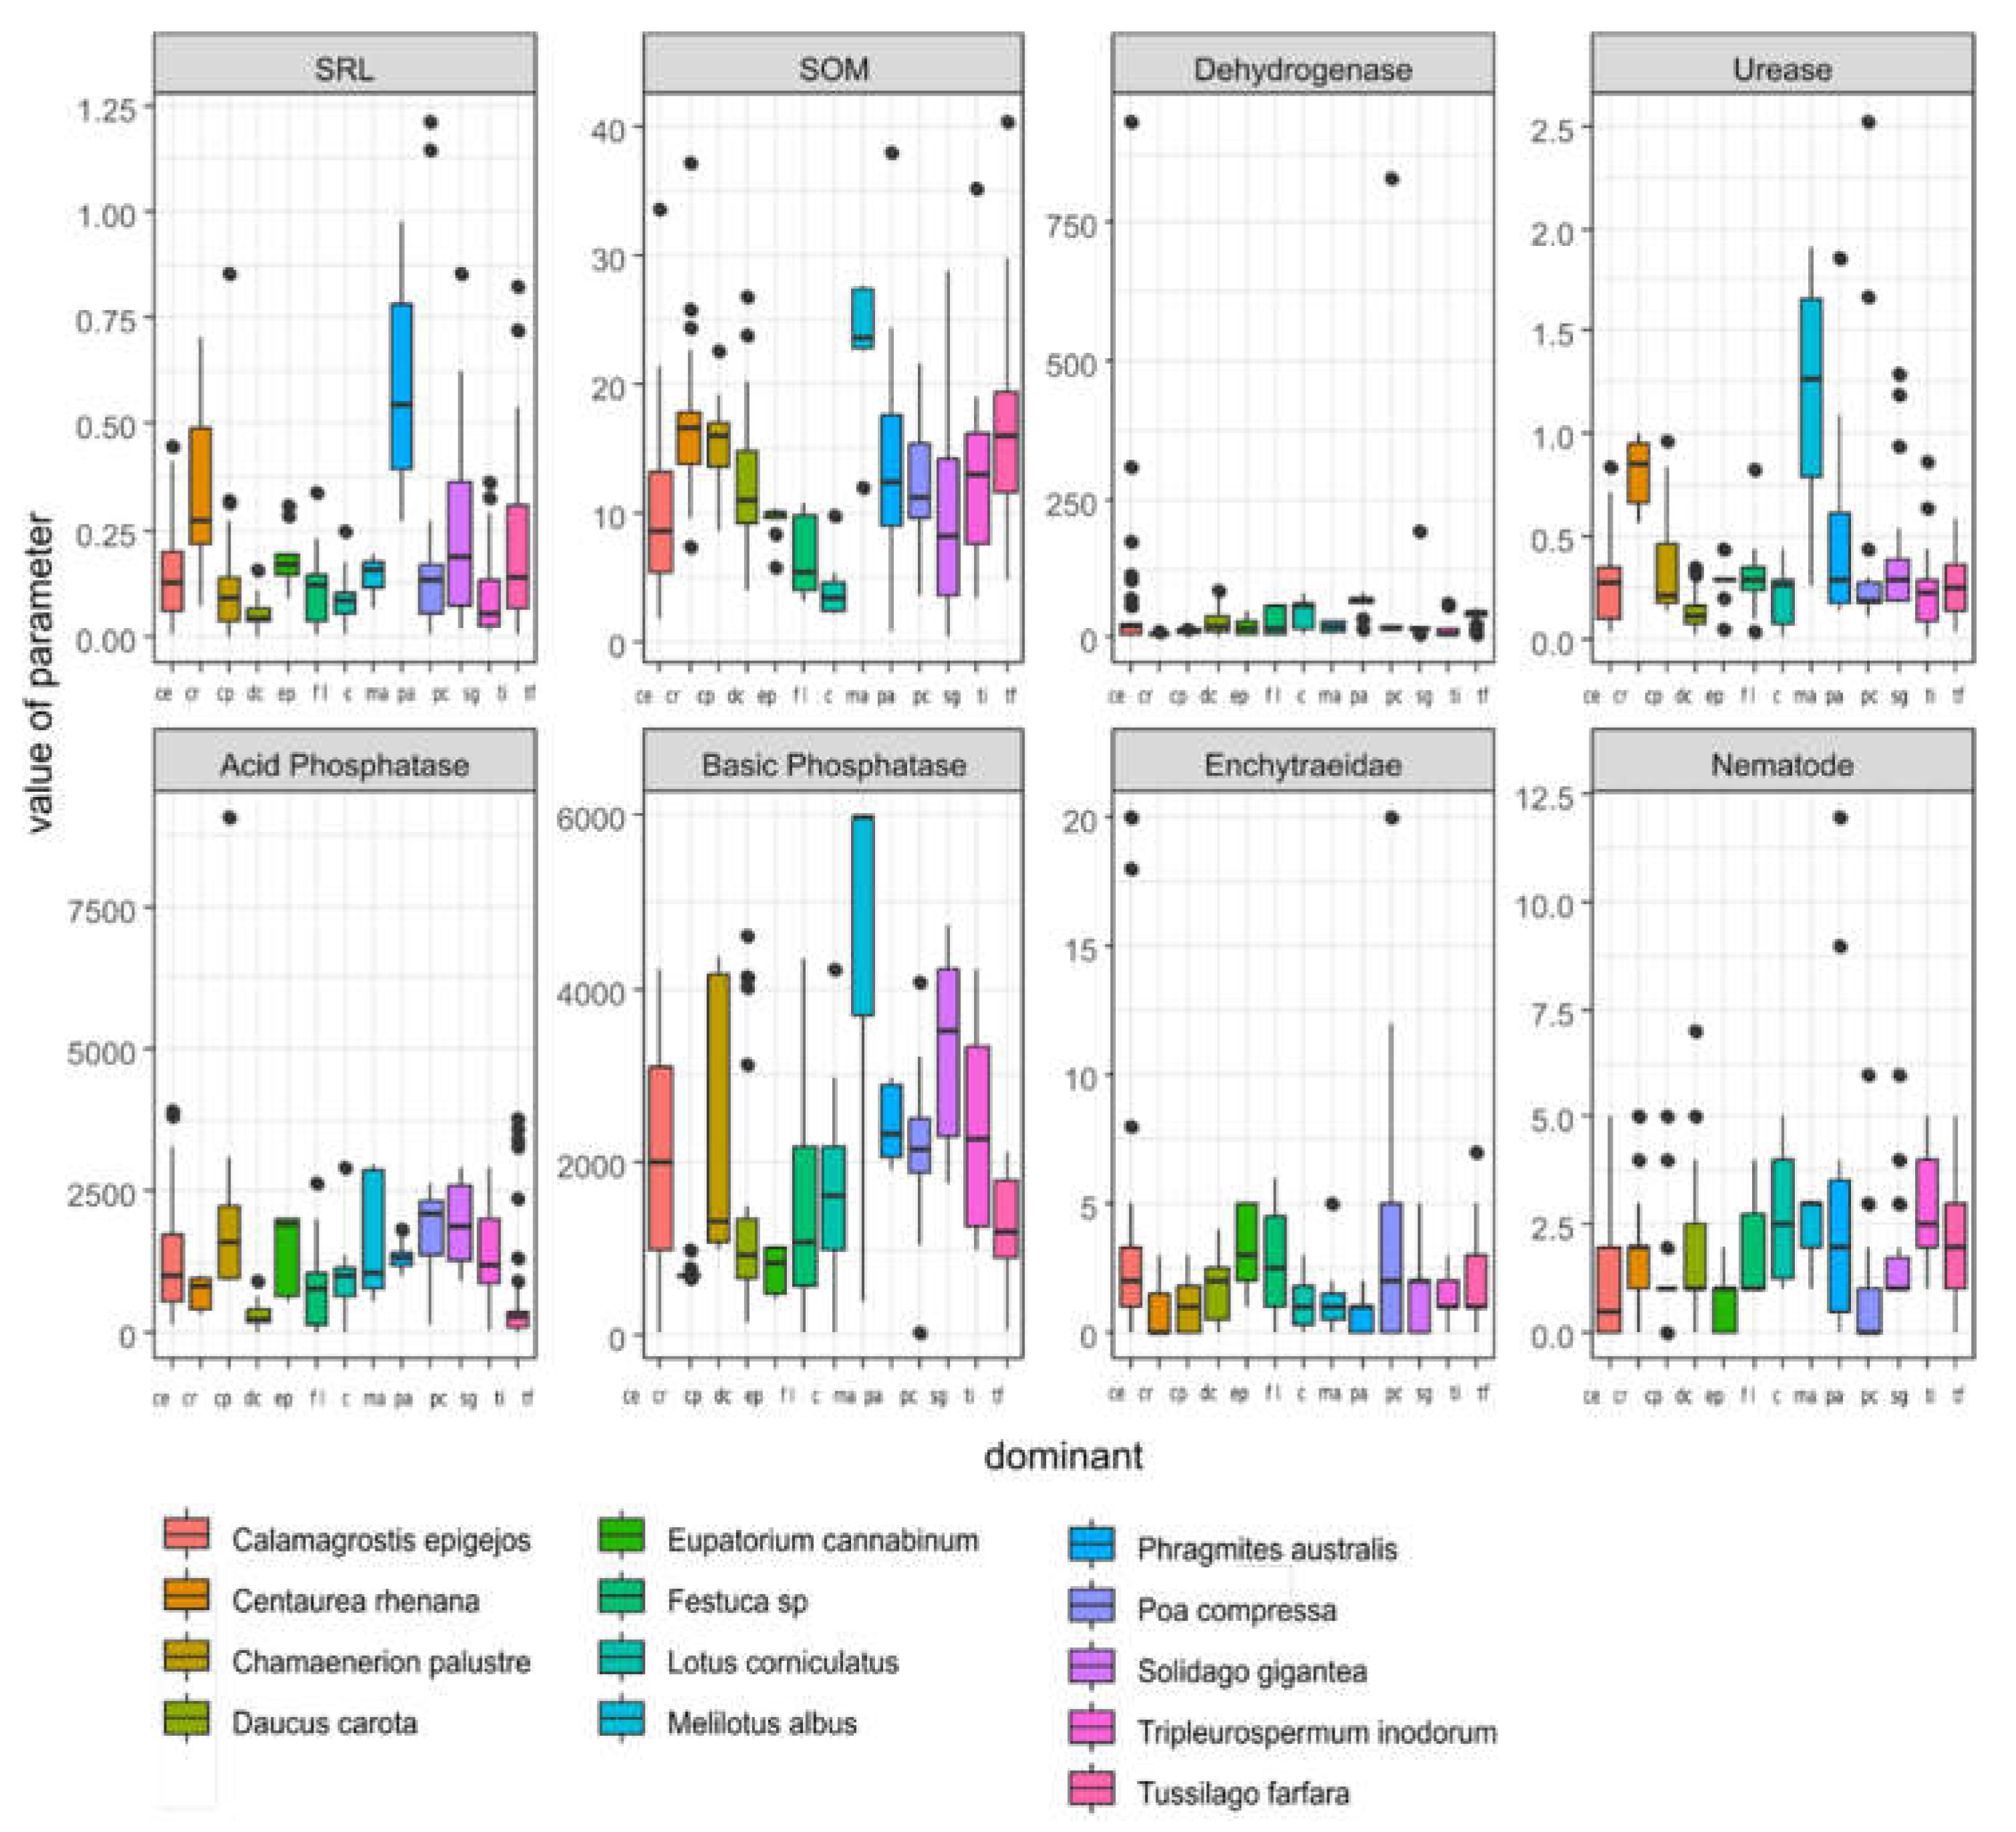
| Vegetation Type | SRL | SOM | DH | UR | AP | BP | EN | N |
|---|---|---|---|---|---|---|---|---|
| Calamagrostis epigejos | cd | ef | cd | bc | d | de | ab | bcd |
| Centaurea rhenana | ab | ab | g | a | e | h | e | cde |
| Chamaenerion palustre | d | bcd | ef | bc | abc | cde | de | abc |
| secondary Daucus carota | e | e | cd | d | f | fg | bc | e |
| Eupatorium cannabinum | bc | fgh | cdef | bc | bcd | gh | a | cde |
| Festuca sp | d | gh | def | bc | e | ef | ab | ab |
| Lotus corniculatus | de | h | bc | cd | de | def | cde | de |
| Melilotus albus | cd | a | cdef | a | abcd | ab | cde | e |
| Phragmites australis | a | cde | a | bc | abcd | abc | e | bc |
| Poa compressa | cd | ef | cde | bc | ab | bcd | abc | bc |
| Solidago gigantea | c | fg | def | b | a | a | bcd | cde |
| Tripleurospermum inodorum | de | de | f | c | cd | bcd | cde | ab |
| Tussilago farfara | cd | bc | b | bc | f | fg | bc | a |
Disclaimer/Publisher’s Note: The statements, opinions and data contained in all publications are solely those of the individual author(s) and contributor(s) and not of MDPI and/or the editor(s). MDPI and/or the editor(s) disclaim responsibility for any injury to people or property resulting from any ideas, methods, instructions or products referred to in the content. |
© 2023 by the authors. Licensee MDPI, Basel, Switzerland. This article is an open access article distributed under the terms and conditions of the Creative Commons Attribution (CC BY) license (https://creativecommons.org/licenses/by/4.0/).
Share and Cite
Ryś, K.; Chmura, D.; Prostański, D.; Woźniak, G. Biomass Amounts of Spontaneous Vegetation on Post-Coal Mine Novel Ecosystem in Relation to Biotic Parameters. Energies 2023, 16, 7513. https://doi.org/10.3390/en16227513
Ryś K, Chmura D, Prostański D, Woźniak G. Biomass Amounts of Spontaneous Vegetation on Post-Coal Mine Novel Ecosystem in Relation to Biotic Parameters. Energies. 2023; 16(22):7513. https://doi.org/10.3390/en16227513
Chicago/Turabian StyleRyś, Karolina, Damian Chmura, Dariusz Prostański, and Gabriela Woźniak. 2023. "Biomass Amounts of Spontaneous Vegetation on Post-Coal Mine Novel Ecosystem in Relation to Biotic Parameters" Energies 16, no. 22: 7513. https://doi.org/10.3390/en16227513
APA StyleRyś, K., Chmura, D., Prostański, D., & Woźniak, G. (2023). Biomass Amounts of Spontaneous Vegetation on Post-Coal Mine Novel Ecosystem in Relation to Biotic Parameters. Energies, 16(22), 7513. https://doi.org/10.3390/en16227513