Article

Pore-Scale Analysis of the Permeability Damage and Recovery during Cyclic Freshwater and Brine Injection in Porous Media Containing Non-Swelling Clays

Energy Geosciences Division, Lawrence Berkeley National Laboratory, Berkeley, CA 94530, USA
*
Author to whom correspondence should be addressed.
Energies 2023, 16(22), 7568; https://doi.org/10.3390/en16227568
Submission received: 20 September 2023 / Revised: 27 October 2023 / Accepted: 8 November 2023 / Published: 14 November 2023

Abstract

:
Permeability damage in subsurface porous media caused by clay mobilization is encountered in many engineering applications, such as geothermal energy, water disposal, oil recovery, and underground CO2 storage. During the freshwater injection into rocks containing brine, the sudden decrease in salinity causes native clay fines to detach and clog pore throats, leading to a significant decline in permeability. The clay fines detach due to weakened net-attractive forces binding them to each other and the grain. Past experiments link this permeability damage on the immediate history of the salinity and the direction of flow. To better understand this phenomenon, we conducted pore-scale simulations of cyclic injection of freshwater and brine into sandstone containing Kaolinite clay. Our simulations establish a link between the clay-fine trajectory and the permeability trend observed by Khilar and Fogler (1983). For a uniform clay size of 3 microns, we observe a permeability decline by two orders of magnitude during freshwater injection with respect to brine injection. Increasing salinity and simultaneously reversing flow direction restores the permeability. The permeability restoration upon reversing the brine flow direction is attributed to the unblocking of pore throats in the reverse direction by the movement of the clay particles along the grain surfaces by the hydrodynamic force and the strong net-attractive force under high salinity.

1. Introduction

The permeability decline in subsurface porous media due to the mobilization of clay fines is a problem encountered in several subsurface engineering applications, such as water disposal, oil recovery, aquifer recharge, geothermal energy, and geological CO 2 storage [1,2,3,4,5,6,7]. When freshwater is injected into porous media that initially contains brine and native non-swelling clay, the sudden change in salinity causes the clay fines to detach from the grains and clog pore spaces, resulting in a significant damage in permeability. This phenomenon referred to as water sensitivity could occur in both unconsolidated and consolidated geologic materials containing a small percentage of clays, e.g., Refs. [4,8,9,10,11,12,13,14,15,16,17].
In the presence of brine, the said clay fines are attached to the grain surface mainly due to the influences of the Van der Waals (vdW) and electric double layer (EDL) forces, a combination of which is known as Derjaguin–Landau–Verwey–Overbeek (DLVO) force [5,18,19]. The vdW forces are attractive, while the EDL forces are repulsive in nature. The injection of freshwater causes increases in the EDL forces at grain–clay and clay–clay interfaces. As the salinity of the injected fluid decreases, the net-attractive force binding the clay fines to the grain decreases, and eventually at a critical salinity, the net-attractive force is overcome by the hydrodynamic force of the injected fluid on the clay, and the fines become free to detach [20,21,22].
The clays that detach from grain surfaces under low-salinity conditions can migrate by the effect of hydrodynamic force and accumulate in narrow pore apertures (pore throats). As a result, permeability can decrease significantly, and some laboratory observations suggest that the permeability damage may be permanent [23]. However, some earlier laboratory studies [4,11,24] and our recent field-scale studies [9] suggest that permeability restoration might be possible by a reversal in the flow direction and exposing the rocks to brine. Khilar and Fogler (1983) [11] studied the injection of freshwater and brine in a cyclic manner into a Berea sandstone core. They found that the damage in permeability due to freshwater injection in a fixed direction is not restored by brine injection in the same direction. However, brine injection in the opposite direction restored the permeability. These findings link the permeability damage to the immediate history of the flow, in addition to the salinity of the injected fluid.
Effective strategies to mitigate the permeability decline caused by clay mobilization in porous media require a better understanding of the effects of hydrodynamic and physicochemical forces on clay–clay and clay–grain interactions under different flow rate, direction, and salinity conditions. The hypothesis for the permeability restoration is as follows: When brine flows in the reverse direction, some of the clay particles clogging the pore throats are dislodged, opening pathways for the reverse flow. However, after dislodgement, they remain attached to the grain body due to the large net-attractive force, thereby improving the damaged permeability. To test this hypothesis and confirm Khilar and Fogler’s (1983) [11] observations, pore-scale computational studies were conducted for an idealized system of particles and porous medium, as described in next section. Recently, we presented a 2D pore-scale computational fluid dynamics model that can simulate detachment and migration of clay particles in porous media [25].
In this work, the capability and applications of the model were extended to study the cyclic injection of freshwater and brine. The two key effects governing the detachment and mobilization of clay fines in the porous media are hydrodynamic effects and so-called DLVO effects, including the Van der Waals and the electric double layer forces. The hydrodynamic forces are determined by solving the Navier–Stokes equations for the flow around the clay fines using the Immersed Boundary Method [26]. The DLVO forces for the grain–clay and clay–clay pairs are calculated using the Surface Element Integration technique of Bhattacharjee et al. (1997) [27]. The following section explains the methodology and setup of our simulations of pressure-driven flow through a porous medium representing sandstone containing kaolinite clay. We examine the impact of pore-scale mechanisms related to clay mobilization and interception on permeability damage and recovery in this porous medium under different salinity and flow conditions. Additionally, the role played by the clay size distribution in the permeability damage phenomenon is examined.

2. Materials and Methods

2.1. Immersed Boundary Method

In the present work, we compute 2D pore-scale numerical solutions of the Navier–Stokes equations to model the flow of brine and water through the porous medium. The fluid flow around clay particles and stationary grains is modeled using an Immersed Boundary Method (IBM) that the authors have used in a prior work on clay mobilization at the pore scale [25]. Our in-house IBM Navier–Stokes code is based on the finite-volume method and uses the fraction-step method of Kim and Moin (1985) [28] and semi-implicit time integration.
To simplify the analysis, following assumptions about the clay shape and the structure of the porous media are made. Clay particles in natural sand formations are known to exist in the form of platelets clustered around grains [5], and in the present work, we model the clustered platelets as spherical or circular shaped particles that can either be attached to the grain surface or mobile in the fluid. This is a common assumption used in the literature for modeling clay fines migration (e.g., Refs. [20,21,29,30]). Indeed, a sensitivity analysis on the clay particle shape needs to be performed, but it is out of the current work’s scope.
The porous medium comprises non-overlapping stationary circular grains. Our computational domain is divided into two zones, namely the fluid zone occupied by water, and the solid zone occupied by clay particles or grains. The governing equations below apply to both zones in the domain.
· u = 0 ,
ρ t u + · u u = p + · μ u + u T + ρ g + ρ F ib .
Equations (1) and (2) are the incompressible continuity and momentum transport equations, respectively. ρ [kg m 3 ], μ [Pa · s] and p [Pa] are the fluid density, dynamic viscosity, and pressure, respectively. u and g are the velocity and gravitational acceleration vectors, respectively. F ib is an immersed boundary force which is imposed in the solid zones of the computational domain to obtain the desired rigid-body motion. F ib is zero in the fluid zone and non-zero in the solid zone. Our in-house Navier–Stokes solver uses a structured Cartesian grid to solve Equations (1) and (2). All the sides of the computational domain have periodic boundary conditions in our simulations, and the initial condition is zero velocity.
The zero level-set of a distance function ϕ ( x ) [31] is used to represent the solid–fluid interfaces in our system. Here, x is any location in the computational domain and ϕ is the smallest distance of the the solid surface from a given point x. Going by convention, ϕ is assumed to be positive in the fluid region and negative inside the solid region. Additionally, color function c ( x ) is defined as
c ( x ) = 1 2 1 + tan h 2 ϕ ( x ) Δ x ,
where Δ x is one grid size. c ( x ) is 0 inside the solid zone, 1 in the fluid zone, and varies from 0 to 1 over three cells in the neighborhood of the solid–fluid interface. At the solid–fluid interface, c ( x ) is 0.5 and ϕ ( x ) is 0. There are several versions of the immersed boundary method in the literature, and for a detailed description, we refer the reader to Mittal et al. (2005) [26]. In our in-house Navier–Stokes solver, we use the technique proposed by Bigot et al. (2014) [32]. We define F ib as
F ib ( x ) = 1 c ( x ) U ( x ) U * ( x ) Δ t ,
where Δ t is the time step, U * ( x ) is the intermediate velocity field in the fractional-step method [28], and U ( x ) is the rigid body velocity to be imposed in the solid zone
U = u p + Ω p × x x p ,
wherein u p , Ω p , and x p are the translational velocity, angular velocity, and location of the center of mass of the solid object, respectively. By performing linear momentum and angular momentum analyses over a control volume comprising of the solid zone in the computational domain one can show that the linear and angular accelerations of the solid object are given by volume integrals:
d u p d t = g 1 ρ p ρ v p v p ρ F ib d v + i = 1 , i p N F p i m p ,
and
I p d Ω p d t = ρ p ρ p ρ v p ρ ( r × F ib ) d v + i = 1 , i p N τ p i .
In the above equations, F p i and τ p i are the particle–particle collision force and torque, respectively. In our numerical method, the clay–clay and clay–grain collisions are assumed to be inelastic. There are several collision models in the literature [33,34]; however, in our study, the spring-damper force of Andrade et al. (2012) [35] is used to model inelastic collisions. Details on the discretization of the immersed boundary method are provided in Appendix A.2. The immersed boundary method described in this subsection has been verified in our earlier work on clay mobilization [25], wherein the drag force on a circular object was compared with benchmark results in the literature for different Reynolds numbers of the background flow. For more details, we refer the reader to our earlier work on the same topic [25].

2.2. DLVO Interactions

Clay fines in natural porous media can range in size between 0.1 μ m to 5 μ m, and are bound to the grain surfaces by Derjaguin–Landau–Verwey–Overbeek (DLVO) forces [5,21]. The DLVO forces comprise the Van der Waals, electric double layer, and Born forces. The first of those forces is attractive, and the rest are repulsive in nature. At the micron length scale, the Born repulsion force is not significant compared to the former forces. In a medium with high salinity, the clay fines are attached to the grains by this net-attractive DLVO force. The DLVO force also exists between any two clay fines in contact. When freshwater is injected, the electric double layers around the clay particles and the grains become thicker, thereby increasing the EDL force and consequently weakening the net-attractive force [21,36]. This enables the hydrodynamic force exerted on the clay fines by the injected water to overcome the weakened net attractive forces, causing them to detach from the grains.
In our model, we compute clay–clay and clay–grain DLVO forces using the Surface Element Integration technique of Bhattacharjee and Elimelech (1997) [27], wherein the Van der Waals and double layer potentials are integrated over the areas of both interacting objects by using small flat-plated area elements over the objects [37]. For completeness, listed below are the vdW and EDL potentials per unit area, respectively, of two flat plates with a distance h between them.
E V ( h ) = A 12 π h 2 ,
and
E D ( h ) = ϵ 0 ϵ r κ 2 ( ζ 1 2 + ζ 2 2 ) 1 cot h ( κ h ) + 2 ζ 1 ζ 2 ζ 1 2 + ζ 2 2 csc h ( κ h ) .
Here, A represents the Hamaker constant [J], which if a function of the materials of the pair of interacting plates and the medium between them. In the present study, it is assumed to be 6 × 10 21 J. ϵ 0 and ϵ r are the permittivity of vacuum [Fm 1 ] and relative permittivity, which have values 8.85 × 10 12 Fm 1 and 80, respectively. κ is the inverse Debye length [m 1 ], and can vary between 10 8 m 1 and 10 9 m 1 for NaCl salinity ranging from 0.001 M to 0.1 M. ζ 1 and ζ 2 are the zeta potentials [mV] of plates 1 and 2, respectively. The zeta potentials can vary between 60 mV and 30 mV for salinity ranging from 0.001 M to 0.1 M. More details on the values of the zeta potentials for Kaolinite and Sandstone can be found in Russell et al. (2017) [21].
The negative partial derivative of the net interaction potential ( E V + E D ) with respect to h gives us the DLVO force. The minimum in the plot of the DLVO force against h is considered the force needed to separate two objects in contact. The clay–clay and clay–grain DLVO forces are added to F p i in Equation (6). For a detailed description of the algorithm and implementation of the DLVO forces, we refer the reader to Bhuvankar et al. (2022) [25]. In the same work, we showed that decreasing the salinity of brine from 0.1 M to 0.001 M decreases the net attractive clay–grain DLVO force by three orders of magnitude.

2.3. Problem Setup and Cyclic Injection

The numerical technique explained in Section 2.1 and Section 2.2 is applied to study clay transport in a porous medium of length L x = 200 μ m and width L y = 100 μ m, as shown in Figure 1. The grain zones, fluid zones, and clay fines are shown in blue, red, and white colors, respectively. The porous medium has a porosity of 0.37 with a grain size of d g = 20 μ m. The locations of the 40 circular grains are initialized using a uniform random distribution and then adjusted so as to allow a minimum separation of δ min = 1 μ m between the surfaces of any two adjacent grains. We assume the water, grain, and clay densities to be 1000 kg/m 3 , 2600 kg/m 3 , and 2000 kg/m 3 , respectively. The dynamic viscosity of water is considered to be 8.9 × 10 4 Pa · s.
In our simulations, the mean diameter of the clay fines is d p = 3 μ m. The mass fraction of clay fines, m clay m clay + m grain , is 2 % in all our simulations. We run two sets of simulations, one with a uniform clay size and another with a non-uniform size distribution. The clay locations are initialized using a uniform random distribution on the surfaces of the grains. In order to simulate flow through a representative section of a periodic, infinitely large porous medium, periodic boundary conditions are applied on all sides of the computational domain. We use N x = 400 and N y = 200 grid points along the x and y directions, respectively.
This configuration was based on the grid independence analysis presented in Appendix A.1. It was determined in the analysis that the largest grid size should be one-sixth the diameter of the solid particle. In a periodic porous medium, such as that shown in Figure 1, the pressure can be split up into two components as that p = p ¯ + p , wherein p ¯ is the mean pressure of the flow and p is a periodic component of the flow. The flow in the porous medium is driven either in the positive or negative x direction by applying a negative or positive mean pressure gradient d p ¯ d x , respectively. Henceforth, we refer to the former case as ‘forward’ flow and the latter case as ‘backward’ flow. The fluid flowing through the porous medium is water with an NaCl concentration of either 0.1 M or 0.001 M. We shall refer to the former case as ‘brine’ and the latter case as ‘freshwater’. During the simulation when a clay fine is in contact with either a grain or another clay fine, it experiences the salinity-dependent clay–grain or clay–clay DLVO force, respectively.
Khilar and Fogler (1983) [11] carried out experiments of core-scale cyclic brine and freshwater injection to study the water sensitivity of Berea sandstone. Their experiments were aimed at understanding the restoration of damaged permeability in the Berea sandstone core with a reversal of saltwater. They sequentially injected brine forward, freshwater forward, then reversed the freshwater, followed by brine reversal, and finally brine forward. In the first cycle of their experiment, only 84 % of the original permeability was recovered at the end of the cycle. In our current work, we simulate the cyclic injection pattern that was used by Khilar and Fogler (1983) [11] to understand the water sensitivity and permeability restoration phenomenon at the pore scale. In our study, each cycle is composed of five phases, namely brine-forward (BF), freshwater-forward (FF), freshwater-backward (FB), brine-backward (BB), and brine-forward (BF). In each simulation, we carry out two such cycles before reporting the final results. Each of the five phases is allowed sufficient time to attain a quasi-steady state. In all our simulations, we assume that the salinity changes uniformly and instantaneously in the domain whenever the flow changes from brine to freshwater, and vice versa. Given the periodic boundary conditions, simulating salinity transport from left to right is not meaningful. Additionally, our simulations with and without salinity transport with inflow–outflow boundary conditions resulted in the same steady-state values of permeability with the former consuming more simulation time. A sample simulation along with video is presented in the Supplementary Materials. Solute transport has been covered in various existing studies [38,39,40], but it is outside of the scope of the present work.

3. Results and Discussion

3.1. Permeability Damage Due to Pore Clogging

The prevailing theory on permeability damage during freshwater injection in clay containing porous media is that the clay fines detach from the grains due to weakened net attractive forces and clog the pore spaces, thereby increasing hydraulic resistance [5,20,21]. To test this theory, we present a simulation of clay mobilization in the porous media in Figure 1. We apply a constant pressure gradient of d p ¯ d x = 3 MPa/m across the porous medium to drive the flow forward. We begin with a randomized initial clay distribution with a uniform clay size of d p = 3 μ m.
We inject brine of salinity 0.1 M until steady state flow conditions occur. After the steady state conditions are reached at t = 0.6 s, we change the salinity of the flow to 0.001 M. The absolute value of the fluid velocity along the x direction is averaged over the computational domain to obtain | U | . The permeability, k [m 2 ] is computed using the pressure gradient, the velocity | U | , and liquid viscosity as k = μ | U | d p ¯ / d x . Figure 2 shows the variation in the average flow velocity | U | as a function of time, with the red line marking the time of transition from brine to freshwater. Shown alongside the plot are snapshots of a section of the computational domain at different stages of the simulations, along with a few velocity streamlines through the dominant flow pathways. Prior to t = 0.6 s, the flow has a steady-state permeability of k = 1.27 × 10 13 m 2 , corresponding to a velocity of | U | = 0.43 mm/s. At this stage, the clay fines have oriented themselves downstream of their respective grains to clear pathways for the flow, and we observe that a few clay fines have clogged pore spaces in their immediate vicinity.
After t = 0.6 s, the clay fines are released from their grains due to the effects of hydrodynamic and increased EDL forces, and we observe a cascade of sharp drops in the permeability occurring at distinct times, each corresponding to a pore clogging event. Shown in Figure 2 are pore clogging events at t = 0.603 s, t = 0.61 s, and t = 0.626 s, with their respective pore throats circled in white. Note that each pore clogging event modifies the path of the velocity streamlines around the pore space compared to before the clogging. After the final pore clogging at t = 0.626 s, the average velocity and permeability are nearly zero. We see that there is a front formed by the intercepted clay fines on the right side of the medium, which prevents forward fluid flow. We also observe that at t = 0.626 s, all but five clay fines have been intercepted at the various pore spaces. Note that throughout the simulation, the applied pressure gradient is kept constant.
This simulation demonstrates how the mobilization and interception of clay fines upon freshwater injection damages the permeability of the clay carrying porous medium. The key question of interest is whether this permeability damage during the forward freshwater injection is recovered during backward flow of freshwater and brine. If so, what fraction of the damaged permeability is restored? Another question of interest is whether a non-uniform distribution of the clay size would affect the permeability damage and recovery. We address both these questions in the following subsections.

3.2. Cyclic Injection with Uniform Clay Size

We generate six different randomized realizations of the porous medium described in Section 2.3; all have a porosity of 0.37 and a clay mass fraction of 2 % . The grain size in all six cases is uniform and equal to 20 μ m. In these six simulations, the clay diameter is kept uniform and equal to d p = 3 μ m. We carry out two cycles, with each comprising of the phases of brine and freshwater injection described in Section 2.3. Each phase of brine or freshwater injection is given 0.1 s, which was found to be a sufficient time period for reaching steady state conditions. The pressure gradient used to drive the water forward and backward in these cases is | d p ¯ / d x | = 3 MPa/m.
Figure 3 shows the variation in the permeability k and absolute fluid velocity | U | averaged over all six simulations with time. The region enclosed between the upper and lower bounds across the six cases simulated is colored in gray. Figure 3 shows two cycles of injections, the first one colored in blue and the second in red. The locations of clay fines are randomly initialized on the grain surfaces at the beginning of cycle 1.
Similarly to the case in Section 3.1, in the forward brine phase, the clay fines reorient themselves along their respective grains to clear pathways for the fluid flow and the mean velocity and the permeability are | U | = 0.21 mm/s and k = 0.62 × 10 13 m 2 , respectively, at the end of this phase. Note that the difference between the upper and lower bounds of k across the six simulated cases is significant compared to the mean value.
In the freshwater forward phase of cycle 1, we see that the mean velocity decreases by an order of magnitude to 1.06 × 10 2 mm/s with a corresponding permeability of k = 0.3 × 10 14 m 2 . This is due to the clogging of pore throats upon freshwater injection explained in Section 3.1. At t = 0.2 s, when the direction of freshwater flow is reversed, we see a momentary increase in permeability due to the unclogging of the clogged pores. This has been observed in past studies [11,41]. The dislodged clay fines now move in the backward direction to be eventually intercepted at a different set of pore throats, thereby again causing a drop in the mean absolute velocity. At t = 0.3 s the mean | U | has a value of 7 × 10 4 mm/s. At this stage, when brine is injected in the backward direction, the mean | U | remains unchanged since the pore throats are clogged. At t = 0.4 s, the direction of brine is reversed. The intercepted clay fines are pushed out of their pore throats and they reorient themselves along the grain surfaces to clear pathways for fluid flow. At t = 0.5 s, cycle 1 is completed and the permeability and mean absolute velocity are 1.20 × 10 13 m 2 and 0.4 mm/s, respectively. Note that this permeability is higher than what was observed at the initial brine-forward phase.
At t = 0.5 s, we begin cycle 2 with the same five phases. Similarly to cycle 1, we observe a stable high permeability in the brine-forward phase, followed by a sharp decline in its value when freshwater is injected. Subsequently, a momentary rise in permeability is observed, followed by a steep decline when the direction of freshwater is reversed. The permeability remains damaged when brine is injected in the backward direction followed by an increase when brine flows forward. However, the important observation in cycle 2 is that the permeability averaged from six simulations at the beginning and the end of cycle 2 are nearly the same and equal to 1.20 × 10 13 m 2 , with a 0.6 % difference. In other words, the permeability damage that occurred from freshwater injection was 99.4 % restored at the end of the cycle. This trend was also observed in the six simulations individually. Also note that the difference between the upper and lower bounds of permeability from the six simulations is significantly less than that at the beginning of cycle 1.

3.3. Clay Fine Distribution at Different Phases of Injection

To understand the trends observed in Section 3.2, we examine the interception and the spatial distribution of clay fines at the end of each stage. We consider one out of the six simulated cases from Section 3.2, and observe the clay fine distribution at four different stages of cycle 2. Shown in Figure 4 are snapshots of the simulation showing the clay fines, grains and velocity vectors at t = 0.6 s, 0.7 s, 0.8 s, and 1.0 s. These correspond to the end times of the brine-forward, freshwater-forward, freshwater-backward, and brine-forward phases of cycle 2, respectively, as indicated by the arrows from the plot of the permeability and the absolute velocity against time in Figure 4.
At the end of the brine-forward phase at t = 0.6 s, we observe that the clay fines orient themselves behind their respective grains. Some clay fines clog the pore throats in the immediate vicinity of their grains. It is also evident from that there are some dominant pathways for the brine flow in the porous medium characterized by a relatively high magnitude of the velocity vectors along those pathways. At this stage, the clay fines are bound to their grains by strong DLVO forces. At the end of the freshwater-forward phase at t = 0.7 s, we see that the dominant pathways identified in the previous phase have all been clogged by the dislodged clay-fines and the overall magnitude of the velocity vectors is significantly lower than in the previous stage.
At t = 0.7 s, we see that most of the clay fines have either clogged pore throats or are oriented upstream of their grains with respect to the flow direction. The negligible magnitudes of the permeability and the absolute velocity at this stage is because the clay fines circled in white color have formed a front blocking the flow of any freshwater from left to right. Note that at this stage, the externally imposed pressure gradient d p ¯ / d x = 3 MPa/m is still active, but it is balanced by a static pressure build-up within the fluid, under near-zero flow condition. Also note that while in this realization of the porous medium, we see a clear front formed by the clogged pore throats and a near-zero, which is not representative of the red line shown in the k vs. t plot, which is an average of all six realizations that were simulated.
At t = 0.7 s, the direction of freshwater is reversed and at t = 0.8 s, we see that similar to the previous case, all the clay fines are either clogging pore throats or located upstream of the grains with respect to the backward flow direction. Similarly to the previous phase, we see a front formed by the circled intercepted clay fines, block the flow of freshwater from right to left, thereby reducing the absolute velocity and permeability to zero. The snapshot of the simulation at t = 0.9 s is omitted because the clay-fine front seen at t = 0.8 s remains intact even when the salinity of the fluid is increased, and the clay configuration and permeability remain unchanged.
After the direction of brine is changed at t = 0.9 s, similarly to the first phase, we observe that at t = 1.0 s, the clay fines again reorient themselves downstream of the grains to clear pathways. A careful examination of the clay fines in the snapshots at t = 1.0 s and t = 0.6 s indicates that aside from a couple of clay fines, the clay distribution returns to its initial form when the flow completed a whole cycle. This is also reflected in the magnitudes of permeability at t = 0.6 s and t = 1.0 s, which are both equal to 1.27 × 10 13 m 2 . The corresponding magnitude of velocity is 4.3 × 10 4 m/s. Given the clay configuration at t = 1.0 s, if we were to carry out another cycle of brine and freshwater injection, we would expect to see a repeat of the trend seen in cycle 2. These clay distributions during the different phases of the cycle are now intrinsic to this porous medium.

3.4. Impact of Non-Uniform Clay Size Distribution

All the simulations presented and analyzed thus far have contained a uniform clay size of d p = 3 μ m. To examine the effect of a non-uniform clay size distribution, we simulate the cyclic injection of brine and freshwater with a mean clay particle diameter of d ¯ p = 3 μ m and a standard deviation of σ p = 0.46 μ m. The clay mass fraction is maintained at 2 % . In Figure 5a, the distribution of the clay size for this set of simulations is shown. The minimum and maximum clay fine diameters are 2 μ m and 4 μ m, respectively.
We simulate nine cases with each having a randomized grain configuration similar to those in Section 3.2. In each case, the clay fines satisfy the distribution in Figure 5a, and are randomly initialized on the grain surfaces. An important modification in these nine cases, compared to those in Section 3.2, is that we doubled the duration of each freshwater phase to be 0.2 s in cycle 2. The rationale being that because these simulations have smaller clay fines, a longer duration may be required for clay migration before interception. Figure 5b shows the permeability and the absolute velocity in each phase of cycle 2 averaged over the nine simulated cases. The region enclosed between the maximum and minimum bounds across the nine simulations is colored in gray.
We observe a trend similar to that in the uniform clay size cases with a higher permeability in the brine-forward phase, followed by permeability damage in the freshwater-forward and freshwater-backward phases. The permeability remains damaged when brine is injected in the backward direction, followed by a complete recovery in the damaged permeability when the cycle is completed at the end of the final brine-forward phase. The reason for the observable discontinuities at t = 0.7 s and 0.9 s is that at those times the simulations were restarted to allow more time, which caused a momentary disruption.
We note that, firstly, there is a large variability among the simulated permeabilities during the freshwater injection phases, and that, secondly, the permeability damage for the non-uniform clay size cases during the freshwater injection phases is not as severe as in the uniform clay size cases. The former observation is in part because of the uncertainty introduced by have a non-uniform clay size distribution and possibly because we had nine simulations of non-uniform clay size compared to six of the uniform size. Note that the permeability and the absolute averaged velocity during the freshwater-backward phase are lower than those during the freshwater-forward phase. However, there is also a larger variation among the different cases simulated in the former phase compared to the latter. Figure 6 illustrates the difference between the cases with uniform clay size () and the non-uniform clay size ().
We observe that the permeability of the uniform clay size cases is, on average, larger than that of the non-uniform clay size cases across all phases. While in the uniform clay size cases, the permeability was nearly zero during the freshwater and backward brine phases, in the non-uniform clay size cases, the permeabilities are k = 0.2 × 10 13 m 2 , 0.9 × 10 14 m 2 , and 0.47 × 10 14 m 2 in the freshwater-forward, freshwater-backward, and brine-backward phases, respectively. These correspond to velocities of 6.6 × 10 2 mm/s, 3 × 10 2 mm/s, and 1.6 × 10 2 mm/s, respectively. We also observe that in the brine-backward phase of the non-uniform clay size cases, the permeability sharply decreases from 0.9 × 10 14 m 2 to 0.47 × 10 14 m 2 . This trend was observed in only one out of the nine simulated cases.
For a constant clay mass fraction of 2 % , and a non-uniform size distribution shown in Figure 5a, we have 36 clay fines and 35 clay fines in a uniform clay size and a non-uniform clay size simulation, respectively. The permeability for the non-uniform size distribution cases compared to the uniform size cases is due to fewer pore throats clogged in total in the former case compared to the latter. This phenomenon is illustrated by Figure 7a,b, which shows snapshots of simulations with a uniform clay size and a non-uniform clay size, respectively, at the end of the freshwater-backward phase. Note that both simulations have identical grain configurations. Figure 7a shows a front formed by the circled clay fines that blocks the flow of any fluid from right to left. Figure 7b shows the circled clay fines forming two incomplete fronts, allowing the flow of freshwater and brine from right to left.
Figure 7b also shows a streamline through the porous medium passing via the gaps in the incomplete clay fine fronts. Because the computational domain is periodic, so are its streamlines. Note that, specifically, the incomplete front in Figure 7b that is closer to the right edge of the computational domain is similar to the front in Figure 7a, except that clay fines that are smaller than the open pore throats have flown past those pores. Due to the incomplete fronts in Figure 7b, there is an averaged | U | of 0.14 mm/s and a permeability of k = 4.1 × 10 14 m 2 for this particular case of non-uniform clay size. Due to the complete front in Figure 7a, its absolute velocity is 0. A similar trend was found among cases of non-uniform clay size, wherein the permeability and the corresponding | U | in the freshwater and brine-backwards phases were significant. It is to be noted that, as indicated by the gray area in Figure 6b, there is variability among the different cases of non-uniform clay size in the said phases, with certain cases exhibiting successful clay fine fronts, thereby resulting in a near zero | U | .
From Figure 7b, it is evident that clay fines with smaller diameters than 3 μ m would travel longer distances before being intercepted. To further analyze the migration patterns of various clay fines, we average the displacements of the different categories of clay fines in the distribution shown in Figure 6a over the nine cases simulated. The distances are then normalized using the grain diameter of 20 μ m. Figure 8 shows the normalized average displacements along the x direction for the different categories of clay fines plotted over the different phases of cycle 2. x ¯ p is the average location of the clay fine and x ¯ p , 0 is its average initial position at the beginning of cycle 2. The gray plot shows the x displacement averaged across all clay fines in the six uniform clay size simulations. A key observation in the freshwater-forward phase of Figure 8 is that aside from the outlier of d p = 3.3 μ m, the smaller the size of the clay fine, the further it travels before interception. Clay fines with diameters smaller than 3 μ m travel more than one grain diameter before interception. On the other hand, we see that clay fines with d p = 4 μ m travel less than one grain radius before being intercepted implying that they clog the pore spaces in their immediate vicinity. Another observation is that the average displacements of d p = 3 μ m in the uniform and non-uniform clay size simulations are identical until the freshwater-forward phase, after which there is some deviation.
During the transition between the freshwater-backward and the brine-backward phases, we find the clay fine displacement plots to be relatively flat, indicating that the clay configuration does not undergo significant changes during this transition. In the final phase of cycle 2, we see a positive displacement in the clay fines of up to 30 % of the grain diameter. This displacement represents the clay fines reorienting themselves along their grains to clear pathways for the brine flow. At the end of the cycle, the averaged net displacement with respect to the starting point for every clay size is below 13 % of the grain diameter.

4. Conclusions

In this work, we used pore-scale simulations of clay fine transport in an idealized porous medium under cyclic freshwater and brine injection to study the extent to which the damaged permeability in the freshwater injection phase can be recovered. We carried out six simulations with a uniform clay size of d p = 3 μ m and nine additional simulations with a non-uniform clay diameter distribution having the same mean clay diameter, with each simulation run for two cycles of brine and freshwater injection. Our findings can be summarized as follows.
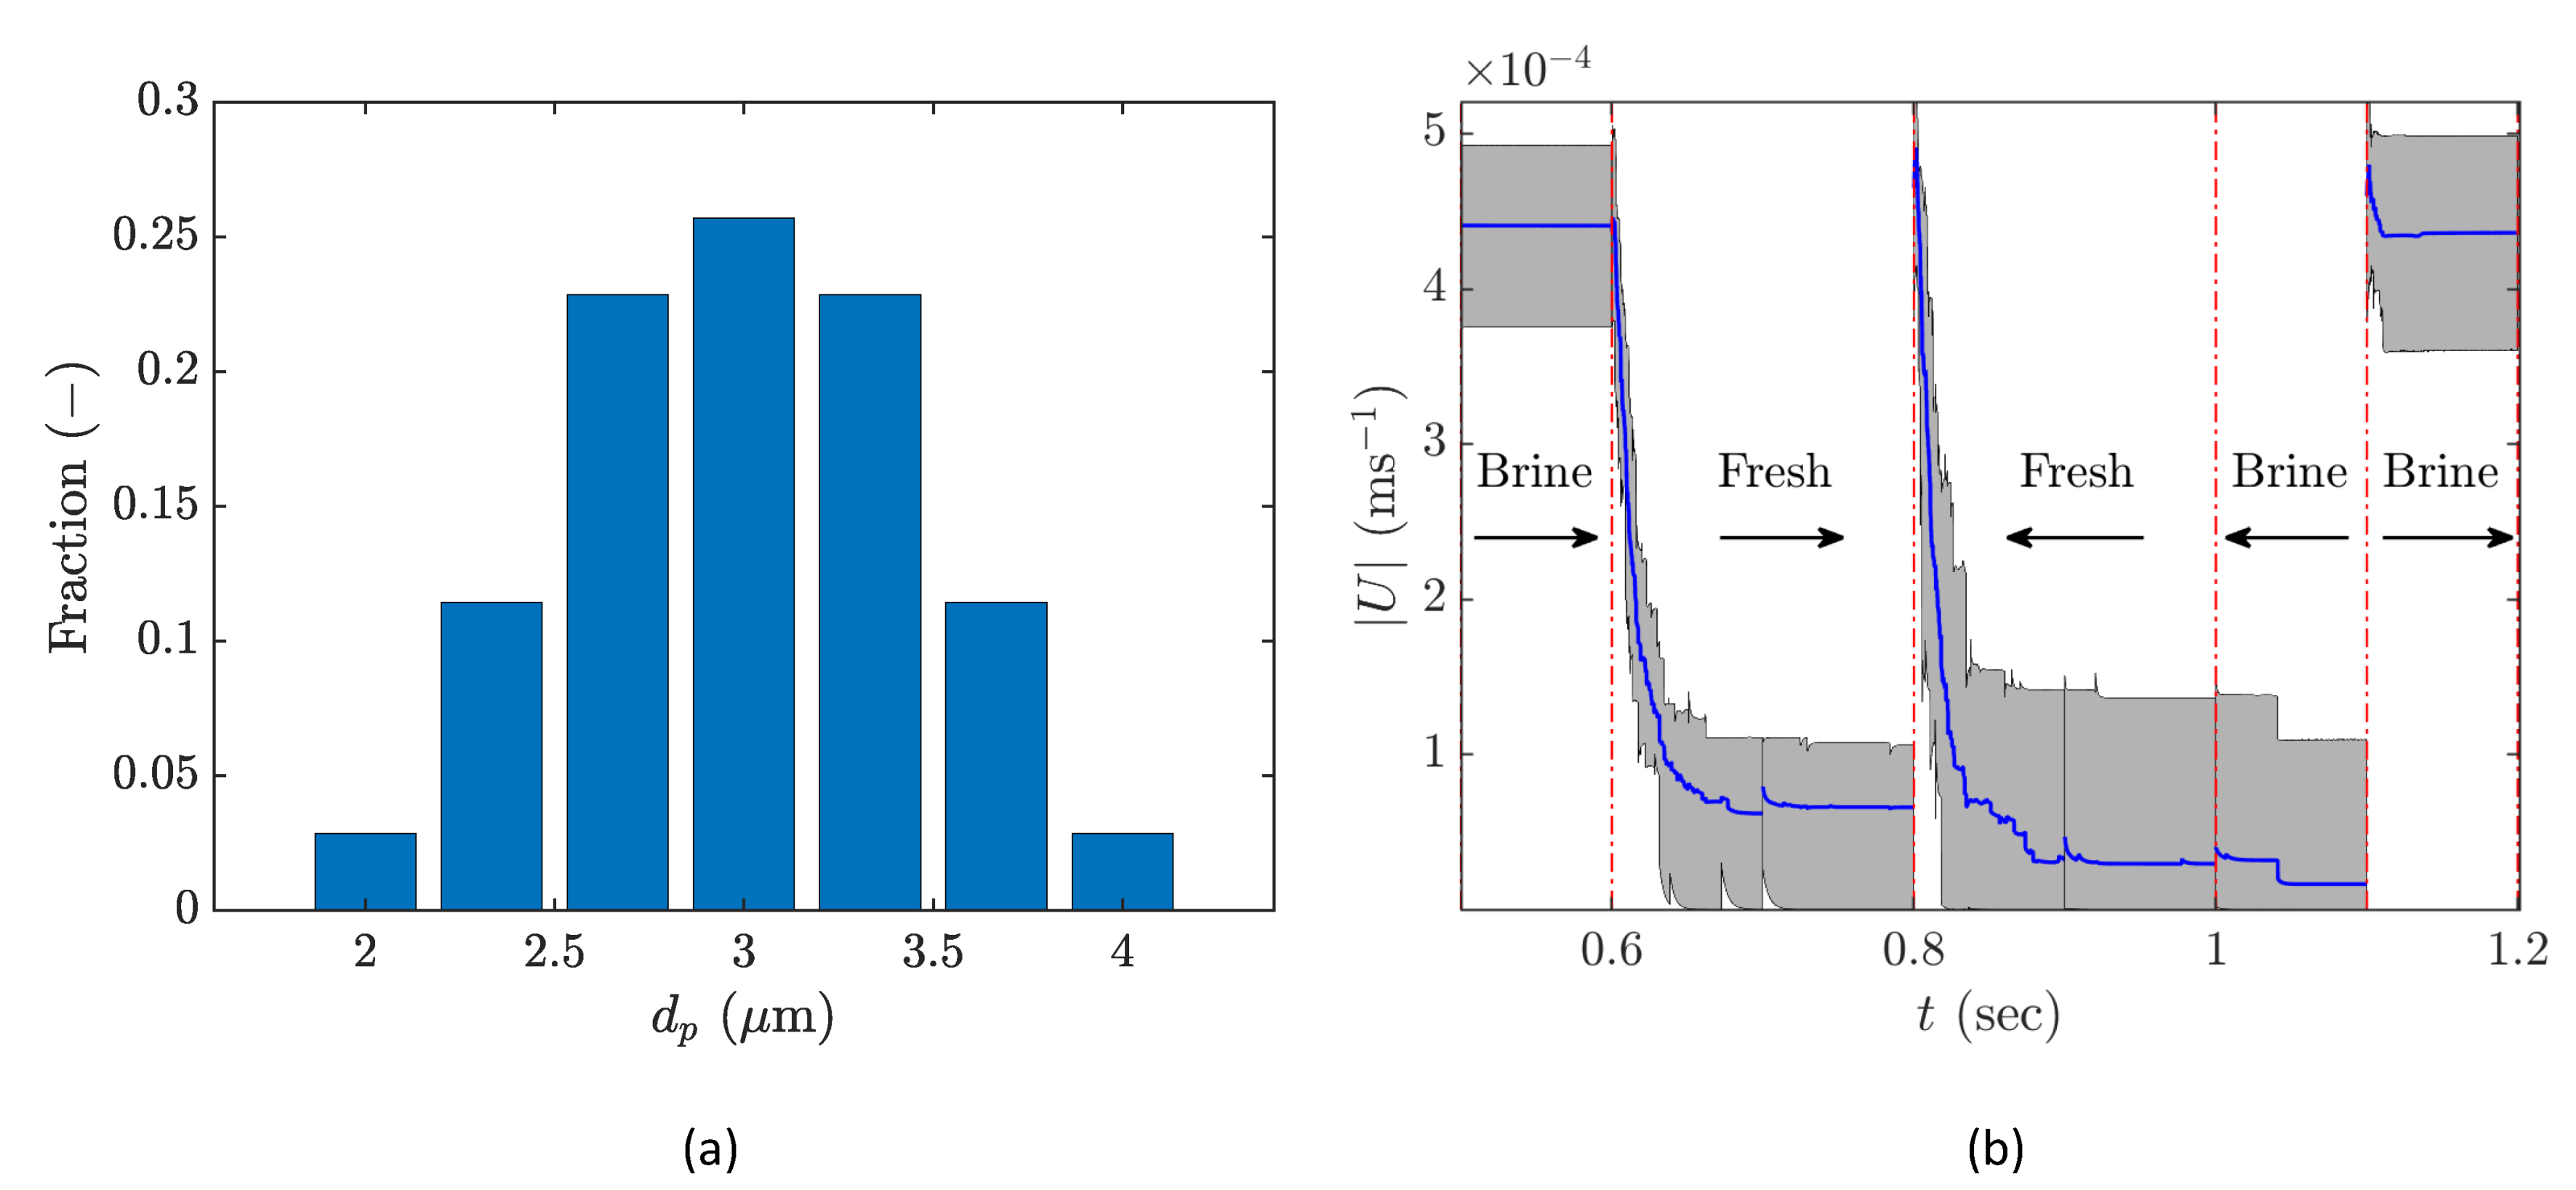
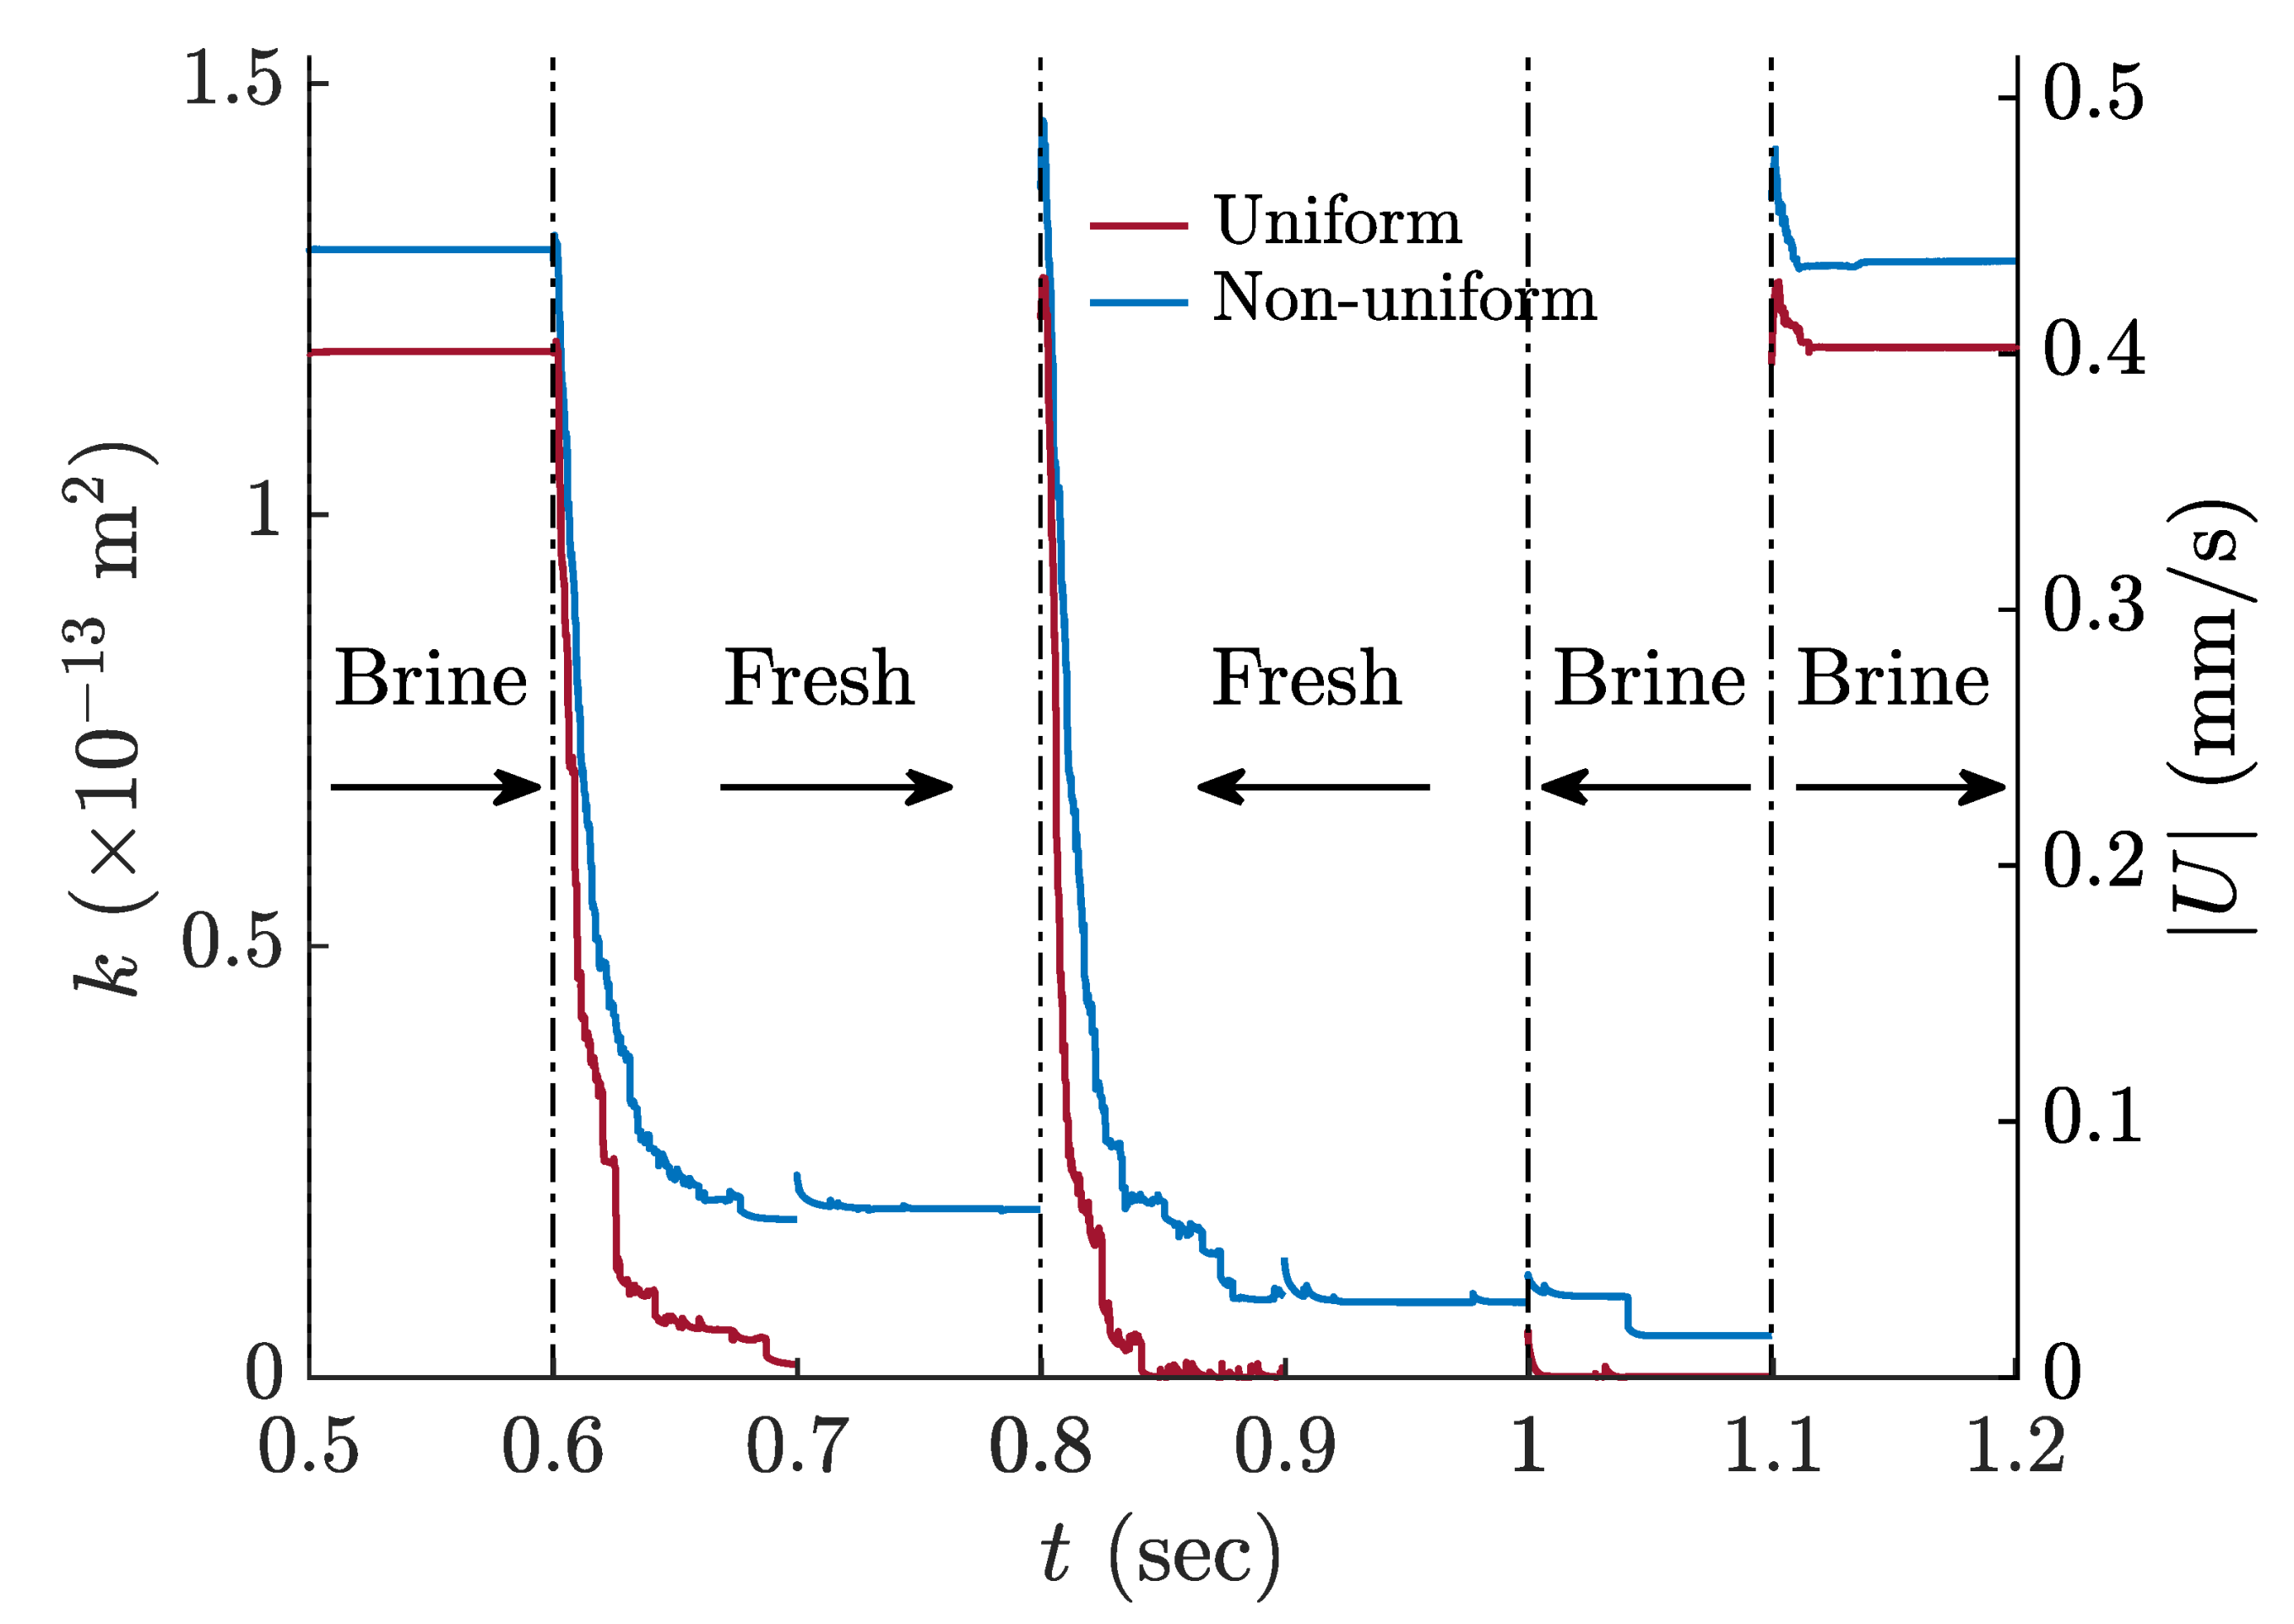
  • A clear relationship was established between the phenomenon of pore throat clogging by mobile clay fines and the permeability damage under low salinity conditions in the porous medium.
  • In addition to being a function of the instantaneous salinity in the medium, the permeability damage is a function of the immediate history of the flow through it, and also depends on the direction of the flow. This was demonstrated by the repeated observation from our simulations that brine flow after freshwater flow along the same direction does not restore any of the permeability damage.
  • In contrast, the permeability damage observed during injection in a fixed direction is recovered when followed by injection of brine in the opposite direction. This can be attributed to the process of the unclogged clay fines staying bound to the grains by strong net attractive DLVO force under high salinity, and moving along the grain surface to allow brine flow in the reverse direction.
  • With the clay mass fraction and mean clay size kept constant, a non-uniform clay diameter distribution resulted in a less severe damage in permeability compared to a uniform clay size, in the freshwater injection phase. However, in both cases the permeability was completely restored when followed by freshwater-backward and brine-forward injection, in that order.
Future work on this topic would involve carrying out high-fidelity 3D modeling of the clay transport and pore throat clogging phenomenon. While 2D simulations provide useful insights into the physical processes, such as clay detachment and pore throat clogging, one would require a 3D model to build constitutive models that can be used in larger scale porous media modeling.

Supplementary Materials

The following supporting information can be downloaded at: https://www.mdpi.com/article/10.3390/en16227568/s1, Figure S1: (a–c) showing snapshots of the solute transport simulation at various times. (d) showing the final snapshot of the simulation with uniform salinity change. (e) Comparison between the permeability decline during forward flow salinity transition from 0.2M to 0.002M when the change is governed by solute transport from left to right () and the change is instantaneous ().

Author Contributions

Conceptualization, P.B. and A.C.; methodology, P.B. and A.C.; software, P.B.; validation, P.B.; formal analysis, P.B. and A.C.; investigation, P.B.; resources, P.B. and A.C.; data curation, P.B. and A.C.; writing—original draft preparation, P.B.; writing—review and editing, A.C. and J.T.B.; visualization, P.B.; supervision, A.C.; project administration, A.C. and J.T.B.; funding acquisition, A.C. and J.T.B. All authors have read and agreed to the published version of the manuscript.

Funding

This research was funded by the U.S. Department of Energy (DOE), Chemical Sciences, Geosciences, and Biosciences Division and the Office of Fossil Energy and Carbon Management under Contract DE-AC02-05CH11231.

Data Availability Statement

The authors will share a video of the freshwater-brine cycle simulation, and a video of permeability damage simulation with solute transport. Additionally, there will be Supplementary Material drawing comparisons between the permeability damage with and without solute transport.

Conflicts of Interest

The authors declare no conflict of interest.

Abbreviations

The following abbreviations are used in this paper:
DLVODerjaguin–Landau–Verwey–Overbeek force
vdWVan der Waals force
EDLElectric double layer force

Appendix A. Supplementary Analyses

Appendix A.1. Grid Independence Analysis

To determine the minimum number of grid points required to provide sufficient accuracy in our simulations, a toy problem is considered with a clay particle of diameter d p = 3 μ m initially resting on a grain of diameter d g = 20 μ m. The domain length is 40 μ m along both x and y directions. At t = 0 , a background flow of magnitude U ¯ = 0.001 ms 1 is introduced into the computational domain causing the clay to subsequently move along the grain and depart from it.
Figure A1. Comparison between the particle trajectories of five grid resolutions, with the red dashed line (---) corresponding to one particle diameter equaling six times the cell width (bottom row), and the velocity contour plot for different times corresponding to the 80 × 80 case (top row).
Energies 16 07568 g0a1
Five different grid refinement levels were considered: 40 × 40 , 60 × 60 , 80 × 80 , 100 × 100 , and 120 × 120 . An inflow boundary condition with a uniform velocity of 0.001 ms 1 is imposed on the left boundary, and a fixed-pressure type outflow boundary condition is imposed on the right boundary. The top and bottom sides have the free slip boundary condition. DLVO forces are considered to be zero in this simulation, because the hydrodynamic force on the particle, which is grid-size-dependent, is of interest in this analysis. DLVO forces are grid independent in all simulations in this paper and only depend on the salinity. Figure A1 shows the plots of the clay trajectory along the x and y directions for various grid configurations (bottom row) and the velocity contour at different times for the 80 × 80 case (top row). The 80 × 80 case corresponding to six grid cells spanning one particle diameter resulted in a maximum error of 3 % in the clay trajectory compared to the most refined grid configuration. The 60 × 60 corresponding to 4.5 grid cells spanning one clay diameter resulted in a maximum error of 5.5 % . From this analysis, it is concluded that having approximately six grid cells within a clay particle along its diameter is the optimal level of grid refinement for all simulations.

Appendix A.2. Implementation of the Immersed Boundary Method

The Immersed Boundary Method (IBM) is implemented using the finite volume method on a structured Cartesian grid by using the level-set method, and employing the color function c ( x ) defined in Equation (3). The fractional-step method is implemented using intermediate velocities U * and U * * defined with the following equations.
U * U n Δ t = R ν U * , U n R c U n .
U * * U * Δ t = F ib n .
U n + 1 U * * Δ t = 1 ρ p n + 1 .
. U n + 1 = 0 .
Here, the terms R ν and R c are the diffusive and convective terms in the Navier–Stokes equations. The diffusive term is discretized using a second-order central-difference scheme, and the convective term is discretized using a second-order upwind scheme. F ib is the immersed-boundary force computed using Equation (4). Equations (A1) and (A2) are solved sequentially in that order to obtain U * and U * * . U * * and U n + 1 are plugged into Equation (A4) to formulate a Poisson equation for p n + 1 . Then, the pressure is plugged into Equation (A3) to obtain U n + 1 . For more details of the implementation, refer to our previous work on this topic [25].

References

  1. Civan, F. Reservoir Formation Damage: Fundamentals, Modeling, Assessment, and Mitigation, 3rd ed.; Gulf Professional Publishing: Houston, TX, USA, 2015; pp. 1–1012. [Google Scholar]
  2. Corapcioglu, M.; Abboud, N.; Haridas, A. Governing Equations for Particle Transport in Porous Media. In Advances in Transport Phenomena in Porous Media; Springer: Dordrecht, The Netherlands, 1987; pp. 269–342. [Google Scholar]
  3. De Silva, D.; Ranjith, P.G.; Perera, S.; Dai, Z.; Yang, S. An experimental evaluation of unique CO2 flow behaviour in loosely held fine particles rich sandstone under deep reservoir conditions and influencing factors. Energy 2017, 119, 121–137. [Google Scholar] [CrossRef]
  4. Goldenberg, L.; Magaritz, M.; Mandel, S. Experimental investigation on irreversible changes of hydraulic conductivity on the seawater-freshwater interface in coastal aquifers. Water Resour. Res. 1983, 19, 77–85. [Google Scholar] [CrossRef]
  5. Khilar, K.; Fogler, H. Migrations of Fines in Porous Media; Springer: Dordrecht, The Netherlands, 1998. [Google Scholar]
  6. Xie, Q.; Saeedi, A.; Delle Piane, C.; Esteban, L.; Brady, P. Fines migration during CO2 injection: Experimental results interpreted using surface forces. Int. J. Greenh. Gas Control. 2017, 65, 32–39. [Google Scholar] [CrossRef]
  7. You, Z.; Yang, Y.; Badalyan, A.; Bedrikovetsky, P.; Hand, M. Mathematical modelling of fines migration in geothermal reservoirs. Geothermics 2016, 59, 123–133. [Google Scholar] [CrossRef]
  8. Brown, D.L.; Silvey, W.D. Artificial recharge to a freshwater-sensitive brackish-water sand aquifer, Norfolk, Virginia. U.S. Geol. Surv. Prof. Paper 1977, 53, 939. [Google Scholar]
  9. Cihan, A.; Petrusak, R.; Bhuvankar, P.; Alumbaugh, D.; Trautz, R.; Birkholzer, J. Permeability Decline by Clay Fines Migration around a Low-Salinity Fluid Injection Well. Groundwater 2022, 60, 87–98. [Google Scholar] [CrossRef]
  10. Jones, J. Influence of Chemical Composition of Water on Clay Blocking of Permeability. J. Pet. Technol. 1964, 16, 441–446. [Google Scholar] [CrossRef]
  11. Khilar, K.; Fogler, H. Water Sensitivity of Sandstones. Soc. Pet. Eng. J. 1983, 23, 55–64. [Google Scholar] [CrossRef]
  12. Konikow, L.; August, L.; Voss, C. Effects of Clay Dispersion on Aquifer Storage and Recovery in Coastal Aquifers. Transp. Porous Media 2001, 43, 45–64. [Google Scholar] [CrossRef]
  13. Mohan, K.; Fogler, H. Colloidally induced smectitic fines migration: Existence of microquakes. Aiche J. 1997, 43, 565–576. [Google Scholar] [CrossRef]
  14. Shenglai, Y.; Sheng, Z.; Liu, W.; Song, Z.; Wu, M.; Zhang, J. Evaluation and prevention of formation damage in offshore sandstone reservoirs in China. Pet. Sci. 2008, 5, 340–347. [Google Scholar]
  15. Song, W.; Kovscek, A. Direct visualization of pore-scale fines migration and formation damage during low-salinity waterflooding. J. Nat. Gas Sci. Eng. 2016, 34, 8. [Google Scholar] [CrossRef]
  16. Torkzaban, S.; Bradford, S.; Vanderzalm, J.; Patterson, B.; Harris, B.; Prommer, H. Colloid release and clogging in porous media: Effects of solution ionic strength and flow velocity. J. Contam. Hydrol. 2015, 181, 161–171. [Google Scholar] [CrossRef] [PubMed]
  17. Wilson, M.; Wilson, L.; Patey, I. The influence of individual clay minerals on formation damage of reservoir sandstones: A critical review with some new insights. Clay Miner. 2014, 49, 147–164. [Google Scholar] [CrossRef]
  18. Israelachvili, J. Intermolecular and Surface Forces, 3rd ed.; Academic Press: Cambridge, UK, 2011. [Google Scholar]
  19. Churaev, N.; Lyklema, J.; Churaeva, M. Liquid and Vapor Flows in Porous Bodies: Surface Phenomena; Routledge: London, UK, 2018. [Google Scholar]
  20. Chequer, L.; Vaz, A.; Bedrikovetsky, P. Injectivity decline during low-salinity waterflooding due to fines migration. J. Pet. Sci. Eng. 2018, 165, 1054–1072. [Google Scholar] [CrossRef]
  21. Russell, T.; Pham, D.; Neishaboor, M.; Badalyan, A.; Behr, A.; Genolet, L.; Kowollik, P.; Zeinijahromi, A.; Bedrikovetsky, P. Effects of kaolinite in rocks on fines migration. J. Nat. Gas Sci. Eng. 2017, 45, 243–255. [Google Scholar] [CrossRef]
  22. Brady, P.; Morrow, N.; Fogden, A.; Deniz, V.; Loahardjo, N.; Winoto, W. Electrostatics and the Low Salinity Effect in Sandstone Reservoirs. Energy Fuels 2015, 29, 150126112424008. [Google Scholar] [CrossRef]
  23. Blume, T.; Weisbrod, N.; Selker, J. Permeability Changes in Layered Sediments: Impact of Particle Release. Groundwater 2002, 40, 466–474. [Google Scholar] [CrossRef]
  24. Khilar, K.; Fogler, H. Permeability Reduction in Water Sensitivity of Sandstones. In Surface Phenomena in Enhanced oil Recovery; Springer: Boston, MA, USA, 1981; pp. 721–740. [Google Scholar]
  25. Bhuvankar, P.; Cihan, A.; Birkholzer, J. Pore-scale CFD simulations of clay mobilization in natural porous media due to fresh water injection. Chem. Eng. Sci. 2022, 247, 117046. [Google Scholar] [CrossRef]
  26. Mittal, R.; Iaccarino, G. Immersed Boundary Methods. Annu. Rev. Fluid Mech. 2005, 37, 239–261. [Google Scholar] [CrossRef]
  27. Bhattacharjee, S.; Elimelech, M. Surface Element Integration: A Novel Technique for Evaluation of DLVO Interaction between a Particle and a Flat Plate. J. Colloid Interface Sci. 1997, 193, 273–285. [Google Scholar] [CrossRef] [PubMed]
  28. Kim, J.; Moin, P. Application of a fractional-step method to incompressible Navier-Stokes equations. J. Comput. Phys. 1985, 59, 308–323. [Google Scholar] [CrossRef]
  29. Bedrikovetsky, P.; Siquera, F.D.; Furtado, C.A.; Souza, A.L.S. Modified particle detachment model for colloidal transport in porous media. Transp Porous Med. 2010, 86, 353–383. [Google Scholar] [CrossRef]
  30. Sefrioui, N.; Ahmadi-Sénichault, A.; Omari, A.; Bertin, H. Numerical simulation of retention and release of colloids in porous media at the pore scale. Colloids Surfaces Physicochem. Eng. Asp. 2013, 427, 33–40. [Google Scholar] [CrossRef]
  31. Sethian, J.; Smereka, P. Level Set Methods For Fluid Interfaces. Annu. Rev. Fluid Mech. 2003, 35, 341–372. [Google Scholar] [CrossRef]
  32. Bigot, B.; Bonometti, T.; Lacaze, L.; Thual, O. A simple immersed-boundary method for solid-fluid interaction in constant and stratified-density flows. Comput. Fluids 2014, 97, 126–142. [Google Scholar] [CrossRef]
  33. Ardekani, A.; Dabiri, S.; Rangel, R. Collision of multi-particle and general shape objects in a viscous fluid. J. Comput. Phys. 2008, 227, 10094–10107. [Google Scholar] [CrossRef]
  34. Vincent, S.; Motta, J.; Sarthou, A.; Estivalèzes, J.; Simonin, O.; Climent, E. A Lagrangian VOF tensorial penalty method for the DNS of resolved particle-laden flows. J. Comput. Phys. 2013, 256, 582–614. [Google Scholar] [CrossRef]
  35. Andrade, J.; Lim, K.; Avila, C.; Vlahinić, I. Granular element method for computational particle mechanics. Comput. Methods Appl. Mech. Eng. 2012, 241–244, 262–274. [Google Scholar] [CrossRef]
  36. Zeinijahromi, A.; Vaz, A. Well impairment by fines migration in gas fields. J. Pet. Sci. Eng. 2012, 88–89, 125–135. [Google Scholar] [CrossRef]
  37. Bhattacharjee, S.; Elimelech, M.; Borkovec, M. DLVO Interaction between Colloidal Particles: Beyond Derjaguin’s Approximation. Croat. Chem. Acta 1998, 71, 883–903. [Google Scholar]
  38. Wang, L.; Yin, Z. Fluid flow and mass transport in fractured media with curved fractures and varying apertures: A 3D modeling approach. Int. J. Numer. Methods Eng. 2023, 124, 4311–4338. [Google Scholar] [CrossRef]
  39. Bodin, J. From analytical solutions of solute transport equations to multidimensional time-domain random walk (TDRW) algorithms. Water Resour. Res. 2015, 51, 1860–1871. [Google Scholar] [CrossRef]
  40. Zou, L.; Cvetkovic, V. Impact of normal stress-induced closure on laboratory-scale solute transport in a natural rock fracture. J. Rock Mech. Geotech. Eng. 2020, 12, 732–741. [Google Scholar] [CrossRef]
  41. Gray, D.; Rex, R. Formation Damage in Sandstones Caused by Clay Dispersion and Migration. Clays Clay Miner. 1966, 14, 355–366. [Google Scholar] [CrossRef]
Figure 1. Problem setup and the various boundary conditions.
Energies 16 07568 g001
Figure 2. The k vs. t plot from an example simulation showing that the permeability damage during freshwater injection correlates with pore clogging at various times, as indicated by snapshots of the simulation.
Energies 16 07568 g002
Figure 3. A plot of the permeability k and corresponding absolute velocity | U | against time averaged over the six simulations with uniform clay size, showing two cycles of freshwater and brine injection. Rightward and leftward arrows indicate forward and backward flows, respectively.
Energies 16 07568 g003
Figure 4. Snapshots of a simulation at four different stages of cycle 2: t = 0.6 s, 0.7 s, 0.8 s, and 1.0 s, showing the clay fine distribution at each stage.
Energies 16 07568 g004
Figure 5. (a) The size distribution of clay fines with a mean diameter of 3 μ m and a standard deviation of 0.46 μ m. (b) The evolution of the permeability k and absolute velocity | U | at the different phases of cycle 2 averaged over nine different cases.
Energies 16 07568 g005
Figure 6. A comparison between the permeability k and the averaged absolute velocity | U | for the simulations with a uniform clay size () and a non-uniform clay size distribution (), during cycle 2. The timelines have been shifted to match the beginnings of various phases.
Energies 16 07568 g006
Figure 7. Snapshots at the end of the freshwater-forward phases of simulations with (a) a uniform clay size and (b) a non-uniform clay size, showing the different fronts formed by clogged clay fines.
Energies 16 07568 g007
Figure 8. Normalized displacements of seven categories of clay sizes during the different phases of cycle 2. The thick gray colored plot represents the averaged displacement from the uniform clay size simulations.
Energies 16 07568 g008
Disclaimer/Publisher’s Note: The statements, opinions and data contained in all publications are solely those of the individual author(s) and contributor(s) and not of MDPI and/or the editor(s). MDPI and/or the editor(s) disclaim responsibility for any injury to people or property resulting from any ideas, methods, instructions or products referred to in the content.

