Article

Unconventional Reservoir Characterization and Formation Evaluation: A Case Study of a Tight Sandstone Reservoir in West Africa

1
Bartlett School of Environment Energy & Resources (BSEER), University College London (UCL), Central House, 14 Upper Woburn Place, London WC1H 0NN, UK
2
School of Energy and Electronic Engineering, Faculty of Technology, University of Portsmouth, Lion Gate Building, Lion Terrace, Portsmouth PO1 3HF, UK
3
School of Chemistry, Faculty of Engineering and Physical Sciences, The University of Southampton, Highfield Campus, University Road, Southampton SO17 1BJ, UK
4
New College of the Humanities, Northeastern University, London E1W 1LP, UK
5
Faculty of Earth Sciences, Kharazmi University, Mashhad 15719-14911, Iran
6
Chemical Engineering Department, College of Engineering, King Khalid University, Abha 61411, Saudi Arabia
*
Authors to whom correspondence should be addressed.
Energies 2023, 16(22), 7572; https://doi.org/10.3390/en16227572
Submission received: 24 August 2023 / Revised: 29 October 2023 / Accepted: 31 October 2023 / Published: 14 November 2023
(This article belongs to the Special Issue Recent Advances in Oil and Gas Recovery and Production Optimisation)

Abstract

:
Unconventional reservoirs, including gas shales and tight gas sands, have gained prominence in the energy sector due to technological advancements and escalating energy demands. The oil industry is eagerly refining techniques to decipher these reservoirs, aiming to reduce data collection costs and uncertainties in reserve estimations. Characteristically, tight reservoirs exhibit low matrix porosity and ultra-low permeability, necessitating artificial stimulation for enhanced production. The efficacy of the stimulation hinges on the organic material distribution, the rock’s mechanical attributes, and the prevailing stress field. Comprehensive petrophysical analysis, integrating standard and specialized logs, core analyses, and dynamic data, is pivotal for a nuanced understanding of these reservoirs. This ensures a reduction in prediction uncertainties, with parameters like shale volume, porosity, and permeability being vital. This article delves into an intricate petrophysical evaluation of the Nene field, a West African unconventional reservoir. It underscores the geological intricacies of the field, the pivotal role of data acquisition, and introduces avant-garde methodologies for depth matching, rock typing, and the estimation of permeability. This research highlights the significance of unconventional reservoir exploration in today’s energy milieu, offering a granular understanding of the Nene field’s geological challenges and proffering a blueprint for analogous future endeavours in unconventional reservoirs.

1. Introduction

Due to rising energy demand, unconventional reservoirs such as shales and tight sands have become increasingly economically appealing in recent years. The oil industry is thus concentrating on developing techniques to better understand and characterize these types of reservoirs, lowering the data collecting costs and uncertainty in reserve evaluation. The exploration and development of unconventional oil and gas resources have become crucial in the global energy landscape, providing alternative energy sources and driving technological advancements in extraction methodologies. Ahmed and Meehan have delineated various strategies and technologies vital to the extraction and management of these resources, underscoring the complexity and potential of unconventional reservoirs. Unconventional resources are geologically and petrophysically complicated organic rich deposits that must be hydraulically fracture-stimulated to extract gas or oil at economically viable rates. Horizontal laterals are increasingly being used to explore and produce hydrocarbon resources. The predominant clay matrix particle size of these source rock reservoirs includes heterogeneous compositional components [1]. These very complex reservoirs have extremely complex pore systems that are characterized by nanoscale (extremely small-sized) inorganic and organic interparticle, inter-crystalline, and intraparticle pores [2]. The quality of the reservoir (RQ) and the quality of the completion (CQ) are the two most important criteria in determining high hydrocarbon output in unconventional reservoirs [3]. Reservoir quality indicates the quantity of hydrocarbon in a reservoir, the amount of hydrocarbon in situ, and the capacity of the rock formation to supply hydrocarbon. Completion Quality (CQ) denotes the ability of the material to create and maintain a fracture surface area, in addition to its suitability for stimulation. Total organic carbon (TOC), thermal maturity, organic matter, mineralogical composition, lithology, effective porosity, fluid saturations, permeability, and formation pressure are some of the critical elements determining the reservoir quality [4]. Due to unconventional formations being more tightly packed than conventional reservoirs, accessing these resources is a very different process from developing conventional reservoirs. Obtaining oil and gas from tight formations occasionally requires not only a larger number of wells compared to conventional reservoir development, but also the employment of advanced technologies, including horizontal drilling and hydraulic fracturing. When it comes to producing hydrocarbons from numerous shale and other tight reservoirs, horizontal drilling combined with multistage hydraulic fracturing has been shown to be the most cost-effective method of extraction. The key variables and characteristics of innovative technologies include horizontal well patterns, a hydraulic fracturing design, stage count, and perforation clusters. To optimize well location, various well-spacing pilots are routinely employed, and numerous hydraulic fracturing operational schemes are often assessed to ascertain the most effective approach [5]. Conventional and tight sandstone reservoirs are the two types of clastic sandstone reservoirs. These two types of reservoirs are extremely distinct from one another in terms of their depositional environment, diagenetic evolution, pore type, pore throat size, pore connectivity, and reservoir performance. For example, the pore throat diameter for tight sandstone reservoirs is specified as 0.03–2 µm. Furthermore, tight reservoirs have confining pressure permeabilities in the range of 0.1–100 µm2. The development of pores is primarily determined by the composition of the sediment, as well as by compaction, cementation, and tectonic compression; moreover, particle encrustation works to prevent quartz from being cemented. Sandstone reservoirs that are relatively tight have low compositional and textural maturities, in addition to large heterogeneities [6]. Intragranular dissolved pores, micropores, and microfractures make up the majority of their pores. The two most important factors in reducing pore size are compaction and cementation. Fracture evaluation and prediction in tight reservoirs can currently be achieved by the following steps: (1) observing the characteristics, cutting relationships, and distributions of fractures based on outcrops, drill cores, and thin sections; (2) determining fracture stages through the homogenization temperature of inclusions, ESR dating results, and paleo-stress analysis (determining the different developmental stages of fractures by utilizing various analytical methods that provide insights into the historical and geological conditions under which the fractures occurred and evolved); and (3) predicting their spatial distribution through a combination of rocks, stages, constraints, and numerical simulations [6]. Zou [6] provides a comprehensive exploration of unconventional petroleum geology, tracing its evolution and impact on the methodologies employed in the exploration and extraction of unconventional resources. The historical context and current applications of unconventional petroleum geology, as detailed by Zou [6], offer a framework through which the strategies and methodologies employed in this study can be understood and contextualized. Due to the complexity and variability of unconventional reservoirs, to obtain a comprehensive understanding of these reservoirs, integrated reservoir characterization approaches that combine technical data from multiple sources and utilize various techniques are required. One such approach is demonstrated in the study by Chekani and Kharrat (2012), who conducted an integrated reservoir characterization analysis in a carbonate reservoir. Their case study provides valuable insights into the application of advanced techniques for reservoir characterization, highlighting the importance of integrating geological, geophysical, and petrophysical data [7]. In a similar vein, Metwalli et al. (2018) presented a reservoir characterization study conducted in the Alam El Bueib reservoir of the Tut oil field in the north of the Western Desert of Egypt. Their research focuses on the environmental aspects of reservoir characterization, shedding light on the impact of geological and geophysical factors on reservoir behaviour [8]. Furthermore, Oyeyemi et al. (2018) contributed to the field of reservoir characterization by combining petrophysical analysis and seismically derived data in the offshore Niger Delta. Their study showcases the effectiveness of integrating multiple data sources to enhance reservoir evaluation and improve decision-making processes [9]. By incorporating these studies into our research, we aim to expand the existing knowledge base on reservoir characterization and explore the potential benefits of integrated approaches. In this paper, we will build upon the findings of previous studies and present a comprehensive analysis of reservoir characterization in one of the West Africa tight sandstone reservoirs. While significant strides have been made in understanding and exploiting unconventional resources, gaps persist in the comprehensive petrophysical evaluation of these reservoirs, as highlighted by the challenges in accurately determining properties like pore structure and reservoir heterogeneity. This study seeks to address these gaps by providing a meticulous and multifaceted approach toward the petrophysical evaluation of unconventional reservoirs, integrating various methods and data sources to derive a more nuanced understanding of their properties and characteristics. By employing various methods to estimate permeability and conducting comparative analyses, this research ensures a robust and validated understanding of the reservoir’s permeability, thereby contributing to the optimization of extraction strategies and well placement in fields like the Nene.

2. Overview of Study Area

2.1. Nene Marine Field

Nene Marine field is situated in Block Marine XII, as can be seen in Figure 1, about 17 km from the coastline of Congo Brazzaville, in the Congolese Republic. The Nene Marine oilfield is situated roughly 28 m beneath the water’s surface. It owes its oil production to the Djeno pre-salt deposit, located 2.5 km below the ground surface.
The building of production platforms and completion drilling operations for over 30 wells have been finalised, with a production rate of more than one hundred and forty thousand barrels of crude oil equivalent per day (boe/d) expected. The first phase’s production capacity is 7500 boe/d, which will be gathered from a platform that has been specifically designed for this purpose. Following that, the oil is transported to the Zatchi production platform, where it is processed via an undersea pipeline that extends over almost 17 km. It was discovered that the Nene Marine 3 well was capable of producing more than five thousand oil barrels per day and its density was 36 degrees API during the production test. This is another significant achievement for the operator in the Congo Basin. The operator (ENI) of the Nene Marine field has identified resources in the Congolese Marine XII Block that are estimated to be worth around 3.5 billion barrels of oil equivalent [10].

2.2. Geological Setting

It has been largely agreed that there are two major intervals in the Congo Basin’s stratigraphy: the pre-salt section which represents continental rift sedimentation, and the post-salt section, which represents mainly marine sedimentation on the subsiding West Africa passive margin. The Aptian Loeme Salt, in particular, connects different spaces and indicates the significant entrance of the South Atlantic Ocean into the rift [11].
Figure 2 illustrates the geological layers of the region, starting with the deepest pre-salt layer known as the Vandji formation, ascending to the uppermost post-salt layer referred to as the Senji formation. Harris et al. (2000) mentioned that thick clastic sequence fluvial systems are deposited in the Nene Marine field, which is located in a deep marine environment. The reservoir’s lithology is mostly composed of tight sandstone, which is referred to as the Vandji formation at the reservoir’s base, and the Sialivakou and Djeno formations at the reservoir’s higher levels. The Sialivakou is composed of grey-to-black shale and less sandy mudstones, which are thought to have formed as a result of a debris flow. The Djeno formation is mostly composed of laminated dark grey shale, with intervals of muddy sandstone. The total organic carbon concentration of shale plays in the Congo Basin (Lower Cretaceous) is indeed an illustration of the connections between soil characteristics, rift topography, nutrient supply, and bio-productivity, and it is not dependent on water depth or anoxic conditions. Additionally, total organic carbon ranges are of 2–3% across the active rift area, and the kerogen there is composed of types I and III. Thus, the total organic carbon concentration in the late rift region averages 6%, with algal and bacterial type I kerogen accounting for the majority of it [12].

3. Formation Evaluation and Reservoir Characterization

Unconventional source rock reservoirs, also known as unconventional oil or gas shale reservoirs, are distinguished by their geological and petrophysical complexities. Characteristically, they are organic-rich, fine-grained mudrocks, requiring hydraulic fracturing for economically viable hydrocarbon extraction. These reservoirs predominantly comprise a clay matrix, interspersed with heterogeneous compositional elements. These elements might include varying concentrations of extrabasinal clastics, such as quartz, feldspars, and clays, which originate from terrigenous fluid or airborne sources, and reworked rock fragments including carbonate, igneous, metamorphic, and volcanic rock fragments. Additionally, intrabasinal sedimentary particles—primarily silica, calcite, and altered kerogen of biological origin—are present.
For hydrocarbon generation, these reservoirs should exhibit exceedingly high hydrocarbon saturations, denoted as So for oil and Sg for gas, and minimal to sub-irreducible water saturations (Sw). They may also feature natural fracture systems, either sub-vertical, attributed to tectonic activities, or horizontal, originating from the petroleum systems.
A defining characteristic of these reservoirs is their exceptionally low permeability, often residing in the nanodarcy range. Hydrocarbons can exist in adsorbed states on kerogen and clay surfaces—referred to as adsorbed gas—or may be found within the pores, denoted as free gas.
To identify areas with higher prospective values, a comprehensive unconventional reservoir characterization spanning the entire basin is imperative. This involves the quantification of a myriad of fluid and rock properties, including petrophysics, geology, geophysics, engineering, geomechanical properties, and geochemistry. Figure 3 shows how the attributes of source rock reservoirs can be classified to ascertain the requisite rock or fluid properties and their measurement methodologies [13].

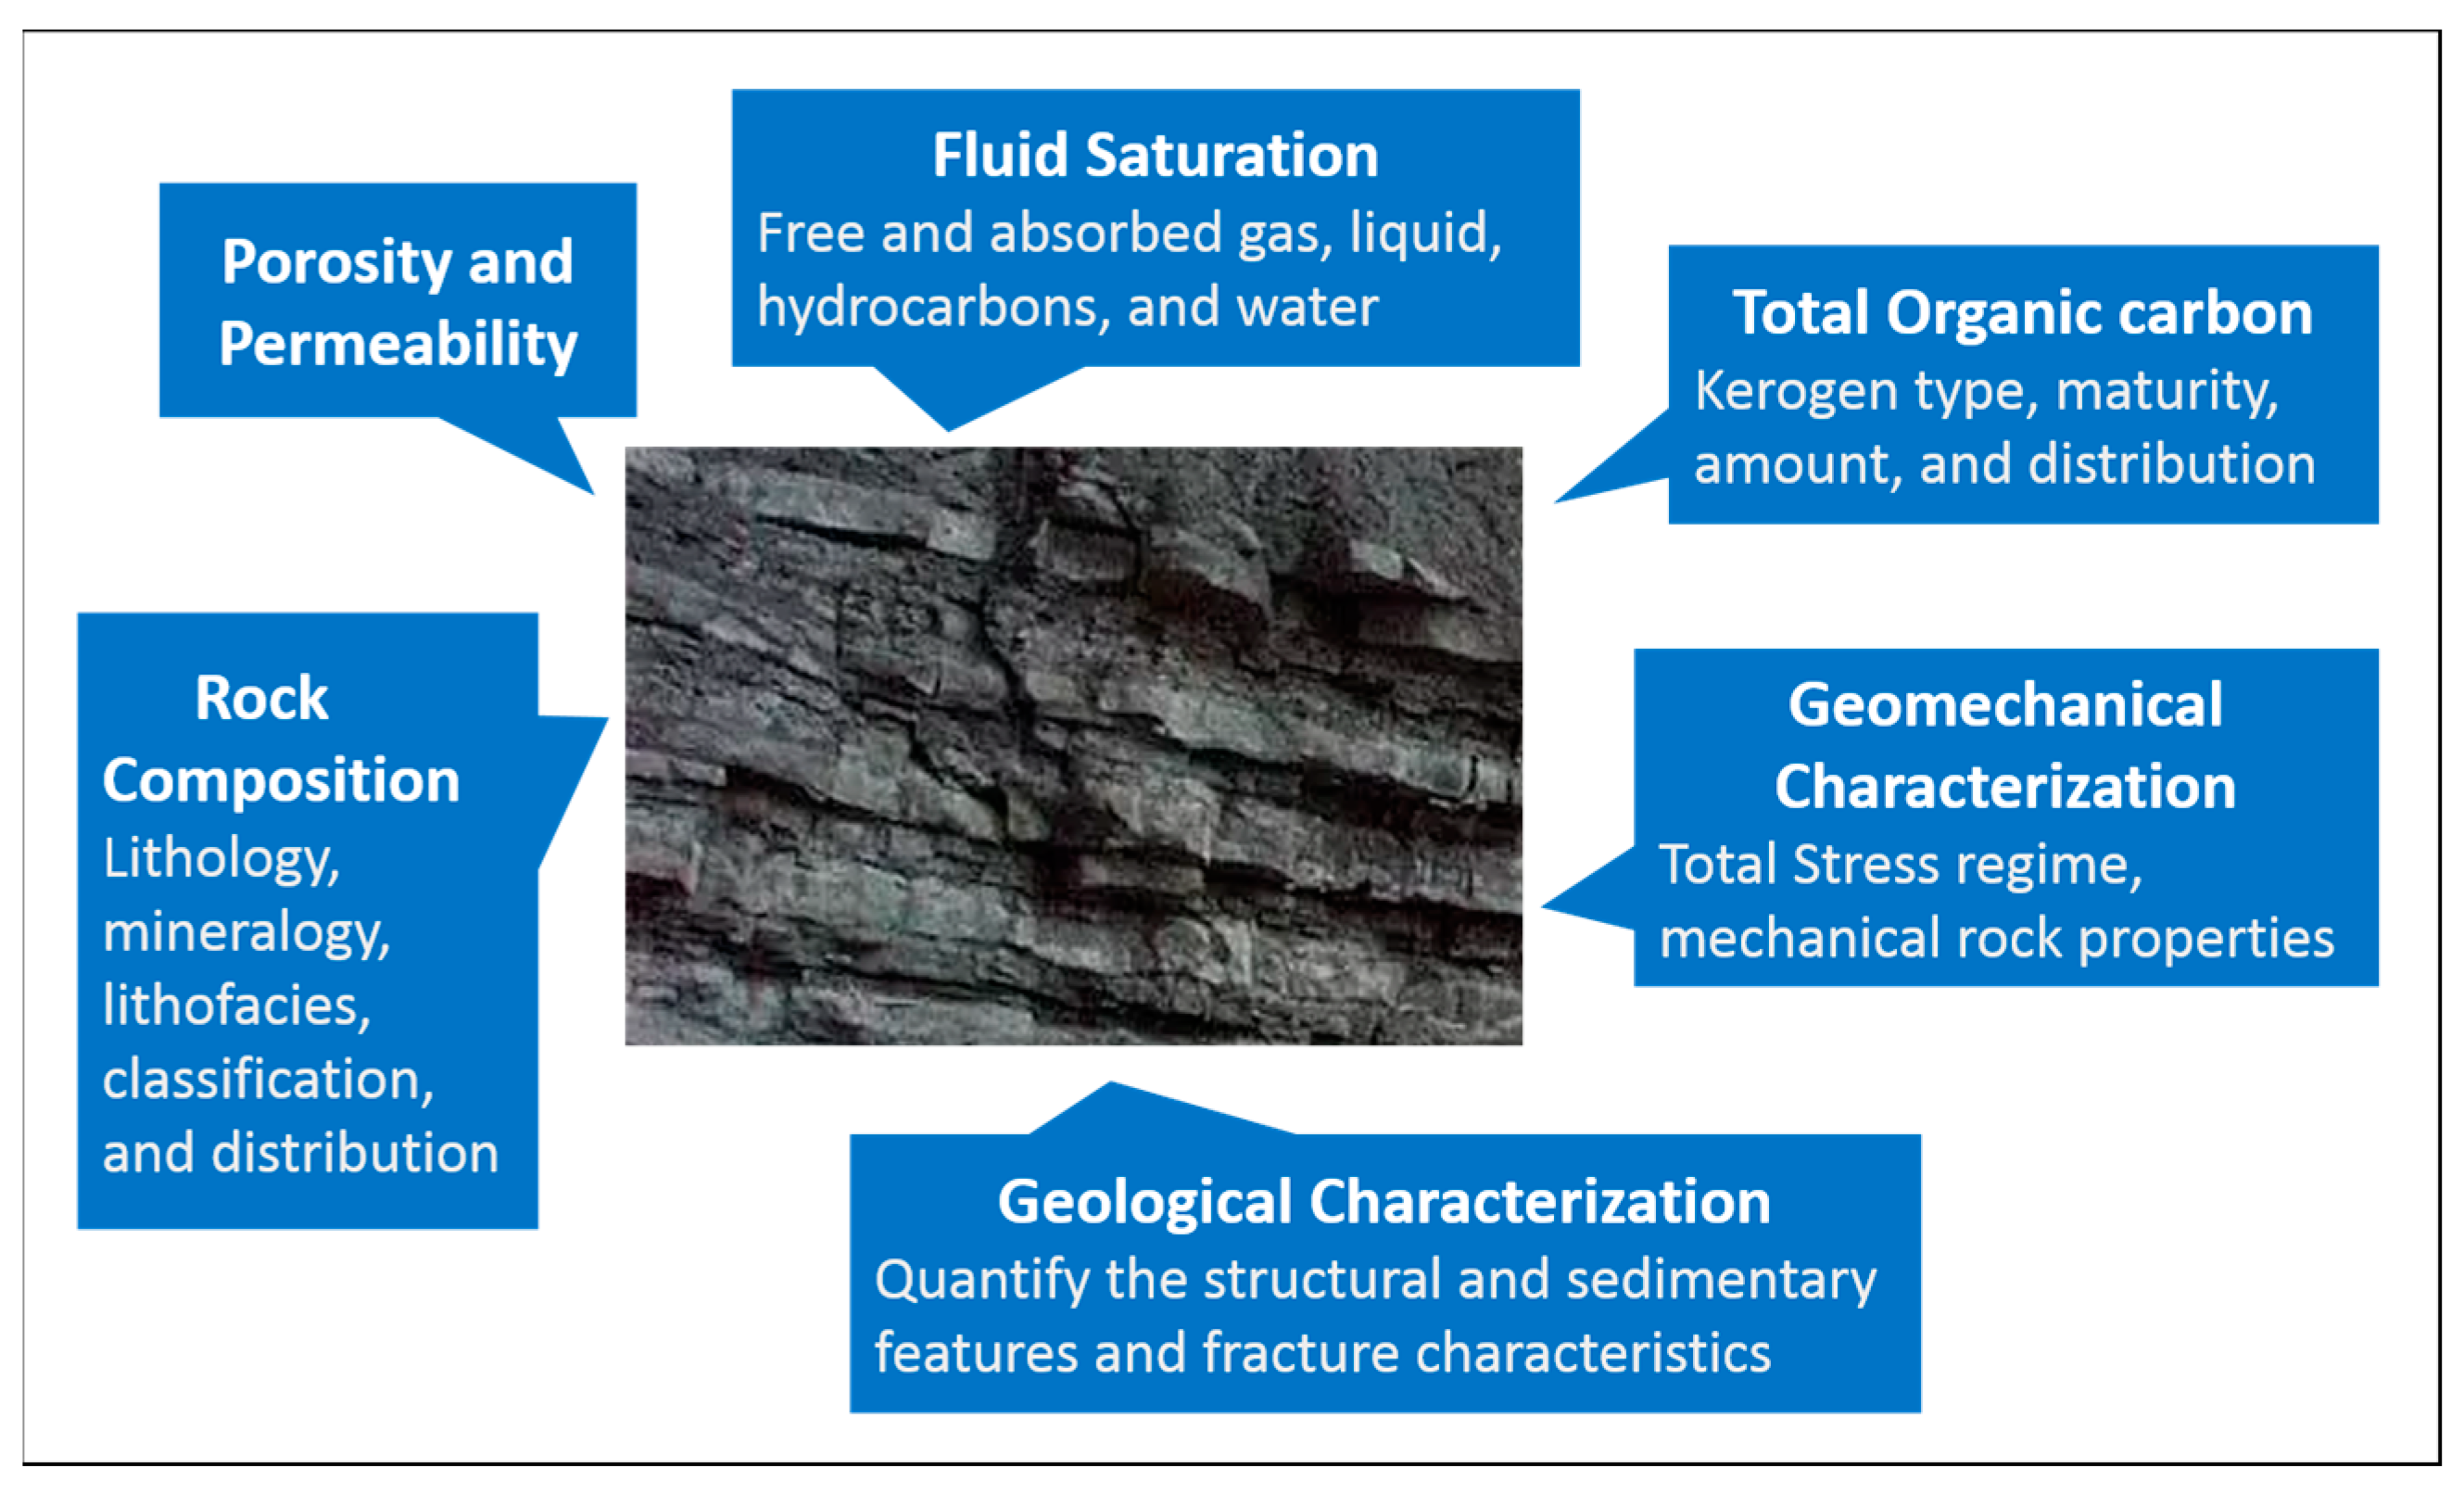
3.1. Rock Quantification

Quantifying the lithology and the configuration of the minerals in the formation is the first step in the characterization of a reservoir that contains unconventional resources. The attribute of these reservoirs that has the potential to have the greatest influence, whether positive or negative, on reservoir productivity is the mineral structure of the reservoir. Variations in the mineral makeup of the rock are associated with alterations in its mechanical propertiess. Data obtained from wireline logging or logging while drilling (LWD), core examinations, and a study of mud log cuttings will be used to determine the lithology and mineral content of each wellbore. Following the completion of this step, a collection of lithofacies that are characteristic of that reservoir will be generated [14].

3.2. Geological Characterization

Understanding the tectonic and structural history of the basin as well as the source of the rock formation is one of the aims of geological characterisation. The variations in organic content, mineral composition, and mechanical rock properties that are seen in unconventional resources are a result of differences in the depositional environment and the sequence stratigraphic position of each unit [4]. The majority of source rock reservoirs have their own naturally occurring fracture systems. These spontaneous cracks may have a favourable effect on reservoir productivity by interacting with the stimulation of hydraulic fracturing, intersecting with them in a complicated network of paths to the wellbore, and thus increasing the amount of fluid that can be extracted from the reservoir [15]. However, if hydraulic fracturing stimulation intersect with natural fissures that reach out from the rock reservoir’s core into porous and water-saturated permeable layers, it could result in undesirable outcomes [16].

3.3. Quantification of Total Organic Carbon

The presence of a large quantity of total organic carbon is the most defining feature of a source rock. The total organic carbon (TOC) is made up of three components: the gas or oil that is currently present in the rock; kerogen, which represents the accessible carbon that may be formed; and residual carbon, which does not have the capacity to generate hydrocarbons. As temperature and pressure are increased inside the source rock, bitumen and kerogen, a solid combination of organic chemical compounds that is insoluble in common organic solvents because of the high molecular weight of its constituent components, are transformed into hydrocarbons [17].

3.4. Quantification of Porosity and Permeability

Unconventional reservoirs have very intricate pore systems that are made up of incredibly fine inorganic and organic interparticle and intraparticle pores. Spontaneous fractures are often also present. The typical total porosities of unconventional reservoirs are likewise rather low, falling somewhere in the range of 5 to 12%. It is difficult to determine the porosity of these reservoirs by utilising standard log responses because the total organic carbon content (TOC) varies, and the composition includes a diverse mix of inorganic mineral elements, characterized by microfractures and a dual-porosity system. Some uncertainty may be reduced by using elemental spectroscopy and nuclear magnetic resonance logging methods. To calibrate and validate the log-derived porosities, core-measured porosity data should be collected [2]. The intricate pore types and networks in mudrocks have been meticulously classified by Loucks et al. [2], providing a foundational understanding of matrix-related mudrock pores that is crucial for exploring unconventional reservoirs. Furthermore, Miller et al. [3] have delved into the evaluation of production log data from horizontal wells in organic shales, offering crucial insights into the production trends and reservoir behaviours in unconventional resources.
Permeability is very low in unconventional reservoir rock, sometimes in the nanodarcy range. Rock permeability estimates must be based on core analysis results. A significant number of studies must be performed in order to calibrate permeability estimations based on log responses. Pressure decay and pressure pulse decay are two laboratory techniques for determining permeability [18].

3.5. Quantifying Fluid Saturation

Laboratory analysis, or wireline or LWD log measurements of resistivity and porosity are used in the calculation of hydrocarbon saturations. Hydrocarbons are stored in the following forms in unconventional reservoirs:
  • Free gas and oil are contained in inorganic and organic holes and spontaneous cracks in the matrix.
  • Sorbed gas and oil are either adsorbed (chemically bonded) to organic matter (kerogen) and mineral surfaces in natural cracks or absorbed (physically bound) to organic matter (kerogen) and mineral surfaces in the rock of the matrix.
  • Gas dissolved in the hydrocarbon liquids found in bitumen.
The basic approach for determining gas or oil saturations and quantities in unconventional reservoirs is a mix of laboratory studies. To measure the free gas and oil saturation in crushed rock samples, Dean Stark and/or Step Wise Retort studies are performed. In gas shale reservoirs, adsorption and desorption isotherm analyses are used to calculate the total gas volume and adsorbed gas volume [19].

3.6. Assessment of Geomechanical Characteristics

Extraction from unconventional reservoirs is dependent on the effectiveness of horizontal drilling and multistage hydraulic fracturing. Understanding the in situ stress state and natural fracture distribution in each unconventional reservoir is required. Stress states and spontaneous fracture patterns might differ across atypical plays and even within them. These changes influence the form and nature of the stimulated rock volumes, the requirements for safe drilling, and the best drilling orientations to utilise the natural cracks. The in situ stress study should involve determining the orientations, magnitudes, pore pressure, effective rock strength, fracture patterns, and rock structure of the in situ stresses. Geomechanical characterisation should also involve determining the rock’s static and dynamic mechanical characteristics, anisotropy, brittleness, and hardness [20].

4. Unconventional Reservoir Characterization Workflows

Evaluating unconventional reservoirs entails measuring a wide range of fluid and rock petrophysical, geological, engineering, geomechanical, and geochemical features. Technical data will need to be gathered from a variety of sources. Although wireline logging and logging while drilling (LWD) log measurements are two of the most often utilised data sources, a comprehensive reservoir characterization of an unconventional reservoir requires rigorous analysis as well as the investigation and research of real reservoir rock. The methods most often used to measure the fluid and reservoir parameters of unconventional reservoirs are listed in Table 1. The following factors contribute to the characterisation of the reservoir that this entire log suite provides:
  • Fundamental reservoir properties encompass the formation’s electrical resistivity at different investigative depths, formation density to deduce general rock types, neutron density to deduce fluid and gas characteristics, pulsed neutron measurements for determining rock composition and mineral content, total organic carbon (TOC), lithofacies, and micro-resistivity/acoustic readings for creating an accurate depiction of the geological layers, along with nuclear magnetic resonance to attempt to identify kerogens, as well as assess porosity and permeability.
  • Anisotropic acoustic properties; the advanced cross-dipole acoustic logging acquisition of compressional (Vp), shear (Vs), and Stoneley-wave data sets. In addition to standard sonic logging, the primary focus of this analysis is to determine the geomechanical properties of the rock and in situ system stresses, and the level of the strain of the mudrock sequences within the wellbore. The 3D anisotropy algorithm transforms the compressional, fast-shear, slow-shear, and Stoneley acoustic slowness measurements, with respect to the borehole axes, into anisotropic moduli referenced to the earth’s anisotropy axes. These moduli help to classify the formation anisotropy into isotropic, transverse isotropic (HTI, VTI), or orthorhombic types. The moduli also assist in micro-layering or thin-bedding-induced TI anisotropy (N < 0 implies micro-layering-induced intrinsic anisotropy; N > 0 implies bedding-induced anisotropy), the relative magnitude of the principal stresses, and fluid mobility. XMACTM-F1/Sound TrakTM tool measurements can be used in evaluating the types of anisotropy, in addition to differentiating between open natural fracture and drilling-induced fracture. Wellbore images of the STARTM, StarTrakTM, GeoxplorerTM, and CBILTM can be combined with XMACTM-F1/Sound TrakTM shear-wave anisotropy so that Stoneley-wave data can be constructed and compared with an independent measurement of rock properties and in situ stresses. Identification of acoustic-derived high-stress and low-stress zonation within the vertical pilot, as correlated to variations in the clay content, can be an important tool for the prediction of the preferred lateral placement within the vertical pilot well. In addition, determining the azimuth of the horizontal maximum stress orientation (Sigma one δ1 horizontal) is a critical part of determining the azimuth orientation for later well placement. A contrast between sigma δ1, δ2, and δ3 within the wellbore is also desired. Acoustic (sonic) logging should also be taken into account to constrain and enhance the matching of seismic data phases and to aid in the conversion of seismic data to depth measurements.
  • For rock mineralogy, the FlexTM/RockviewTM SpectrologTM can help determine specific rock lithologies, including clay characterization. The tool applications include the clay fraction independent of gamma-ray, spontaneous potential, and density neutron responses for carbonate, gypsum, or the anhydrite, pyrite, siderite, coal, and salt fractions for complete complex reservoir analysis. Matrix density and neutron measurements are utilized for sophisticated porosity calculations, estimating permeability based on mineral content, and for developing correlations. Quantitative lithology is used for modelling rock properties and pore pressure prediction from seismic data. Geochemical lithostratigraphy (elemental and meteorological lithostratigraphy) is used for well-to-well correlation applications. The types of radioactive elements (Thorium/Uranium) along with their distribution across vertical and horizontal planes are employed to comprehend the depositional elements both within and external to the basin, within the vertical geological section, in order to anticipate zones of potentially greater reservoir capacity(rich zones). This is based on the assumption that factors such as rock brittleness and seal integrity are regulated. This is one example. The significance of each mineral varies by play, depositional environment, and other characteristics.
Table 1. Wireline and LWD techniques for rock reservoir assessment [1].
Generic Tool TechnologyWireline Tool LWD ToolEvaluation Application
ResistivityHDILTMOnTrakTM/AziTrakTMFluid saturations, TOC determinations
Compensated Density
Compensated Neutron
ZDLTM/CNTMLithoTrakTMTotal porosity, lithology, and TOC for basic reservoir properties
Cross Dipole AcousticsXMACTM -F1Sound TrakTMCompressional and shear slowness, static and dynamic mechanical rock properties, geomechanical stress determinations, and fracture identification
Gamma Ray
Spectral Gamma Ray
GRTM
SpectralogTM
GR Included with LWD
resistivity service
Lithology, mineralogy, and TOC determination
Elemental SpectroscopyFlexTM
RockviewTM
SpectrologTM
Lithology, mineralogy, TOC, and lithofacies determination
Resistivity ImagingSTARTM (WBM)
GeoXplorerTM (OBM)
Star TrakTMQuantification structural and sedimentary features, fracture characteristics, and stress
Acoustic ImagingCBILTM
UltrasonicXplorerTM
In situ geologic structure and sedimentary analysis
Stress determination, fracture identification
Nuclear Magnetic ResonanceMReXTMMagTrakTMKerogen characterization, porosity permeability
Fluid and Pressure TestingRCITM Straddle Packer
Micro-FracTM
A modular formation dynamics test for micro-fracturing; evaluation of fracturing closure and the minimum horizontal stress
Rotary CoresPowerCORTM
MaxCORTM
Wireline core analyses

Complexities of Tight Sandstone Reservoir Development

Tight sandstone reservoirs present a complex tapestry of challenges, intricately woven due to their distinct geological characteristics and the technical nuances inherent in the extraction processes. These reservoirs, while pivotal in the energy landscape, require a meticulous exploration of their multifaceted challenges and limitations.
Table 2 systematically categorizes and elucidates the myriad challenges and limitations intrinsic to the development of tight sandstone reservoirs, providing a structured insight into each specific aspect and its corresponding intricacies.

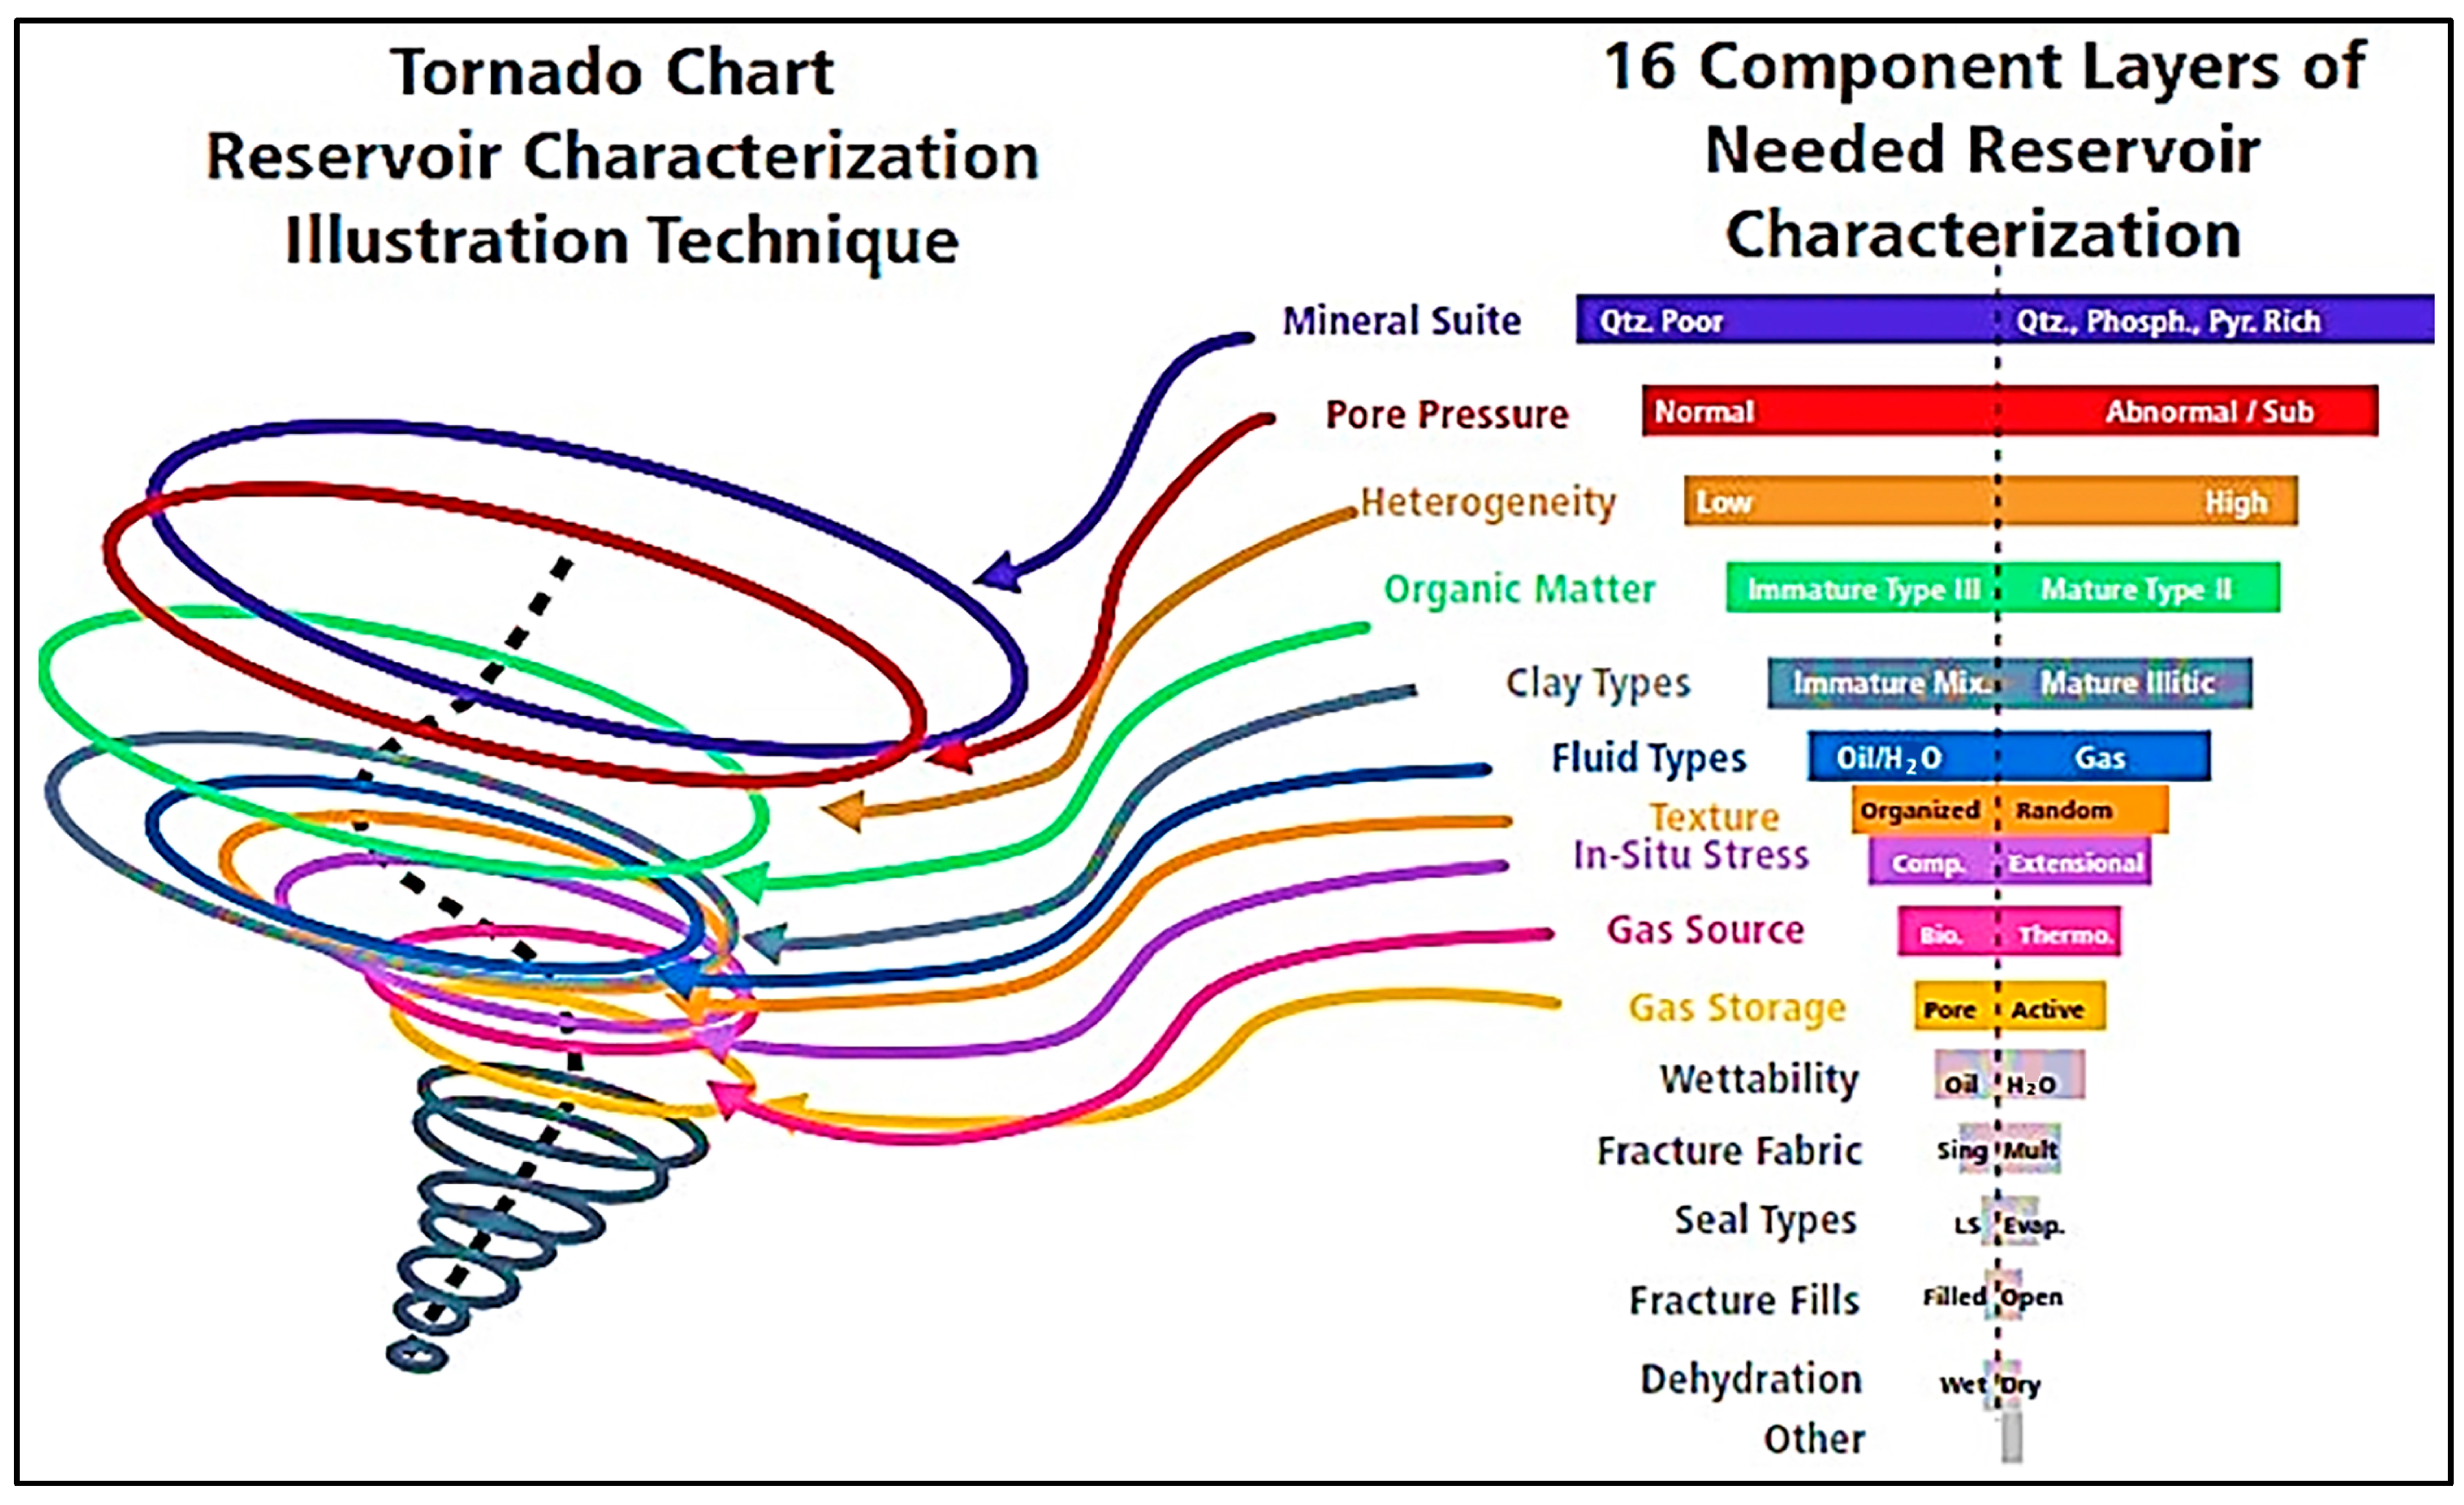
5. Characterization of the Components of Unconventional Resource Plays

Organic matter is a high-level characterisation component that has an effect on producibility within the sixteen-component reservoir/completion quality model that is used for unconventional reservoirs, Figure 4. Essential factors or considerations encompass the identification of the primary kerogen composition and total organic carbon content, the conservation of organic material, the depositional setting, biostratigraphic data, microbial ecosystems, and the initial level of preserved hydrogen. Kerogens are thought to have originated from water-based marine or transitional marine-to-terrestrial living animals or plants. Regarding the maintained geological depositional systems, both intrabasinal and extrabasinal inputs are considered, including marine and transitional marine systems, the preserved organic kerogens have a mostly microbiological origin. In preserved depositional habitats or sections that, depending on their geological age, might include extrabasinal-derived organic matter, the preserved kerogens can frequently have a major component that is preserved or recycled land plant-derived structured kerogens. These kerogens can also be recycled (coal-type maceral suites). The microorganisms and plant materials from which the preserved detritus is formed are directly responsible for the quality of the kerogen in terms of the creation of hydrocarbon fluid and gas. The percentages of gas-prone and oil-prone kerogen may be determined with the use of advanced kerogen slide investigations of the kerogen materials found inside known hydrocarbon source rock intervals that are conducted as part of laboratory TOC analyses. This method of separating present-day kerogen samples from their host rocks, known as the physical appearance technique, is often carried out by means of the microscopic identification and volume measurement of total structured or gas-prone kerogens as opposed to amorphous or oil-prone kerogens. The risks and uncertainties associated with the critical subsurface reservoir and completion quality may be evaluated quantitatively or semi-quantitatively in order to estimate the influence of the variation in reservoir characterisation on production performance [20].
The characterization of the reservoir serves as an essential step in the process of determining the best strategies for completion:
  • The amount of oil or gas that may be extracted from a well depends on a number of factors, including the net combination of site-specific reservoir properties and the use of the most suitable finishing technique.
  • The selection of the completion target (vertical selection, lateral positioning, lateral stage placement, and lateral stage completions) calls for modern technologies that are both time and cost efficient in the characterisation of the reservoir.
The components of each of these levels may be characterised using the many characterisation sidebars that are included within each of these layers. In addition, the use of many sidebars may boost one’s level of confidence and reduce the reservoir and completion quality’s characterization risk, which is connected to each component of a reservoir’s characterization layer. The tornado chart and sidebars methodology represents a comprehensive, data-driven approach for performance analysis, featuring measurable indices that are applied in order to measure and geographically describe the reservoir and completion quality components, as shown in Figure 4. For each individual layer included in this characterisation and profiling approach, there is a particular index example that can be accessed. Among them are the interpretation and integration of the foundational data sets that are necessary for these procedures. Figure 4 presents a tornado chart and accompanying sidebar, which together constitute a detailed stratified reservoir characterization method used to assess petroleum system processes through the comparison of layered primary indices [21].
With the continued development of improved wireline, LWD, and well-site analytics via the Surface Logging System, micro and mini fractures, as well as the development of advanced geological technology such as 3D-based and micro-seismic, the technology used to characterise reservoirs is dynamic and continually improving. One particular example of an advanced technology is the use of “real time/rig time” advanced technologies for various parts of hydrocarbon characterisation. It will be possible to update the guidelines as soon as the fit-for-purpose reservoir characterisation technologies have been thoroughly tested and shown to be cost effective for implementation. Surface Logging Systems (SLSs) include capabilities that are currently under development, such as inorganic elemental and mineralogical analysis, sophisticated gas and fluid analysis, and organic kerogen analysis [21].
The outcome of this pilot exploration and exploitation well reservoir characterization guideline should culminate in a proposed play or zone-specific unconventional reservoir characterization protocol tailored for the pad-based exploitation lateral well program. The geosteering reservoir components’ guidelines, drill pipe-delivered characterization tools, minimal well site analytical guidelines, and spatial geophysical data (3D) with integrated processing improvements should all be included in a defined lateral exploitation reservoir characterization programme. The outcomes of using these unconventional play/zone-specific reservoir characterisation principles should be well site-specific tailored completion suggestions designed for maximal reservoir reach. The guidelines should incorporate micro-seismic monitoring of completions, along with the identification of rock types and anticipated discrete fracture networks (DFN). They should also detail geological and engineering-informed completion designs that specify particular completion fluids, the characteristics (strength and size) of proppant variations during the placement of completion fluids, the extent of specific stages and perforation clusters, and practices for logging production after completion. Additionally, the guidelines should address perforation clusters. The unconventional resource play’s geophysical workflow, with regard to micro-seismic applications for characterization of the lateral reach during completion operations, is a component of the play-specific document that was produced as a consequence of this process, and is detailed above (pad-based exploitation lateral well programe). Guidelines for 2D and 3D seismic processing and interpretation, both prior to unconventional drilling operation programmes and throughout such programmes, are also very significant [21].

6. Petrophysical Analysis

6.1. Overview of Petrophysical Evaluation Workflow

Quantification of several reservoir parameters is necessary for unconventional-source rock reservoirs. This necessitates the use of a wide range of logging, mud logging, and geophysical technologies, in addition to the collection and laboratory examination of mudrock, shale rock, and reservoir fluid samples. Calculating formation evaluation characteristics using a procedure that consists of a sequence of step-by-step calculations is the typical approach that petrophysicists use when solving problems. In our research, we make use of the processing chain, which consists of:
  • Calculating shale volume;
  • Calculating porosity;
  • Reservoir rock/fluid substitutions;
  • Core data depth matching;
  • Rock typing;
  • Permeability estimations;
  • Pore structure investigations;
  • Visualizing output data.
At each stage, it is possible to pick and select from a number of different alternative approaches; hence, the volume of shale might be determined using any one of many response equations, such as a straightforward gamma ray or any of the other available options. Following this, the second phase is carried out, and during this step, the porosity is computed based on the volume of shale that was determined in the first stage. When calculating water saturation, it is necessary to return to the data (the porosity and volume of shale) obtained from the previous procedures. A synopsis of the investigation conducted in this part is provided in Table 3 [22].

6.2. Petrophysical Evaluation of the Available Data

The data that is available for the petrophysical study included the complete well logs from five wells that have been drilled in the field being analysed, as well as routine core analysis (RCAL) results for two of the wells. Table 4 provides a detailed presentation of the data that are currently available. In the case of wells NNM-3 and Banga-M1, the shear wave velocity log, also known as the DTS, is not available. The DTS is an essential component for geomechanical research. The fuzzy inference system, when combined with optimization algorithms, is a potent artificial intelligence method that was utilised to approximate the missing DTS data in the aforementioned wells. The geomechanics analysis section is where the technique description will be written out.

6.2.1. Shale Volume Calculation

A spectral GR will be used, if it is available, to make an estimate of the amount of shale (clay). This metric may also be calculated using one of the relevant techniques, such as neutron logs, density logs, sonic logs, or resistivity logs. In this particular investigation, the following techniques were used in order to compute shale volume: Gamma Ray (GR), Neutron-Sonic (NS), Density-Neutron (DN), and Density-Sonic (DS). Table 5 provides a summary of the equations that are associated with each method. After that, an arithmetic mean of all of the different methods that were used was taken into consideration as the shale volume for each of the wells [23]. Figure 5 provides an illustration of the shale volume that was computed for well NNM-1.

6.2.2. Porosity Calculation

Porosity is a measurement of a rock’s ability to hold fluids and is expressed as a percentage. Calculating a rock’s porosity involves dividing the pore volume of the rock by the rock’s total bulk volume [24]. The term “total porosity” refers to the proportion of a rock’s total pore space within the volume of the material. The neutron, density, and sonic logs are used to derive the overall porosity of a sample. The effective porosity of a material is calculated by taking the overall porosity and subtracting the percentage of the pore space that is filled by shale or clay [23]. The overall porosity of each of the accessible wells is determined by taking the average of the two different techniques that were utilised (PHIT S and PHIT ND). Figure 5 provides an illustration of the computed total porosity and effective porosity of NNM-1. The equations that correspond to each approach are laid out in Table 6.

6.2.3. Reservoir Rock/Fluid Substitutions

Utilizing the available well logs (Gamma Ray, Density, Neutron, Sonic, and Resistivity) in the Multimin tab of the Geolog software allowed for the determination of the reservoir’s lithology, as well as its fluid substitution, also known as its oil/water saturation. The rock and fluid modelling technique known as Multimin, which stands for “Multi Mineral and Multi Fluid analysis,” may be used in order to construct a model of the various minerals present in the well. In the last two columns of Figure 5, an illustration of the findings of this section can be seen.

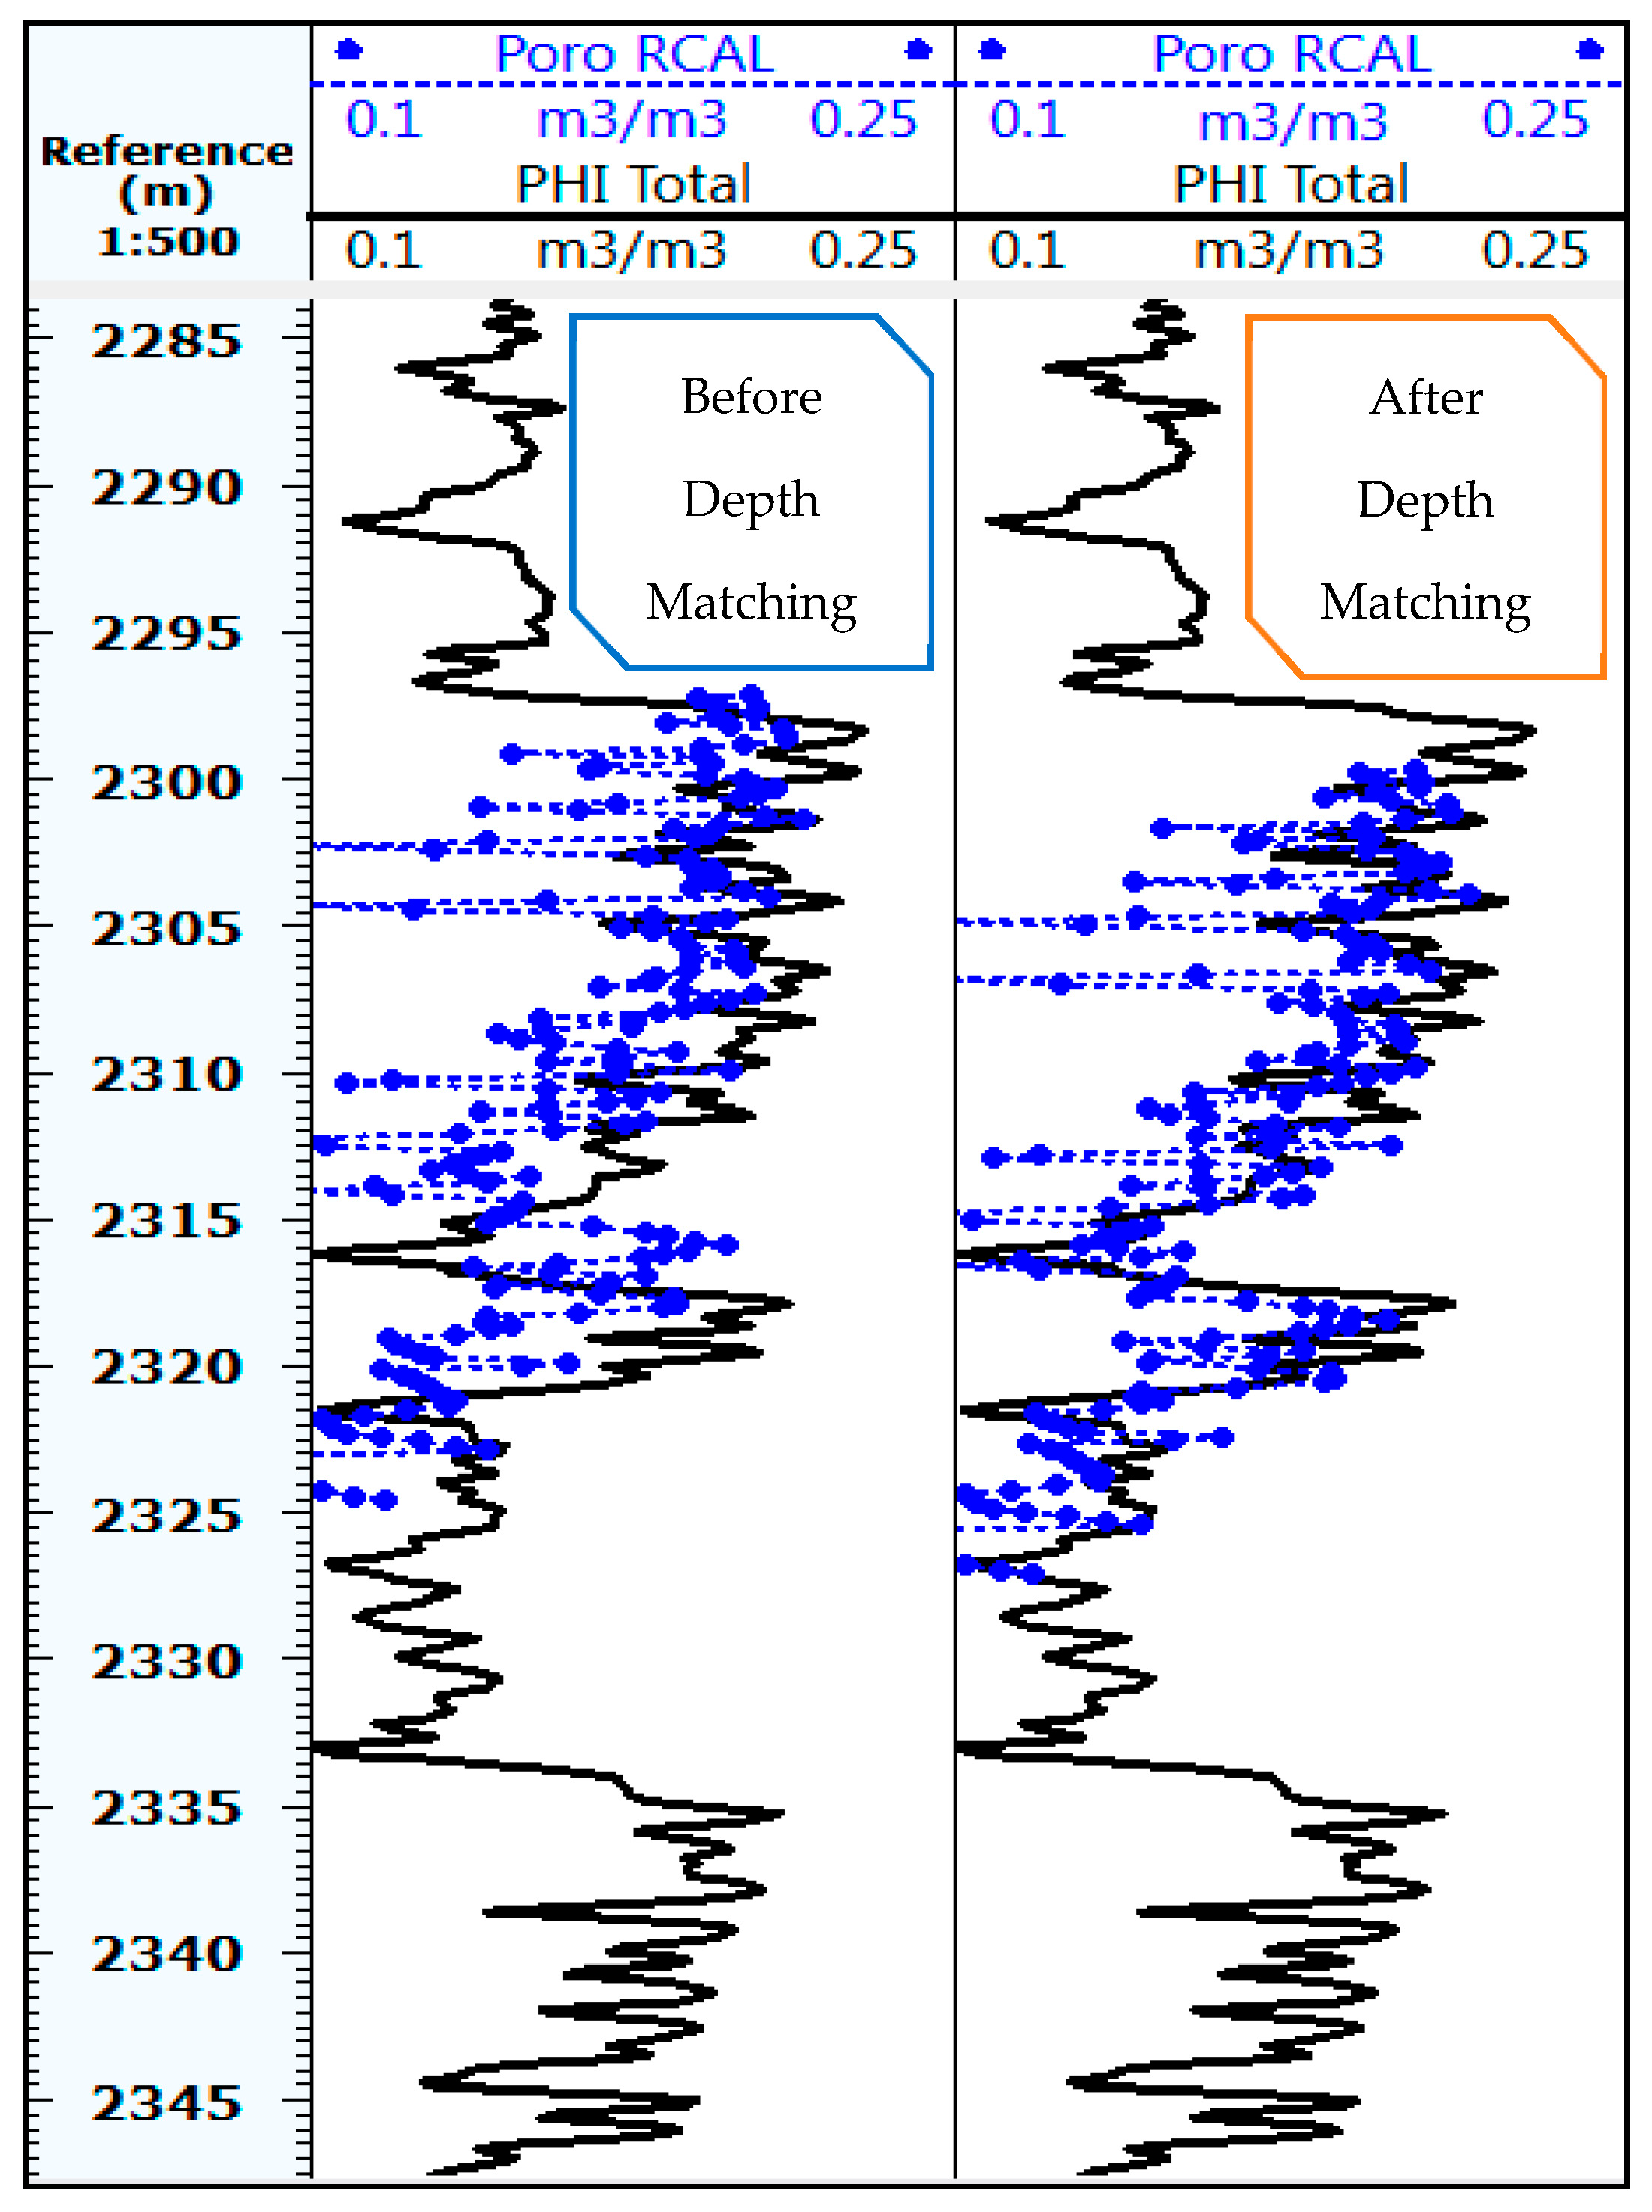
6.2.4. Depth Matching
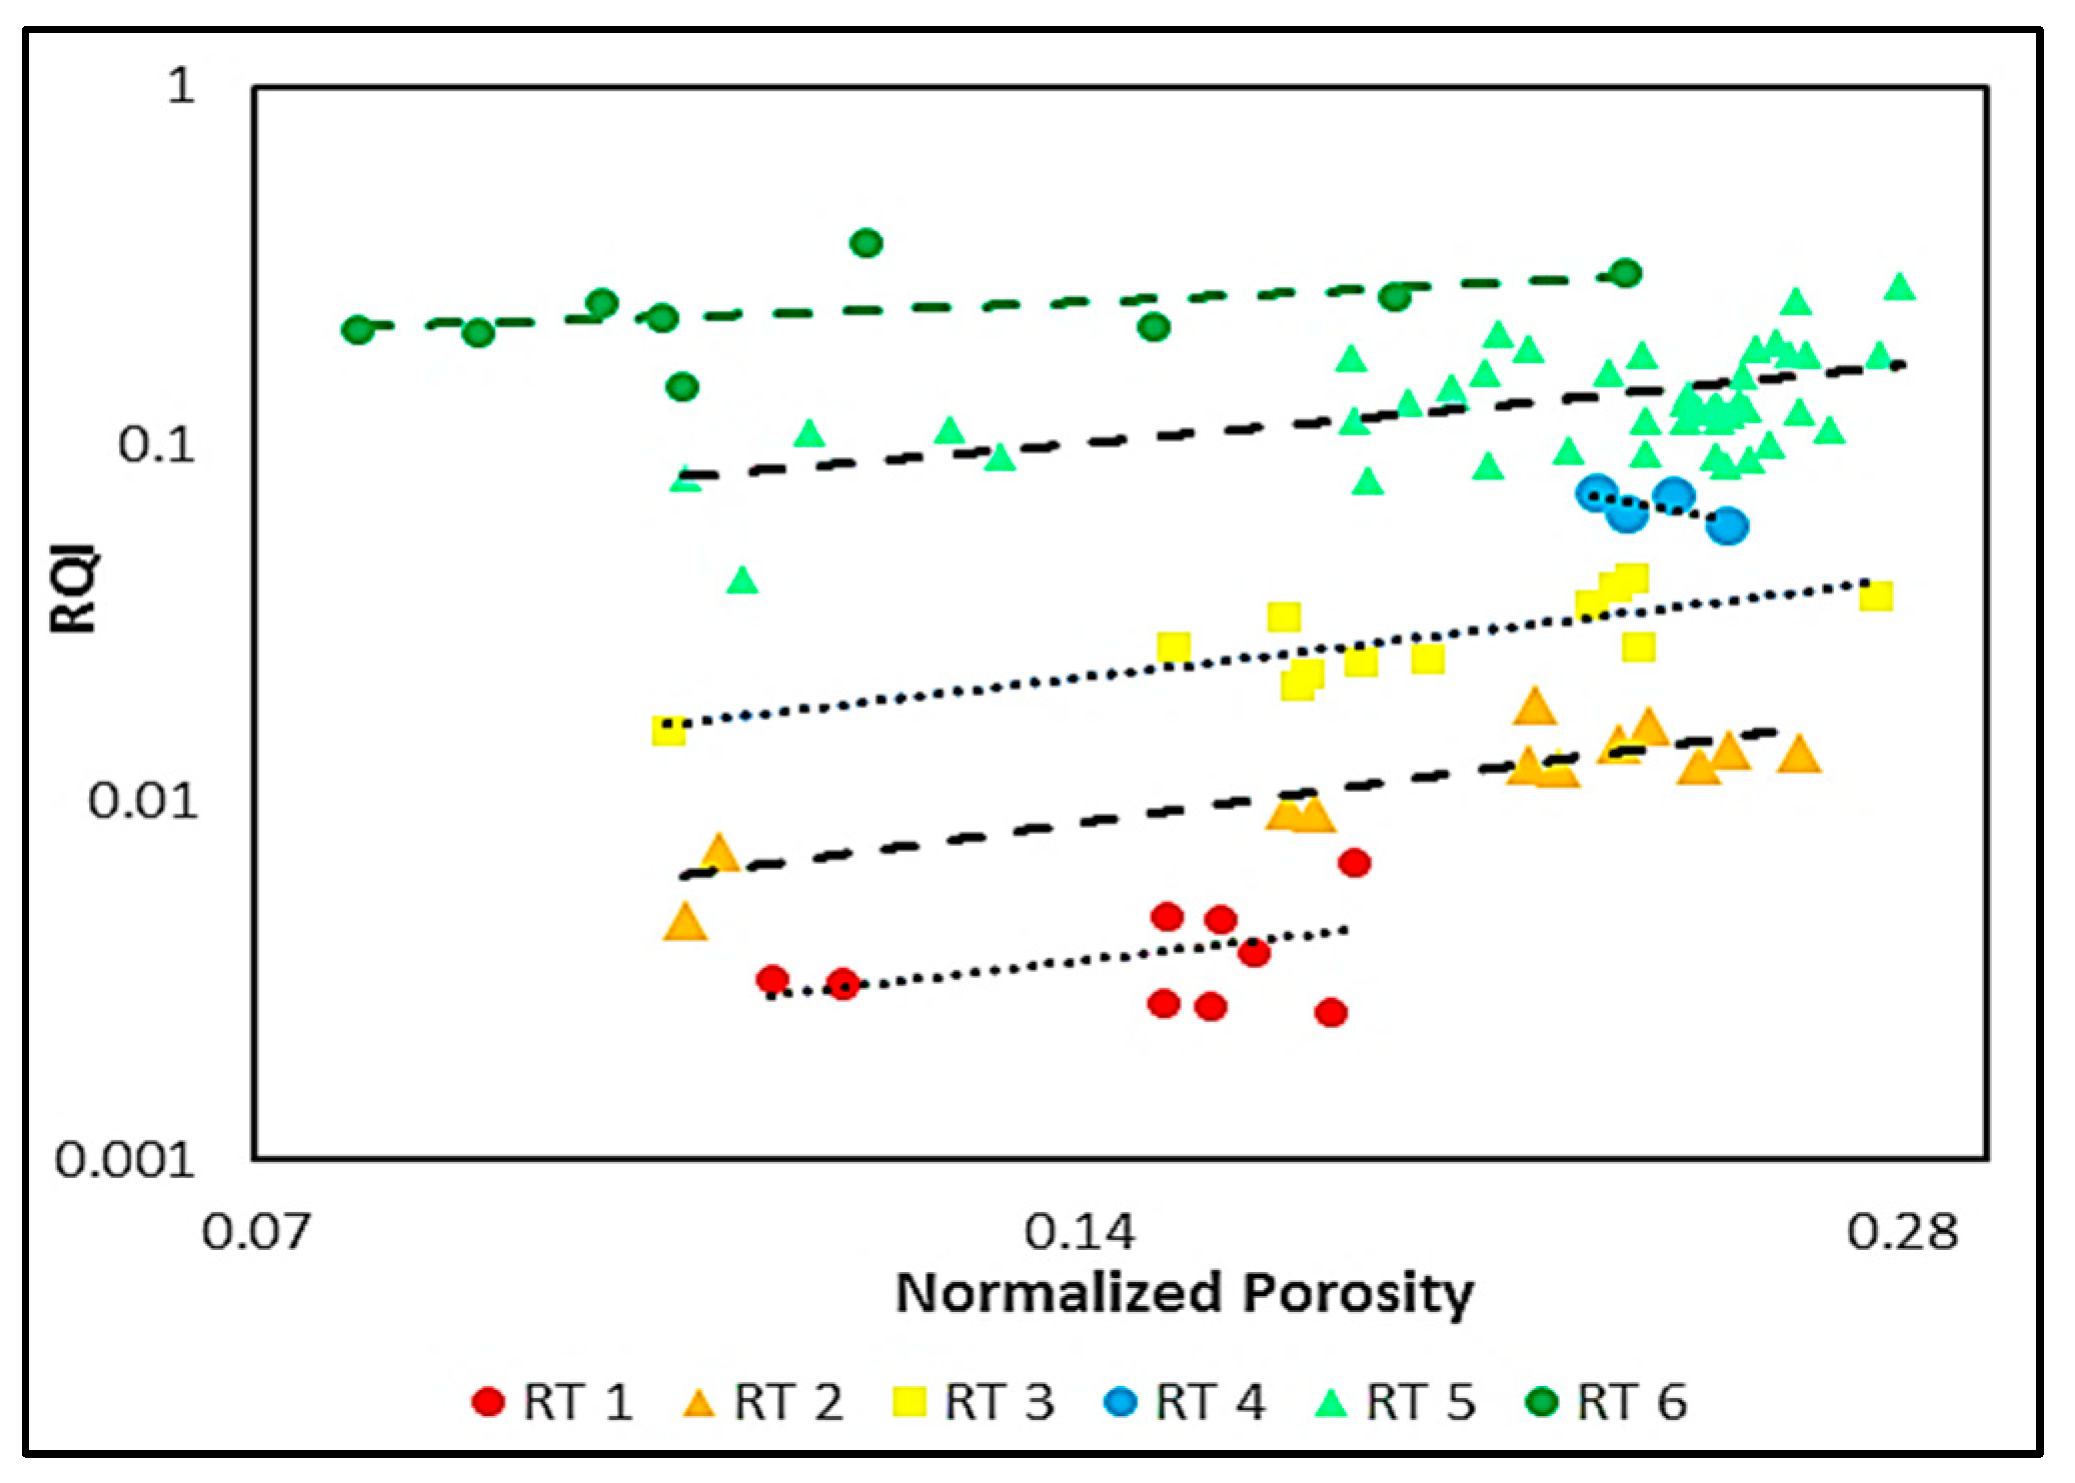
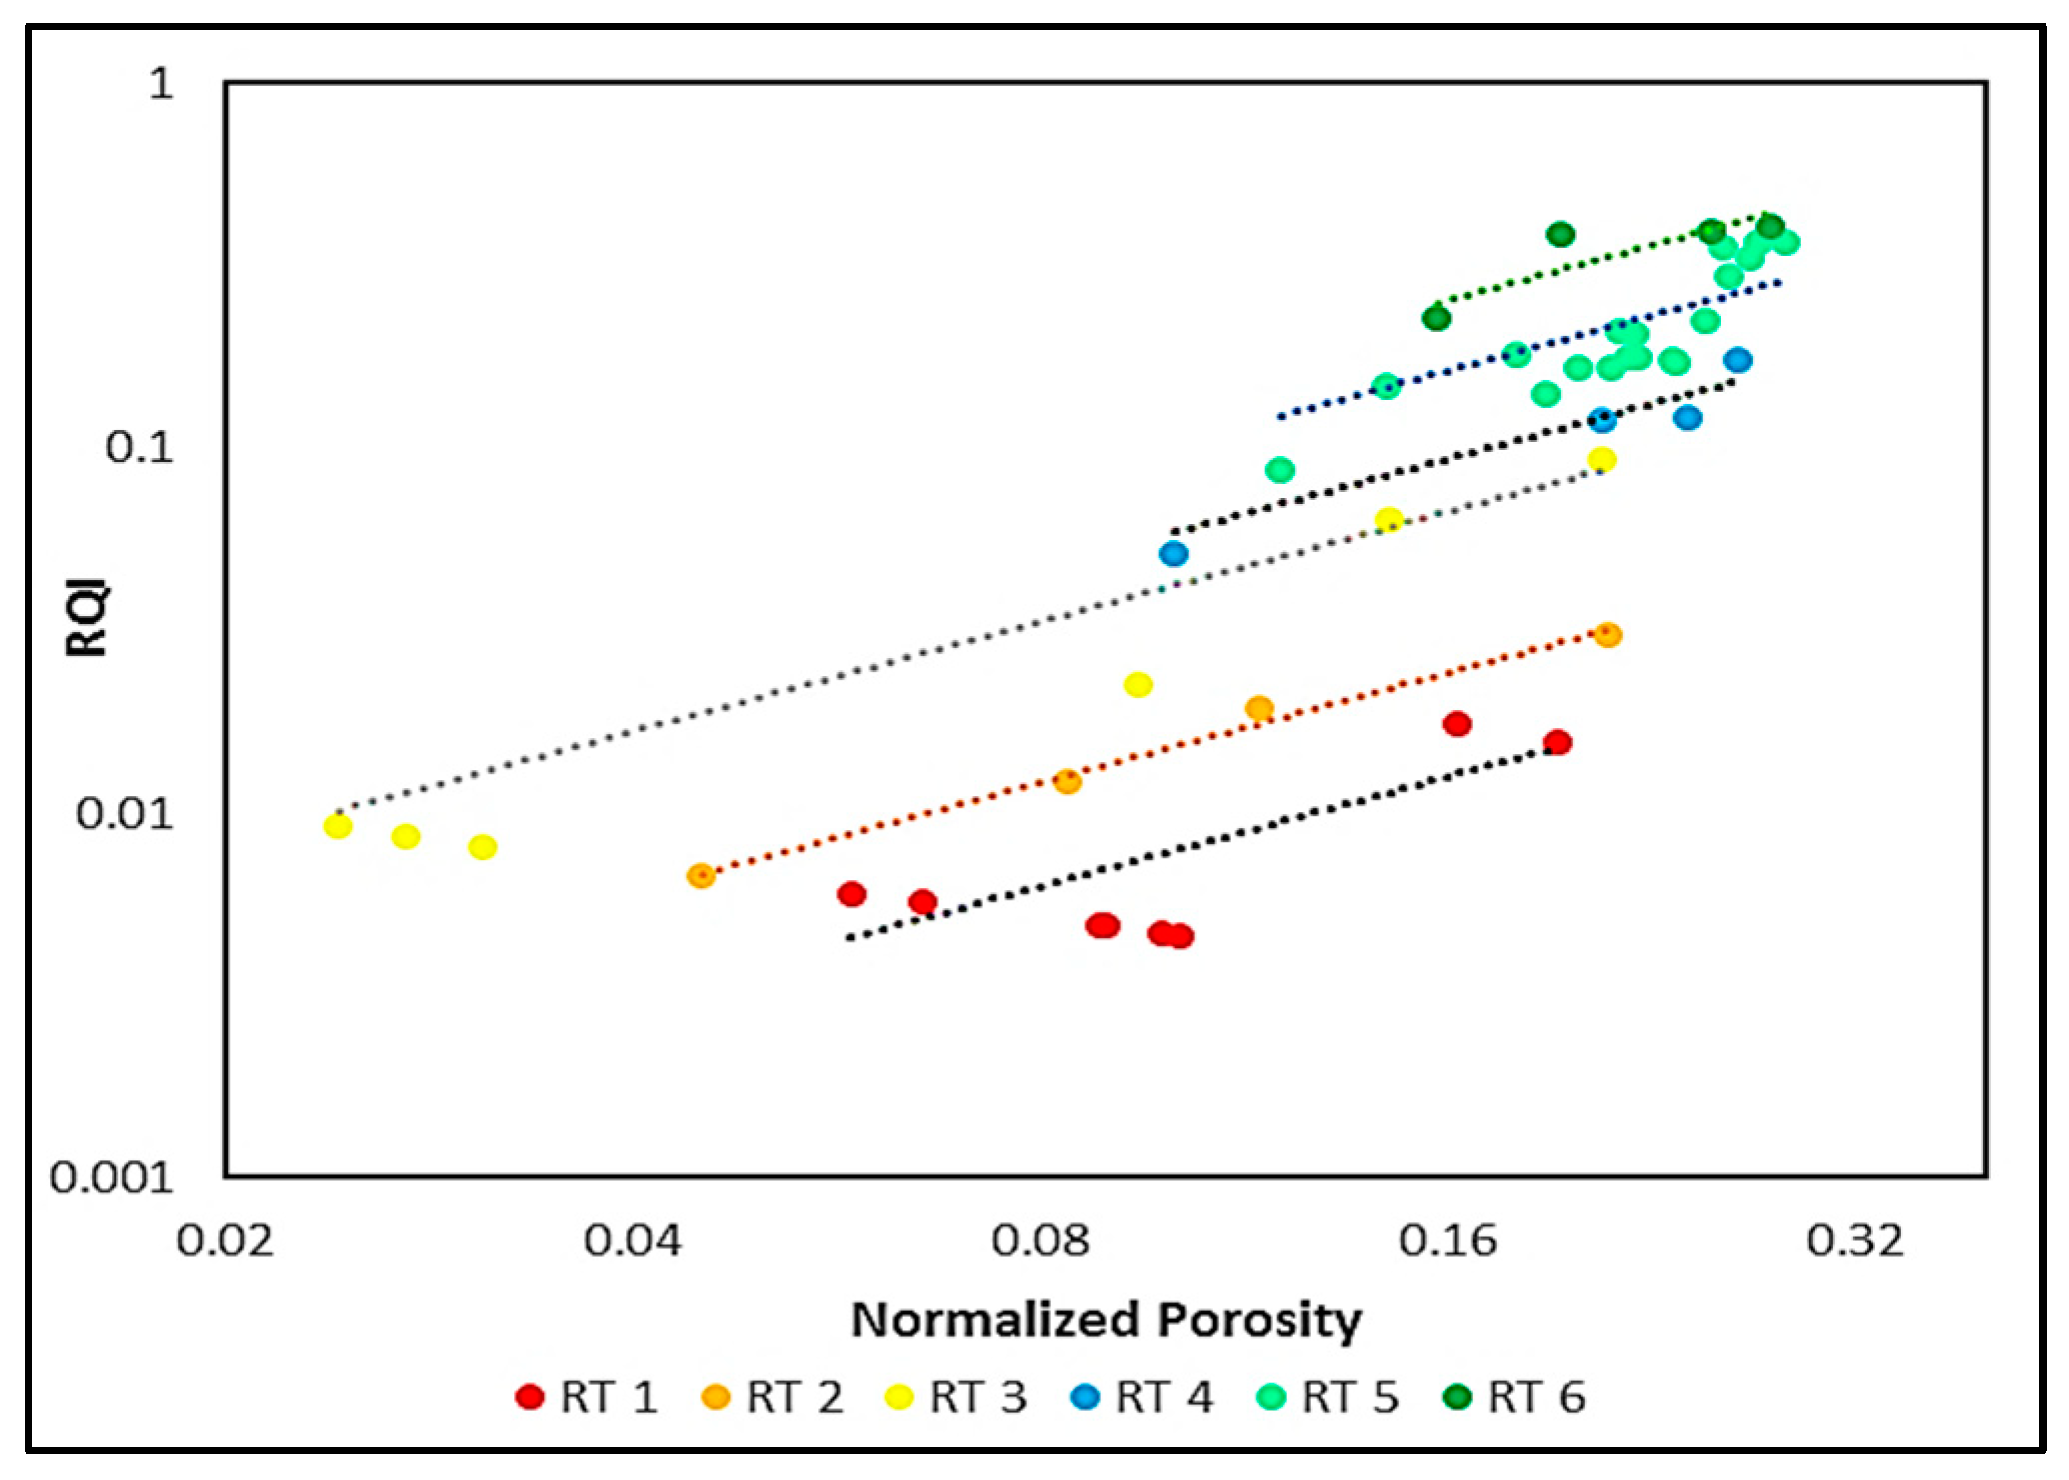
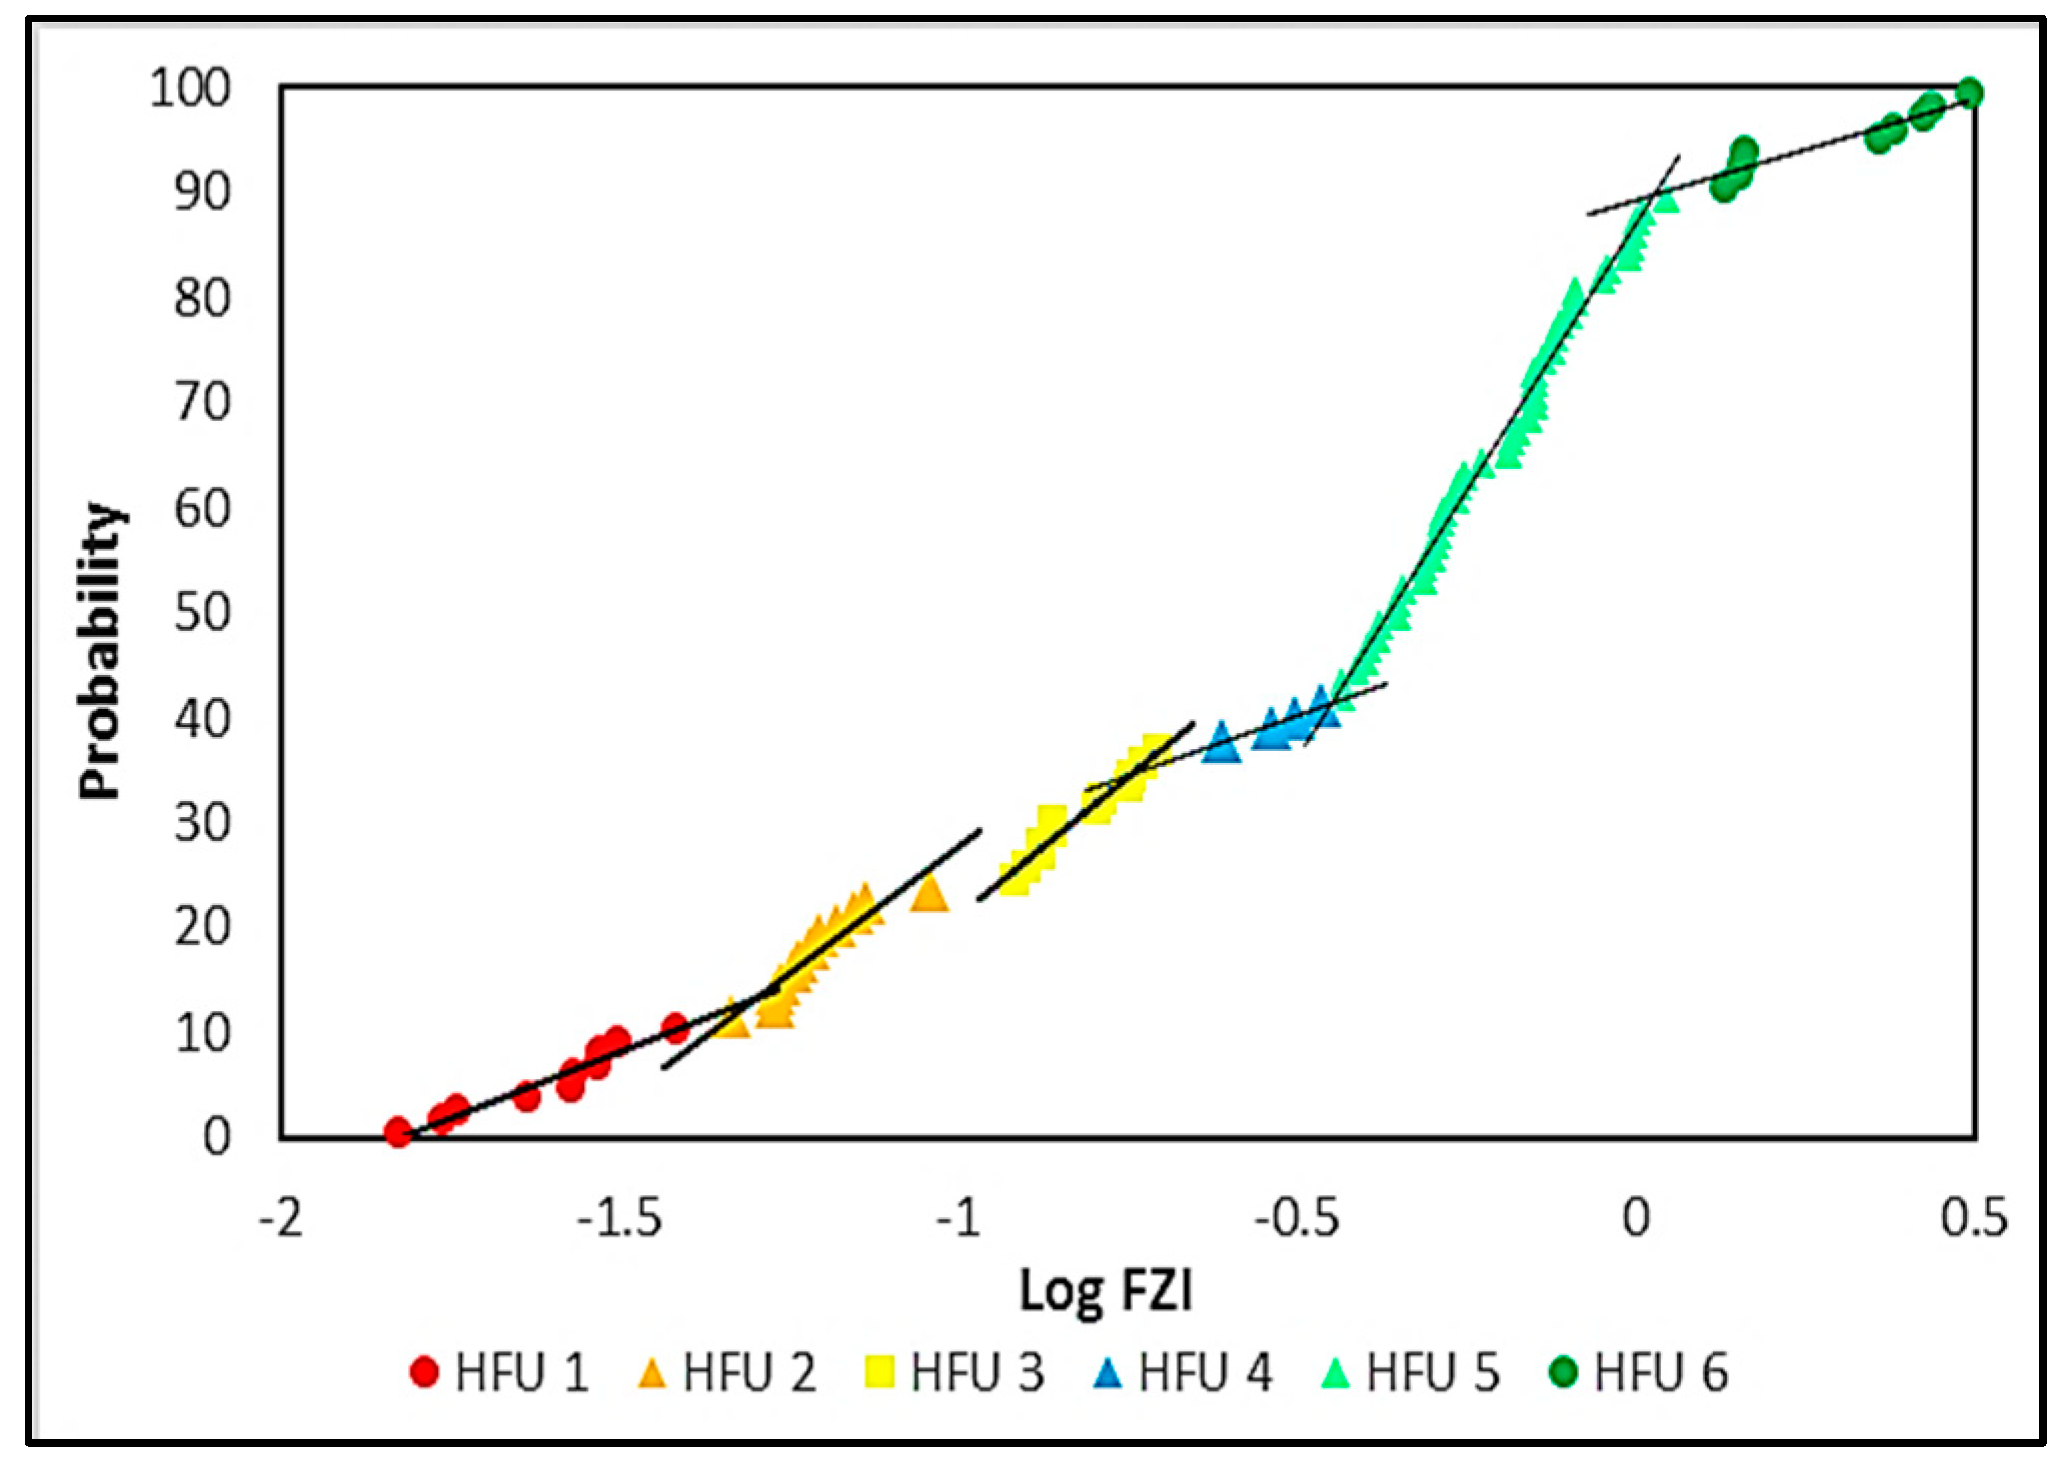
It is necessary to conduct a depth matching phase because, throughout the coring process, there are often some discrepancies between the depth that is calculated for the core and the actual depth. In order to accomplish this objective, the data obtained from the core may be matched with the log data that are at hand in an effort to identify the ideal match. In our case, the data from the core porosity was plotted against the porosity log that was acquired. It was determined, via the process of manually adjusting the core depth, that the core depth needs to be raised by 254 centimetres, as can be seen in Figure 6.

6.2.5. Rock Typing

It is possible to use relationships between porosity and permeability within the context of hydraulic flow units in order to describe the rocks that make up heterogeneous reservoirs [25]. The term “hydraulic flow units” (HFU) refers to the correlatable and mappable zones inside a reservoir that are responsible for controlling the flow of fluid [26]. Each flow unit is distinguished by a flow zone indicator (FZI), which may be understood in terms of the connection between the volume of void space ( ε ) and the geometric distribution of pore space (Reservoir Quality Index, RQI) as described in the following equations [27]:
L o g   R Q I = L o g   F Z I + L o g   ε
ε = ϕ 1 ϕ
R Q I = 0.314 × k ϕ
F Z I = R Q I   ε = 0.314 k ϕ ϕ 1 ϕ
where k represents the permeability in md and φ is fractional porosity. Rocks with a narrow range of FZI values belong to a single hydraulic unit, i.e., they have similar flow properties [28]. By employing available core test permeability data for wells NNM-1 and Banga-M1, the RQI, FZI, and HFU were determined. A log–log plot of RQI versus normalized porosity is a primary tool for determining the flow unit numbers, as can be shown in Figure 7 and Figure 8. Samples with similar FZI values lie close together on a straight line with a unit slope.
Figure 9 and Figure 10 include a probability plot of the logarithmic Flow Zone Indicator (Log FZI), which serves as an effective additional method to ascertain the properties of the rock. In this respect, there were a total of six HFUs that stood out. This corroborates the findings of the preceding method, which demonstrated the dependability of the approach that was ultimately chosen. Table 7 and Table 8 represent the wells NNM-1 and Banga-M1, respectively, and provide the range of Log FZI values that are associated with each hydraulic flow unit.

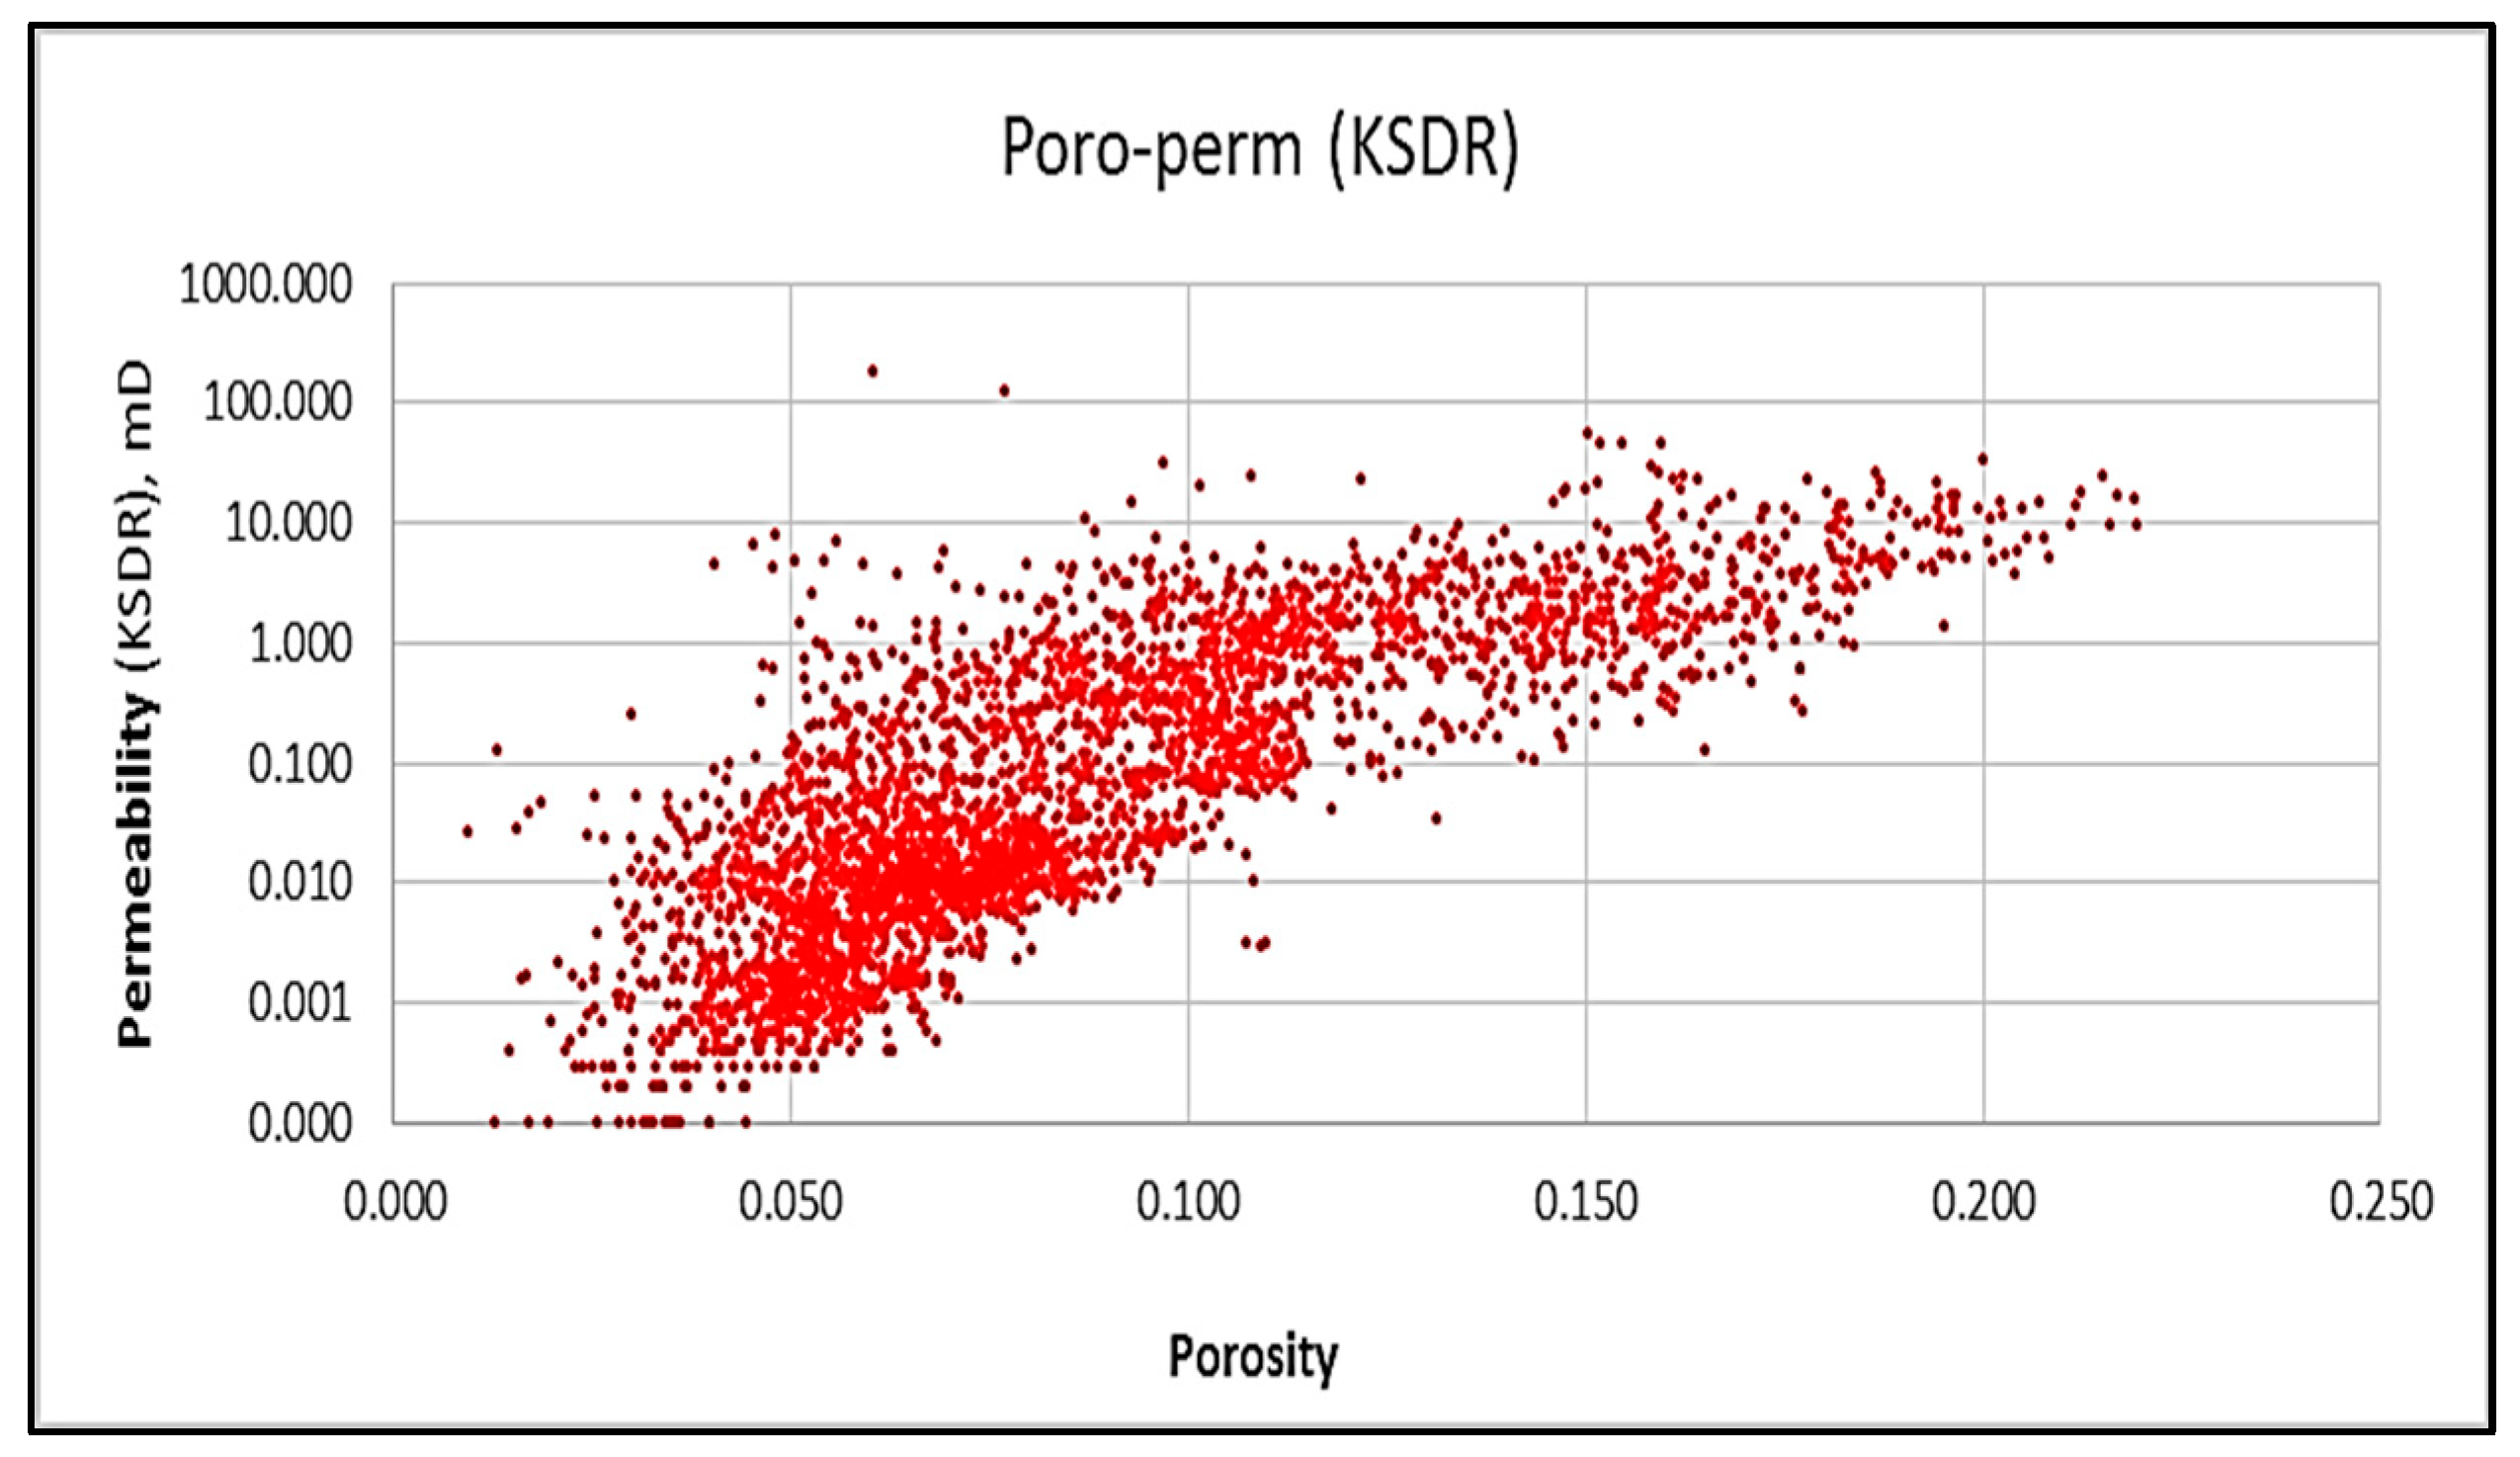
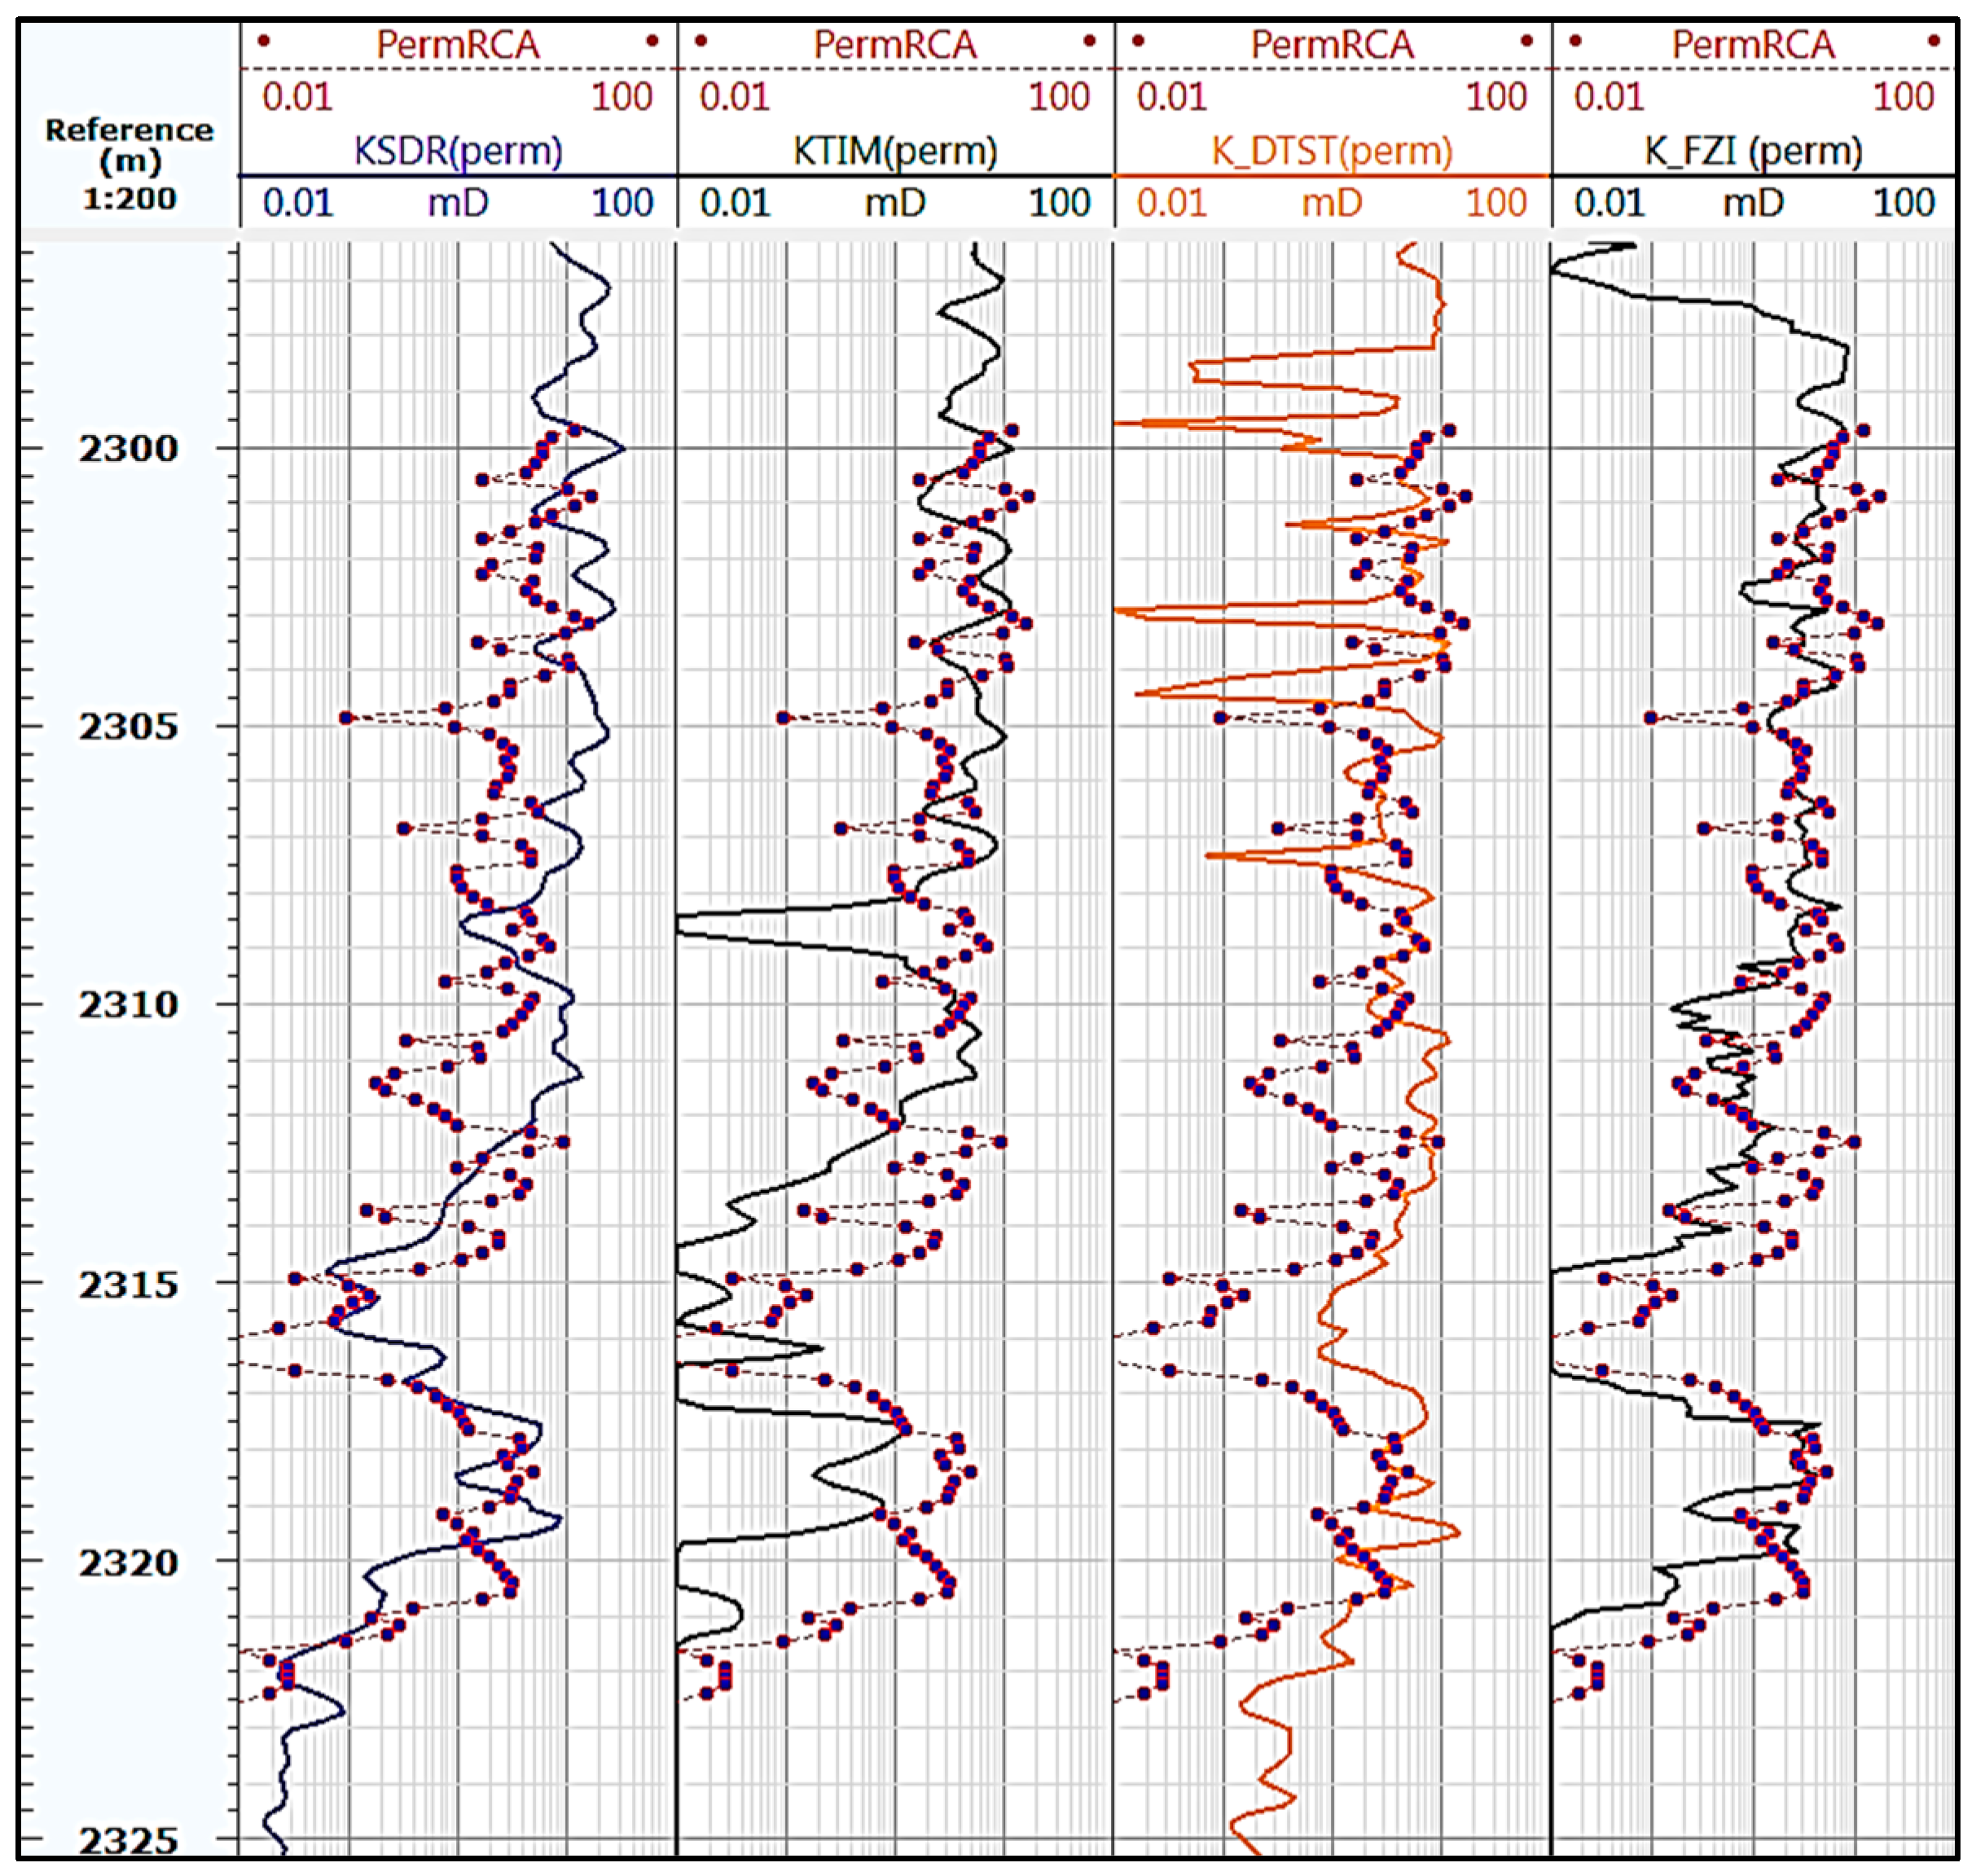
6.2.6. Permeability Estimation

One of the primary factors that will be used in the process of identifying electro-facies for wells that are already accessible in the Nene field is permeability. As a result of the availability of the NMR field, Stoneley wave velocity, and core permeability data for NNM-1, this particular well is regarded as the most important one for permeability determination. Several permeability logs have been produced using the findings obtained from rock typing in the preceding section, the SDR and Timur-Coates equations(KTIM), and the Stoneley wave. It was discovered that the permeability produced by plotting porosity/permeability with a consideration of rock types gives the best results after comparing the computed permeabilities from each approach with the available core permeability data. After that, a permeability log was produced for each of the wells that were accessible, using this technique in its entirety.

Permeability Calculation from the Porosity–Permeability Relationship

The association between core porosity and permeability, as well as occasionally water saturation, is the basis for a number of different methodologies that have been developed to assess permeability [24]. For the cored interval, the core permeability and porosity cross plots were obtained, as can be noted in Figure 11. Following the estimate of the permeability log uses the equations that were obtained for each flow unit, and the following equation was derived as the general connection between the permeability log and the porosity log in wells that are not cored:
K = 0.00004   e 57.117 × PHIE
where K indicated the permeability in mD and PHIE denotes the effective porosity log.

NMR Permeability

The capacity to record a continuous log of permeability is the feature of CMR measurement that is considered to be the most crucial. The following is the calculation that was used to determine the formation’s permeability using the Timur-Coates and Schlumberger Doll Research (SDR) equations [24]:
  • SDR equation
k = C 1 T 2 L M a 1 × φ N M R b 1
where:
  • T2LM = logarithmic mean T2;
  • φ N M R = NMR porosity (V/V);
  • C1, a1, b1 = coefficients.
ii.
Timur-Coates equation
k = C 2 F F I B V I a 2 φ N M R b 2
where:
  • FFI = free-fluid volume;
  • BVI = bound volume irreducible
  • φ N M R   = NMR porosity (p.u.);
  • C2, a2, b2 = coefficients.
The coefficient values are commonly set so that c1 = 4, a1 = 2, b1 = 4, c2 = 1, a2 = 2, and b2 = 4. The coefficients c, a, and b can also be adjusted to match core permeability data. Coefficients a and b are usually determined using NMR core analysis data. Because of differences between the laboratory and the wireline measurement, C, which is used to scale the estimate to units of millidarcy, is often “tweaked” for the log until there is a good match with the core permeability. Figure 12 and Figure 13 illustrate the generated permeability versus log porosity for each method.

Calculating the Stoneley Permeability Index (KIST)

The KIST is determined by calculating the ratio of the Stoneley slowness in the permeable zone to the Stoneley slowness in the non-permeable zone [29].
KIST = DTST DTSTE
where KIST is the Stoneley permeability index (fractional range = 0 to 1), DTST denotes the Stoneley wave slowness of formation, and DTSTE is the Stoneley wave slowness in the non-permeable zone. By averaging the Stoneley wave slowness in non-permeable zones, DTSTE was determined as 292 µs/ft for non-permeable zones in the course of implementation.
  • Calculating Stoneley FZI
The Stoneley permeability index is just a tortuosity index, due to the fact that the passage of fluid is dependent on the distribution of the pore throats, the shape of the pores, and the size of the pores. Flow Zone Index is the name given to the concept that results from the combination of these components (FZI). A direct measurement of FZI is referred to as the Stoneley permeability index. Because the FZI approaches zero when the Stoneley permeability index approaches 1 in non-permeable zones, and both of them approach infinity when permeability approaches infinity, a simple connection may be formed between the FZI and Stoneley permeability index as follows:
F Z I = I M F   ( KIST   1 )
where:
  • F Z I   = Flow Zone Index;
  • I M F   = Index Match Factor;
  • KIST   = Permeability Index.
As a result of the fact that the grain modulus has an impact on the Stoneley slowness, the IMF may be calculated as follows:
I M F = Σ   ( IMF i × V i )
where:
  • I M F   = Index Match Factor;
  • IMF i = Each Mineral IMF;
  • V i = Each Mineral Probabilistic Volume (ft3/ft3).
The IMF is calculated by adding up the volume-weighted IMF values for all of the different minerals included in the model. We computed the index matching factor for each depth using Equation (10) so that we could have the best possible match between the core permeability and the permeability index. This was carried out so that we could obtain the greatest possible fit.
  • Calculating Stoneley permeability
After converting the KIST to FZI, the following equation was used to estimate the KST-FZI Stoneley permeability by utilising effective porosity and FZI, using the following equations:
k = 1014   F Z I 2 × ϕ e f f e c t i v e 3 ( 1   ϕ e f f e c t i v e ) 2
where:
  • k = Permeability (md);
  • ϕ e f f e c t i v e = Effective Porosity (v/v);
  • F Z I = Flow Zone Index.
Finally, the outcomes of each approach to calculating permeability, are shown in Figure 14.

6.2.7. Pore Structure Investigation

It is possible to try to determine some of the attributes of the reservoir pores by making use of the data that is available, such as data from conventional well logs and NMR logs, as well as the created permeability logs. The capillary pressure parameters, pore type, and pore size are all included in these characteristics. The steps necessary to accomplish each criterion are outlined in this subsection.

Pore Type

The generation of a velocity deviation log (VDL) allows for the subdivision of reservoir pore types into three distinct groups. The sonic log and the neutron-density log are both components of the synthetic log known as the velocity deviation log. The VDL is used to identify the pore types present in reservoir rocks. Both tracing the downhole distribution of diagenetic processes and estimating the changes in permeability may be accomplished with the use of the log, as is illustrated in Figure 15 [30]. The VDL can be calculated by making use of the following equation:
V D L = V d t V R o c k = 1 d t 1 φ V M a t r i x + φ V F l u i d
where d t is the sonic log measurement and φ is the neutron-density porosity. The final results can be interpreted as one of the following classes [30]:
  • Class I (VDL > +500   μ s 1 ): indicates intraparticle and moldic or vug pore types.
  • Class II (VDL = ±500   μ s 1 ): indicates micro porosity, interparticle, and intercrystalline pore types.
  • Class III (VDL < −500 μ s 1 ): indicates a fracture pore type.
Figure 15. Computed velocity deviation log for NNM-1.
Energies 16 07572 g015
As one might expect, the interparticle pores constitute the majority within the different categories of pore types. At greater depths, when quartz is more abundant, the fracture pore type may also be present. For a siliciclastic reservoir, the Nene field does not exhibit any vuggy pore types.

Pore Sizes

The Winland R35 technique may be used to determine the size of the pore throat [31]. The formula reads as follows:
L o g   R 35 = 0.732 + 0.588 × L o g   K 0.864 × L o g   ( P h i )
where:
  • K = core permeability (md);
  • Phi = core porosity (%);
  • R = pore throat size (micron).
Calculations of the pore size distribution in each of the five accessible wells were made using the approach that was just presented. Figure 16 provides an decpiction of the computed pore size values for the well NNM-1.

Capillary Pressure

According to Altunbay et al. (2001) [32], the capillary pressure may be computed using NMR log data as follows:
k = P C T 2 - 1
where k = 3 psi and T 2 is a logarithmic mean ( T 2 L M ). However, this formula only works when the pores are completely submerged in water (SW = 1). According to the geology user’s handbook from 2015, when hydrocarbons are present, we must compute a pseudo T 2 as follows:
T 2 L M = 10 0.772 × l o g 10 1 S W i r r S W i r r + S c a l a r
where Scalar is defaulted to 1.5 and SWirr is the irreducible water saturation. As the NMR log data was available for the well NNM-1, the capillary pressure for the well was calculated, and is illustrated in Figure 17.

7. Conclusions

While navigating through the intricate landscape of unconventional reservoirs, this study meticulously unfolds a comprehensive and multifaceted approach to petrophysical evaluation, combining various methods and data sources to extract nuanced insights into reservoir properties and characteristics. The deployment of multiple permeability estimation methods, synchronized via a comparative analysis, has provided a robust and validated understanding of the reservoir’s permeability.
This manuscript has not only delineated a detailed and systematically structured methodology for petrophysical evaluation, serving as a potential guideline for analogous analyses in unconventional reservoirs, but has also fortified the existing body of knowledge and practices in the field, paving the way for future research and applications. Notably, the findings, especially those identifying productive and non-hydrocarbon-containing zones, stand poised to inform and optimize extraction strategies and well placement in the Nene field, potentially amplifying the extraction efficiency and economic viability, and providing a strategic roadmap for future explorations and developments in unconventional reservoirs.
Unconventional reservoirs, characterized by their low effective porosity and permeability, narrow drainage radius, and suboptimal productivity, require extensive, advanced stimulation, such as hydraulic fracturing or the use of either horizontal or multi-lateral wells, to produce oil at economically viable rates. The assessment of the petrophysical properties of unconventional reservoirs is rendered complex due to the inherent intricacies of these reservoirs. This study has reviewed unconventional reservoirs and the crucial assessment criteria for such reservoirs, additionally, a range of calculations is utilized to pinpoint the most productive zones, or ‘sweet spots,’ in unconventional reservoirs. These include determining shale volume, permeability, and porosity, as well as aligning core data depths with the information gathered from petrophysical analyseswhich, in this case, comprised the entire well logs from five wells drilled in the field being analysed, as well as the findings of the routine core analysis (RCAL) for two of the wells.
According to the results of the pore size estimates, the depth ranges from 2292 to 2521 m exhibit a wide variety of pore sizes, which is a strong indicator that this zone is a productive zone. The analysis of the shale calculations suggests that the depth intervals from 2550 to 2570 meters and from 2600 to 2670 meters exhibit higher oil values. Additionally, the water saturation at these ranges of depths has higher values, which include both bounded and free water, indicating that the depth range does not contain hydrocarbons. Consequently, utilizing specialized well logging and logging while drilling (LWD) technologies emerges as a pragmatic approach to gather the pivotal data needed to enhance production efficiency and gain a deeper understanding of problematic wells.
In conclusion, this study not only sheds light on the complexities and challenges inherent in the petrophysical evaluation of unconventional reservoirs, but also provides a structured methodology and valuable insights that can guide future research and practical applications in the field, thereby contributing to the advancement of knowledge and practices in the development of unconventional reservoirs.

Author Contributions

Conceptualization, A.G.; methodology, M.G.H.; software, A.G. and H.G.; validation, A.G., K.A.A., and R.A.; formal analysis, S.A.-S.; investigation, A.G.; resources, P.Y.; data curation, I.S.; writing—original draft preparation, A.G.; writing—review and editing, A.G., K.A.A., H.G., and I.S.; visualization, M.H.; supervision, A.G. and K.A.A.; project administration, I.S., H.G., and K.A.A. All authors have read and agreed to the published version of the manuscript.

Funding

The authors extend their appreciation to the Deanship of Scientific Research at King Khalid University for funding this work as a large-group Research Project under grant number RGP2/211/44.

Data Availability Statement

Data are available upon reasonable request.

Conflicts of Interest

The authors declare no conflict of interest.

References

  1. Ahmed, U.; Meehan, D.N. (Eds.) Unconventional Oil and Gas Resources: Exploitation and Development; CRC Press: Boca Raton, FL, USA, 2016. [Google Scholar]
  2. Loucks, R.G.; Reed, R.M.; Ruppel, S.C.; Hammes, U. Spectrum of pore types and networks in mudrocks and a descriptive classification for matrix-related mudrock pores. AAPG Bull. 2012, 96, 1071–1098. [Google Scholar] [CrossRef]
  3. Miller, C.; Waters, G.; Rylander, E. Evaluation of production log data from horizontal wells drilled in organic shales. In Proceedings of the SPE Unconventional Resources Conference/Gas Technology Symposium, The Woodlands, TX, USA, 14 June 2011; SPE: Santa Clara, CA, USA, 2011; p. SPE-144326. [Google Scholar]
  4. Passey, Q.R.; Bohacs, K.M.; Esch, W.L.; Klimentidis, R.; Sinha, S. From oil-prone source rock to gas-producing shale reservoir–geologic and petrophysical characterization of unconventional shale-gas reservoirs. In Proceedings of the SPE International Oil and Gas Conference and Exhibition in China, Beijing, China, 8 June 2010; SPE: Santa Clara, CA, USA, 2010; p. SPE-131350. [Google Scholar]
  5. Waters, G.; Dean, B.; Downie, R.; Kerrihard, K.; Austbo, L.; McPherson, B. Simultaneous hydraulic fracturing of adjacent horizontal wells in the Woodford Shale. In Proceedings of the SPE Hydraulic Fracturing Technology Conference and Exhibition, The Woodlands, TX, USA, 19 January 2009; SPE: Santa Clara, CA, USA, 2019; p. SPE-119635. [Google Scholar]
  6. Zou, C. Meaning of unconventional petroleum geology. In Unconventional Petroleum Geology; Elsevier: Amsterdam, The Netherlands, 2017; pp. 49–95. [Google Scholar]
  7. Chekani, M.; Kharrat, R. An integrated reservoir characterization analysis in a carbonate reservoir: A case study. Pet. Sci. Technol. 2012, 30, 1468–1485. [Google Scholar] [CrossRef]
  8. Metwalli, F.I.; Pigott, J.D.; Ramadan, F.S.; El-Khadragy, A.A.; Afify, W.A. Alam El Bueib reservoir characterization, Tut oil field, North Western Desert, Egypt. Environ. Earth Sci. 2018, 77, 143. [Google Scholar] [CrossRef]
  9. Oyeyemi, K.D.; Olowokere, M.T.; Aizebeokhai, A.P. Hydrocarbon resource evaluation using combined petrophysical analysis and seismically derived reservoir characterization, offshore Niger Delta. J. Pet. Explor. Prod. Technol. 2018, 8, 99–115. [Google Scholar] [CrossRef]
  10. Global LNG Info. Available online: https://www.globallnginfo.com/ShowNews.aspx?NewsID=20220000053 (accessed on 30 October 2023).
  11. McHargue, T.R. Stratigraphic Development of Proto-South Atlantic Rifting in Cabinda, Angola—A Petroliferous Lake Basin: Chapter 19; AAPG: Tulsa, OK, USA, 1990. [Google Scholar]
  12. Harris, N.B. AAPG Memoir 73, Chapter 24: Toca Carbonate, Congo Basin: Response to an Evolving Rift Lake; AAPG: Tulsa, OK, USA, 2000. [Google Scholar]
  13. Ma, Y.Z.; Holditch, S. Unconventional Oil and Gas Resources Handbook: Evaluation and Development; Gulf Professional Publishing: Houston, TX, USA, 2015. [Google Scholar]
  14. Ran, Q. Unconventional Tight Reservoir Simulation: Theory, Technology and Practice; Springer Nature: Berlin/Heidelberg, Germany, 2020. [Google Scholar]
  15. Jenkins, C.D.; Boyer, C.M. Coalbed-and shale-gas reservoirs. J. Pet. Technol. 2008, 60, 92–99. [Google Scholar] [CrossRef]
  16. Jacobi, D.; Longo, J.M.; Sommer, A.; Pemper, R. A chemistry-based expert system for mineral quantification of sandstones. In Proceedings of the Petrotech 2007 Oil and Gas Conference and Exhibition, New Delhi, India, 15–19 January 2007. [Google Scholar]
  17. Jarvie, D.M. Total Organic Carbon (TOC) Analysis: Chapter 11: Geochemical Methods and Exploration; AAPG: Tulsa, OK, USA, 1991. [Google Scholar]
  18. Sondergeld, C.H.; Newsham, K.E.; Comisky, J.T.; Rice, M.C.; Rai, C.S. Petrophysical considerations in evaluating and producing shale gas resources. In Proceedings of the SPE Unconventional Gas Conference, Pittsburgh, PA, USA, 23 February 2010; OnePetro: Richardson, TX, USA, 2010. [Google Scholar]
  19. Bustin, R.M.; Bustin, A.; Ross, D.; Chalmers, G.; Murthy, V.; Laxmi, C.; Cui, X. Shale Gas Opportunities and Challenges: AAPG Search and Discovery Article 40382. In Proceedings of the AAPG Annual Convention, San Antonio, TX, USA, 20–23 April 2008. [Google Scholar]
  20. LeCompte, B.; Franquet, J.A.; Jacobi, D. Evaluation of Haynesville Shale vertical well completions with a mineralogy-based approach to reservoir geomechanics. In Proceedings of the SPE Annual Technical Conference and Exhibition, New Orleans, LA, USA, 4 October 2009; SPE: Santa Clara, CA, USA, 2009; p. SPE-124227. [Google Scholar]
  21. Walles, F. A New Method to Help Identify Unconventional Targets for Exploration and Development through Integrative Analysis of Clastic Rock Property Fields; AAPG: Tulsa, OK, USA, 2004. [Google Scholar]
  22. Peeters, M.; Visser, R. A comparison of petrophysical evaluation packages: LOGIC, FLAME, ELAN, OPTIMA, and ULTRA. Log Anal. 1991, 32, 350–357. [Google Scholar]
  23. Crain, E.R. Crain’s Petrophysical Handbook: Spectrum 2000 Mindware Limited; 2002; Available online: https://www.spec2000.net/index.htm (accessed on 30 October 2023).
  24. Tiab, D.; Donaldson, E.C. Petrophysics: Theory and Practice of Measuring Reservoir Rock and fluid Transport Properties; Gulf Professional Publishing: Houston, TX, USA, 2015. [Google Scholar]
  25. Kadkhodaie-Ilkhchi, A.; Amini, A. A fuzzy logic approach to estimating hydraulic flow units from well log data: A case study from the Ahwaz oilfield, South Iran. J. Pet. Geol. 2009, 32, 67–78. [Google Scholar] [CrossRef]
  26. Ebanks, W.J., Jr. Flow unit concept-integrated approach to reservoir description for engineering projects. In Proceedings of the Conference: American Association of Petroleum Geologists Annual Meeting, Los Angeles, CA, USA, 7 June 1987; Volume 71. [Google Scholar]
  27. Amaefule, J.O.; Altunbay, M.; Tiab, D.; Kersey, D.G.; Keelan, D.K. Enhanced reservoir description: Using core and log data to identify hydraulic (flow) units and predict permeability in uncored intervals/wells. In Proceedings of the SPE Annual Technical Conference and Exhibition, Houston, TX, USA, 3 October 1993; OnePetro: Richardson, TX, USA, 1993. [Google Scholar]
  28. Prasad, M. Correlating permeability with velocity using flow zone indicators. In SEG Technical Program Expanded Abstracts 1999; Society of Exploration Geophysicists: Houston, NY, USA; pp. 184–187.
  29. Kosari, E.; Ghareh-Cheloo, S.; Kadkhodaie-Ilkhchi, A.; Bahroudi, A. Fracture characterization by fusion of geophysical and geomechanical data: A case study from the Asmari reservoir, the Central Zagros fold-thrust belt. J. Geophys. Eng. 2015, 12, 130–143. [Google Scholar] [CrossRef]
  30. Anselmetti, F.S.; Eberli, G.P. The velocity-deviation log: A tool to predict pore type and permeability trends in carbonate drill holes from sonic and porosity or density logs. AAPG Bull. 1999, 83, 450–466. [Google Scholar]
  31. Kolodzie, S., Jr. Analysis of pore throat size and use of the Waxman-Smits equation to determine OOIP in Spindle Field, Colorado. In Proceedings of the SPE Annual Technical Conference and Exhibition, Dallas, TX, USA, 21 September 1980; SPE: Santa Clara, CA, USA, 1980; p. SPE-9382. [Google Scholar]
  32. Altunbay, M.; Martain, R.; Robinson, M. Capillary pressure data from NMR logs and its implications on field economics. In Proceedings of the SPE Annual Technical Conference and Exhibition, New Orleans, LA, USA, 30 September 2001; SPE: Santa Clara, CA, USA, 2001; p. SPE-71703. [Google Scholar]
Figure 1. Nene Marine field, the Congo basin [10].
Energies 16 07572 g001
Figure 2. Stratigraphic column of the Congo and Cabinda Basin [12].
Energies 16 07572 g002
Figure 3. Source rock reservoir’s petrophysical assessment features [13].
Energies 16 07572 g003
Figure 4. Unconventional resource play model of the fundamental components with organic matter sidebars [1].
Energies 16 07572 g004
Figure 5. Calculated porosity, shale volume, and fluids saturation for NNM-1.
Energies 16 07572 g005
Figure 6. Depth matching using core porosity.
Energies 16 07572 g006
Figure 7. Log–log plot of RQI versus normalized porosity in NNM-1.
Energies 16 07572 g007
Figure 8. Log–log plot of RQI versus normalized porosity in Banga−M1.
Energies 16 07572 g008
Figure 9. Probability plot for calculated FZIs in NNM-1.
Energies 16 07572 g009
Figure 10. Probability plot for calculated FZIs in Banga−M1.
Energies 16 07572 g010
Figure 11. Core porosity−permeability plot.
Energies 16 07572 g011
Figure 12. KSDR permeability–porosity relationship in well NNM-1.
Energies 16 07572 g012
Figure 13. KTIM permeability–porosity relationship in well NNM-1.
Energies 16 07572 g013
Figure 14. Generated permeability logs from each method, compared by core permeability.
Energies 16 07572 g014
Figure 16. Calculated pore size for NNM-1.
Energies 16 07572 g016
Figure 17. Calculated capillary pressure from NMR log data in a section of NNM-1.
Energies 16 07572 g017
Table 2. The complexities of tight sandstone reservoir development.
No.CategoryChallenges
1Petrophysical ChallengesPore Structure: complexity and low porosity/permeability Reservoir Heterogeneity: variations in mineral composition and layering
2Technological LimitationsExtraction Techniques: technical and financial challenges Recovery Rates: lower than conventional reservoirs
3Economic ChallengesHigh Development Costs: capital-intensive technologies/methodologies
Market Fluctuations: susceptibility to global oil prices
4Environmental and Regulatory ChallengesEnvironmental Impact: groundwater contamination, induced seismicity
Regulatory Hurdles: stricter regulations and policies
5Geomechanical ChallengesInduced Seismicity: risks due to hydraulic fracturing. Reservoir Depletion: subsidence and altered stress regimes
6Reservoir ManagementData Management: handling and interpreting vast data
Reservoir Modelling: complexity due to heterogeneous nature
7Infrastructure and Logistical ChallengesAccessibility: challenges in remote/offshore locations
Supply Chain: ensuring robustness for materials and equipment
8Human Resource ChallengesExpertise: shortage of skilled professionals
Safety: ensuring personnel safety in demanding and hazardous environments
9Social and Political AspectsSocial Acceptance: opposition to unconventional techniques
Political Stability: risks in politically unstable regions
Table 3. Evaluation of the Nene reservoir’s petrophysics [22].
Petrophysical AnalysisAcquired ParametersUsed Software
Shale volume calculationShale (clay) volumeGeolog 7.4
Porosity calculationTotal porosity, effective porosityGeolog 7.4
Reservoir rock/fluid substitutionsMineralogy, water saturation, hydrocarbon saturationGeolog 7.4
Core data depth matchingDepth-matched core porosity/permeabilityTechlog 2015
Rock TypingRock Quality Index (RQI), Flow Zone Index (FZI), Hydraulic Flow Units (HFU)Excel 2016
Permeability estimationNMR permeability, Stoneley permeability, permeability log equationGeolog 7.4 and Excel
Pore structure investigationVDL, pore type, capillary pressure (Pc), pore pressure, J functionGeolog 7.4 and Excel
Visualize output dataLayouts, charts, tablesTechlog 2015
Table 4. Available data for petrophysical analysis. (*: Shows the availability of well within Nene).
Well No.Available Data (Nene Field)
CALIGRDensityNeutronResistivityPEFDTCODTSCMRGas ShowsMDT/XPTRCAL
NNM-1***** ******
NNM-2**** *** **
NNM-2_Hor******** *
NNM-3**** ** **
Banga-M1***** * *
Table 5. Methods used in the calculation of reservoir shale volume [23].
MethodEquation
Vsh − GR V sh = GR   -   GR ma GR sh   -   GR ma
Vsh − NS NPHI = NPHI ma   ( 1   -   V sh -   P H I E ) + NPHI fluid P H I E +   NPHI sh   V sh
DT =   DT ma   ( 1   -   V sh   -   P H I E ) +   DT fluid P H I E +   DT sh V sh
Vsh − DN RHO = RHO ma   ( 1   -   V sh -   PHIE ) +   RHO fluid     PHIE +   RHO sh V sh
N P H I = NPHI ma ( 1   -   V s h   -   P H I E ) + NPHI fluid P H I E +   NPHI sh V s h
Vsh − DS R H O = R H O m a ( 1   -   V s h   -   P H I E ) + R H O f l u i d P H I E + R H O s h V s h
D T =   DT ma ( 1   -   V s h -   P H I E ) +   DT fluid P H I E +   DT sh V s h
Table 6. Methods used in the calculation of a reservoir’s porosity [23].
MethodEquation
PHIT_D ϕ total = ρ ma +   ρ B ρ ma +   ρ f
PHIT_S ϕ t o t a l = t + t   m a t   f + t   m a
PHIT_NRead the value directly from the log
PHIT_ND ϕ t o t a l = ϕ N 2 + ϕ D 2 2
PHIE ϕ e f f e c t i v e = ϕ t o t a l × ( 1 V s h )
Table 7. Identified flow units and rang of Log FZI values for NNM-1.
HFU 1Log FZI < −1.4
HFU 2−1.4 < Log FZI < −1
HFU 3−1 < Log FZI < −0.7
HFU 4−0.7 < Log FZI < −0.45
HFU 5−0.45 < Log FZI < 0.05
HFU 6Log FZI > 0.05
Table 8. Identified flow units and range of Log FZI values for Banga-M1.
HFU 1Log FZI < −0.9
HFU 2−0.9 < Log FZI < −0.7
HFU 3−0.7 < Log FZI < −0.3
HFU 4−0.3 < Log FZI < −0.15
HFU 5−0.15 < Log FZI < 0.15
HFU 6Log FZI > 0.15
Disclaimer/Publisher’s Note: The statements, opinions and data contained in all publications are solely those of the individual author(s) and contributor(s) and not of MDPI and/or the editor(s). MDPI and/or the editor(s) disclaim responsibility for any injury to people or property resulting from any ideas, methods, instructions or products referred to in the content.

