Article

Investigating the Influence of Distributor Type, Particle Size and Rice Husk Percentage on Fluidized Beds through Cold Fluidization Experiments

by
Fernando M. P. Balestieri
1,*,
Carlos M. R. Luna
1,2 and
Ivonete Ávila
1
1
Laboratory of Combustion and Carbon Capture (LC3), Department of Energy and Chemistry, School of Engineering and Science, UNESP—São Paulo State University, Guaratinguetá 12515-370, SP, Brazil
2
Department of Production Engineering, Campus de Itapeva, UNESP—São Paulo State University, Itapeva 18409-010, SP, Brazil
*
Author to whom correspondence should be addressed.
Energies 2023, 16(22), 7574; https://doi.org/10.3390/en16227574
Submission received: 21 September 2023 / Revised: 12 October 2023 / Accepted: 22 October 2023 / Published: 14 November 2023

Abstract

:
This work studies a fluidization system through cold experiments by using a mixture of rice husk and sand to investigate three parameters: type of bed distributor (perforated plate and plate with Tuyere-type injectors), sand granulometry (mean diameters of 324 µm and 647 µm) and rice husk mass ratio (from 1% to 10% of rice husk). The results reveal that the perforated distributor plate achieved a lower minimum fluidization velocity. However, the plate with Tuyere injectors generated better mixing, thus reducing possible stagnation points. An increase in the mean diameter of the sand raises the minimum fluidization velocity but also facilitates the formation of preferential channels. As for the rice husk mass ratio, values of over 5% cause stagnation points and preferential channels. It was also found that the relation between minimum fluidization velocity and rice husk ratio follows an exponential behavior, and an equation was developed to better describe their relation.

1. Introduction

It is well known that fossil fuel combustion results in greenhouse gas (GHG) emissions, which cause serious environmental problems. Furthermore, fossil fuels are non-renewable energy sources, and even though there is still a considerable amount available, they will eventually be depleted. In addition, it is predicted that energy demand by 2040 could increase by 30% (IEA) [1]. All these facts evidence that investing in renewable energy is becoming increasingly needed, and not just an alternative.
One of the renewable energy sources having insurmountable potential is biomass, a term used to reference any type of organic matter with accumulated chemical energy from recent photosynthesis. Examples of such are not only plants but also animals and feces, and although carbon is released into the atmosphere by burning biomass, carbon is also absorbed once photosynthesis is performed, which results in a relatively carbon-neutral cycle [2].
One might argue that some biomasses take far too much space to be cultivated; therefore, such large areas could be used for agricultural purposes and livestock raising, as these large areas are only available in a few countries. One way of minimizing this problem is using the resulting residues from these activities as sources of energy. If organic matter is discarded in the open, it will be decomposed into methane (CH4) and nitrous oxide (N2O), and these gases are partially responsible for the GHG effect and causing acid rain, respectively [3]. Furthermore, CH4 has Global Warming Potential, which is 25 times more powerful than carbon dioxide (CO2) [4,5]. Therefore, burning these residues in a well-controlled environment, thereby reducing or eliminating the emission of NOx and other types of pollutants, could prove less harmful than discarding them and letting them decompose in the environment.
Among different types of biomass, rice husk has great untapped potential, since it is often discarded and is usually burned in the open, given that leaving it to accumulate on the land is not beneficial to soil quality [6]. Over 700 MT (million tonnes) of rice is produced annually worldwide [7], and 14 to 33 wt% of such production is composed of rice husk. Therefore, if the energy stored in the rice husk were used as a heat source in a combined cycle, it would allow not only a reduction in negative environmental impacts caused by their decomposition, but also produce energy [6].
Considering the various types of technologies currently available for biomass combustion, a fluidized bed reactor is considered one of the most advantageous on account of its fuel flexibility, low environmental impact, ease of control and high combustion efficiency [8]. A bubbling fluidized bed reactor is particularly more efficient in transferring heat, as it requires less energy and has less abrasion compared to circulating bed reactors [9].
Fluidization serves as the fundamental principle behind the operation of a fluidized bed reactor. It entails the movement of a fluid in the opposite direction of gravity through a cluster of solid particles. If fluid flow is sufficiently high, the drag force generated by the fluid reaches equilibrium with the opposing force of gravity. This results in granular material suspension, thus allowing it to move freely and exhibit a similar behavior to that of a fluid. Such a phenomenon has led to coining the term “fluidization” [10,11].
Geldart [12] observed that the behavior of a fluidized bed reactor varies, based on a few factors such as particle density, the fluidizing agent properties and the size of the solid particles. As air is introduced into a fluidized bed reactor containing rice husk, it can lead to the formation of preferential channels on its bed, in addition to resulting in the creation of multiple stagnation points, which can, in turn, impede the fluidization process. This is one of the explanations for the fact that rice husk is typically mixed with chemically inert materials, e.g., sand, to facilitate fluidization processes [13].
Among different and important variables for fluidization, the distributor is accountable for injecting the fluidizing gas into the reactor. The manner in which this fluidizing gas is injected affects the fluid dynamics of the bed. In the case of a binary mixture, the level of segregation between different particles is usually composed of a fuel and a chemically inert substance, such as sand. This has a direct effect on the efficiency of thermal processes within a fluidized bed; therefore, distributor design is an important process variable [14,15,16,17].
There are several types of distributors, as reported by Shukrie [16]. There is a wide range of simpler models, such as a perforated plate, in addition to more complex ones including the multi-vortex plate [18,19] or the annular spiral air distributor [15,20].
Although some authors compare the effects of two different distributors [21], there is little data on how different types of distributors affect the segregation process on a binary mixture in the literature, especially concerning biomass. Lundberg et al. [17] researched the influence of a mixture on a fluidized bed; nonetheless, their findings were focused on wood pellets and the material used in their cold unit, which was a transparent cylindrical pill capsule, not actual biomass.
Therefore, this work is focused on evaluating the influence of three variables (type of distributor, inert particle size and rice husk ratio) on the mixture level of rice husk and sand in a fluidized bed.
It is expected that cold fluidization experiments might improve numerical simulations and fluid dynamics understanding of the fluidized bed. It can help in making better decisions when building a fluidized bed for rice husk thermochemical conversion.

2. Materials and Methods

2.1. Preparation of Solid Particles to Be Used in Experiments

Rice husk was kindly provided by producers residing in the city of Guaratinguetá, the Paraíba do Sul Valley region, State of São Paulo, Southeast Brazil. Considering that rice husk and sand have similar colors, the rice husk was dyed in indigo for better contrast and visualization in experiments. The dying process consisted of dipping rice husk in an indigo printer ink, which was then dried in a muffle for 12 h at 105 °C. Because of the natural yellowish color of the rice husk, when it was mixed with indigo ink, the rice husk acquired a color that resembles green.
Its color was the only property that effectively changed, while other properties such as volume, density and geometry remained the same as those in their raw form.
Construction sand from Ribeirão Preto, São Paulo, Brazil, was used as inert material in the cold fluidization. The sand was conditioned using ASTM (mesh) sieves, resulting in two different particle sizes for the experiments: 500–150 µm and 850–500 µm.

2.2. Experimental Setup for Cold Fluidization Experiments

The system used to conduct the cold fluidization experiments is shown in Figure 1. An atmospheric bubbling fluidized bed was designed by the LC3 research group. The system is composed of an acrylic fluidized bed, and a radial compressor (an Ibram CR8 with 7.5 hp), which can reach a maximum flow of 8 m3/min and 39.2 kPa of maximum manometric pressure. Flow measurements were performed using an orifice plate with an orifice diameter of 16.93 mm, and pressure measurements were collected before (pressure tap 1) and after (pressure tap 2) the orifice plate experiments. Pressures were obtained from pressure taps 1, 2, 3A and 3B, depicted in Figure 1. All the pressure measurements, including the ones used for flow calculations, were carried out using an Arduino Due (Arduino, Italy) system integrated with BMP280 Bosch sensors (Bosch, Germany) designed by the authors specifically for measuring pressure variations in fluidized bed reactors. The software used was designed specifically for such a purpose.
Pressure taps 3A and 3B were named as such due to the fact they were never used simultaneously in these experiments. Pressure tap 3A was used to characterize gas distributors, while pressure tap 3B was used in all the remaining experiments.
The fluidized bed was 156 mm in internal diameter and 650 mm in height, with two types of distributors, a perforated plate and a Tuyere injector plate.

2.3. Characterization of Solid Particles

The actual density, ρ p , of the solids was calculated by dividing the particle mass by its volume. However, it is impractical to measure the mass and volume of one single particle, especially considering the small size of particles used in experiments, as well as their heterogenicity in shape and size. Therefore, particle density was calculated by measuring the mass, mp, of a set amount of particles and dividing it by the sum of all the volumes, Vp, of particles, as in Equation (1).
ρ p = m p V p
The bulk density of solids was also calculated, according to Equation (2). The difference from particle density is apparent volume, Va, which considers the volume of particles and the spaces between them. It is derived by pouring the sample into a graduated measuring cylinder of set volume and mass. The cylinder is then weighed and the mass, mp, of the solid sample is calculated by subtracting the mass in the cylinder from the total mass.
ρ a = m p V a
The voidage, ε, of particles was calculated using Equation (3), based on the particle and bulk densities. It represents the percentage of space between particles in untapped apparent volume, Va.
ε = 1 ρ a ρ m p
A classification of the types of particles for fluidization was made according to Geldart [12]. The particle size distribution of the sand was defined using ASTM sieves based on the methods proposed by Kunii, Levenspiel [10] and Werther [22], using Equation (4). dmd is the mean diameter of particles, Xgr is the mass fraction of each granulometric range, and dgr is the mean diameter between the two sieves through which the mass fraction, Xgr, was retained.
d m d = 1 i = 1 n X g r d g r
The sphericity of a particle is an important parameter to be measured in fluidization systems, especially due to the fact that it affects the behavior of particles. Sphericity is defined as the ratio between the actual area of a particle and the area of an equivalent sphere. In this work, a bidimensional equivalent known as roundness was measured using Equation (5).
R = 4 A π D
Roundness refers to the ratio between the area, A, of the projected particle and that of an equivalent circle, considering the greatest size as its diameter, D. Area was calculated using the software ImageJ 1.53 K, resulting in the roundness of 987 different rice husks.

2.4. Variables Obtained from the Fluidized Bed Reactor

Minimum fluidization velocity, Umf, was calculated by generating a profile for pressure variation, ΔPb, on the fluidized bed, in addition to superficial gas velocity, Uo. The mixture level was also defined in each test by extracting samples at different heights of the fluidized bed. The height level is defined as a function of the tool used to make extractions, which is at every 70 mm, except for the first extraction at only 20 mm in height considering the distributor as the reference.
Bed expansion, δ, is a direct relation between the initial bed height before the beginning of fluidization, Hi, and the bed height after the bubbling regime is Hb at fixed air velocity. Such a relation is shown in Equation (6).
δ = H b H i
Mixture level is calculated using Kramer’s equation, shown in Equation (7). If the mixing index is M = 1, it is thoroughly mixed, but it is completely segregated if M = 0,
M = σ s 2 σ σ s 2 σ m 2
where σs is the standard deviation of the mass fraction when there is complete segregation, σm is the standard deviation of the mass fraction when there is complete mixing, and σ is the bed standard deviation given by Equation (8), where Xi refers to the mass fraction of biomass at a given height, the average of heights and the number of layers in the bed reactor.
σ = 1 n 1 i 1 n ( X i X ¯ )
The complete segregation standard deviation (σs) and complete mixture standard deviation (σm) are defined using the equations provided by Wel [23], as in Equations (9) and (10).
σ s = X c ( 1 X c )
σ m = m p X c ( 1 X c ) m t a
In Equations (9) and (10), Xc is defined as the component mass fraction in the mixture, mp is the mass of a single particle, and mta is the total amount of mass of samples.

2.5. Experimental Procedure for Cold Fluidization Experiments

Three factors were investigated in cold fluidization experiments: type of distributor plate (perforated and those with Tuyere injectors), sand particle sizes (150–500 µm and 500–850 µm) and rice husk mass ratio (1% to 10%).
The amount of inert material used in all the experiments was set at 4 kg, i.e., the same value used by Lv et al. [24]. A standard test was carried out on a perforated plate distributor using sand with an average particle size of 325 µm and a 5 wt% ratio of rice husk mass. Based on this experiment, all three factors mentioned above were changed. The experiments were repeated twice for each configuration.
All the experiments were conducted with the objective of studying fluidization in a bubbling regime. For such a purpose, the minimum fluidization velocity, Umf, was defined for each experimental condition tested, and then the minimum bubbling velocity was defined as 1.2 Umf, which was enough to achieve a bubbling regime in every tested condition.

3. Results and Discussion

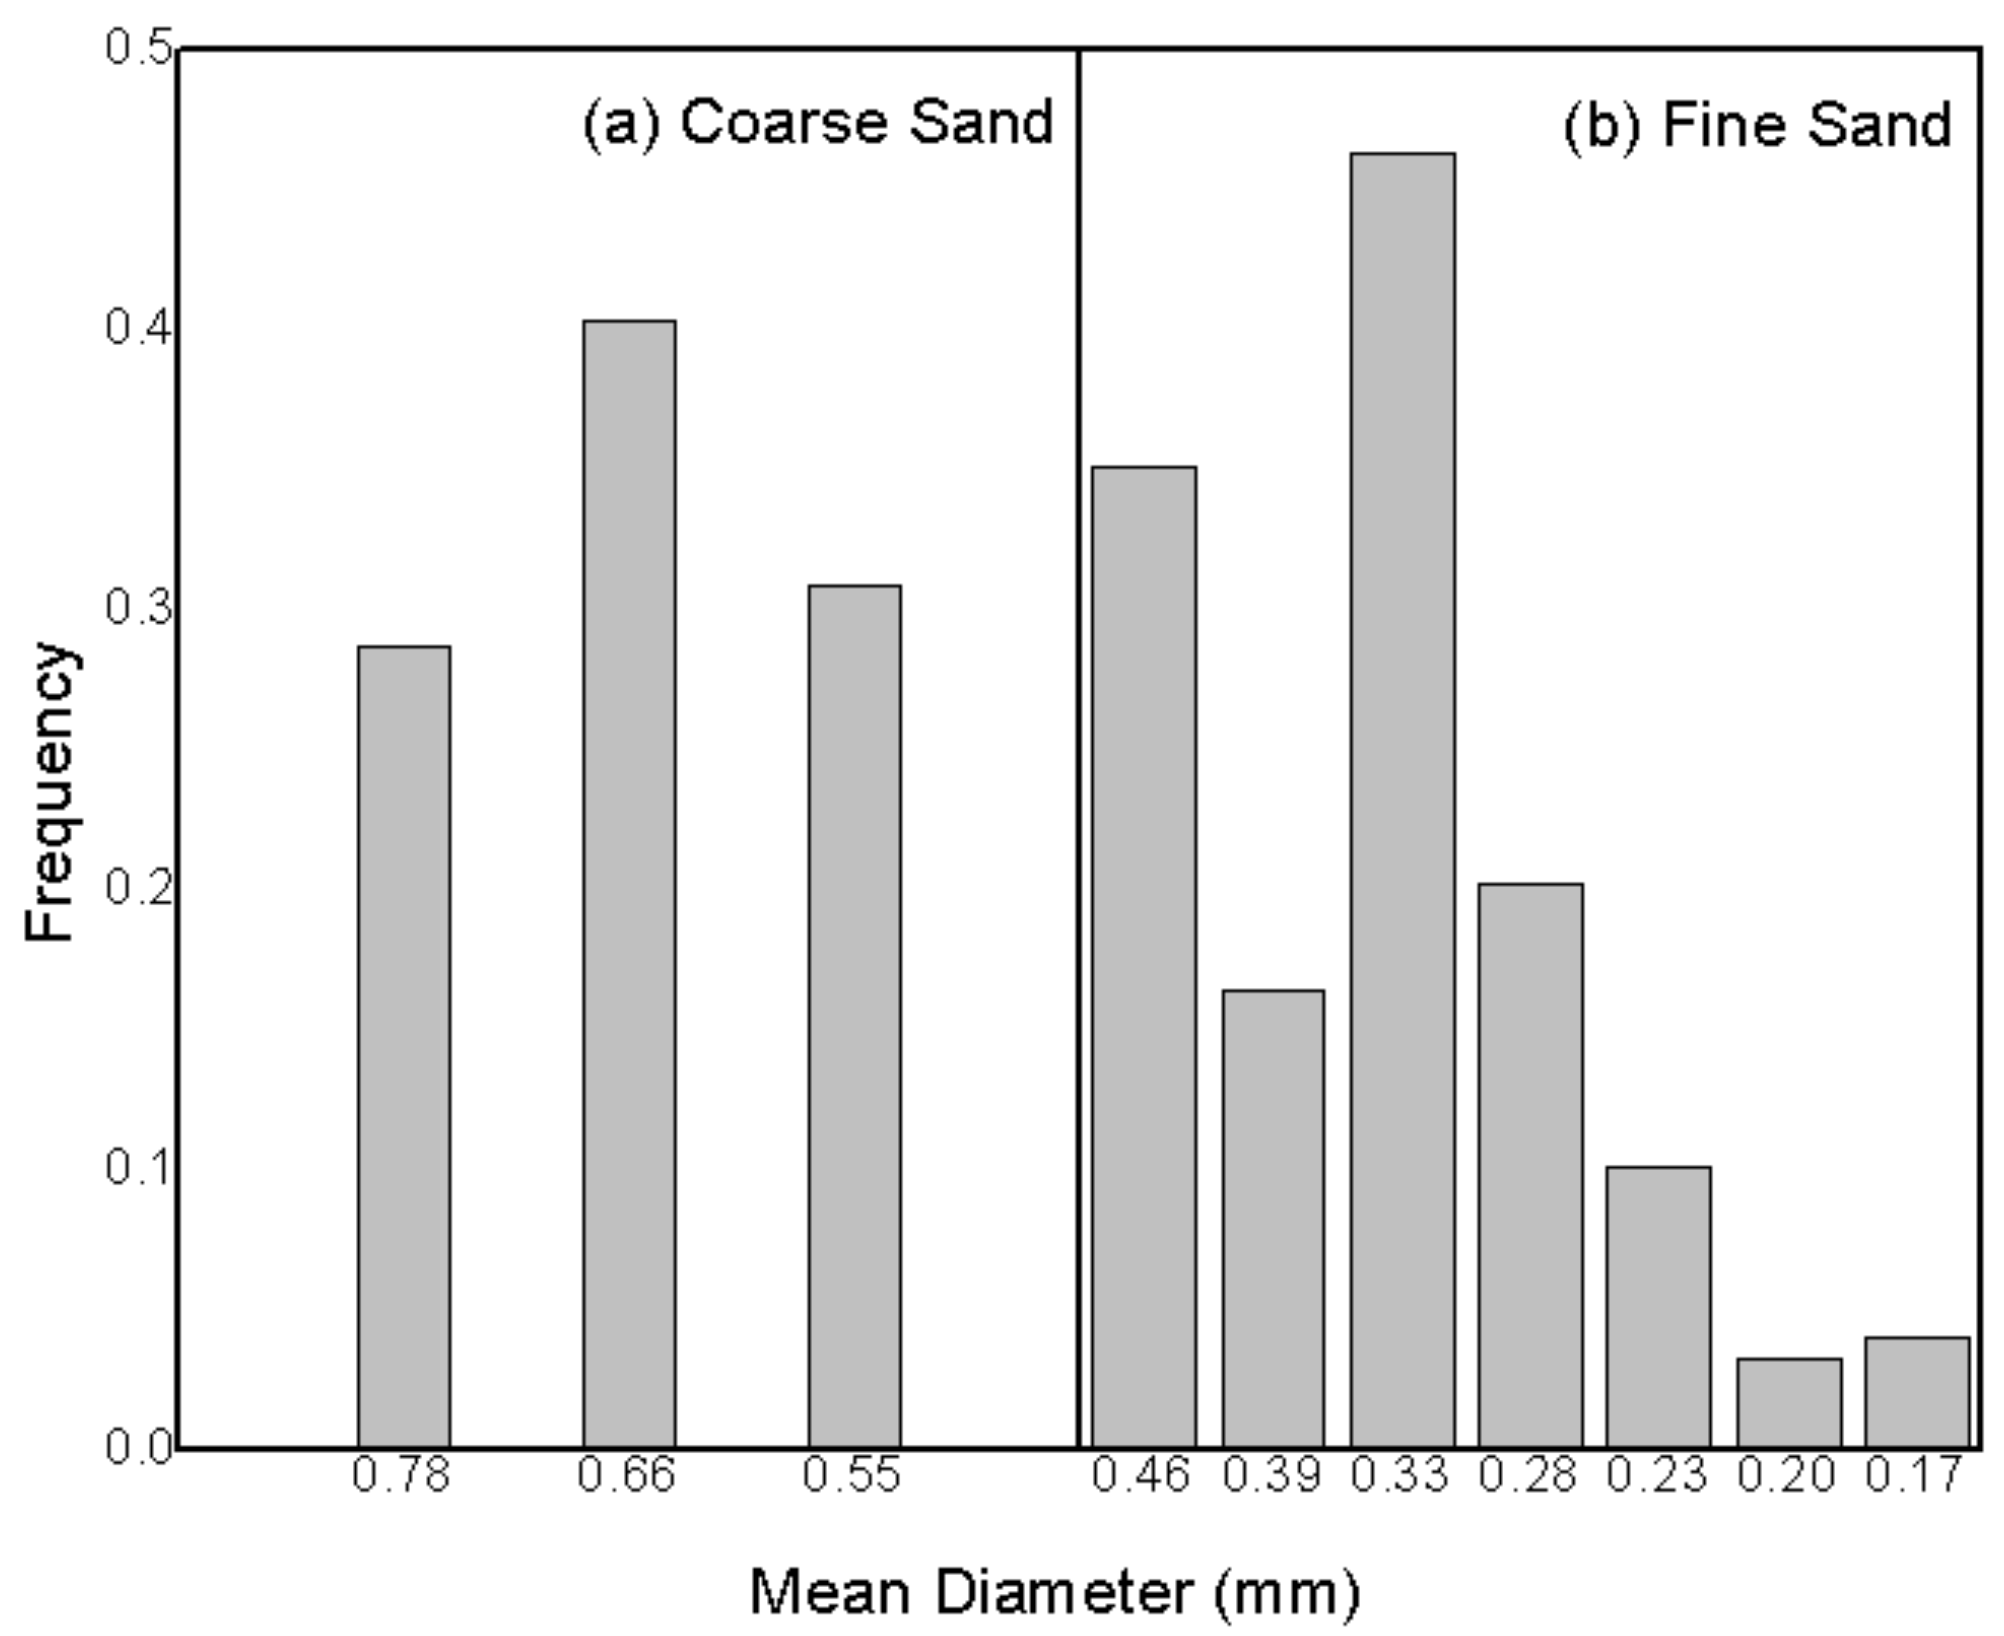
3.1. Characterization of Solid Particles

The particle size distributions for both sands having different granulometries are shown in Figure 2. It was observed that the sand with an average particle size of 647 µm had a homogeneous distribution, while that having 324 µm did not have a unimodal profile.
The mean diameter of the rice husk considered was the same as that defined in Abdullah; Husain and Yin Pong [25]. Their diameters were used as parameters for classifying particles according to methods established by Geldart [12]. Therefore, the stage of physical characterization was performed using the three particulate materials (two types of sand and one type of rice husk), as presented in Table 1.
The chemical composition of the sands and rice husks is described in Table 2. The mass percentage for each element was calculated through a CHNS elemental analysis.

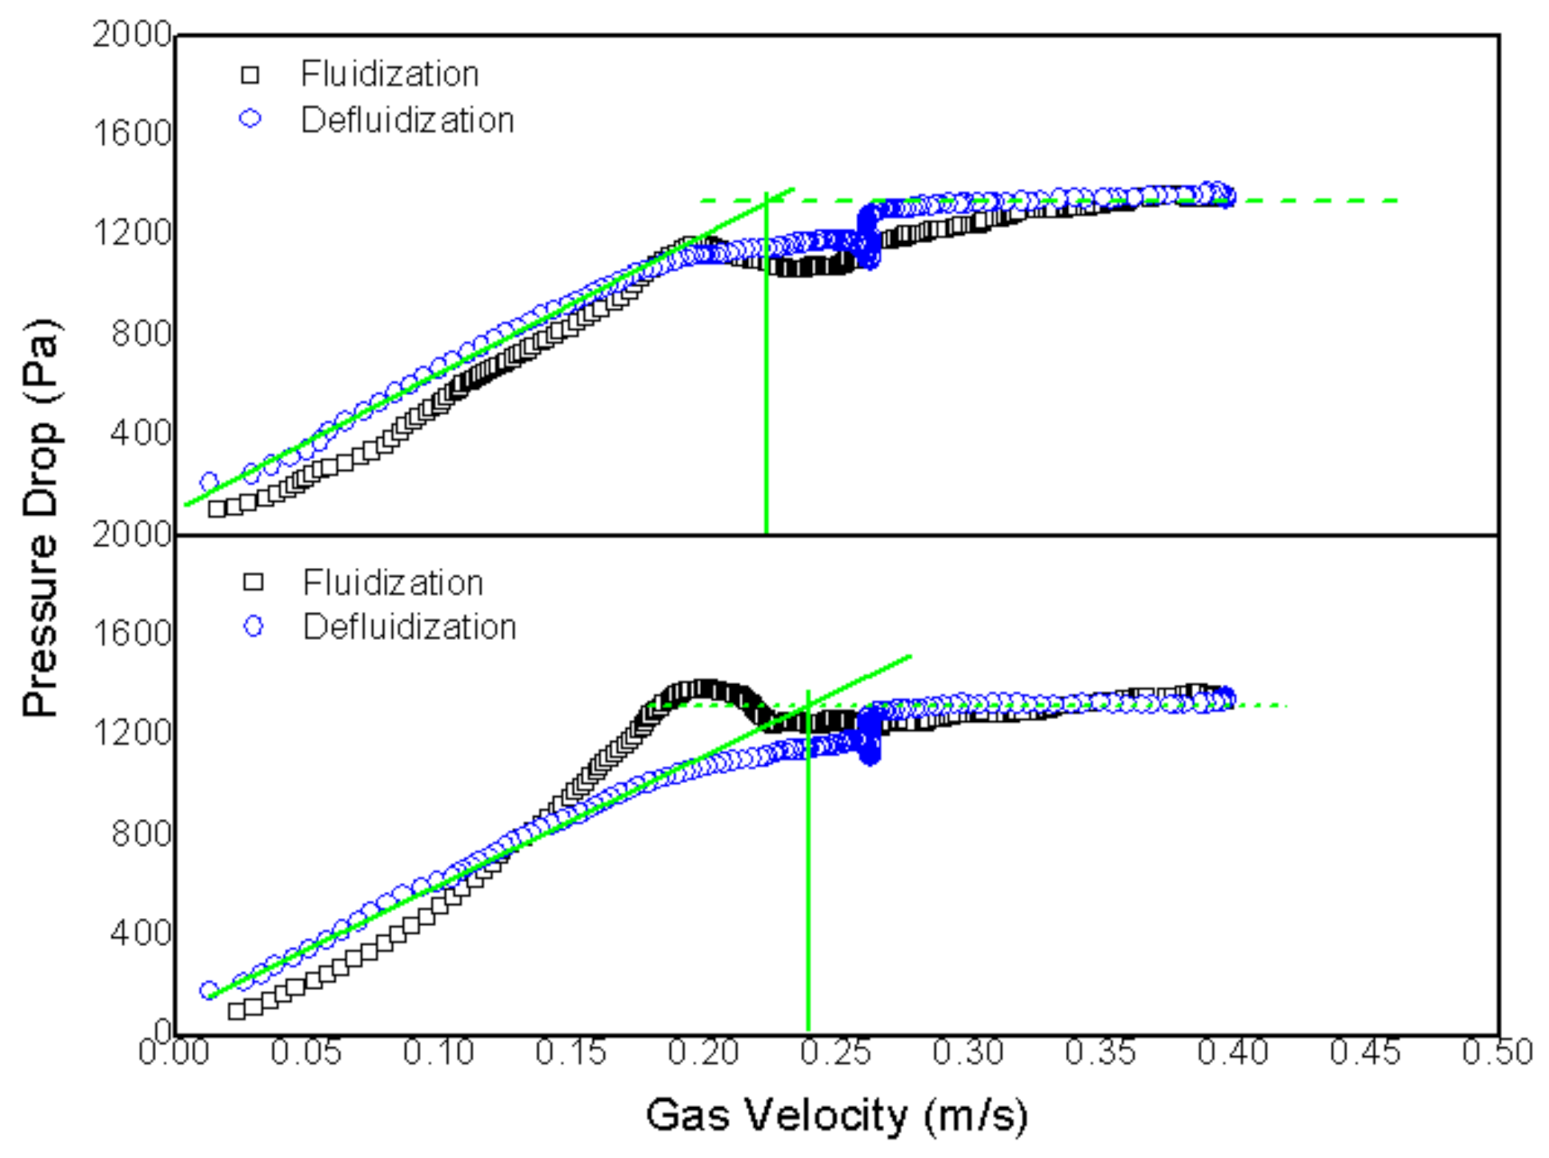
3.2. Influence of the Type of Distributor on Cold Fluidization

Tests were carried out to develop a bed pressure drop profile as a function of the bed fluidizing gas velocity. Thus, the minimum fluidization speed was obtained using a graphical method, as in other works such as Pécora et al. [26] and Lv et al. [24]. However, it is worth mentioning that although these works have defined Umf only through a fluidization process, there are works such as those performed by Rao and Bheemarasetti [27] and Qiaoqun et al. [13] who define this speed by performing a defluidization of particulate material. Each figure shows pressure drop profiles as a function of gas surface velocity and two fluidization and defluidization curves, thus representing the duplicate tests for each configuration of factors investigated.
Figure 3 and Figure 4 show the bed profiles obtained for the two types of gas distributor plates used herein. Their profiles were obtained from the pressure tap located downstream of the distributor plate, which means that the pressure drop of the plates is not taken into account. It is also worth emphasizing that particle size and biomass ratio were unchanged, but were kept in a range of 500–150 µm and rice husk mass ratio of 5 wt%.
Both profiles present a hysteretic behavior, as the pressure profile with increased gas velocity (fluidization) is different from that found for flow reduction (defluidization). Their profiles are similar, although a small pressure drop close to minimum fluidization velocity is perceived for the plates with Tuyere-type injectors.
This might be due to the binary characteristic of the mixture. Although the material had been mixed beforehand, i.e., before being placed onto the bed, there might still be some segregation. Therefore, the gas can have enough force to push and move the material in the bed at higher flows, thus balancing gravitational and drag forces.
As air velocity is reduced, the husks tend to become stationary and accumulate to the point where preferential channels are formed. At that point, air passes right through them, and the pressure drop in the bed is reduced, thus causing such a sudden pressure change.
Minimum fluidization velocity is indicated where the green lines intersect in Figure 3 and Figure 4. Average velocity was calculated for the perforated plate at Umf = 0.176 m/s and Umf = 0.233 m/s for the plate with Tuyere injectors. This indicates that the way the air is injected into the bed can change the velocity at which the material is fluidized, at least as far as rice husk is concerned.
However, studies aiming to estimate minimum fluidization velocity [28,29,30] usually disregard the distributor plate in their equations. Therefore, this factor must be more extensively studied and, if the estimates are accurate, they should be included in minimum fluidization velocity predictive equations.
Considering only these velocities obtained, it is possible to state that the perforated plate is more advantageous, since it fluidizes at a lower speed compared to that with Tuyere injectors, in addition to requiring a smaller amount of energy and prolonging bed lifespan, since lower speeds generate less wear.
In the case of bed expansion (δ), the two types of plate had very similar mean values, i.e., 1.20 for the perforated plate and 1.18 for the injector. These values reveal that the type of distributor plate does not affect the particulate material expansion in the bed.
Furthermore, mixing indexes were calculated, and a value of 93.4% (between 92.5% and 95.4%) was found for the perforated plate and 97.6% (between 96.3% and 98.9%) for the plate with Tuyeres. Both plates showed a high mixing index, although the Tuyeres plate achieved better results.
During the fluidization experiments, it was noticed that for the perforated plate, there were several stagnation points and preferential channels, as indicated by red squares in Figure 5. These regions grew until they became very large and broke off afterward; therefore, such a cycle was repeated consecutively. However, this effect was not observed in the plate with Tuyere injectors, which means that a parallel injection of air from the Tuyeres probably contributes to a better fluidization of rice husk, thus avoiding husk agglomerations.
Therefore, although the perforated plate has a lower minimum fluidization velocity, which reduces the required energy and material wear, the plate with injectors presented better mixing, thus eliminating stagnation points and reducing encrustation and possible downtimes while using fluidized bed reactors.

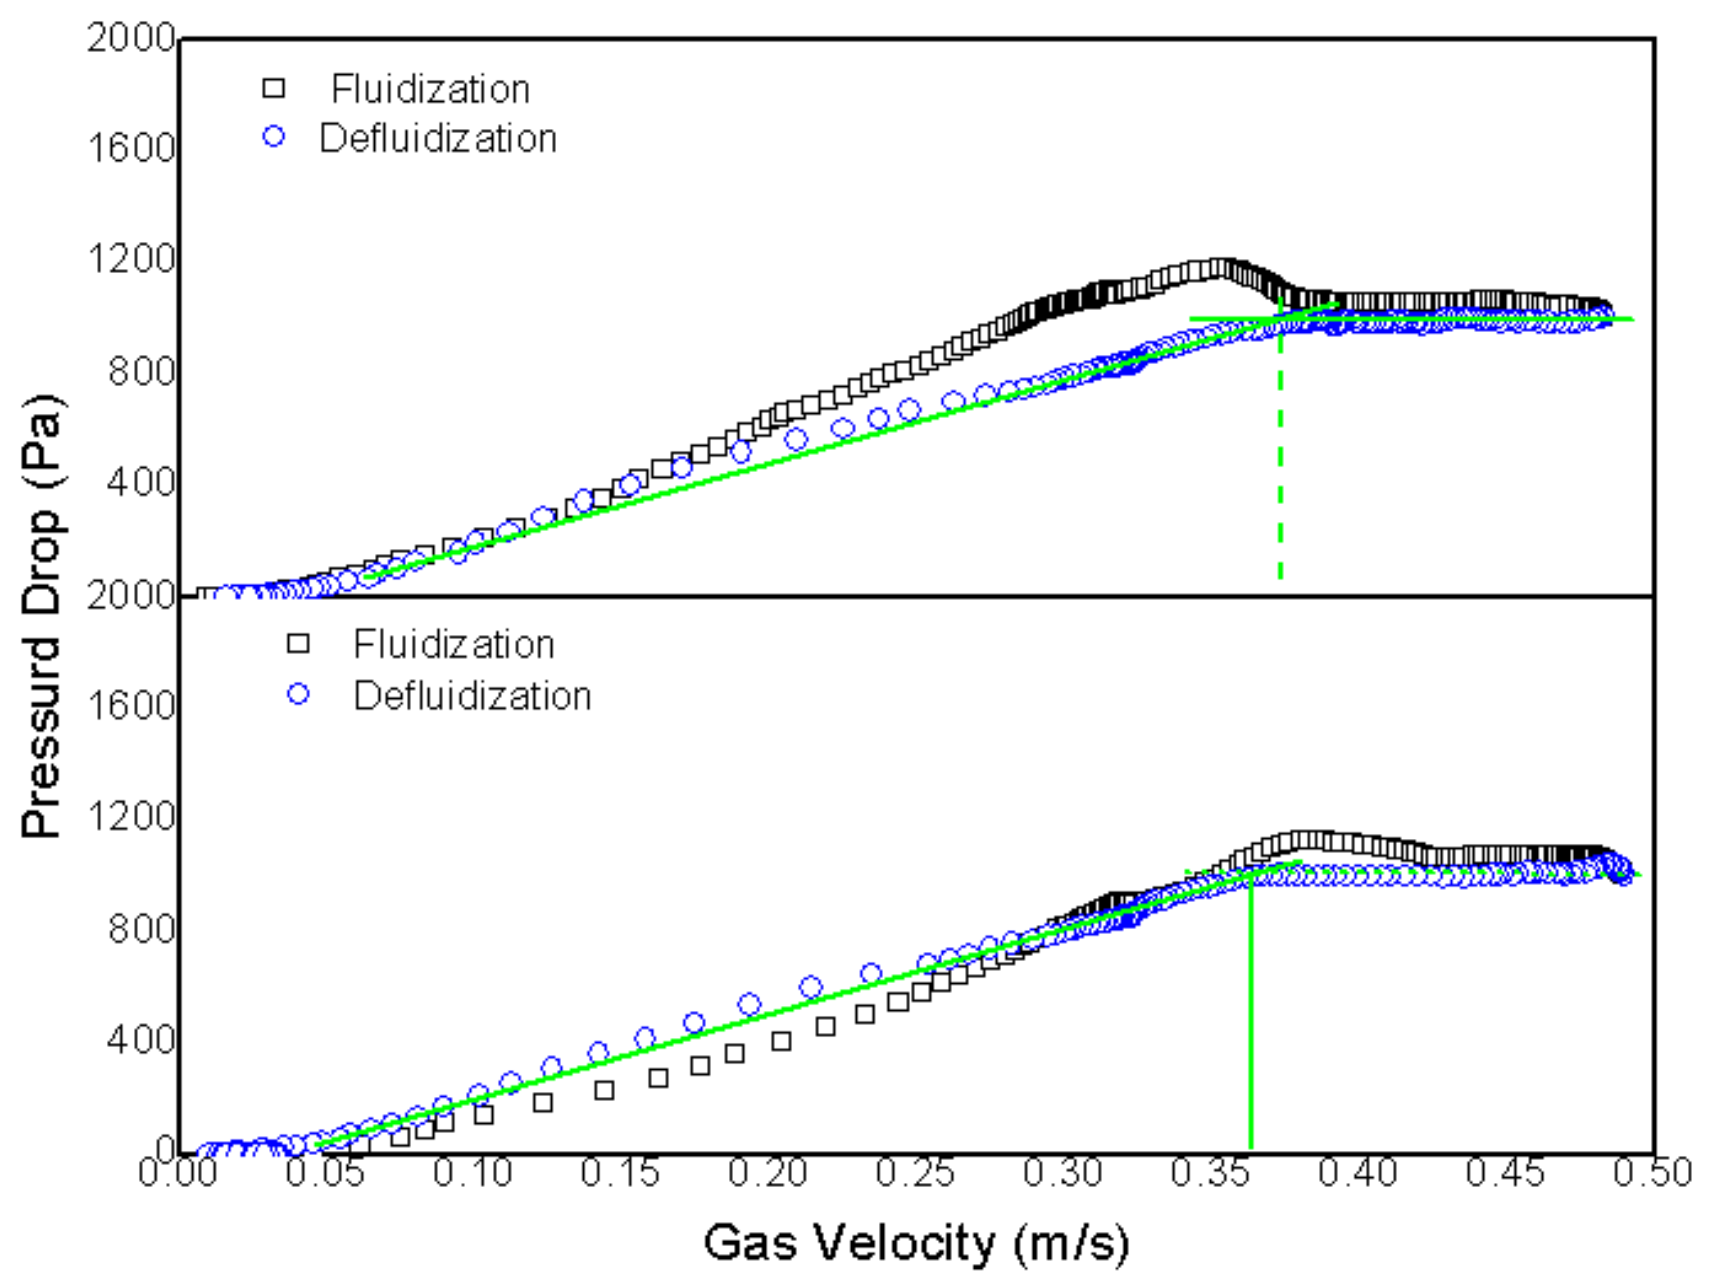
3.3. Influence of Sand Granulometry in Fluidization

Two particle sizes were tested, with mean diameters of 324 µm (500–150 µm) and 647 µm (850–500 µm). The pressure drop profile for the 647 µm is shown in Figure 6. The fluidization process at 324 µm is shown in Figure 3. In both cases, the distributor used a perforated plate with 5 wt% of rice husk.
It is worth mentioning that a pressure drop close to 1000 Pa was found for sand whose particle size was 647 µm, which is very similar to that of the 324 µm. However, the average minimum fluidization velocity was 0.363 m/s, i.e., nearly twice as much if compared to that obtained for the sand with a particle size of 324 µm (0.176 m/s). Such a result indicates a behavior resembling a proportional relationship between minimum fluidization velocity and average particle diameter, despite the fact that 5% of rice husk was added to the bed. A similar relationship between Umf and mean particle diameter was found by Rao and Bheemarasetti [27].
However, several preferential channels were created by setting the velocity to 1.2 Umf, and, after a few minutes, fluidization was stopped completely. As shown in Figure 7b, the formed preferential channels are indicated by red rectangles.
These results show that an increase in the particle size of sand, at least when mixed with rice husk, impairs fluidization and facilitates the formation of preferential channels, while smaller sand particles considerably reduce such an effect, thus leading to a better fluidization process.
Furthermore, these results indicate that increased granulometry in the fluidization of rice husks not only requires more energy from the compressor due to higher minimum fluidization velocity, but it might also impair fluidization through the formation of preferential channels, in addition to leading to a nearly complete stop.

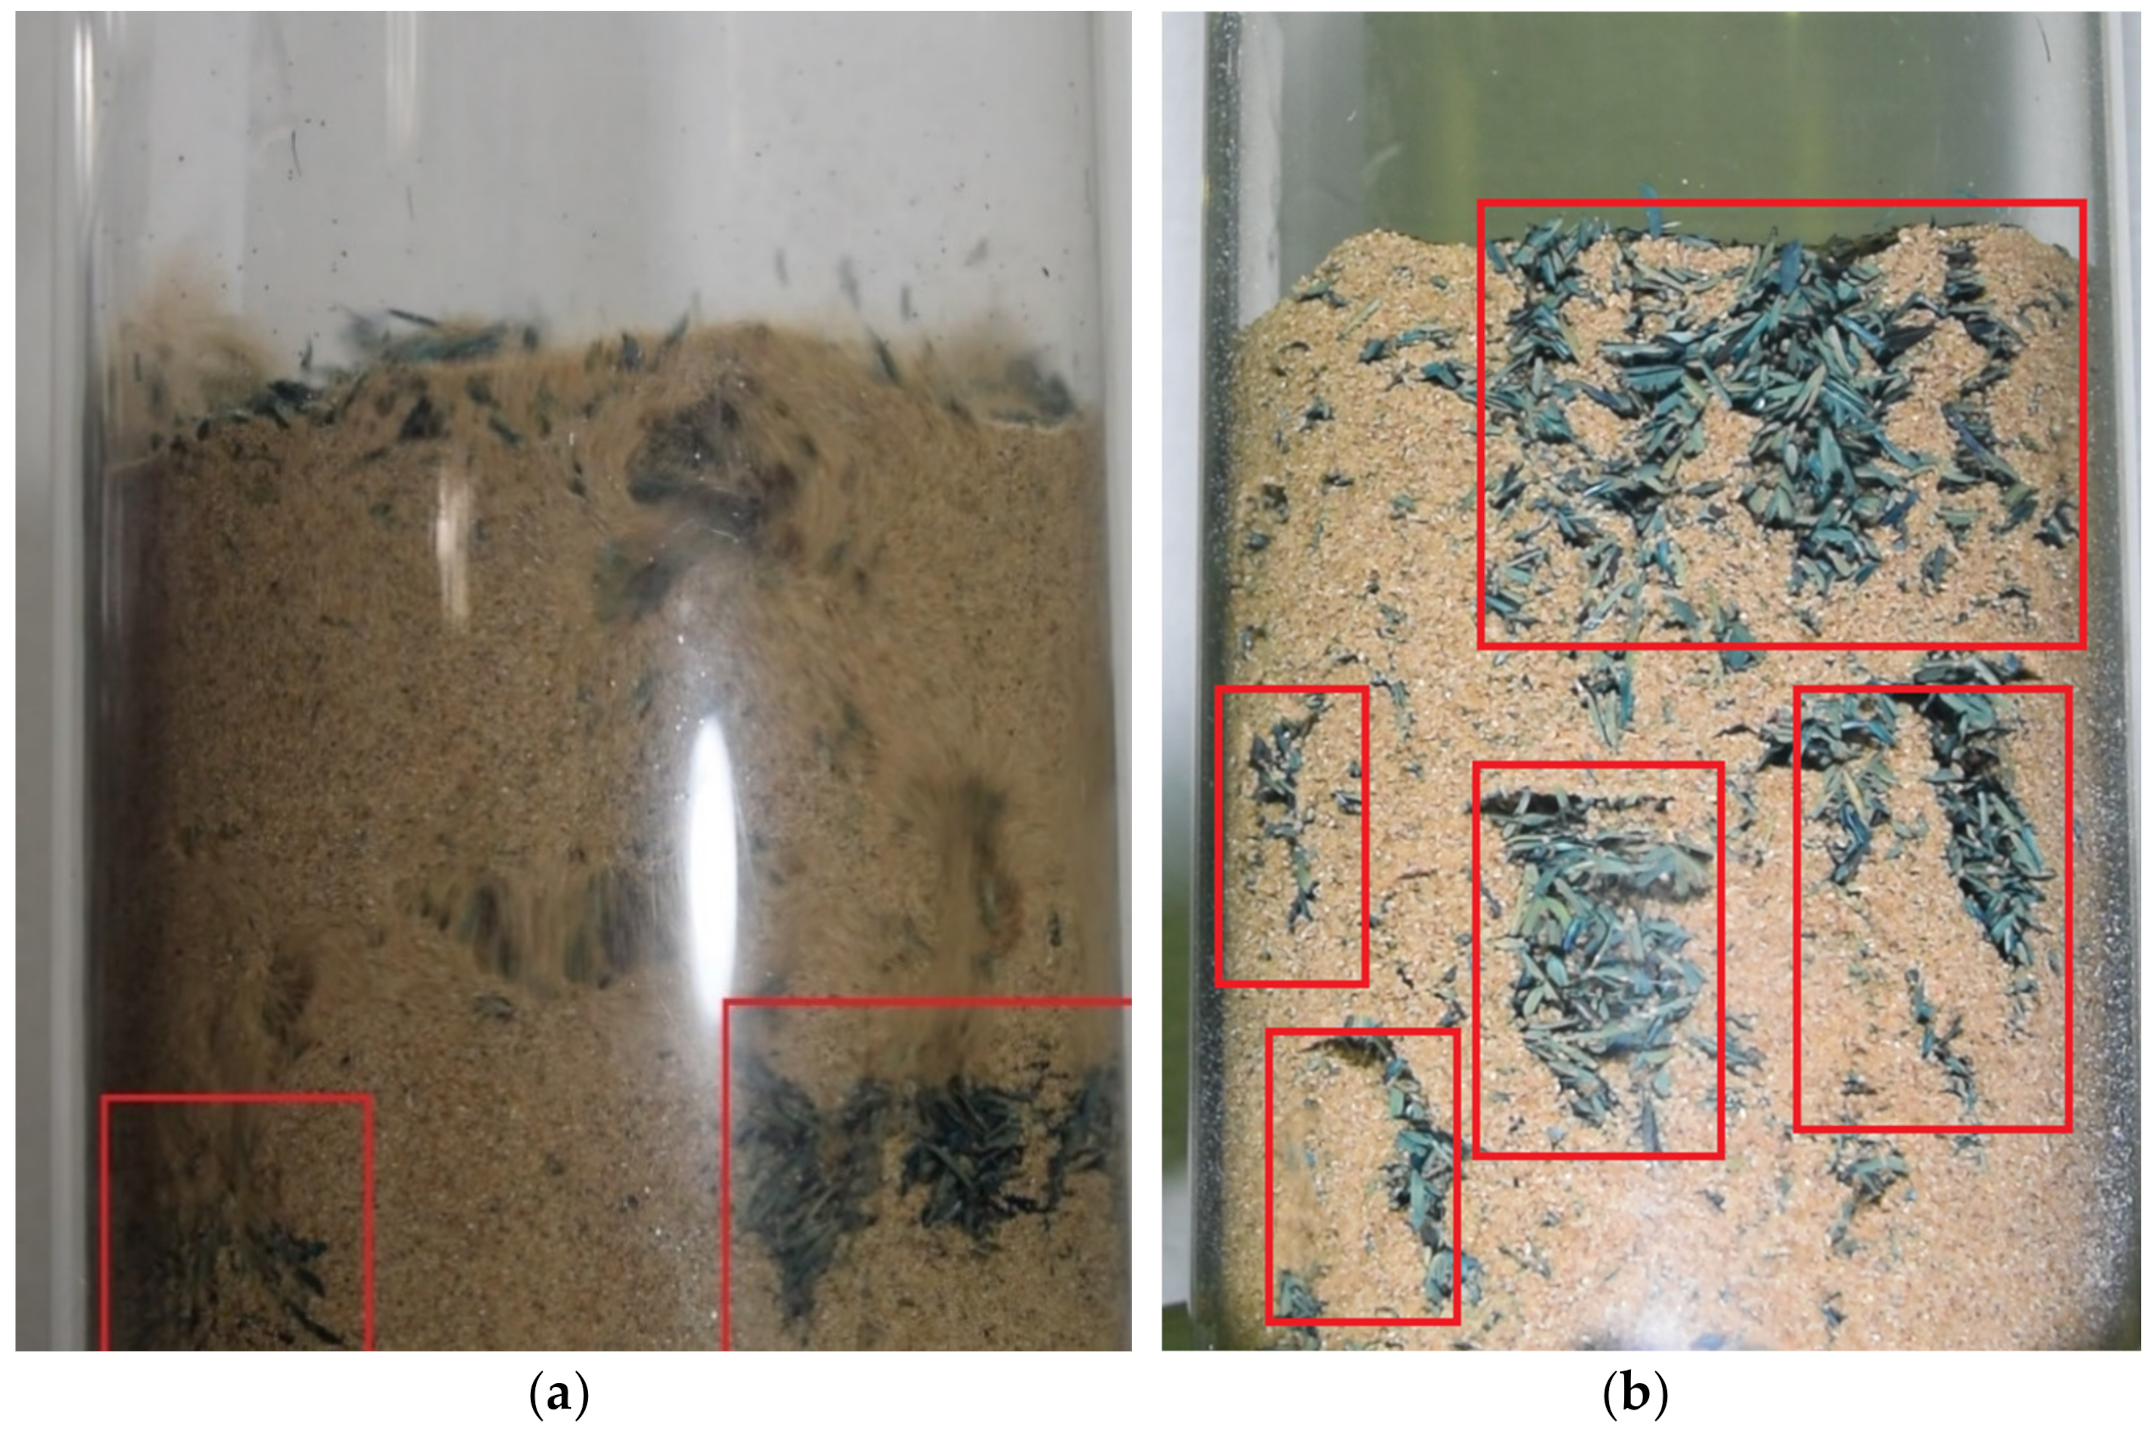
3.4. Influence of Rice Husk Mass Ratio in Fluidization

Air velocity pressure drop profiles were constructed so as to enable a determination of minimum fluidization velocity, as the mass proportions of rice husk start varying at 1% (40 g), i.e., starting from 1% to 10% (40 g to 400 g) of rice husk. The sand used in the experiments described in this section has mean diameters of 324 µm.
Since several obtained profiles present a similar behavior, only the lowest and highest values are presented in this section to illustrate the bed behavior as the rice husk ratio increases.
Figure 8a depicts the profile of a mixture with 1 wt% of rice husk. Fluidization occurs in a rather stable manner, given that it was quite simple to determine minimum fluidization velocity (Umf) with practically equal values. The profiles for both fluidization and defluidization had similar behavior between duplicates.
Figure 8b also reveals that rice husk (in green) is well distributed, without apparently accumulating along any region of the bed. This behavior remains throughout the fluidization process, even at higher velocities, as it turns into a slugging or turbulent regime. This is not the case when rice rusk ratios are close to 5 wt%, and it is possible to identify stagnation regions where the mixing level is not as good as in the rest of the bed, as aforementioned and shown in Figure 9.
In Figure 9a, it is possible to observe that, at 10 wt% of rice husk, the fluidization profile is even less regular, as there is a sudden pressure drop at around 0.32 m/s, which is similar to that observed at 6 wt% or so. During the fluidization process, there is an increase in gas velocity, and several preferential channels are formed before reaching a point at which these channels are “destroyed”, thus leading to a sudden pressure drop in the bed. Thenceforth, the opposite effect occurs for the defluidization curve.
At 10 wt%, fluidization quality dropped considerably, and there is great stagnation in much of the bed. The region in which there was greater movement of particulate matter was in the upper part of the bed, close to the freeboard region, as can be seen in Figure 9b.
Based on all the fluidization curves obtained, it was possible to establish a relationship between the rice husk ratio and minimum fluidization velocity, which is shown in Figure 10. Moreover, it is possible to evaluate that minimum fluidization velocity increases, as there is apparently exponential behavior. Equation (11) was written for this curve, where Umf is the minimum fluidization velocity in m/s, and Xc is the rice husk ratio in wt%.
U m f = 0.05609 e X c 4.36233 + 0.03127
Qiaoqun et al. [13] found a greater relationship between the rice husk ratio and minimum fluidization velocity, which is similar to what has been found herein. However, the relationship found by Qiaoqun et al. [13] presents apparently linear behavior, while that found herein is closer to an exponential behavior, as observed in Figure 10.
In such a case, this difference might be due to the small number of rice husk ratios tested by Qiaoqun et al. [13], who evaluated only three different values for the two sand particle sizes selected. This might have concealed the exponential behavior of rice husk ratio changes.
Considering all the minimum fluidization tests, it was decided to measure the level of mixing and bed expansion at ratios of 1% and 5%, respectively. These values were selected given that it would be a very small amount of husk capable of being assessed by sampling below 1%, but fluidization quality drops considerably above 5%, with several stagnation points and difficulty in defining minimal fluidization velocity more precisely.
The calculated mixing level for 1% husk was 98.9% (between 98.7% and 99.1%) and bed expansion of 1.055. At 5%, the mixing level was reduced to 93.4%, and expansion increased to 1.205. This indicates that a lower proportion of rice husk would generate a more homogeneous mixture on the bed, which would, in turn, reduce its expansion. The formation of preferential channels indicates a possible bed segregation.
Therefore, based on all the data obtained, it was found that higher rice husk ratios in fluidized beds lead to an increase in minimum fluidization velocity and bed expansion. This results in a more costly system, having higher energy requirements for radial compressors in addition to the requirement of a better fluidization system able to withstand such expansion. Moreover, there is greater segregation and a larger number of preferential channels with greater amounts of husk, thus resulting in a less homogeneous thermal profile and lower efficiency.
Values above 5 wt% for raw rice husk on a bed are not recommended under the conditions considered above due to low fluidization quality. Optimal values quite possibly range between 1 wt% and 5 wt%. However, an economic analysis would be necessary, given the high price of thermal energy that the bed would produce, as well as its efficiency, not to mention the further energy required to fluidize a greater ratio of rice husks.

3.5. Comparison of Results Achieved in Cold Fluidization

All the results reached through the cold fluidization of rice husk are shown in Table 3. The setup with the highest mixing index was found for the perforated plate, with 324 µm sand and 1% rice husk at 98.6%, which reduces possible problems of incrustation and downtime in fluidization systems. This greater homogeneity also increases the thermal efficiency of the bed.
Tuyere injector distributors have higher mixing levels than perforated distributors under the same conditions (97.6% and 93.4%, respectively). Based on the data in Table 3, a Tuyere injector distributor is capable of having five times more rice husk wt% than perforated distributors, as almost no efficiency drop is observed in the mixture of particles. Therefore, the distributor plate with Tuyere injectors would not only have the same benefits of optimal configuration for the perforated plate (1 wt% and 324 µm), but it would also allow the use of a greater amount of rice husk in the bed. Greater ratios of rice husk would lead to greater output.
In addition, it is possible to observe that larger particle sizes, as well as increased ratios of rice husks, compromise fluidization, leading to preferential channels, increased pressure drop or even system failure.
Considering all three variables studied, the one that affects fluidization quality and mixing index the most is the rice husk ratio, given that the mixing level was reduced from 98.6% to 93.4% as the rice husk ratio increased from 1% to 5%. For 10% rice husk, fluidization was considerably reduced, with several preferential channels and stagnation points.

4. Conclusions

This work reported a cold fluidization system assembled to evaluate the influence of three factors (type of bed distributor, sand granulometry and rice husk mass ratio) on the fluidization behavior (mixing index, bed expansion and minimum fluidization velocity), of a mixture of rice husk and sand in the bed. As distributors, a perforated plate and a plate with Tuyere injectors were used. In the case of sand, mean diameters of 324 µm (500–150 µm) and 647 µm (850–500 µm) were tested, while the rice husk ratio values ranged from 1% to 10% in the analysis of 10 different ratios.
The obtained results reveal that the perforated distributor plate has a lower minimum fluidization velocity (Umf = 0.176 m/s) than the plate with Tuyere injectors (Umf = 0.233 m/s), as less energy is required and less wear is caused in the system on the long run. However, the plate with Tuyere injectors generated a higher mixing level of 97.6% compared to 93.4% for the perforated plate, thus eliminating possible stagnation points and increasing the system’s thermal efficiency, in addition to reducing incrustation problems. Regarding bed expansion, the values were similar, i.e., 1.18 and 1.21 for the perforated plate and plate with injectors, respectively.
It was also observed that an increase in the mean diameter of sand at low rice husk ratios (less than or equal to 5%) increased minimum fluidization velocity in a relatively linear behavior. Almost doubling the mean diameter from 324 µm to 647 µm resulted in increased and similar ratios in minimum fluidization velocity from Umf = 0.176 m/s to Umf = 0.363 m/s. An increase in granulometry also considerably hindered the fluidization of rice husk, as several preferential paths and bed stoppages were generated, which made it impossible to determine bed expansion and mixing level.
An increase in the ratio of rice husks also negatively affected fluidization, especially considering values above 5% and the generation of several preferential paths and bed stoppages. Minimum fluidization velocities were measured for all 10 ratios, a possible exponential relationship was found between them, and a resulting equation was deduced. Considering 1% of rice husk, the mixing level was 98.6% with 1.06 expansion, while the mixing level was 93.4% and expansion was 1.21 at 5%.
Considering the results achieved in the fluidization experiments, it is worth mentioning that they might be different for other types of distributors. These results might also change when altering the scale of the fluidized bed. Therefore, there should be further experiments to test both variables, in addition to evaluating their influence on the bed mixture and minimum fluidization velocity, which are essential to achieve an efficient system.

Author Contributions

Conceptualization, F.M.P.B., C.M.R.L. and I.Á.; Methodology, F.M.P.B., C.M.R.L. and I.Á.; Software, F.M.P.B.; Validation, F.M.P.B.; Formal analysis, F.M.P.B.; Investigation, F.M.P.B., C.M.R.L. and I.Á.; Resources, I.Á.; Data curation, F.M.P.B.; Writing—original draft, F.M.P.B.; Writing—review & editing, F.M.P.B., C.M.R.L. and I.Á.; Visualization, F.M.P.B. and C.M.R.L.; Supervision, C.M.R.L. and I.Á.; Project administration, C.M.R.L. and I.Á.; Funding acquisition, I.Á. All authors have read and agreed to the published version of the manuscript.

Funding

The authors are grateful to the Coordenação de Aperfeiçoamento de Pessoal de Nível Superior—Brasil (CAPES) for the granted scholarship. The study was financed in part by CAPES—Finance Code 001 and by the National Council for Scientific and Technological Development (CNPq—process n° 315630/2021-3 and process n° 406810/2022-2).

Data Availability Statement

The data is not available online.

Conflicts of Interest

The authors declare no conflict of interest.

References

  1. IEA. World Energy Outlook 2018; IEA: Paris, France, 2018. [Google Scholar]
  2. Chen, W.H.; Peng, J.; Bi, X.T. A State-of-the-Art Review of Biomass Torrefaction, Densification and Applications. Renew. Sustain. Energy Rev. 2015, 44, 847–866. [Google Scholar] [CrossRef]
  3. Dhillon, R.S.; von Wuehlisch, G. Mitigation of Global Warming through Renewable Biomass. Biomass Bioenergy 2013, 48, 75–89. [Google Scholar] [CrossRef]
  4. Krapivin, V.F.; Varotsos, C.A.; Soldatov, V.Y. Simulation Results from a Coupled Model of Carbon Dioxide and Methane Global Cycles. Ecol. Modell. 2017, 359, 69–79. [Google Scholar] [CrossRef]
  5. Yvon-Durocher, G.; Allen, A.P.; Bastviken, D.; Conrad, R.; Gudasz, C.; St-Pierre, A.; Thanh-Duc, N.; del Giorgio, P.A. Methane Fluxes Show Consistent Temperature Dependence across Microbial to Ecosystem Scales. Nature 2014, 507, 488–491. [Google Scholar] [CrossRef] [PubMed]
  6. Steven, S.; Restiawaty, E.; Bindar, Y. Routes for Energy and Bio-Silica Production from Rice Husk: A Comprehensive Review and Emerging Prospect. Renew. Sustain. Energy Rev. 2021, 149, 111329. [Google Scholar] [CrossRef]
  7. Yang, Z.; Zhu, Y.; Zhang, J.; Li, X.; Ma, P.; Sun, J.; Sun, Y.; Ma, J.; Li, N. Comparison of Energy Use between Fully Mechanized and Semi-Mechanized Rice Production in Southwest China. Energy 2022, 245, 123270. [Google Scholar] [CrossRef]
  8. Silva, J.B. Hidrodinâmica da Fluidização de Biomassa e Inertes em Leito Fluidizado; Universidade Federal do Paraná: Curitiba, Brazil, 2011. [Google Scholar]
  9. Park, H.C.; Choi, H.S. The Segregation Characteristics of Char in a Fluidized Bed with Varying Column Shapes. Powder Technol. 2013, 246, 561–571. [Google Scholar] [CrossRef]
  10. Kunii, D.; Levenspiel, O. Fluidization Engineering, 2nd ed.; Brenner, H., Ed.; Elsevier: Philadelphia, PA, USA, 1991; ISBN 9780080506647. [Google Scholar]
  11. Yates, J.G.; Lettieri, P. Fluidized-Bed Reactors: Processes and Operating Conditions; Particle Technology Series; Springer International Publishing: Cham, Switzerland, 2016; Volume 26, ISBN 978-3-319-39591-3. [Google Scholar]
  12. Geldart, D. Types of Fluidisation. Powder Technol. 1973, 7, 285–292. [Google Scholar] [CrossRef]
  13. Qiaoqun, S.; Huilin, L.; Wentie, L.; Yurong, H.; Lidan, Y.; Gidaspow, D. Simulation and Experiment of Segregating/Mixing of Rice Husk–Sand Mixture in a Bubbling Fluidized Bed. Fuel 2005, 84, 1739–1748. [Google Scholar] [CrossRef]
  14. Yang, X.; Ma, Z.; Liang, Z.; Chen, H.; Wang, J. Hydrodynamic Characteristics in a Cold Model of the Dual Fluidized Bed with Mixed Particles. Powder Technol. 2019, 351, 291–304. [Google Scholar] [CrossRef]
  15. Kaewklum, R.; Kuprianov, V.I. Experimental Studies on a Novel Swirling Fluidized-Bed Combustor Using an Annular Spiral Air Distributor. Fuel 2010, 89, 43–52. [Google Scholar] [CrossRef]
  16. Shukrie, A.; Anuar, S.; Oumer, A.N. Air Distributor Designs for Fluidized Bed Combustors: A Review. Eng. Technol. Fluid. Sci. Res. 2016, 6, 1029–1034. [Google Scholar] [CrossRef]
  17. Lundberg, L.; Soria-verdugo, A.; Pallarès, D.; Johansson, R.; Thunman, H. The Role of Fuel Mixing on Char Conversion in a Fluidized Bed. Powder Technol. 2017, 316, 677–686. [Google Scholar] [CrossRef]
  18. Brink, H.G.; Saayman, J.; Nicol, W. Two Dimensional Fluidised Bed Reactor: Performance of a Novel Multi-Vortex Distributor. Chem. Eng. J. 2011, 175, 484–493. [Google Scholar] [CrossRef]
  19. Chokphoemphun, S.; Chokphoemphun, S. Moisture Content Prediction of Paddy Drying in a Fluidized-Bed Drier with a Vortex Flow Generator Using an Artificial Neural Network. Appl. Therm. Eng. 2018, 145, 630–636. [Google Scholar] [CrossRef]
  20. Kuprianov, V.I.; Kaewklum, R.; Sirisomboon, K.; Arromdee, P.; Chakritthakul, S. Combustion and Emission Characteristics of a Swirling Fluidized-Bed Combustor Burning Moisturized Rice Husk. Appl. Energy 2010, 87, 2899–2906. [Google Scholar] [CrossRef]
  21. Wormsbecker, M.; Pugsley, T.S.; Tanfara, H. The Influence of Distributor Design on Fluidized Bed Dryer Hydrodynamics. In Proceedings of the 12th International Conference on Fluidization—New Horizons in Fluidization Engineering, Vancouver, BC, Canada, 13–17 May 2007. [Google Scholar]
  22. Werther, J. D. Geldart (Ed.): Gas Fluidization Technology, John Wiley & Sons. Chichester, New York, Brisbane, Toronto, Singapore 1986. 468 Seiten, Preis: £ 42.50. Berichte Der Bunsenges. Für Phys. Chem. 1987, 91, 678–679. [Google Scholar] [CrossRef]
  23. Wel, P. Van Der Powder Mixing. Powder Handle Process. 1999, 11, 83–86. [Google Scholar]
  24. Lv, B.; Luo, Z.; Zhang, B.; Qin, X. Particle Mixing and Separation Performance of Gas-Solid Separation Fluidized Beds Containing Binary Mixtures. Fuel 2018, 226, 462–471. [Google Scholar] [CrossRef]
  25. Abdullah, M.Z.; Husain, Z.; Yin Pong, S.L. Analysis of Cold Flow Fluidization Test Results for Various Biomass Fuels. Biomass Bioenergy 2003, 24, 487–494. [Google Scholar] [CrossRef]
  26. Pécora, A.A.B.; Ávila, I.; Lira, C.S.; Cruz, G.; Crnkovic, P.M. Prediction of the Combustion Process in Fluidized Bed Based on Physical–Chemical Properties of Biomass Particles and Their Hydrodynamic Behaviors. Fuel Process. Technol. 2014, 124, 188–197. [Google Scholar] [CrossRef]
  27. Rao, T.R.; Bheemarasetti, J.V.R. Minimum Fluidization Velocities of Mixtures of Biomass and Sands. Energy 2001, 26, 633–644. [Google Scholar] [CrossRef]
  28. Agu, C.E.; Pfeifer, C.; Moldestad, B.M.E. Prediction of Void Fraction and Minimum Fluidization Velocity of a Binary Mixture of Particles: Bed Material and Fuel Particles. Powder Technol. 2019, 349, 99–107. [Google Scholar] [CrossRef]
  29. Pérez, N.P.; Pedroso, D.T.; Machin, E.B.; Antunes, J.S.; Verdú Ramos, R.A.; Silveira, J.L. Prediction of the Minimum Fluidization Velocity of Particles of Sugarcane Bagasse. Biomass Bioenergy 2018, 109, 249–256. [Google Scholar] [CrossRef]
  30. Rasteh, M.; Farhadi, F.; Ahmadi, G. Empirical Models for Minimum Fluidization Velocity of Particles with Different Size Distribution in Tapered Fluidized Beds. Powder Technol. 2018, 338, 563–575. [Google Scholar] [CrossRef]
Figure 1. Experimental Setup for cold fluidization experiments.
Energies 16 07574 g001
Figure 2. Mean diameter distribution for (a) coarse sand and (b) fine sand particles.
Energies 16 07574 g002
Figure 3. Determination of minimum fluidization velocity for a mixture of 5 wt% rice husk and sand using a perforated plate as distributor and sand mean diameter of 324 µm.
Energies 16 07574 g003
Figure 4. Determination of minimum fluidization velocity of a mixture of 5 wt% rice husk and sand with Tuyere injector plates as distributors and sand mean diameter of 324 µm.
Energies 16 07574 g004
Figure 5. Fluidization of a mixture of 5 wt% rice husk (green) and sand (324 µm) with (a) perforated distributor and (b) Tuyere injector distributor. Stagnation regions highlighted by the red boxes.
Energies 16 07574 g005
Figure 6. Determination of minimum fluidization velocity for a mixture of 5 wt% rice husk and sand with a perforated plate as distributor and sand mean diameter of 647 µm.
Energies 16 07574 g006
Figure 7. Fluidization of a mixture of 5 wt% rice husk (green) and sand with a perforated plate as distributor for 2 different mean diameters of sand: (a) 324 µm and (b) 647 µm. Stagnation regions highlighted by the red boxes.
Energies 16 07574 g007
Figure 8. Mixture of 1 wt% rice husk and sand (324 µm) with a perforated plate: (a) minimum fluidization velocity determination; (b) fluidization of the mixture of rice husk (green) and sand.
Energies 16 07574 g008
Figure 9. Mixture of 10 wt% rice husk and sand (324 µm) with a perforated plate: (a) minimum fluidization velocity determination; (b) fluidization of the mixture of rice husk (green) and sand.
Energies 16 07574 g009
Figure 10. Rice husk wt% x minimum fluidization velocity. The blue line represents the exponential behavior described by Equation (11).
Energies 16 07574 g010
Table 1. Properties of particles.
ParametersRice Husk
(in Natura)
Sand
500–150 µm
Sand
850–500 µm
Mean particle diameter (µm)1500325675
Particle density (kg/m3)50025522789
Bulk density (kg/m3)10614171238
Voidage0.7880.4450.556
Particle classificationGrupo DGrupo BGrupo B
Roundness0.2351NANA
Table 2. Composition of rice husks and sands.
Mass PercentageRaw Rice Rusk Colored Rice Husk Sand Type 1Sand Type 2
Nitrogen4.1032722793.5040651960.1128477980.211314867
Carbon39.6438102739.666384380.2502196680.251203055
Hydrogen3.4563494523.44799701400
Sulfur0000
Table 3. Results of cold fluidization experiments.
Type of DistributorGranulometry of the Sand (µm)Rice Husk Proportion (%)Minimum Fluidization Velocity (m/s)Bed ExpansionMixture Level
Tuyere32450.2331.1897.6
Perforated64750.363--
Perforated32410.1151.0698.6
Perforated32420.120--
Perforated32430.140--
Perforated32440.165--
Perforated32450.1761.2193.4
Perforated32460.274--
Perforated32470.305--
Perforated32480.413--
Perforated32490.455--
Perforated324100.425--
Disclaimer/Publisher’s Note: The statements, opinions and data contained in all publications are solely those of the individual author(s) and contributor(s) and not of MDPI and/or the editor(s). MDPI and/or the editor(s) disclaim responsibility for any injury to people or property resulting from any ideas, methods, instructions or products referred to in the content.

