Article

Hydrate Formation from Joule Thomson Expansion Using a Single Pass Flowloop

Fluid Science and Resources Division, Department of Chemical Engineering, The University of Western Australia, 35 Stirling Hwy, Crawley, WA 6009, Australia
*
Author to whom correspondence should be addressed.
Energies 2023, 16(22), 7594; https://doi.org/10.3390/en16227594
Submission received: 19 October 2023 / Revised: 6 November 2023 / Accepted: 9 November 2023 / Published: 15 November 2023

Abstract

:
Hydrate risk management is critically important for an energy industry that continues to see increasing demand. Hydrate formation in production lines is a potential threat under low temperature and high-pressure conditions where water and light gas molecules are present. Here, we introduce a 1-inch OD single-pass flow loop and demonstrate the Joule-Thomson (JT) expansion of a methane-ethane mixture. Initially, dry gas flowed through the apparatus at a variable pressure-differential. Larger pressure differentials resulted in more cooling, as predicted by standard thermodynamic models. A systematic deviation noted at higher pressure differentials was partially rectified through corrections incorporating heat transfer, thermal mass and kinetic energy effects. A wet gas system was then investigated with varying degrees of water injection. At the lowest rate, hydrate plugging occurred close to the expansion point and faster than for higher injection rates. This immediate and severe hydrate plugging has important implications for the design of safety relief systems in particular. Furthermore, this rate of plugging could not be predicted by existing software tools, suggesting that the atomization of liquids over an expansion valve is a critical missing component that must be incorporated for accurate predictions of hydrate plug formation severity.

1. Introduction

Understanding hydrate plugging risks in long subsea tiebacks is a critical requirement for the global energy industry going forward. Gas hydrates are ice-like solids that represent a potential hazard for any high-pressure, low-temperature system that operates with both water and light gas molecules (methane, ethane, propane, butane, CO2) present [1,2,3,4]. Their propensity to form blockages in pipelines has traditionally led to the use of expensive glycol (anti-freeze) based injection systems to prevent formation by means of thermodynamic inhibition [5,6,7]. Such systems are expensive to build and run, with the further effect of significantly increasing the CO2 emissions footprint of production systems. These challenges have led to increasing research aimed at understanding whether complete prevention is necessary, or whether intelligent management solutions may be possible [8,9,10,11]. In this new paradigm, risk is quantified, requiring an understanding of both the likelihood [12,13,14,15,16] and the magnitude of any potential problem [17,18]. For this to be successful, our knowledge of hydrate formation has begun to move beyond a binary question of whether it is possible, and towards an understanding of consequences.
When a fluid system undergoes choked flow, such as through expansion and/or throttling valves or nozzles, the system can be cooled or warmed rapidly. This phenomenon is called the Joule-Thomson (JT) effect, occurring at constant enthalpy [19,20,21]. The degree of the temperature change is dependent on the fluid species and p-T conditions [22,23,24]. For example, hydrocarbon, carbon dioxide and nitrogen gases cool upon the expansion [25,26,27], whereas hydrogen, helium, neon, and liquids warm when expanded [28,29,30]. In industrial applications, the cooling effect in subsea production lines may drive systems into the hydrate equilibrium region, where the application of thermodynamic inhibitors (THIs) and/or surface-active chemicals to such systems has been studied to mitigate solids blockage issues [31,32,33,34]. Also, depressurization in hydrate-bearing sediment was investigated, focusing on the Joule-Thomson effect occurring in gas production from natural gas hydrate reserves [35,36,37]. In the context of modern decarbonization efforts, the formation of hydrate and/or ice over expansion valves poses a hazard for carbon sequestration applications where, for instance, low temperatures may result in problems with gas injectivity into the pore space [38,39,40].
To explore this phenomenon further, a new 1″ OD (outer diameter) flowloop system with an expansion valve in the center of the test section has been constructed. The new system has precise control of upstream conditions and downstream pressure, enabling the study of pressure drops over the valve in excess of 100 bar. Furthermore, this allows us to investigate gas expansion behavior in isolation from other complicating factors. In this work, we aim to probe hydrate behavior in terms of (i) the rapidity of formation/blockage and (ii) the deposition and/or movement of solids deposits. Understanding these factors is critical to developing predictive capabilities which may be used to engage in risk management, rather than avoidance. The experiments reported here were conducted using a gas mixture of methane and ethane, both with and without water, as shown in Table 1 in the results section.
The dry gas experiments served as a baseline and enabled a study of JT expansion effects in the absence of solids formation. Further, dry experiments enable the calibration of flow models of the test system. Wet gas experiments with this mixture typically form hydrate and thus constitute the core objectives of this study by providing information on the rate and severity of hydrate blockage formation. By combining the data sets, it will be possible to evaluate the ability of current models to predict hydrate plugging during gas expansion, identifying gaps that must be closed for the deployment of advanced hydrate management techniques.

2. Materials and Methods

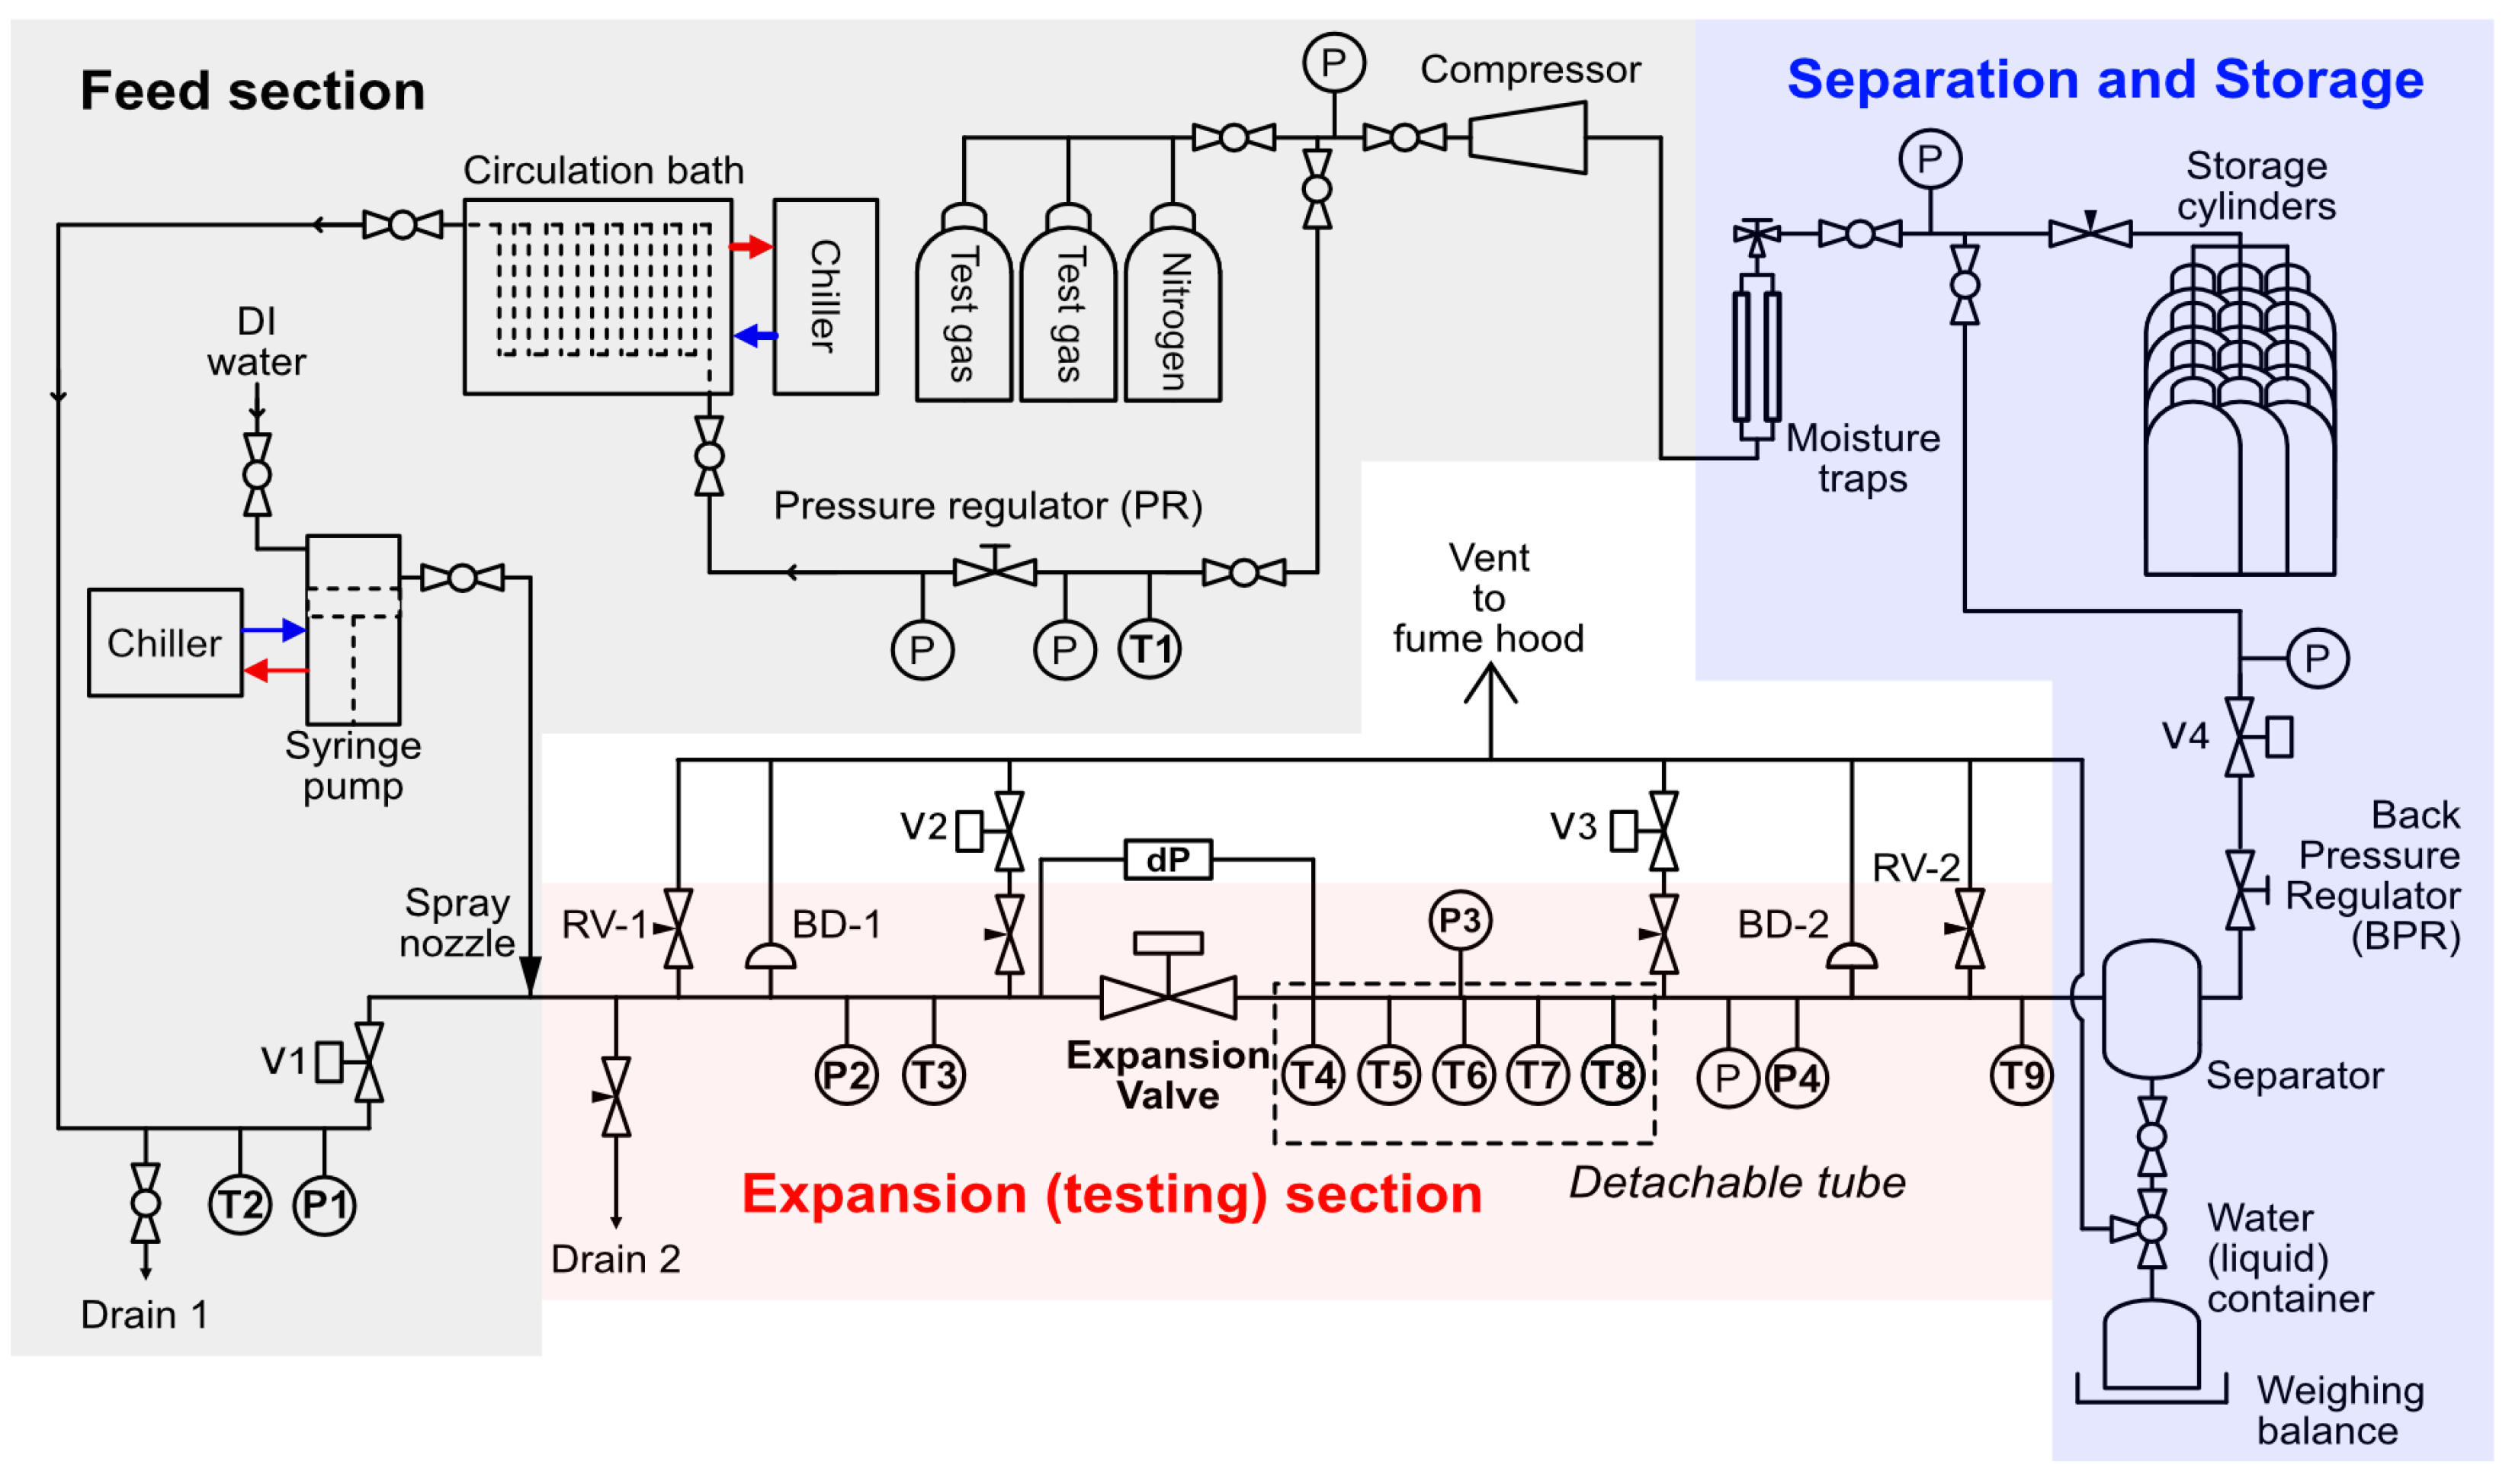
2.1. Joule Thomson Expansion Loop

A schematic of the Joule Thomson (JT) Expansion Loop Facility at The University of Western Australia is shown in Figure 1. The test section consists of a 3 m long, 1″ OD stainless steel (SS316) test section with an electro-pneumatic actuated valve (60° V-port angle, FlowTek) at its center. In this work, the cross-sectional area ratio of (orifice/pipe) is estimated to be 1.4 × 10⁻³ when the JT valve is open. The system is pressure-driven, where both the upstream feed and downstream storage sections may be set to maintain specific setpoint pressures across the actuated valve.
The system is fed by a reservoir of gas cylinders, typically two containing the test gas and one containing a purging gas (nitrogen), each in G-size (60 L) bottles with a pressure rating of up to 200 bar. This source is regulated (PRH04-05T, Straval Valves) to a desired upstream set pressure, then passed through a 35 m water-submerged tube heat exchanger cooled to a desired set point by a chiller (Unichiller 020T-H, Huber). This enables both the pressure and temperature of the upstream section to be set independently where the upstream pressure is typically regulated to a set point between 50 and 200 bar, with a temperature between 5 and 20 °C.
At the entrance to the upstream test section, an atomizer (1/4LNND-SS10, Spraying Systems) and a 500 mL syringe pump (500 D, Teledyne ISCO) enable water injection at a rate of up to 200 mL/min, which is sprayed in droplets of 10–100 µm diameter. The upstream section is instrumented with a single pressure (PX409-2.5KG5V, Omega) and temperature (NR-141-100S-1-1.6, Netsushin) sensor located 5 cm from the JT valve. The downstream section contains a 1 m detachable section instrumented with five high-precision resistance temperature detectors (RTDs, NR-141-100S-1-1.6, Netsushin), the first of which is 10 cm from the JT valve, with the remainder every 20 cm thereafter. This section contains two pressure transducers, which enable pressure-based localization of potential blockages.
The outlet of the test section contains a custom-built 550 mL separator to remove liquids; the remaining gas then passes through a back pressure regulator (58000HP, Jordan Valve) which is the second half of the pressure-driven control systems. Finally, the exhaust gas is stored in 12 G-size cylinders connected in parallel, providing a low-pressure reservoir. These gases may be recompressed in a batch mode to refill the inlet source bottles using a high-pressure natural gas compressor (CNG EVO 5, Coltri). The entire Joule Thomson Expansion Loop is controlled digitally, with all data recorded automatically using an integrated LabView [41] (National Instruments) system.

2.2. Experimental Methods

A single run of the loop consists of pressure-driven emptying of the upstream cylinders through the test section for collection in the downstream storage cylinders. The control variables are the upstream and downstream pressures (thereby the pressure differential), the gas used, the upstream temperature, and the water injection rate. Before each experiment, the flowloop is purged three times using dry gas to remove any residual water. The pressure (PR) and back pressure (BPR) regulators are set manually, and the target pressure differential remains constant through any given experiment. Once cleaned, the entire loop is pressurized to the intended downstream pressure, where the BPR ensures that gas is not lost to storage. The central JT valve is then closed, and the upstream section is pressurized to its desired initial value. If water preloading is to be used, it is then injected into the upstream section. Each experiment begins when the JT valve is actuated using the control software. Pressure is maintained at the desired upstream value until the bottle pressure falls below the PR setpoint, while the downstream pressure is maintained at its desired value while the bottle storage pressure remains below the BPR setpoint. This enables a period of steady state operation before the depressurization transient begins, typically resulting in lower upstream, but constant downstream pressures. An experimental run is terminated when pressure equalization occurs over the valve, though the majority of JT cooling occurs in the steady state period and in the transient immediately following. After termination, the flowloop inlet valve is closed and the compressor is used to recharge the source bottles.

3. Results

Two sets of data are reported in this work: non-hydrating (exp. 1–17) and hydrating (exp. 18–29) per Table 1. The first provides a baseline of expected behavior in the absence of solid formation and may be compared with thermodynamic model predictions, such as those from NIST’s REFPROP [22], or KBC Infochem’s Multiflash [42]. The wet gas experiments allow us to probe hydrate formation during gas expansion. Before hydrate plugging was identified for each hydrating run, the averaged volumetric flow rate for the gas mixture was approximately estimated to be 800 mL/min. The wet gas experiments were carried out at four water injection rates (10, 25, 50, and 100 mL/min), and those correspond to the volumetric water fraction of 1.25, 3.13, 6.25, and 12.5 percent, respectively. For the wet gas runs, at the initially controlled downstream pressure of 4 MPa, the hydrate equilibrium temperature was calculated to be 286.2 K [42]. All the minimum temperatures tabulated here for hydrate formation experiments were measured to be below the hydrate equilibrium. While the rate of hydrate formation has been probed extensively for unobstructed flow, it is not well understood for gas expansion systems. The extent and location of hydrate formation are critical for both subsea systems and onshore safety relief applications, with the data reported here having important implications for both.

3.1. Dry Gas Experiments

The non-hydrating experiments reported here serve as a baseline to understand the typical behavior of a given expansion test run. Given that the system is pressure-driven, the pressure differential over the valve can only be maintained while the bottle source exceeds the regulator set point. This means that there will be a period of steady state operation which generally lasts 2–10 min, followed by a steady decline in pressure drop and the corresponding JT cooling. Figure 2 shows an example of this behavior in terms of the pressure and temperature differentials, with a steady state operating period on the order of 4 min. The cooling response rate is indicated by the steep increase in the temperature differential within the first minute, which then plateaus as the test section equilibrates with expanding fluid. This maximum temperature differential during the steady-state operating period can be compared with thermodynamic property simulation tools. The dynamic data obtained thereafter are useful as an input for accompanying models of the overall flowing system for the purpose of estimating heat transfer into the flowing fluid.
Figure 3 presents a summary of all dry gas experiments performed as part of this work. Individual experiments are shown as crosses, while a model prediction of the thermodynamic JT temperature drop predicted using the CPA-Infochem implemented in Multiflash v7.0 is shown as a solid blue line. The Multiflash prediction represents an upper expected limit to the temperature reduction in the system, as it represents the perfect cooling of an isenthalpic expansion of the fluid, whereas the temperature sensors in the apparatus are placed on the outer surface of the test section. In general, we expect that, given the JT coefficient of this mixture is positive, a greater pressure differential will directly correspond to an increased temperature differential. This behavior is observed, where an increasing deviation is also noted between the data and model at higher differential pressures. There are several likely contributing factors to this behavior. First, in the experimental setup, the expansion at a constant enthalpy is challenging due to dynamic effects associated with changes in kinetic energy (flow rate) and heat transfer. Smith [43] described that the measured temperature change along with pressure drop depends on a path, where a fluid system flows between pressure and temperature sensors. Also, the deviation may be related to the effect of the sensible cooling required by the steel pipeline. As the enthalpy lost by heat transfer to the pipe depends on the temperature difference between the fluid and the wall, which is not independently measured in our system: this term is difficult to estimate.

3.2. Wet Gas Experiments

The wet gas, or hydrating, experiments form the main body of work reported here. The driving force for cooling, the pressure differential, was held constant throughout this set of work, where the primary test matrix revolved around the quantity of water injected into the system. The tests performed provided insights into the rate of hydrate formation, and the behavior of plugs downstream of a restriction.

3.2.1. Immediate Hydrate Formation/Blockage Observed

Initial experiments were performed at a low water injection rate of 10 mL/min, which was sufficient for rapid plugging to occur in the system. Figure 4 and Figure 5 show the pressure trend behavior (upper pane) at the bottle, upstream (post-PR) and downstream (pre-BPR) sensors and temperature trends (lower pane) measured at the location of T3, upstream, and downstream of the expansion valve, from T4 to T8, of two separate experiments. The upstream and gas bottle pressures converge over the first four minutes, which is nominally the steady state envelope for these experiments. The downstream pressures (orange and red) overlap as there is insufficient distance between them for frictional losses to play a role—this overlap indicates that there is no blockage or flow disruption between P3 and P4. Regarding downstream temperatures, the rate of cooling at the location of T4 was suppressed at approximately 100 s. This could be due to the exothermic nature of hydrate formation. Other locations were observed to cool further, which was attributed to a secondary expansion induced by the hydrate plug. Further, the agreement between the two experiments suggests a high degree of repeatability within the apparatus.
In these systems, while the bottle and upstream pressures converge by approximately 4 min, they do not continue to decrease thereafter, remaining unchanged for the duration of the experiment. While a differential is maintained between the sets of sensors, there is no pressure communication–no flow–between the sensor upstream of the JT valve and those downstream after the 5 min mark. Figure 6 provides a schematic view of the hydrate plug that has caused this, with its location identified based on the pressure in the system. The plug’s location is further localized by considering the downstream reading on the JT valve’s dP meter. These experiments indicate that even with a low water injection rate, hydrate formation and blockage occur almost instantly during gas expansion. In effect, the valve is likely acting as a spray deposition nozzle in these cases, suggesting that monitoring the pressure drop over valves both subsea and in process facilities, coupled with being able to accurately predict the resultant temperature differentials, is critical to preventing solids blockage.

3.2.2. Growth Rates in Excess of Current Kinetic Models

At higher water injection rates (25–100 mL/min) the behavior observed was different from that for experiments conducted at 10 mL/min. Rather than a constant differential between upstream and downstream pressure, all pressure measurements converge in these cases. The rates at which this convergence occurs provide information on the kinetic rate of hydrate formation that is occurring within each experiment, where faster convergence suggests more rapid blockage. Figure 7 shows the most rapid convergence behavior, with blockage taking longer at the higher water rates seen in Figure 8 and Figure 9.
The UWA Gas Dominant Hydrate Extension [44,45] for the OLGA® multiphase flow simulator was deployed to understand how the rate of blockage compares between unrestricted flowing systems and formation during gas expansion. While the UWA Extension model accounts for both mass transfer limited and kinetic growth, the kinetic rate is expected to dominate in these cases.
d m d t = A e C 1 e C 2 T Δ T s u b
This kinetic model determines the formation rate of hydrate and is driven by the subcooling (ΔTsub) of the system relative to the hydrate equilibrium curve. Its kinetic parameters (C1, C2) have been measured extensively for gas and oil dominant systems. In fitting the expansion loop data this leaves the area term (A) as the remaining adjustable parameter. Given that we may expect water droplets to be atomized between 10 and 100 µm over the injection nozzle, this, in conjunction with the injection rate, provides a range of estimates for the resultant rate of hydrate formation.
Thus far, we have found that this attempt to use the default kinetic model underpredicts the rate of hydrate formation by at least an order of magnitude: this is due to the inapplicability of the baseline interfacial area model [46]. To crudely approximate the rates of hydrate formation observed, it would be necessary to atomize droplets to the 1 µm scale. Overall, this suggests that current models for hydrate formation which perform well for normal flow conditions will not produce reliable results for cases of gas expansion, as the sub-models used to determine surface area are not fit for purpose. At a preliminary level, we find that the Weber Number based correlation described by Wu et al. [47] may produce estimates of droplet sizes that are on the order of 1–20 µm depending on valve opening. Correcting hydrate formation rates over valves will require improvements in both hydrate Extensions such as the UWA Gas Dominant model, and the flow engines to which they are coupled. At present, it is not possible within OLGA to retain appropriate models for droplet size in unrestricted flow alongside those for atomized droplets over valve restrictions. To appropriately model these systems will require that OLGA be updated to either accurately predict droplet sizes in flow and over restrictions—which can then be passed to the UWA Gas Dominant Model, or to pass data on valve locations to the Extensibility Framework, which can then be interpreted by the UWA model to select an appropriate droplet size model.
Finally, the convergence of all pressure signals in these cases suggests that hydrate restrictions occur downstream of the sensor P4, per Figure 10, at higher water injection rates rather than near the valve. The slower convergence of pressure signals may indicate a smearing effect, that is, spatially longer hydrate plugs are produced at higher water injection rates.

3.2.3. Hydrate Plug Mobility Observed

The ability to spatially locate hydrate plugs in this system through pressure signals means that there is potential to investigate the mobility of formed deposits. Figure 11 shows both the pressure and temperature traces of Experiment 26, where, in this case, the downstream pressure signals (red and orange) do not always overlap. In the region marked as “A” the values differ and P3, located further upstream than P4, begins to rise. This indicates that a restriction may have been formed between P3 and P4, as shown in Figure 12. Further, the lower pane of Figure 11 shows the temperature trends of all sensors in the test section, while these are mostly clustered, T9 deviates from the other sensors to lower temperatures at the same time as the difference between P3 and P4 occurs. This forms a second piece of evidence indicating that a partial restriction forms between P3 and P4, leading to secondary JT cooling in the line and, thus a lower T9 value. As the system transitions to region “B” the pressure signals of P3 and P4 once again equalize, and T9 begins to rise in line with the other sensors. Overall, this suggests that, in this case, a plug formed and then migrated downstream within the test section. Given the relatively small amount of water in the system, which suggests relatively “dry” hydrates, this may provide an interesting data point relevant to sloughing behavior.

3.2.4. Plugging Potential and Water Rate Inversely Correlated

In considering the overall trends observed throughout this set of wet gas data, there are several points to consider. First, the overall degree of cooling in the system varies as a function of the quantity of water injected. Table 1 shows the minimum downstream temperature recorded at a varied water injection rate, compared to those of the dry gas cases. There is a general increasing trend in this minimum temperature with injection rate, that is, the system is generally warmer when more water is injected. This is sensible, as energy must be used to cool both the gas, with a relatively low heat capacity (cp), and water, with a far higher cp.
The occurrence of hydrate plugging and the focus on water injection rate in this case, allows us to draw together an additional interesting data set from this work. Figure 13 shows the “plugging pressure”, that is, the steady-state pressure in the loop after a hydrate plug is formed, as a function of the water injection rate. This plugging pressure is a convolution of both the rate and size of the hydrate plug formed, a higher plugging pressure in this case indicates a rapidly formed, but probably short, hydrate plug. For a system with no hydrate plug, we would expect the final pressure value to be 40 bar as the system equilibrates. While it might be expected that the most severe cases of hydrate plugging should occur with more water, the opposite is seen in these data: water injection is inversely correlated with plugging potential. This is likely due to several factors: (i) the lower water injection rates lead to water droplets that are finely atomized in flow, thus greater (gas-water) interfacial area for formation; (ii) the larger thermal mass of the fluid mixture containing more water leads to reduced subcoolings for a given pressure drop and (iii) higher injection rates are more likely to present with a bulk liquid phase, which could act to transport hydrate particles or strip deposits. These phenomena will be critically important in industrial applications, particularly during transient operations where the fluid momentum and holdup entering the valve may change rapidly. Additional studies are required to determine the scale-dependence of this behavior, which is particularly crucial for managing liquid inventory in process safety relief systems.

4. Discussion and Conclusions

A new Joule Thomson Expansion Loop has been constructed to interrogate the risk for hydrate formation during gas expansion. The purpose of this work has been to generate a greater understanding of the rates of hydrate formation and blockage associated with expansion through a valve to provide useful insights for the energy industry both subsea and topside. Dry gas expansion experiments were useful both as a baseline for understanding later experiments and to characterize the facility. These were followed by a set of wet gas measurements which generated several key outcomes:
  • Hydrate formation occurs near-instantaneously (within ten seconds, as evidenced by the initial pressure slope change in plugging cases) during wet gas expansion over a valve. Contrary to pipeline flow, in which some induction time is expected, valves seem to act as effective spray deposition nozzles for hydrate formation resulting in surface areas at least an order of magnitude larger. Crystal formation is effectively immediate and severe.
  • The growth rates of hydrate when expanded over a valve are not well represented by current models. Existing kinetic models fall short by an order of magnitude or more when attempting to estimate the rate at which hydrate deposits grow downstream of a valve due to poor surface area estimates. To close this gap, the interfacial area sub-models within hydrate growth algorithms require refinement. Further, the underlying fluid dynamic models must be updated to enable estimates of the interfacial area to be captured for both normal pipe flow and expansion cases simultaneously– as they presently require one or the other to be implemented.
  • Hydrate plugs downstream of valves may be mobile, corresponding to a pressure-driven (approximately 1 MPa) plugging shift as shown in Experiment 26, though additional data are required to determine the factors controlling this behavior. The use of advanced instrumentation to spatially resolve the test section may enable a more granular description of plug movement.
  • The rate of plug formation was shown to be inversely proportional to the water injection rate, where the plugging pressure was approximately halved as the water injection rate increased by an order of magnitude. This was likely due to the increased subcooling and/or finer atomization experienced in systems with lower water rate flows, which leads to shorter, faster-growing plugs immediately following the expansion valve.
These points are important for both subsea production systems and for onshore process facilities where solids formation also poses a hazard. The data suggest that understanding and controlling the pressure differential and being able to make reliable predictions of the associated JT effect are critical to understanding where solid dropout may occur. Of particular interest are regions where hydrate may migrate downstream to nearby bends, such as in jumpers, or critical components such as safety relief systems that deal with wet gases.

Author Contributions

Conceptualization, Z.M.A. and B.W.E.N.; methodology, K.J. and B.W.E.N.; validation, K.J. and B.W.E.N.; formal analysis, K.J. and B.W.E.N.; investigation, K.J.; writing—original draft preparation, B.W.E.N. and K.J.; writing—review and editing, all authors; visualization, K.J.; supervision, Z.M.A.; funding acquisition, Z.M.A., E.F.M.; K.J. and B.W.E.N. contributed equally in this work. All authors have read and agreed to the published version of the manuscript.

Funding

This research was funded by National Energy Resources Australia (NERA), grant number: PRO-PF-29.

Data Availability Statement

Data are available upon request.

Acknowledgments

The authors acknowledge Craig Grimm for workshop assistance in constructing and modifying the experimental apparatus.

Conflicts of Interest

The authors declare that they have no known competing financial interest or personal relationships that could have appeared to influence the work reported in this paper.

References

  1. Sloan, E.D., Jr.; Koh, C.A. Clathrate Hydrates of Natural Gases; CRC Press: Boca Raton, FL, USA, 2007. [Google Scholar]
  2. Koh, C.A.; Sloan, E.D.; Sum, A.K.; Wu, D.T. Fundamentals and Applications of Gas Hydrates. Annu. Rev. Chem. Biomol. Eng. 2011, 2, 237–257. [Google Scholar] [CrossRef] [PubMed]
  3. Sloan, E.D.; Koh, C.; Sum, A.K.; Ballard, A.L.; Creek, J.; Eaton, M.; Lachance, J.; McMullen, N.; Palermo, T.; Shoup, G.; et al. Natural Gas Hydrates in Flow Assurance; Elsevier: Amsterdam, The Netherlands, 2011. [Google Scholar]
  4. Englezos, P. Clathrate hydrates. Ind. Eng. Chem. Res. 1993, 32, 1251–1274. [Google Scholar] [CrossRef]
  5. Cha, M.; Shin, K.; Kim, J.; Chang, D.; Seo, Y.; Lee, H.; Kang, S.-P. Thermodynamic and kinetic hydrate inhibition performance of aqueous ethylene glycol solutions for natural gas. Chem. Eng. Sci. 2013, 99, 184–190. [Google Scholar] [CrossRef]
  6. Lim, V.W.; Metaxas, P.J.; Johns, M.L.; Aman, Z.M.; May, E.F. The impact of mono-ethylene glycol and kinetic inhibitors on methane hydrate formation. Chem. Eng. J. 2022, 427, 131531. [Google Scholar] [CrossRef]
  7. Wang, Y.; Koh, C.A.; White, J.; Patel, Z.; Zerpa, L.E. Hydrate formation management simulations with anti-agglomerants and thermodynamic inhibitors in a subsea tieback. Fuel 2019, 252, 458–468. [Google Scholar] [CrossRef]
  8. Sloan, E.D. A changing hydrate paradigm—From apprehension to avoidance to risk management. Fluid Phase Equilibria 2005, 228–229, 67–74. [Google Scholar] [CrossRef]
  9. Norris, B.W.E.; Charlton, T.B.; Johns, M.L.; May, E.F.; Aman, Z.M. Risk-Based Flow Assurance Design for Natural Gas Hydrate Production Systems. In Proceedings of the Offshore Technology Conference Asia, Kuala Lumpur, Malaysia, 20–23 March 2018. [Google Scholar]
  10. Gao, S. Hydrate Risk Management at High Watercuts with Anti-agglomerant Hydrate Inhibitors. Energy Fuels 2009, 23, 2118–2121. [Google Scholar] [CrossRef]
  11. Kelland, M.A. Production Chemicals for the Oil and Gas Industry; CRC Press: Boca Raton, FL, USA, 2014. [Google Scholar]
  12. Jeong, K.; Metaxas, P.J.; Chan, J.; Kuteyi, T.O.; Aman, Z.M.; Stanwix, P.L.; Johns, M.L.; May, E.F. Hydrate nucleation and growth on water droplets acoustically-levitated in high-pressure natural gas. Phys. Chem. Chem. Phys. 2019, 21, 21685–21688. [Google Scholar] [CrossRef]
  13. Jeong, K.; Metaxas, P.J.; Helberg, A.; Johns, M.L.; Aman, Z.M.; May, E.F. Gas hydrate nucleation in acoustically levitated water droplets. Chem. Eng. J. 2022, 433, 133494. [Google Scholar] [CrossRef]
  14. Barwood, M.T.J.; Metaxas, P.J.; Lim, V.W.S.; Sampson, C.C.; Johns, M.L.; Aman, Z.M.; May, E.F. Extracting nucleation rates from ramped temperature measurements of gas hydrate formation. Chem. Eng. J. 2022, 450, 137895. [Google Scholar] [CrossRef]
  15. Herath, D.; Khan, F.; Rathnayaka, S.; Rahman, M.A. Probabilistic estimation of hydrate formation. J. Pet. Sci. Eng. 2015, 135, 32–38. [Google Scholar] [CrossRef]
  16. Xu, H.; Khan, F.; Jung, S.; Wang, Q. Probabilistic model for hydrate and wax risk assessment in oil and gas pipelines. Process Saf. Environ. Prot. 2023, 170, 11–18. [Google Scholar] [CrossRef]
  17. Sohn, Y.h.; Kim, J.; Shin, K.; Chang, D.; Seo, Y.; Aman, Z.M.; May, E.F. Hydrate plug formation risk with varying watercut and inhibitor concentrations. Chem. Eng. Sci. 2015, 126, 711–718. [Google Scholar] [CrossRef]
  18. Jamaluddin, A.; Kalogerakis, N.; Bishnoi, P. Hydrate plugging problems in undersea natural gas pipelines under shutdown conditions. J. Pet. Sci. Eng. 1991, 5, 323–335. [Google Scholar] [CrossRef]
  19. Marić, I. The Joule–Thomson effect in natural gas flow-rate measurements. Flow Meas. Instrum. 2005, 16, 387–395. [Google Scholar] [CrossRef]
  20. She, H.; Cui, X.; Weng, J.; Chang, Z. Study on the influence of distributed Joule-Thomson effect on the performance of microchannel cryocooler. Appl. Therm. Eng. 2022, 213, 118795. [Google Scholar] [CrossRef]
  21. Cao, H.S.; Vanapalli, S.; Holland, H.J.; Vermeer, C.H.; ter Brake, H.J.M. A micromachined Joule–Thomson cryogenic cooler with parallel two-stage expansion. Int. J. Refrig. 2016, 69, 223–231. [Google Scholar] [CrossRef]
  22. Lemmon, E.; Bell, I.H.; Huber, M.; McLinden, M. NIST Standard Reference Database 23: Reference Fluid Thermodynamic and Transport Properties-REFPROP, Version 10.0; National Institute of Standards and Technology: Gaithersburg, MD, USA, 2018. [Google Scholar]
  23. Schoen, M. The Joule–Thomson effect in confined fluids. Phys. A Stat. Mech. Its Appl. 1999, 270, 353–379. [Google Scholar] [CrossRef]
  24. Tarom, N.; Hossain, M.M.; Rohi, A. A new practical method to evaluate the Joule–Thomson coefficient for natural gases. J. Pet. Explor. Prod. Technol. 2018, 8, 1169–1181. [Google Scholar] [CrossRef]
  25. Budenholzer, R.; Sage, R.; Lacey, W. Phase equilibria in hydrocarbon systems Joule-Thomson coefficients for gaseous mixtures of methane and n-butane. Ind. Eng. Chem. 1940, 32, 384–387. [Google Scholar] [CrossRef]
  26. Roebuck, J.; Murrell, T.; Miller, E. The Joule-Thomson effect in carbon dioxide. J. Am. Chem. Soc. 1942, 64, 400–411. [Google Scholar] [CrossRef]
  27. Roebuck, J.; Osterberg, H. The Joule-Thomson effect in nitrogen. Phys. Rev. 1935, 48, 450. [Google Scholar] [CrossRef]
  28. Hendricks, R.C.; Peller, I.C.; Baron, A.K. Joule-Thomson Inversion Curves and Related Coefficients for Several Simple Fluids; NASA: Washington, DC, USA, 1972. [Google Scholar]
  29. Wood, S.A.; Spera, F.J. Adiabatic decompression of aqueous solutions: Applications to hydrothermal fluid migration in the crust. Geology 1984, 12, 707–710. [Google Scholar] [CrossRef]
  30. Stauffer, P.H.; Lewis, K.; Stein, J.S.; Travis, B.J.; Lichtner, P.; Zyvoloski, G. Joule–Thomson effects on the flow of liquid water. Transp. Porous Media 2014, 105, 471–485. [Google Scholar] [CrossRef]
  31. Johal, K.; Teh, C.; Cousins, A. An alternative economic method to riserbase gas lift for deep water subsea oil/gas field developments. In Proceedings of the SPE Offshore Europe, Aberdeen, UK, 9–12 September 1997. [Google Scholar]
  32. Lovell, D.; Pakulski, M. Hydrate inhibition in gas wells treated with two low dosage hydrate inhibitors. In Proceedings of the SPE Gas Technology Symposium, Calgary, AB, Canada, 30 April–2 May 2002. [Google Scholar]
  33. Szymczak, S.; Sanders, K.; Pakulski, M.; Higgins, T. Chemical compromise: A thermodynamic and low-dose hydrate-inhibitor solution for hydrate control in the Gulf of Mexico. SPE Proj. Facil. Constr. 2006, 1, 1–5. [Google Scholar] [CrossRef]
  34. Pakulski, M. Accelerating effect of surfactants on gas hydrates formation. In Proceedings of the International Symposium on Oilfield Chemistry, Houston, TX, USA, 28 February–2 March 2007. [Google Scholar]
  35. Liao, Y.; Zheng, J.; Wang, Z.; Sun, B.; Sun, X.; Linga, P. Modeling and characterizing the thermal and kinetic behavior of methane hydrate dissociation in sandy porous media. Appl. Energy 2022, 312, 118804. [Google Scholar] [CrossRef]
  36. Yang, L.; Shi, K.; Qu, A.; Liang, H.; Li, Q.; Lv, X.; Leng, S.; Liu, Y.; Zhang, L.; Liu, Y.; et al. The locally varying thermodynamic driving force dominates the gas production efficiency from natural gas hydrate-bearing marine sediments. Energy 2023, 276, 127545. [Google Scholar] [CrossRef]
  37. Guan, D.; Qu, A.; Gao, P.; Fan, Q.; Li, Q.; Zhang, L.; Zhao, J.; Song, Y.; Yang, L. Improved temperature distribution upon varying gas producing channel in gas hydrate reservoir: Insights from the Joule-Thomson effect. Appl. Energy 2023, 348, 121542. [Google Scholar] [CrossRef]
  38. Mathias, S.A.; Gluyas, J.G.; Oldenburg, C.M.; Tsang, C.-F. Analytical solution for Joule–Thomson cooling during CO2 geo-sequestration in depleted oil and gas reservoirs. Int. J. Greenh. Gas Control 2010, 4, 806–810. [Google Scholar] [CrossRef]
  39. Oldenburg, C.M. Joule-Thomson cooling due to CO2 injection into natural gas reservoirs. Energy Convers. Manag. 2007, 48, 1808–1815. [Google Scholar] [CrossRef]
  40. Ziabakhsh-Ganji, Z.; Kooi, H. Sensitivity of Joule–Thomson cooling to impure CO2 injection in depleted gas reservoirs. Appl. Energy 2014, 113, 434–451. [Google Scholar] [CrossRef]
  41. LabVIEW, National Instruments: Austin, TX, USA, 2020.
  42. Multiflash 7.0, KBC Advanced Technologies Ltd.: Walton-on-Thames, UK, 2018.
  43. Smith, R.L. Joule-Thomson Coefficients of Propane and N-Butane. Ph.D. Thesis, California Institute of Technology, Pasadena, CA, USA, 1970. [Google Scholar]
  44. Charlton, T.B. Predicting Hydrate Blockages in Gas-Dominant Flowlines. Ph.D. Thesis, The University of Western Australia, Perth, Australia, 2021. [Google Scholar]
  45. Charlton, T.B.; Zerpa, L.E.; Koh, C.A.; May, E.F.; Aman, Z.M. Predicting hydrate blockage formation in gas-dominant systems. In Proceedings of the Offshore Technology Conference Asia, Kuala Lumpur, Malaysia, 20–23 March 2018. [Google Scholar]
  46. Yin, Z.; Khurana, M.; Tan, H.K.; Linga, P. A review of gas hydrate growth kinetic models. Chem. Eng. J. 2018, 342, 9–29. [Google Scholar] [CrossRef]
  47. Wu, P.K.; Tseng, L.K. Primary breakup in gas/liquid mixing layers for turbulent liquids. At. Sprays 1992, 2, 295–317. [Google Scholar] [CrossRef]
Figure 1. Joule Thomson (JT) expansion loop with a 1″ OD pipe testing section, located at The University of Western Australia; PR, pressure regulator; BPR, back pressure regulator; P and T, pressure and temperature sensors; dP, pressure differential meter; V, electro-pneumatic actuated valve; RV, relief valve; BD, burst disc.
Energies 16 07594 g001
Figure 2. Pressure (black) and temperature (blue) deviations over the valve for Experiment 1. The initial flat section corresponds to the period before the feed gas pressure falls below the inlet regulator set point.
Energies 16 07594 g002
Figure 3. Summary of Experiments 1–17 showing the JT cooling as a function of pressure drop over the valve. The blue line shows the temperature decrease predicted using a Multiflash v7.0 isenthalpic flash calculation. The red cross symbol indicates a result from each experiment run.
Energies 16 07594 g003
Figure 4. Top pane: pressure trend behavior for Experiment 18. The black line indicates the source bottle pressure, before the initial regulator, the blue line shows the pressure after the regulator but before the JT valve, the red and orange lines (overlapping) are the pressures downstream of the JT valve. Bottom pane: temperature trend behavior for the same experiment, where the black line indicates the upstream temperature and the remaining colors correspond to the temperature sensors shown in Figure 6. The water injection rate was 10 mL/min.
Energies 16 07594 g004
Figure 5. Top pane: pressure trend behavior for Experiment 19. The black line indicates the source bottle pressure, before the initial regulator, the blue line shows the pressure after the regulator but before the JT valve, the red and orange lines (overlapping) are the pressures downstream of the JT valve. Bottom pane: temperature trend behavior for the same experiment, where the black line indicates the upstream temperature and the remaining colors correspond to the temperature sensors shown in Figure 6. The water injection rate was 10 mL/min.
Energies 16 07594 g005
Figure 6. Downstream test section of the Joule Thomson expansion loop with temperature and pressure sensors indicated. The lower pane shows the estimated location of the resultant hydrate plug based on pressure signals, corresponding to Experiments 18, 19 and 20, where the dP gauge allowed a more refined location estimate.
Energies 16 07594 g006
Figure 7. Top pane: pressure trend behavior for Experiment 22. The black line indicates the source bottle pressure, before the initial regulator, the blue line shows the pressure after the regulator but before the JT valve, the red and orange lines (overlapping) are the pressures downstream of the JT valve. Bottom pane: temperature trend behavior for the same experiment, where the black line indicates the upstream temperature and the remaining colors correspond to the temperature sensors shown in Figure 10. The water injection rate was 25 mL/min.
Energies 16 07594 g007
Figure 8. Top pane: pressure trend behavior for Experiment 24. The black line indicates the source bottle pressure, before the initial regulator, the blue line shows the pressure after the regulator but before the JT valve, the red and orange lines (overlapping) are the pressures downstream of the JT valve. Bottom pane: temperature trend behavior for the same experiment, where the black line indicates the upstream temperature and the remaining colors correspond to the temperature sensors shown in Figure 10. The water injection rate was 50 mL/min.
Energies 16 07594 g008
Figure 9. Top pane: pressure trend behavior for Experiment 27. The black line indicates the source bottle pressure, before the initial regulator, the blue line shows the pressure after the regulator but before the JT valve, the red and orange lines (overlapping) are the pressures downstream of the JT valve. Bottom pane: temperature trend behavior for the same experiment, where the black line indicates the upstream temperature and the remaining colors correspond to the temperature sensors shown in Figure 10. The water injection rate was 100 mL/min.
Energies 16 07594 g009
Figure 10. Downstream test section of the Joule Thomson expansion loop with temperature and pressure sensors indicated. The lower pane shows the estimated location of the resultant hydrate plug based on pressure signals, corresponding to Experiments 22, 24 and 27.
Energies 16 07594 g010
Figure 11. Top pane: pressure trend behavior for Experiment 26. The black line indicates the source bottle pressure, before the initial regulator, the blue line shows the pressure after the regulator but before the JT valve, the red and orange lines are the pressures downstream of the JT valve; Bottom pane: temperature trend behavior for the same experiment, where the black line indicates the upstream temperature, the purple line the farthest downstream temperature measurement, and the remaining colors correspond to the temperature sensors shown in Figure 12. The water injection rate was 50 mL/min.
Energies 16 07594 g011
Figure 12. Downstream test section of the Joule Thomson expansion loop with temperature and pressure sensors indicated. The lower pane shows the location of the resultant hydrate plug corresponding to Experiment 26 (Figure 11), where the shift from A to B indicates how the hydrate plug might have been dislocated during the experiment.
Energies 16 07594 g012
Figure 13. Summary of wet gas experiments in which hydrate formed showing the pressure at which a plug occurred as a function of the water injection rate. Higher “plugging pressure” values correspond to more rapid and severe plug formation.
Energies 16 07594 g013
Table 1. Summary of experimental conditions.
Exp.Gas TypeUpstream
Pressure (MPa)
Upstream
Temperature (K)
BPR (Downstream)
Setpoint (MPa)
Water
Injection Rate (mL/min)
Min.
Downstream
Temperature (K)
1Dry
Gas Mixture
C1:C2,
68:32 mol%
8.82952.9N/A259.3
23.1259.8
33.9266.2
43.9266.5
53.9266.1
64.0268.0
74.0267.6
84.0267.8
94.0268.1
104.1268.0
115.0273.6
125.0273.0
135.0272.8
145.1273.8
155.3274.8
165.5275.0
175.6276.5
18Wet
Gas Mixture
C1:C2,
68:32 mol%
4.010267.9
19269.6
20269.0
2125278.2
22271.8
23277.1
2450270.2
25274.2
26271.4
27100275.4
28275.1
29275.9
Disclaimer/Publisher’s Note: The statements, opinions and data contained in all publications are solely those of the individual author(s) and contributor(s) and not of MDPI and/or the editor(s). MDPI and/or the editor(s) disclaim responsibility for any injury to people or property resulting from any ideas, methods, instructions or products referred to in the content.

