Abstract
This study aims to experimentally evaluate the impact of a double-sided microporous layer coating on gas diffusion layers in terms of their key properties and fuel cell performance, in comparison to conventional single-sided coated gas diffusion layers (GDLs). Vulcan black and Ketjenblack were used as the carbon black materials. This was to investigate the sensitivity of the results with respect to the type of carbon black used. The results showed that the in-plane electrical conductivity is almost insensitive to microporous layer (MPL) loading and carbon black type. Furthermore, the electrical conductivity of all the MPL-coated GDLs are slightly lower than that of the uncoated GDL. The Ketjenblack black MPL samples were found to demonstrate higher gas permeability than the Vulcan black samples. The addition of the MPL resulted in a favourable shift in pore size distribution, with prominent micropores observed in both single- and double-sided MPL-coated GDLs. Contact angle measurements indicated a slight increase in the hydrophobicity with the addition of a microporous layer, but without significant differences between carbon black types or loading levels. Cross-sectional SEM images showed that there was a higher level of MPL penetration into the carbon substrate for the GDLs coated with Vulcan black as compared to a Ketjenblack coating. In situ fuel cell testing demonstrated the superior performance of the double-sided Vulcan black MPL-coated GDL under high humidity conditions, while the single-sided Vulcan black MPL-coated GDL exhibited better performance at low humidity conditions. All the above findings have been thoroughly discussed and justified.
1. Introduction
To reduce or eliminate the reliance on fossil fuels, numerous initiatives and projects have recently emphasised the production and utilisation of green hydrogen. Green hydrogen is produced from water electrolysis, using electricity generated by renewable energy sources such as wind or solar power. Given the intermittent nature of these renewables, green hydrogen is typically stored and deployed as needed through fuel cells [1].
Polymer electrolyte membrane fuel cells (PEMFCs) are of major interest for utilisation of low carbon hydrogen. This is due to their high efficiency, low operating temperature and ease of assembly [1]. PEMFCs are well placed to enable the use of hydrogen, as they can be applied in a wide variety of stationary, automotive and portable applications [2].
The gas diffusion layer (GDL) is a vital component of the PEMFC. It carries out many different roles within the fuel cell. Firstly, it uniformly distributes the reactant gasses (hydrogen and oxygen) to the catalyst layer (CL) active sites. It is also crucial to water management; the GDL should ideally expel excess water whilst simultaneously keeping the membrane hydrated. Water flooding, when it occurs, has the potential to hinder the transport of reactant gases to the catalyst layers due to the partial/complete blockage of the pores within the porous media, particularly the gas diffusion layers. This in turn degrades the performance of the fuel cell, especially when operating under high current densities. Therefore, effective management of liquid water within the GDLs in the fuel cell is of paramount importance in order to maintain optimal operation [2].
Finally, the GDL provides structural support to the delicate membrane and catalyst layers [3]. Due to the multifaceted nature of the GDL, it is typically comprised of a carbon fibre material, as this best fulfils the multiple functions it must provide. GDLs are usually made from a carbon cloth or carbon paper.
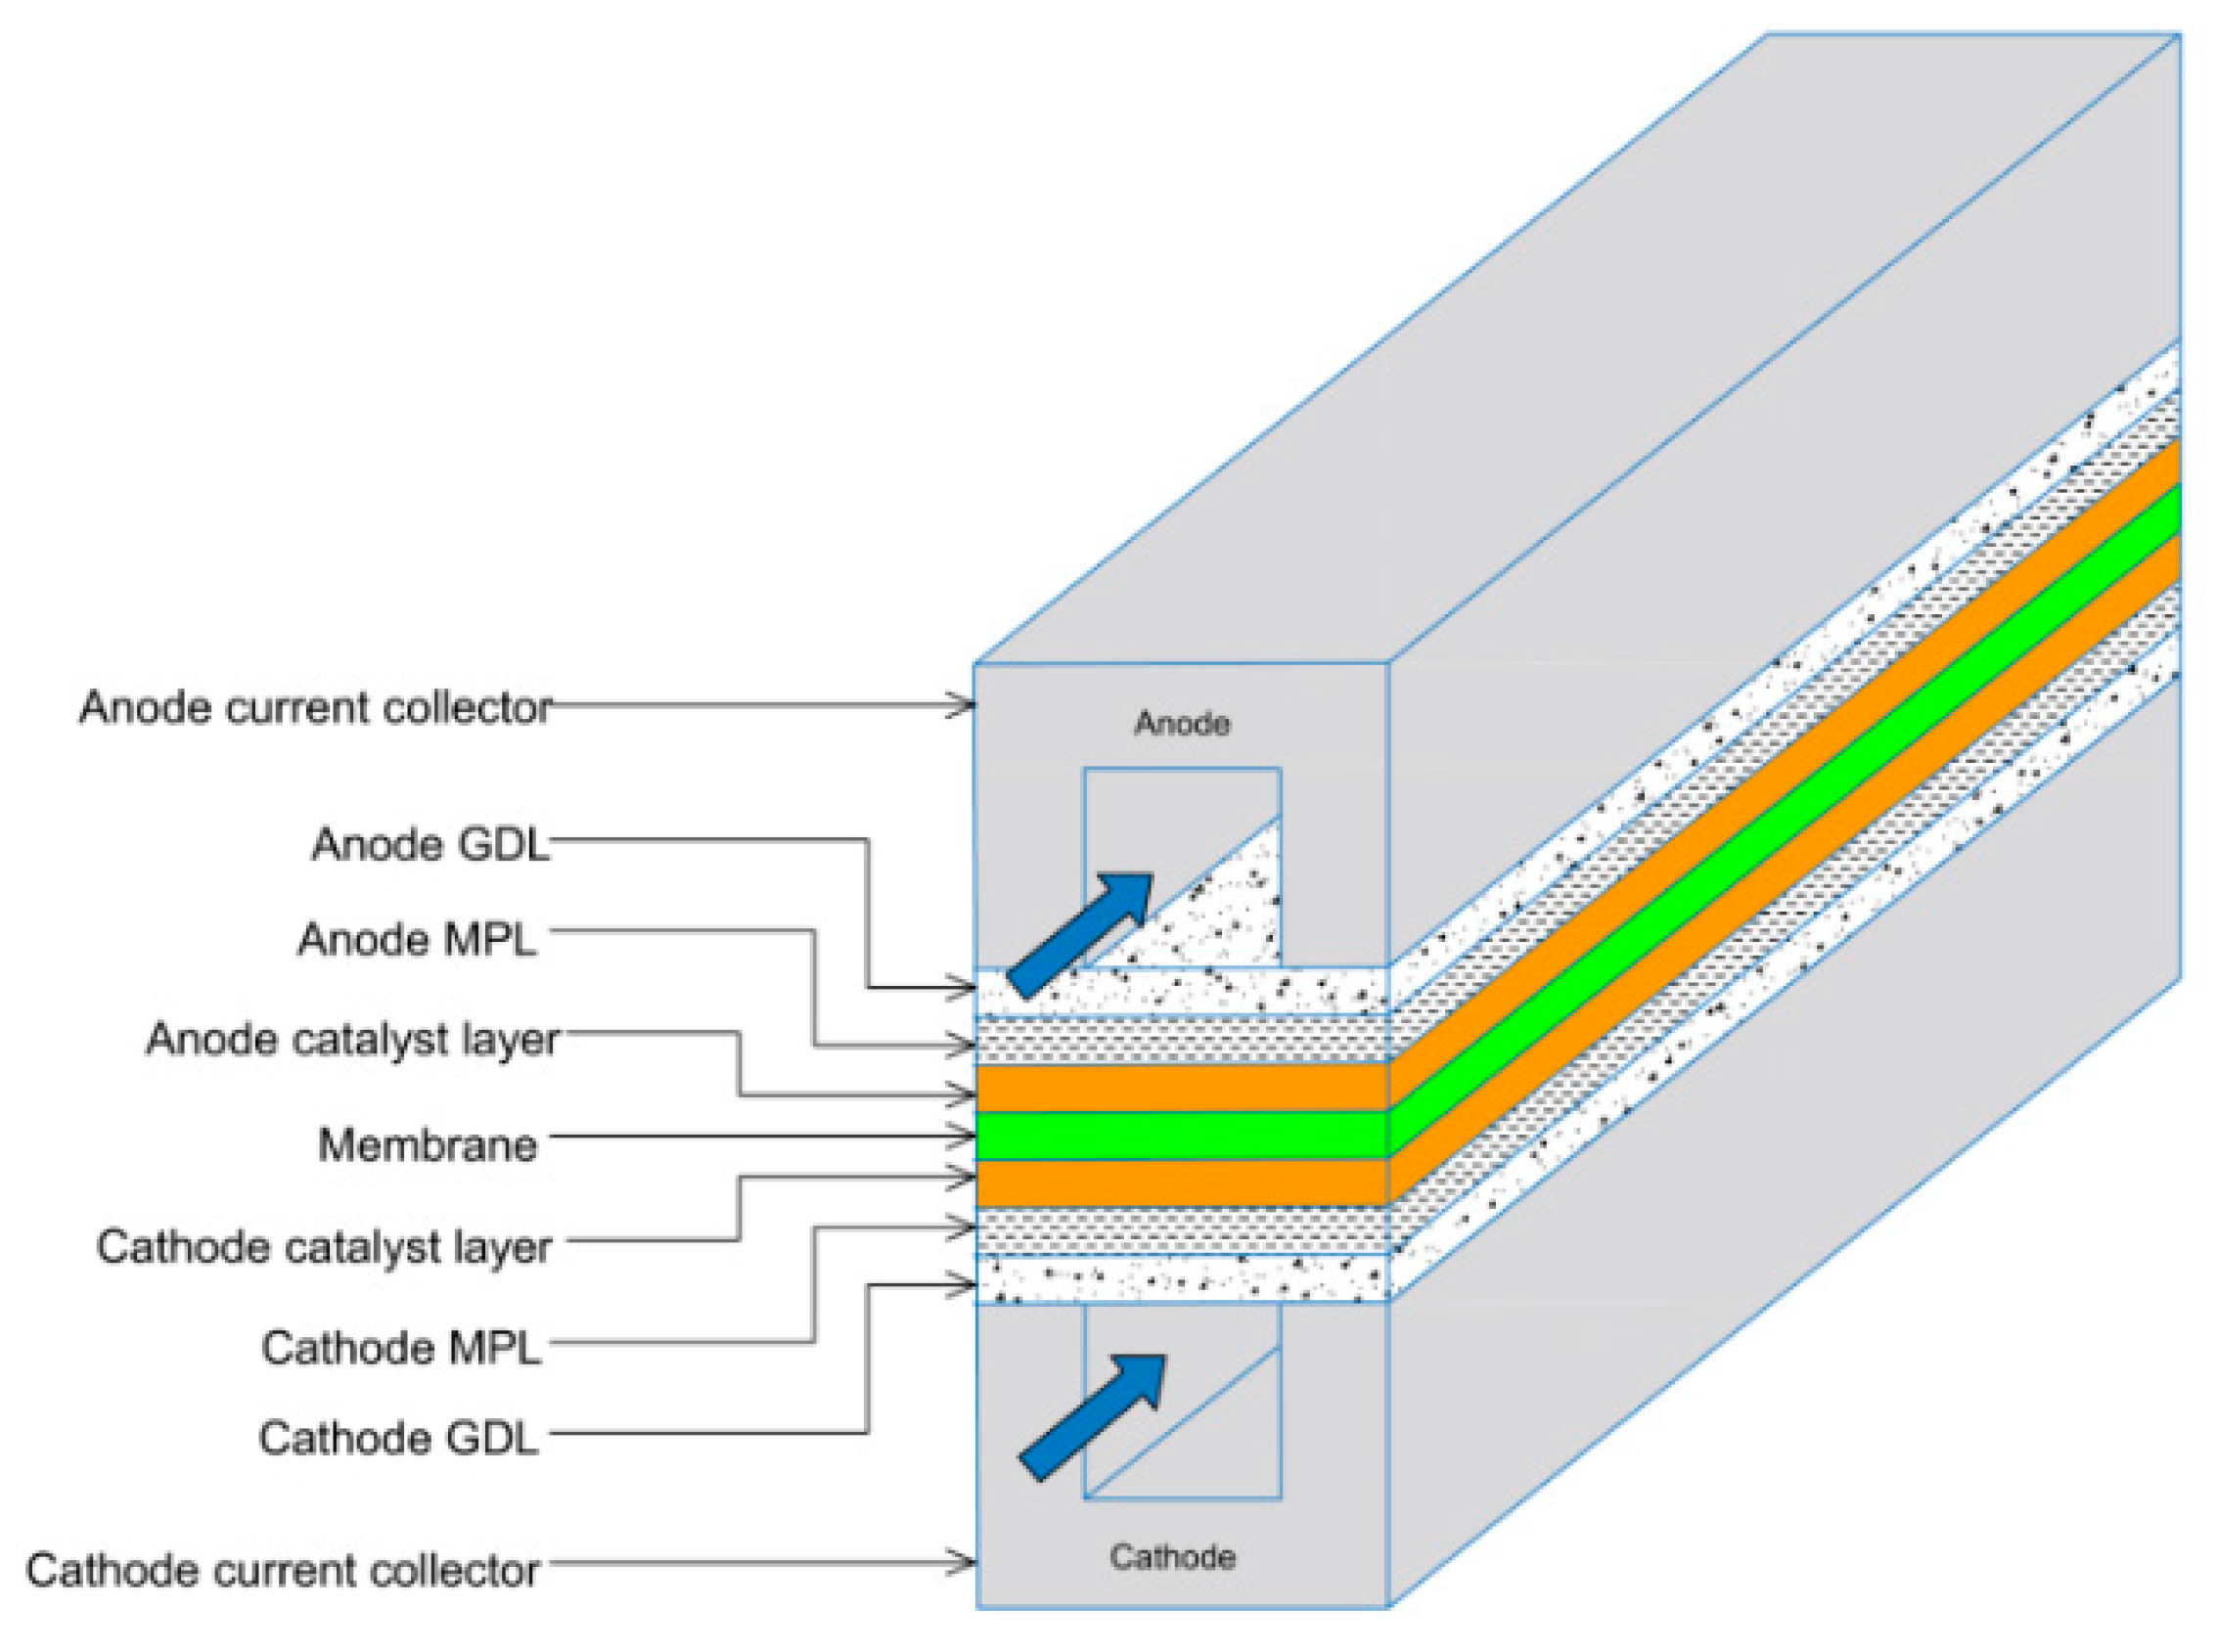
Typically, a microporous layer (MPL) is added to the GDL. MPLs comprise of a carbon black slurry combined with polytetrafluoroethylene (PTFE). It was found that MPLs, which are conventionally applied to the surface of the GDL facing the catalyst layer (CL), enhance water management within the membrane electrode assembly (MEA) [4,5] and boost electrical contact between the GDL and the catalyst layer [6,7], thus improving overall fuel cell performance [6,8]. Figure 1 shows a schematic representation of typical components of a PEMFC, including the GDL/MPL.

Figure 1.
Schematic representation of a PEMFC, highlighting key components, including the MPLs and the gas flow highlighted by the blue arrows [9].
Fuel cells experience irreversible and reversible losses. Irreversible losses are caused by entropy and deviations from operating conditions; these cannot be reduced. Reversible losses on the other hand, such as ohmic polarisation, can be minimised. Ohmic polarisation is caused by contact resistances between fuel cell components and the bulk resistances of conducting materials. Morphological and structural differences create transitional regions, increasing electrical contact resistance [10]. The GDL between the CL and bipolar plate (BPP) is particularly affected. Contact resistance in fuel cells depends on the material surface, roughness, and contact pressure between components. Netwall et al. [11] found that 55% of ohmic losses stem from interfacial contact resistances (GDL/BPP, GDL/CL and membrane/CL), while 45% come from bulk resistances. GDL/BPP and GDL/CL contact resistances have a significant impact on ohmic losses. Properly addressing these resistances is crucial to avoid substantial losses during fuel cell operation [12]. There have been many investigations into how best to decrease the contact resistance between the GDL and BPP; investigations have been carried out using simulations [9] and experimentation [7,13,14,15,16,17,18,19]. The main findings from these studies is that the contact resistance can be decreased with the application of an MPL, in particular, a double-sided MPL-coated GDL.
Nitta et al. [20] experimentally investigated the contact resistance between the GDL and the CL. They found that contact resistance at the GDL/CL interface decreases non-linearly with increased compression. They also showed that the contact resistance between the GDL/CL is between 14–60 times larger than the contact resistance between the GDL/BPP. On the other hand, Makharia et al. [13] used electrochemical impedance spectroscopy (EIS) to estimate the contact resistances GDL/CL and GDL/BPP [13]. The GDL was made from Toray carbon paper treated with PTFE. They estimated the contact resistance GDL/BPP to be around 13.0 mΩ.cm2 and the contact resistance GDL/CL to be around 3.4 mΩ·cm2 [13]. The reasons behind the discrepancy of the findings between Nitta et al. [20] and Makharia et al. [13] is that the former did not use an MPL whereas the latter researchers utilised an MPL coating on the GDL; this helped reduce the contact resistance at the GDL/CL interface.
Ismail et al. [7] found that the contact resistance decreased when an MPL coating was added to the GDL [7]. This is due to MPL conformability, which allows easier transfer of electrons. Additionally, the contact resistance was found to increase with increasing PTFE content [7]. This is due to PTFE being a natural electrical insulator. Therefore, the higher the PTFE content, the lower the overall conductivity of the GDL.
A three-dimensional numerical model of a PEMFC was developed by Okereke et al. [9]. The aim was to computationally investigate the effects of a double-sided MPL coating on the overall fuel cell performance and the distribution of the current and oxygen concentration within the cathode GDLs. The results revealed that the double-sided MPL coating significantly improved the fuel cell performance by up to 30%. However, neglecting the contact resistance between the MPL and the catalyst layer could result in an overestimation of performance by up to 6%. Additionally, the study found that the fuel cell’s performance and oxygen distribution were more sensitive to the porosity of the MPL facing the bipolar plate than the MPL facing the catalyst layer. Incorporating an extra MPL at the GDL–bipolar plate interface has the potential to greatly enhance the fuel cell performance.
The application of the MPL to the surface of the GDL facing the bipolar plate was shown to reduce the relevant contact resistance and improve the fuel cell performance. However, it is also possible for it to affect the removal of excess water. For example, Owejan et al. [14] investigated the addition a 50 μm free-standing MPL between the GDL and the bipolar plate, and it was shown that the performance of the fuel cell was reduced as the water was trapped between the layers. However, they only applied the MPL to the side facing the BPP. Also, the use of a free-standing MPL could have left cavities between the MPL and GDL in which water could accumulate. An improved solution would be to apply the MPL directly to the GDL to avoid these cavities. On the other hand, Wang et al. [15] used a carbon fibre paper (TGPH-030, Toray, Tokyo, Japan) as a macroporous substrate (MPS) and applied MPLs on both sides. The MPL was made from a composite of two different carbon blacks, acetylene black and black pearls 2000, with a 30 wt.% PTFE loading. It was shown that the double-sided MPL coating improved the fuel cell performance; the current density with a double-sided MPL coating was 1500 mA/cm2 and with the single-sided coating was 1300 mA/cm2 at 0.2 V. This is evidently due to the improved contact between the GDL and both the BPP and the CL [15]. It was also highlighted by Wang that the double-sided MPL coating allowed for a gradually changing porosity from the catalyst to the bipolar plate, thus maintaining satisfactory levels of mass transport management [15]. Maintaining a constant total MPL loading of 1 mg/cm2, the MPL loading of 0.7 mg/cm2 facing the CL and 0.3 mg/cm2 facing the BPP gave the best overall fuel cell performance [15].
Chang et al. [16] did a similar study and applied an MPL on both sides of the GDL. In this scenario, they did not keep the total carbon loading constant. An SGL 10BA carbon paper was used and three different carbon blacks were assessed to see which performed the best: acetylene black, black pearls 2000 and Vulcan XC 72B. The PTFE content was kept constant in all MPLs at 20 wt.%. It was found that acetylene black was the best performing carbon black. They then optimised the loading of acetylene black for the two MPL coatings [16]. They reported that an MPL loading of 1.25 mg/cm2 facing the CL and 0.25 mg/cm2 facing the BPP gave the best fuel cell performance. The PTFE content was also examined and it was found that a loading of 20 wt.% was the most effective. The double-sided MPL coating with 1.25/0.25 mg/cm2 loading could reach a maximum power density of 900 mW/cm2 compared to a conventional single-sided MPL coating (with 1 mg/cm2 loading) which had a maximum power density of 750 mW/cm2 [16]. The authors showed that there is an optimum ratio of loading before the fuel cell performance starts to decline due to the GDL becoming significantly thick and suffering from mass transport losses.
Huang and Chang [17] further investigated the double-sided MPL coating under different humidity conditions. SGL 10BA carbon paper was coated on both sides with an acetylene black MPL with different carbon and PTFE loadings. Different amounts of MPL carbon loadings on both sides of the GDL were tested. The results showed that over a large range of relative humidities, the optimum MPL loading was 1.2 mg/cm2 facing the CL and 0.3 mg/cm2 facing the BPP [17]. This again showed that a small amount of MPL loading facing the BPP is beneficial for improved fuel cell performance, not only at low relative humidities but also when the relative humidity of the air is high. The PTFE content was also examined. It was found that the optimal PTFE loadings are the same on both sides of the MPL: 20 wt.% [17]. The peak power density at very low air relative humidity conditions, 13.6% RH, was 0.28 W/cm2 for a single-sided MPL coating, whereas it was 0.52 W/cm2 for the double-sided MPL coating, which is an 85% increase [17]. Furthermore, EIS showed that the double-sided MPL at an optimum composition always exhibits the lowest ohmic resistances [17].
Further research is needed to fully understand the potential of double-sided MPL-coated GDLs in reducing contact resistances and minimising the need for increased compression in fuel cells. The existing investigations primarily relied on polarisation curves and EIS, providing limited insights. This study aims to comprehensively characterise double-sided MPL-coated GDLs through ex situ and in situ analyses, including measurements of pore size distribution, permeability, porosity, contact angle, morphology, electrical conductivity, as well as polarisation curves and EIS.
2. Materials and Methods
2.1. Fabrication Procedure
The GDL used for all of the samples was Toray Carbon Paper 060 PTFE 10 wt.% (Fuel Cell Earth, Woburn, MA, USA). Two different types of carbon black were used for the MPL coatings: Ketjenblack and Vulcan Black XC 72 R (Sigma Aldrich®, Gillingham, UK). The categories of samples that were used for the characterisations are shown in Table 1.

Table 1.
GDL samples prepared for the investigation.
For the coated GDLs, the loadings of 1.25 mg/cm2 and 0.25 mg/cm2 were selected based on the previous study by Chang et al. [16,17]. The PTFE content in all of the MPLs was kept constant at 20 wt.%. Carbon black (800 mg), 60 PTFE wt.% dispersion (200 mg) (Sigma-Aldrich®, Gillingham, UK), methyl cellulose (Sigma Aldrich®, Gillingham, UK) and Triton X 100 (21.6 µg) (Sigma Aldrich®, Gillingham, UK) were mixed with deionised water. The solution was magnetically stirred at 800 rpm for half an hour with small additions of deionised water until a viscous consistency was achieved. This amount of MPL ink would then be enough to make up to 5 samples of a single-sided MPL-coated GDL.
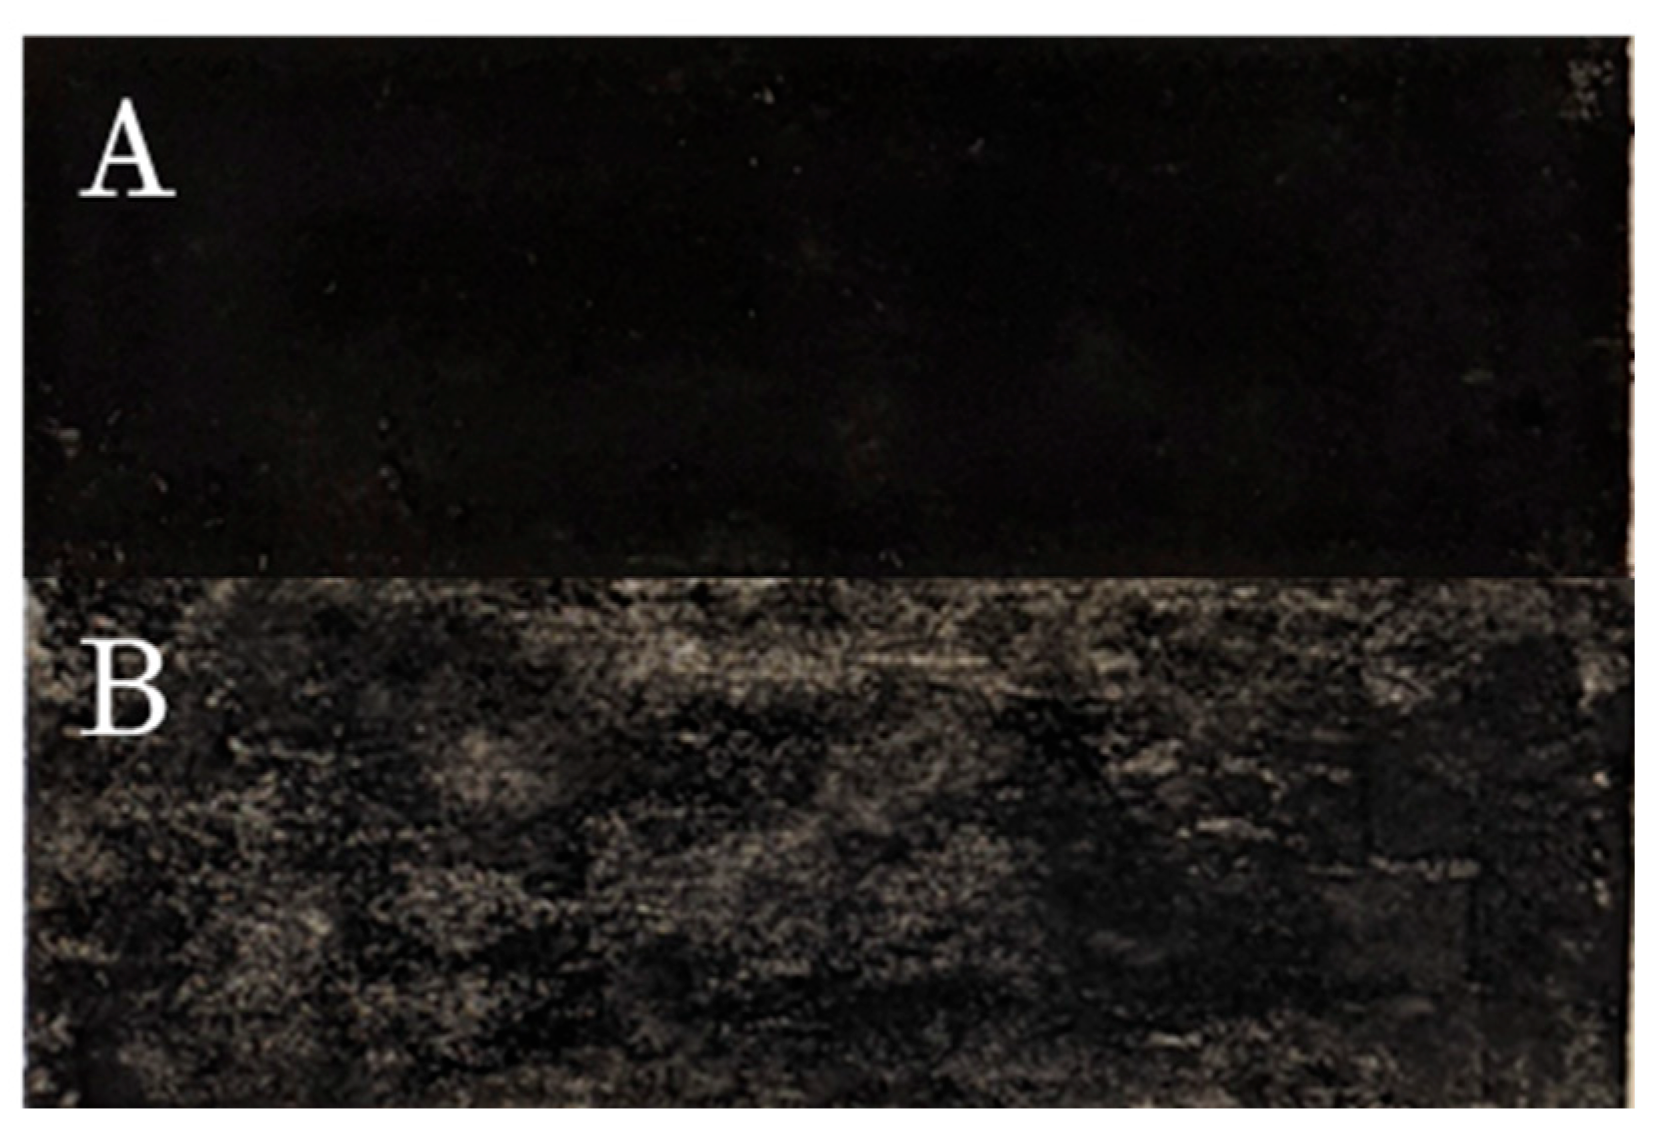
The Toray carbon paper was secured to a hot plate, which was set at 90 °C. MPL slurry was applied to one side of the GDL, and doctor blade apparatus was used to spread it evenly across the surface. This was repeated until the desired MPL loading was achieved. The samples were sintered in a furnace at 350 °C for half an hour with a flow of nitrogen at 1 bar. Each category described in Table 1 was comprised of 5 samples with dimensions of 7.0 cm × 2.5 cm. In the case of the double-sided samples, the 1.25 mg/cm2 loading was applied first. The sample was allowed to dry thoroughly before being flipped and the 0.25 mg/cm2 coating applied to the opposite side. This was to ensure that the first side had dried out properly so that it would not be damaged when the 0.25 mg/cm2 coating was applied. All of the MPL slurries contained PTFE at 20 wt.%. Figure 2 shows photos of the double-sided MPL coating carried out in the laboratory. The example shows Ketjenblack used for the MPL coating; image A shows a 1.25 mg/cm2 loading and image B a 0.25 mg/cm2 loading. It can be seen via visual inspection that side B has less coverage than side A. However, it still has good overall coverage over the GDL substrate. This will be investigated further with scanning electron microscope (SEM) imaging.
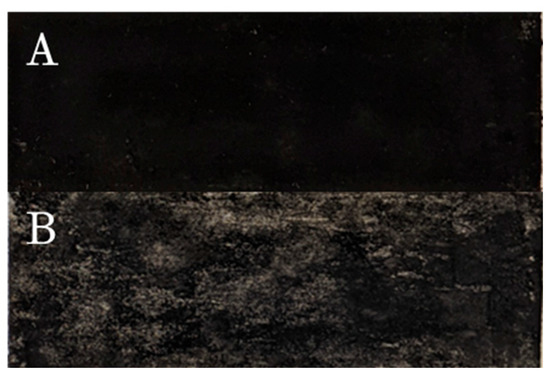
Figure 2.
Picture of the two sides of a double-sided MPL-coated GDL. Featuring Ketjenblack. (A) 1.25 mg/cm2; (B) 0.25 mg/cm2.
2.2. In-Plane Electrical Conductivity
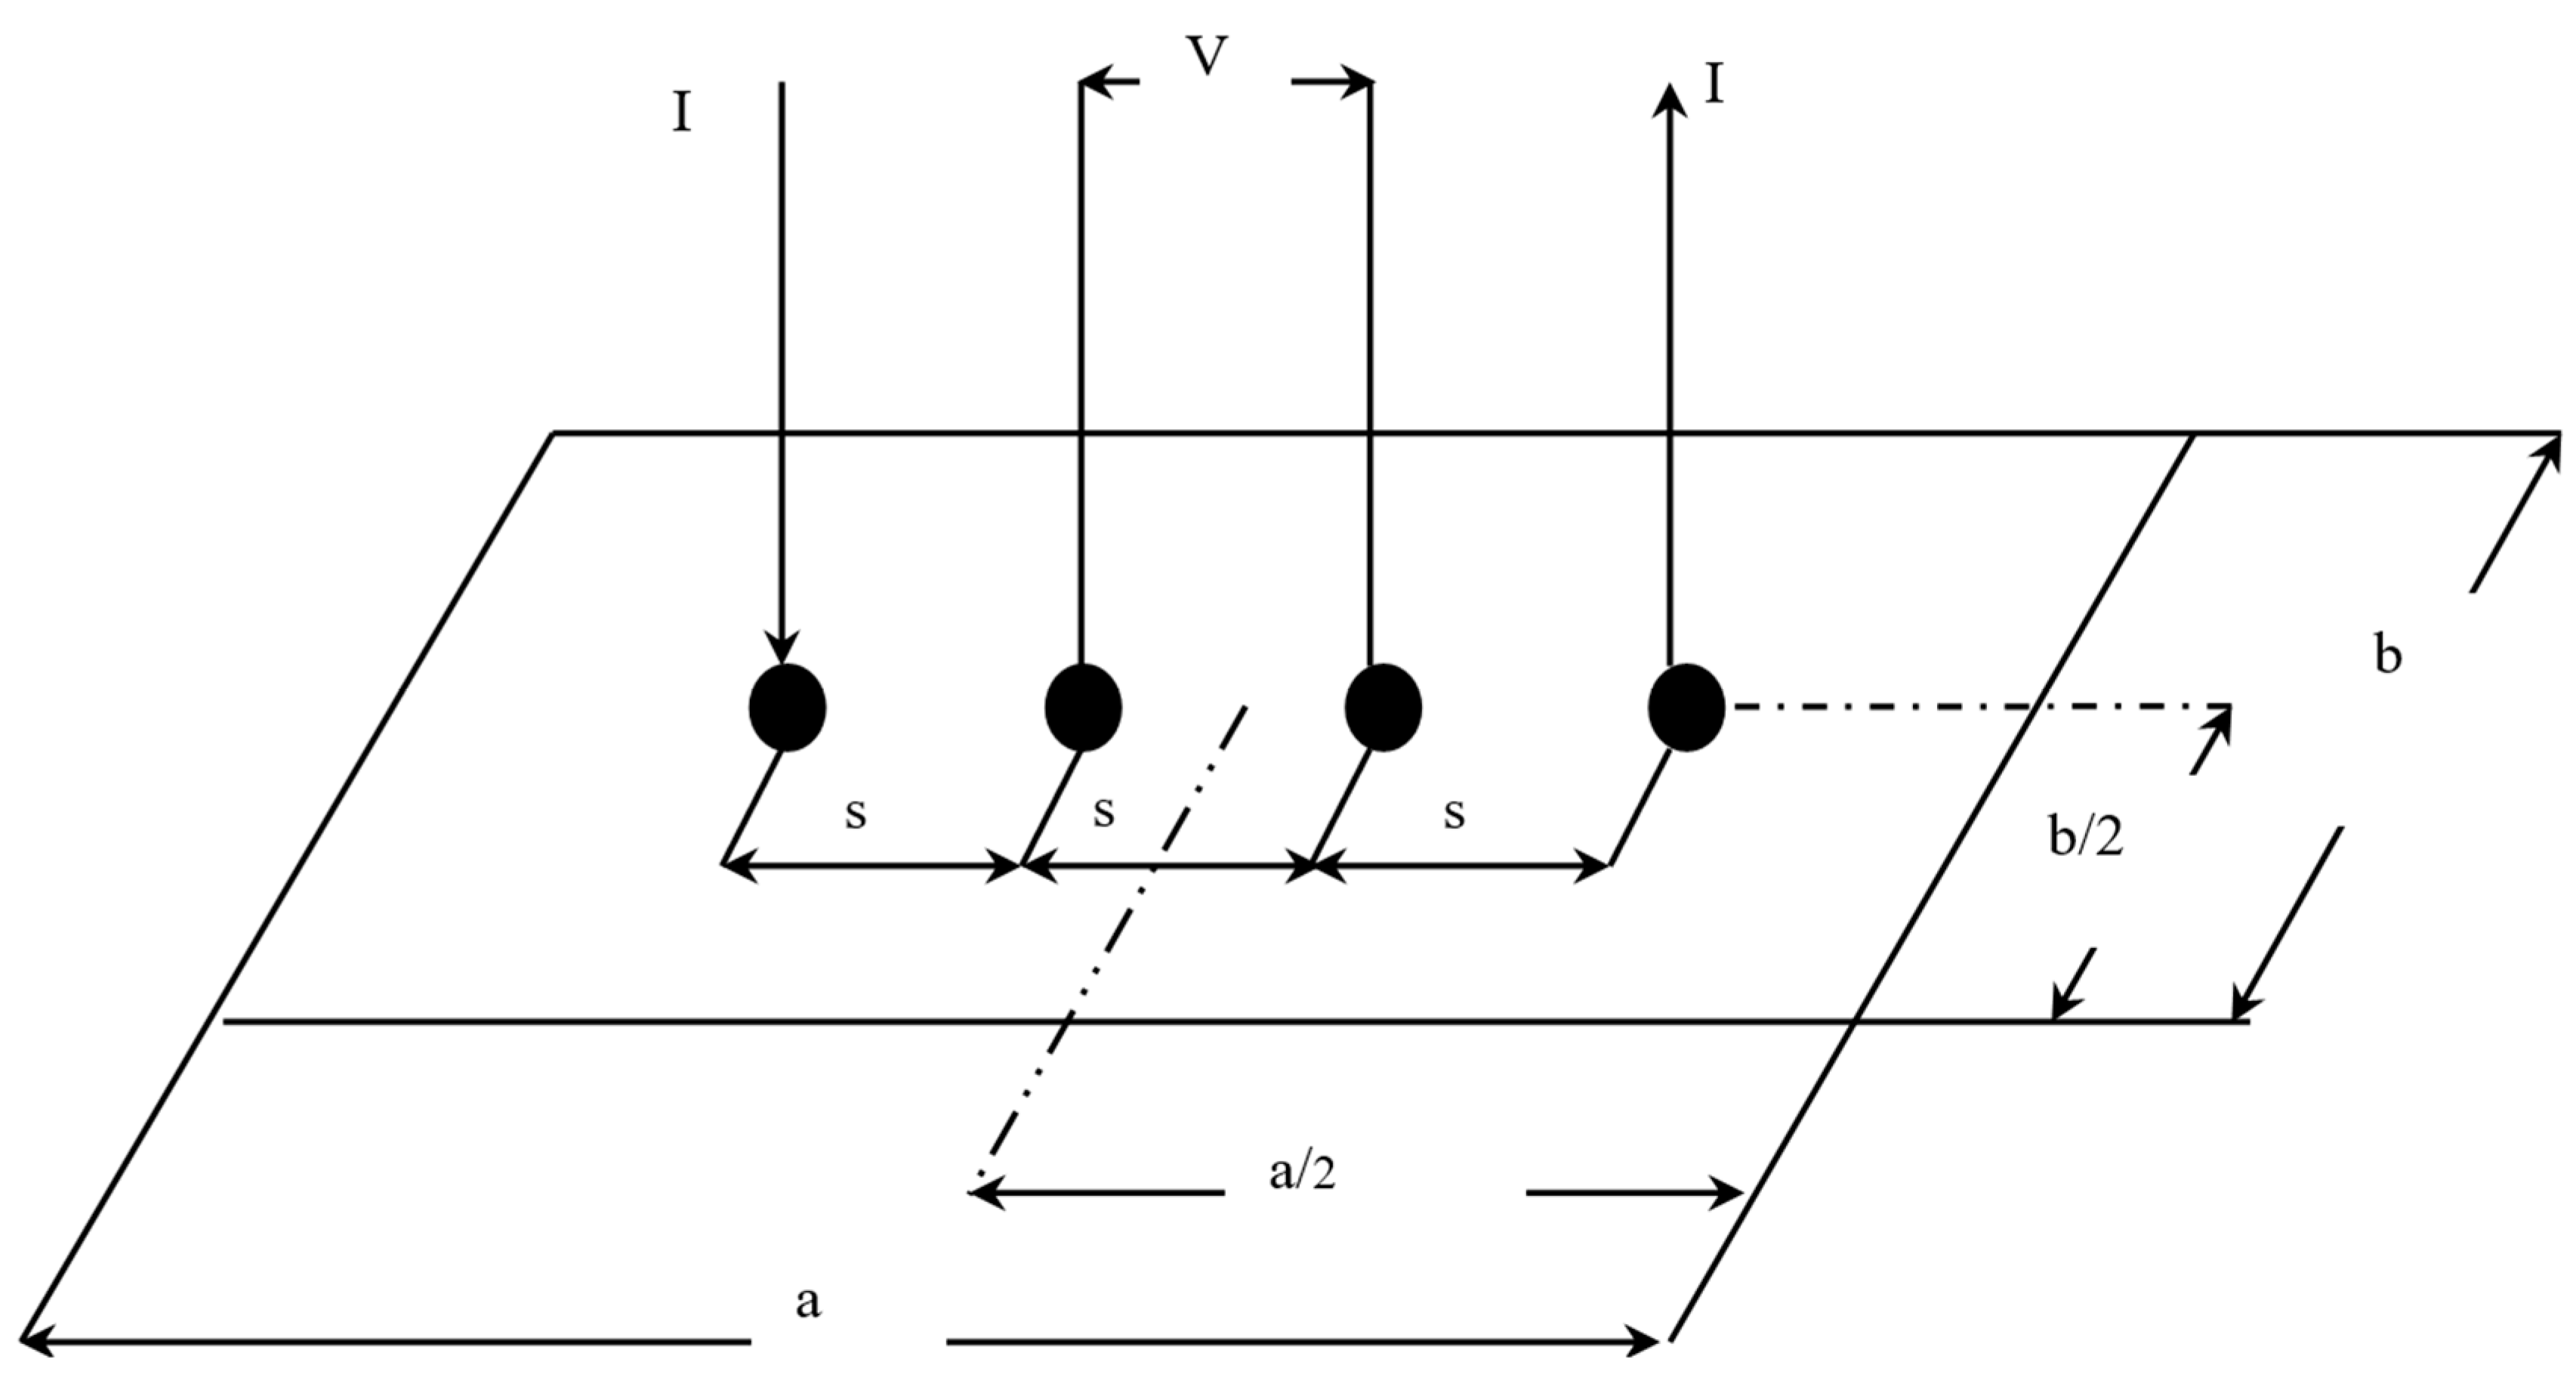
The in-plane conductivity of the GDL samples was measured using the 4-probe method as described by Smits [18]. To experimentally measure the electrical conductivity of a sample, the method uses four probes spaced at equal intervals, as shown in Figure 3.

Figure 3.
In-plane electrical conductivity experimental setup [7].
The correction factor also needs to be evaluated; it is a function of two ratios. The first ratio is between the length of the sample and its width (a/b). The second shows the ratio between the width of the sample and the spacing between the probes (b/s) [18]. In this study, these ratios were found to be 3 and 1.25, respectively. This gave a correction factor of 0.9973. The resistivity () can be calculated using the following formula [18]:
where is the correction factor, is the thickness of the sample and is the electrical resistance. Following this, the electrical conductivity, , of the GDL can be found via the reciprocal of the resistivity:
Sample thickness was measured using a micrometre. However, the GDL thickness varied from one GDL type to another and even from one sample to another. Also, within the sample itself, there was a slight variation in the thickness from one position to another. Therefore, the thickness of each GDL sample was measured at five equally spaced positions and the average value was taken. Following this, the GDL samples were positioned on an insulating plate. Copper electrodes (10 mm × 10 mm × 5 mm) were then placed onto the GDL sample. The distance between the probes was kept constant; this was done by fixing the probes in a rectangular plastic body. The spacing between the probes was 2 cm. A high-resolution ohmmeter (RS Pro 804, RS Components, London, UK), with a resolution of 0.01 mΩ, was used to read the electrical resistance of the sample. An electrical current passed through the sample via the copper electrodes, and the voltage between the internal probes (see Figure 3) was measured. This allows for the resistance to be calculated using Ohm’s law.
2.3. Permeability
Permeability can be estimated using Darcy’s law. Darcy’s law states that a flow rate () through a porous substance is equal to the product of the permeability (), cross sectional area () and pressure drop () divided by the product of the viscosity () and thickness () of the sample [19].
The permeability can be measured experimentally; Figure 4 shows an experimental setup used by Orogbemi et al. [21]. The GDL sample is clamped between two plates in the middle of the lower fixture, and nitrogen is then passed through using a mass flow controller [21].
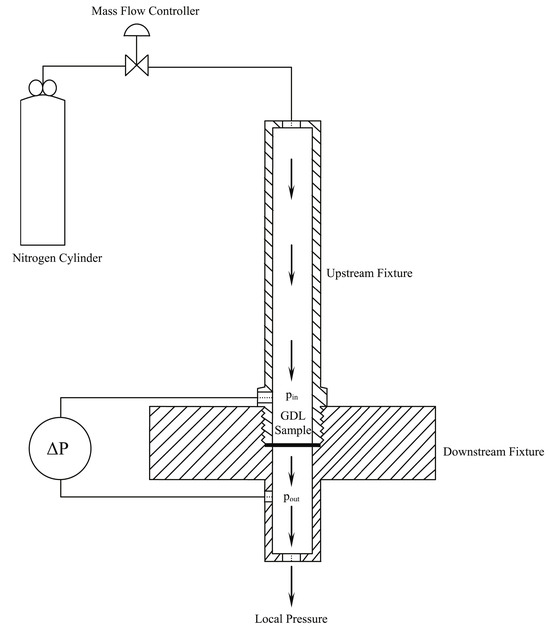
Figure 4.
Experimental setup used to measure through-plane permeability [21].
The experimental setup depicted in Figure 4 consists of two fixtures, one positioned upstream and the other downstream. This arrangement allows for the controlled flow of air through the sample, with the resulting pressure drop being measured. The sample used was obtained using a circular punch with a diameter of 25.4 mm. However, when the sample is fixed between the fixtures, only a 20 mm diameter area is exposed to the airflow. To ensure accurate measurements, the pressure drop is recorded at multiple flow rates, using extremely low rates to minimise inertial losses, which enables the use of Darcy’s Law. To control the flow rate of nitrogen gas, an HFC-202 flow controller is utilised, providing a range of 0.0–0.1 SLPM (standard litre per minute). The pressure difference across the sample is measured by employing a PX653 differential pressure sensor, capable of measuring within a range of ±12.5 Pa. By applying Darcy’s Law (Equation (3)), the gas permeability of the sample can be calculated. The permeability is determined for each sample at different flow rates; then, the average value is calculated. The entire process is repeated for all five samples in each category, as outlined in Table 1.
2.4. Pore Size Distribution
Pore size distribution is an important characteristic to understand as it provides insights regarding the mass transport modes of gas and liquid water within the fuel cell porous media. Further, it is a major parameter when it comes to modelling and optimisation of mass transport processes in the fuel cell [22]. Mercury intrusion porosimetry (MIP) is a widely used method to determine the pore size distribution within a material. It is based on the high surface tension of mercury. In the process of MIP, a small sample of the GDL is immersed in mercury. Due to the high surface tension of mercury, it does not readily enter the pores of the GDL. The pressure on mercury is then increased in increments. This causes the mercury to enter into the pores of the GDL; the larger pores are initially filled, gradually followed by subsequently smaller pores [22]. The pore size distribution is found by measuring the intrusion pressure of the mercury, which is inversely proportional to the pore size. A key assumption made when using this method is that the pore shape is cylindrical. Also, MIP does not account for closed pores. However, this is acceptable when considering carbon papers [23]. The pores of a GDL typically fall into three main categories: pores with radii less than 50 nm are micropores, pores with radii ranging between 50 and 7000 nm are mesopores and pores that have a radius larger than 7000 nm are designated as macropores [24]. The GDL mainly consists of macropores [25], but the addition of an MPL can influence the pore size distribution by increasing the amount of micropores and mesopores. In general, macropores facilitate the diffusion of gases, whereas micropores allow for the removal of liquid water [26].
2.5. Contact Angle
The contact angle is a measure of the wettability of the material in question. If the contact angle is less than 90° the substance is considered hydrophilic. A contact angle greater than 90° and the substance is deemed hydrophobic [27]; see Figure 5. Determination of the contact angle for the samples was carried out using the sessile drop method. Single drops of water were placed on the surface of the GDL sample. High resolution photographs were then taken within the first three seconds of the droplet settling on the surface in order to account for the transient behaviour of the water [26]. Contact angle values were then measured. Each sample underwent five measurements and then an average value was taken.
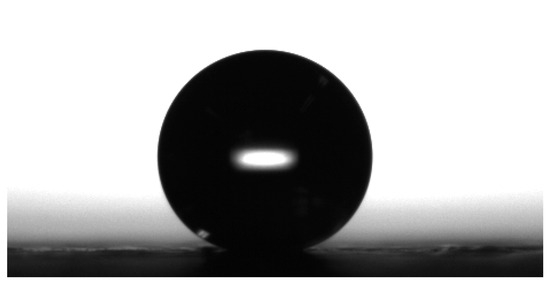
Figure 5.
A typical water droplet on a surface of a GDL sample.
2.6. Morphology
SEM imaging is a good way to analyse the surface morphology and fibre structure of the GDL/MPL. The SEM micrographs often assist in analysing the characteristics of the GDL materials and/or the fuel cell performance [1,28,29]. The morphological characteristics of the GDL were analysed using a scanning electron microscope (JEOL, Tokyo, Japan—Model JSM-6010LA). GDL samples were cut into 1 cm × 1 cm squares. The squares were then attached to SEM stubs and secured in the specimen stage. The SEM was then set at 10 kV, and each sample was examined at various magnifications.
In order to obtain the cross-sectional images of the GDL samples, the samples were first frozen in liquid nitrogen and then cut with a scalpel. This helped preserve the cross section of the GDL for clear imaging.
2.7. In Situ Fuel Cell Testing
The membrane electrode assembly (MEA) was prepared by assembling the cathode and anode side GDLs with the catalyst coated membrane (CCM). The samples of GDLs coated with MPLs investigated in this study were placed on the cathode side, while Freudenberg H2315 C2 MPL-coated GDL was placed on the anode side. A CCM (Johnson Matthey, London, UK) was used, comprising a 211 Nafion membrane with a thickness of 25 µm. Catalyst layers with a platinum loading of 0.2 mg/cm2 were applied to both sides of the Nafion membrane. The active area for the fuel cell was 2.25 cm × 2.25 cm. The MEA was then hot pressed at 140 °C for 2 min. The MEAs were fitted into a PaxiTeck single cell fixture. This consisted of graphite monopolar plates containing a single serpentine flow field channel measuring 1 mm in width and depth. The current collector plates were made of gold-plated copper, while the end plates were made of aluminium, which allowed for the use of electric heating elements to separately control the anode and cathode temperatures. The cathode graphite monopolar plate was fitted with a negative temperature coefficient (NTC) sensor to measure the cell temperature, while the cell potential was measured between the monopolar plates. The cell was connected to a Bio-logic FCT-50S test station that had a maximum load current of 50 A and 250 W power, which was computer-controlled using FC-lab® software (version number 5.11). The reactant temperature and humidity were regulated by sensors and electrical heaters, which measured and controlled the temperature of the anode and cathode humidifiers and reactant lines. The fuel cell system operated with a specific backpressure of 1.5 bar on the anode side and 1.3 bar on the cathode side. Gas flow rates were set based on stoichiometric ratios. For hydrogen, the stoichiometry ratio is 1.3, resulting in an estimated flow rate of 120 mL/min. For air, the stoichiometry ratio is 1.5, leading to a flow rate of approximately 300 mL/min.
The fuel cell was then set to a temperature of 80 °C. The inlet gas humidifiers (hydrogen and air) were also set at 80 °C; this was subsequently changed in order to vary the relative humidity conditions. Following this, the polarisation and EIS data were collected for four different relative humidity (RH) conditions: 25, 50, 75 and 100%.
3. Results and Discussion
3.1. In-Plane Electrical Conductivity
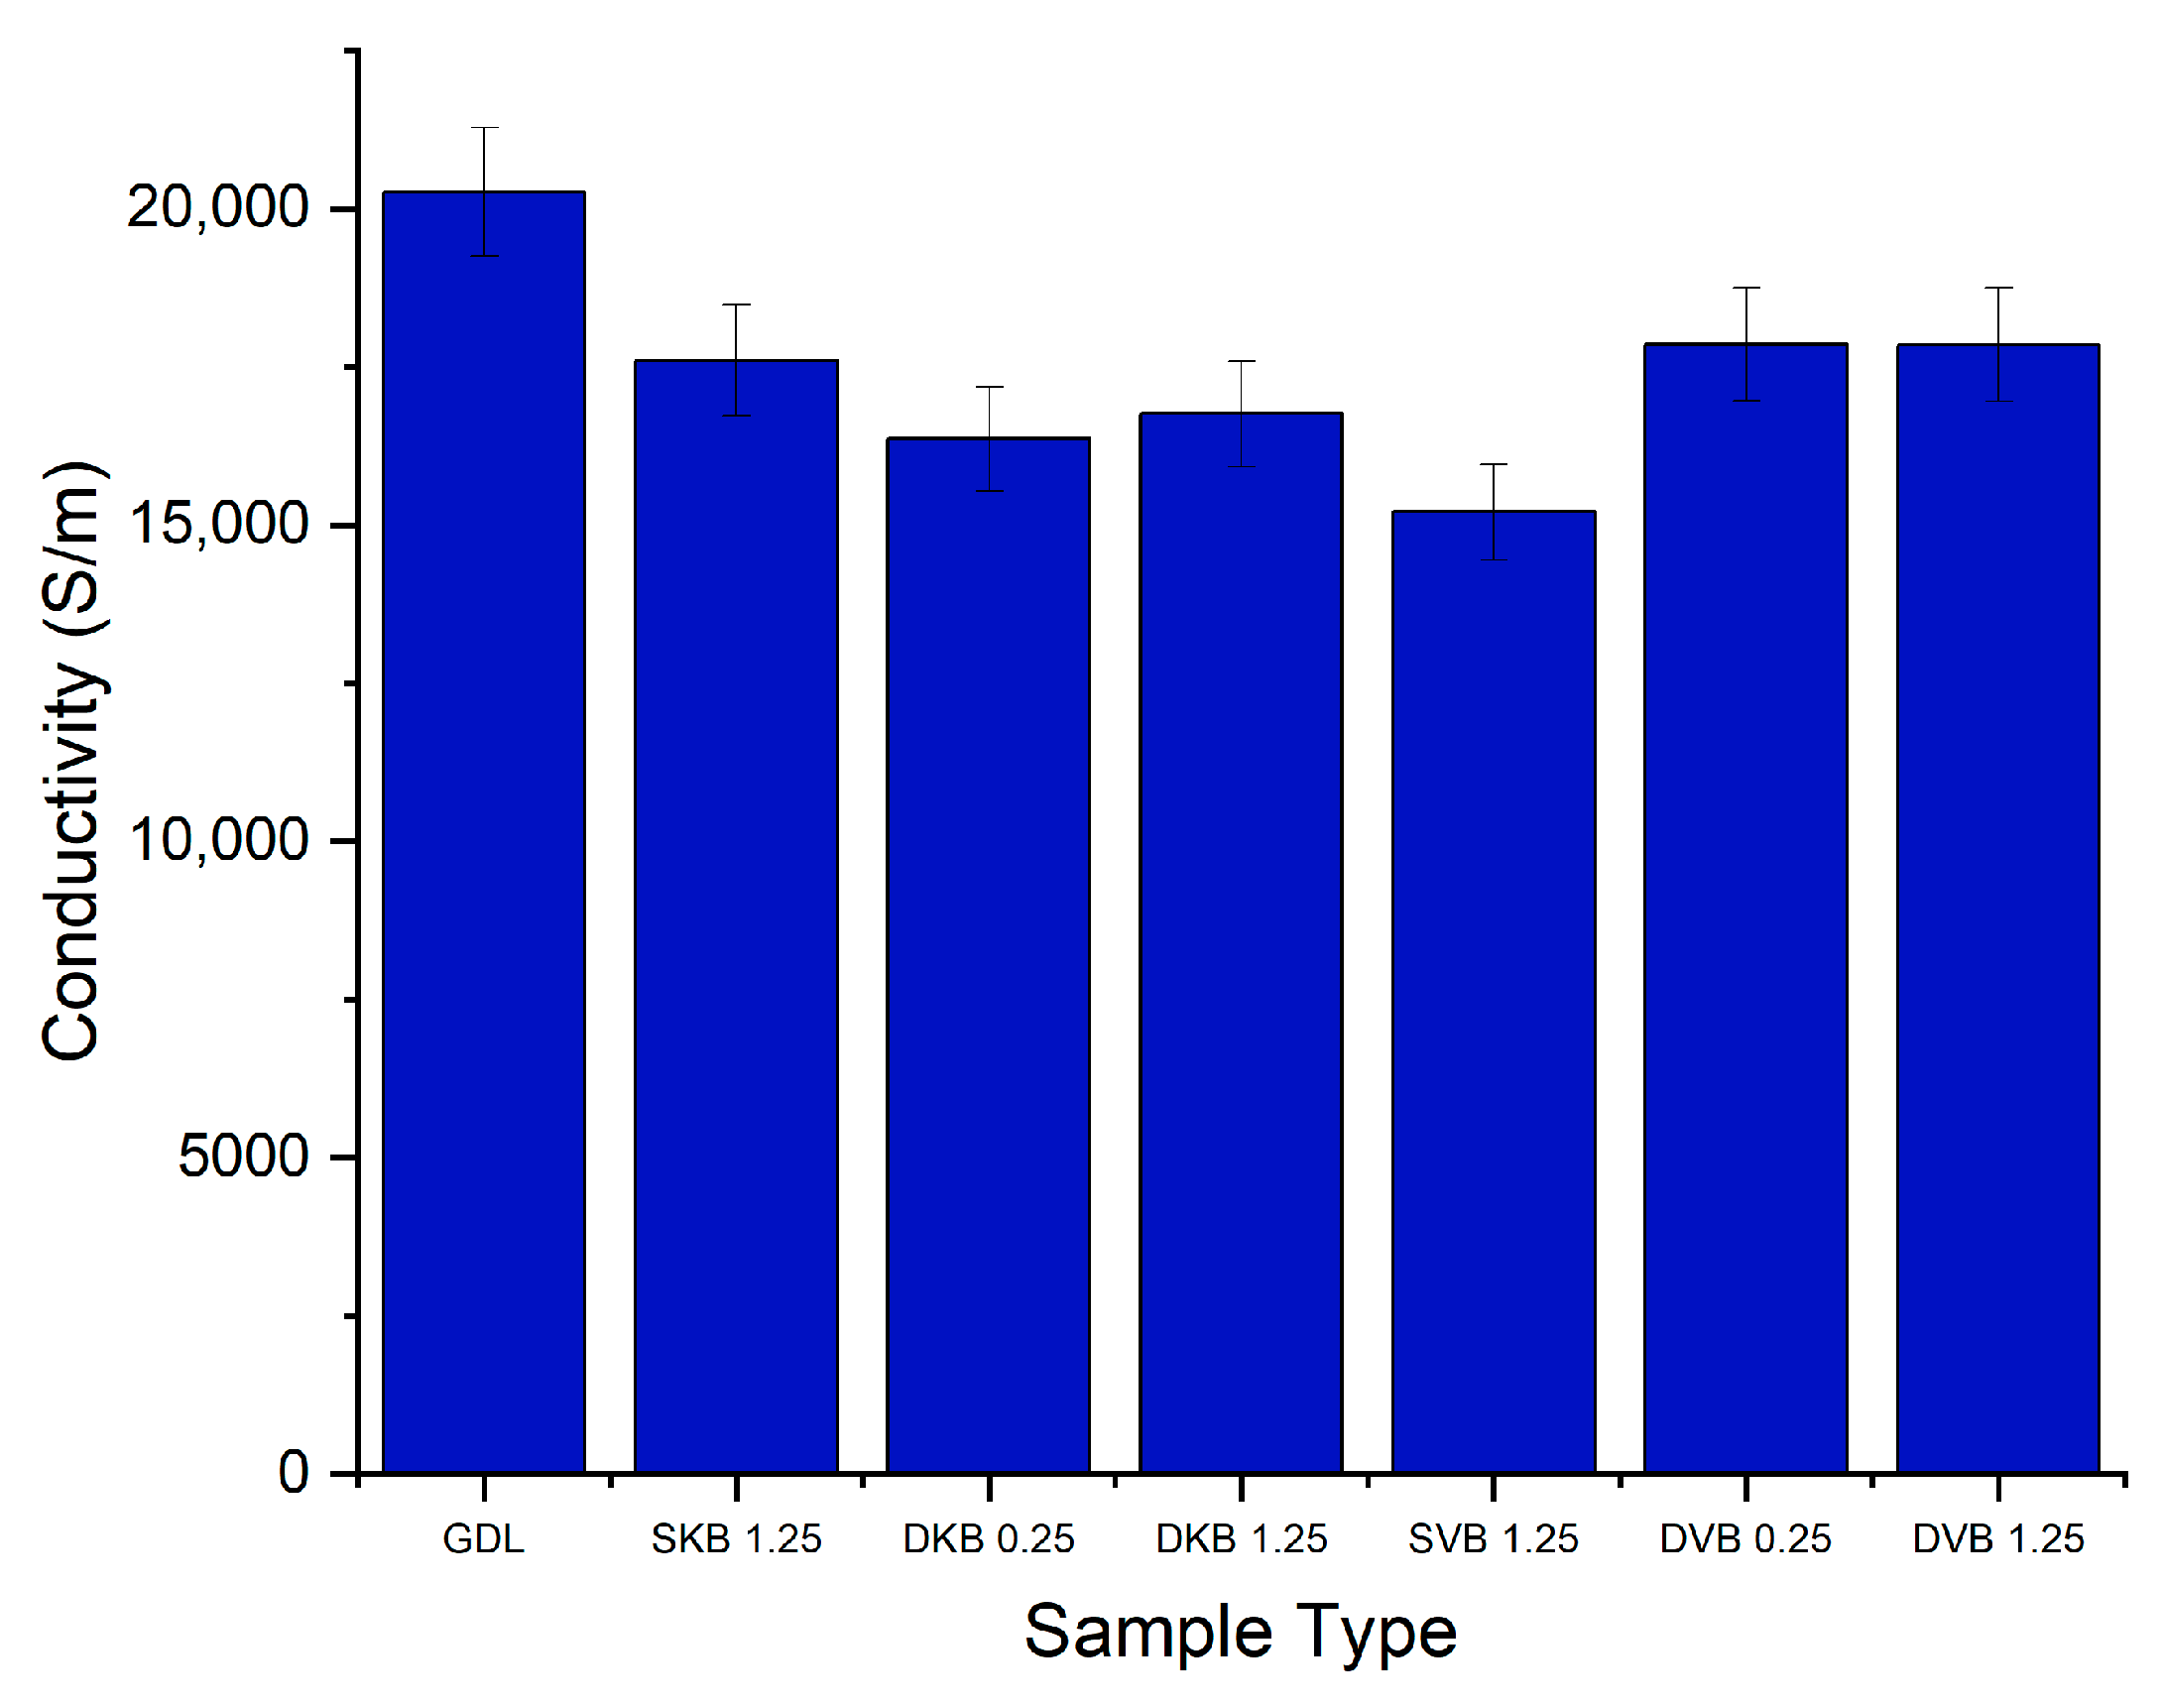
The in-plane conductivity was measured for all five samples of each category of GDL. Each sample was measured five times and the values of the resistance were averaged. The results for the in-plane conductivity per category are displayed in Figure 6. It can be seen from the results that there is a difference of around 5000 S/m between the highest value and the lowest value for the average conductivity. In general, there are no recognisable trends: regardless of loading or the fact that it is single sided or double sided. The conductivities of all the MPL-coated GDL samples are similar to each other and are within the error bars ranges. Notably, the in-plane conductivity of all the MPL-coated GDLs is less than that of the uncoated GDL. This could be attributed to the fact that the MPLs contain a sizable amount of the electrically insulating PTFE (20 wt.%) compared to the carbon substrate (10 wt.%). It is noteworthy that the conductivity of the uncoated GDL (~20,000 S/m) fits closely with values from literature for the same type of Toray GDL [24]. It should also be noted that the through-plane conductivity of the MPLs applied to the GDL is highly expected to be similar to the in-plane conductivity; this is due to the uniformity of the MPL structure.

Figure 6.
In-plane electrical conductivity of the tested GDL samples. Note that the numbers correspond to the MPL loading on either the GDL side facing the catalyst layer or the side facing the bipolar plate.
3.2. Gas Permeability
Figure 7 shows the permeability values for the different samples. It can be immediately seen that there is almost one order of magnitude difference between the permeability of the uncoated GDL and the permeability of the MPL-coated samples; this is due to the addition of the less porous MPL to the carbon substrate. Interestingly, the results show that the gas permeability of the coated samples is more sensitive to the type of carbon black than to the GDL being single-sided or double-sided MPL coated. Namely, the permeability of the Ketjenblack GDL samples is significantly higher than that of the Vulcan black GDL samples. This difference is most likely due to the presence of a higher volume fraction of macropores in the former samples, as will be demonstrated in the next section. Furthermore, it appears that the addition of a second MPL does not make a significant difference to the mass transport resistance of the GDL sandwich. This is most likely due to the relatively low loading of the second MPL (0.25 mg/cm2).
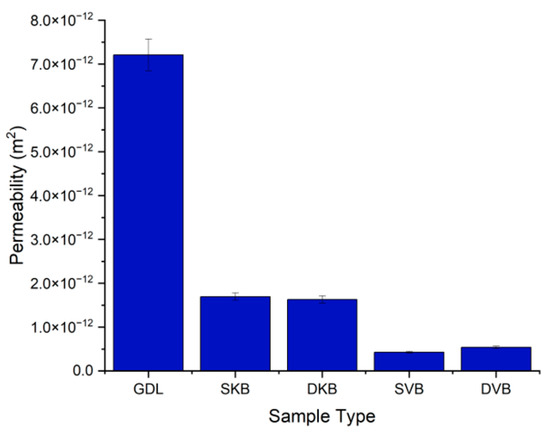
Figure 7.
Gas permeability of the tested GDL samples.
3.3. Pore Size Distribution
The results of the MIP tests are displayed in Figure 8, which shows a wide distribution of pore sizes. This is in line with literature, as it has been found in previous studies that the microstructure of a GDL is anisotropic with a wide range of pore sizes [30]. Figure 8 also shows that the gas diffusion layer has a distinctive change of pore size distribution once the MPL coating is applied. To identify these structural changes in pore size, Figure 8 has been divided into three pore categories: micropores, mesopores and macropores. They are divided based on the categories discussed above. It was found that the micropores and mesopores expectedly arise upon applying the addition of the MPL. The first observation is that the volume and size of the macropores decrease with the addition of an MPL. It could also be seen that the Ketjenblack samples, both with a single-sided or double-sided coating, have only micropores. On the other hand, the Vulcan black samples were shown to have both micropores and mesopores. Furthermore, as expected, the volume of the micropores and/or mesopores were found to increase with the addition of the second 0.25 mg/cm2 MPL; see Figure 8b. The variation appears to affect the efficiency of removing liquid water from the GDL to the flow channel, which, as demonstrated in the final section, subsequently influences fuel cell performance.
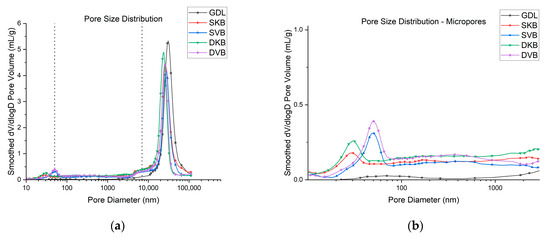
Figure 8.
(a) Pore size distribution of the tested GDL samples and (b) micropores and mesopores ranges of the samples.
Moreover, Table 2 displays the porosity and the average pore diameter for each of the samples. The introduction of an MPL to the samples results in an overall reduction in porosity. This outcome is in line with expectations, as when the MPL is applied, it will naturally fill in the pores of the carbon substrate. Comparatively, there is a minimal difference between the porosities of the samples when looking at the type of carbon black used. There is also little difference between the single-sided and double-sided configurations. However, it can be seen that when a second coating is applied, there is a reduction in porosity. Ketjenblack experiences a 3.8% reduction in porosity when the second MPL is applied and Vulcan black shows a 2.1% reduction. The average pore diameter of the samples also shows a reduction when the MPL is applied. There is not much difference in the average pore diameter between the single-sided or double-sided configurations. The average pore diameter is more sensitive to the type of carbon black used than to the coating configuration. Ketjenblack exhibits a significantly smaller average pore size in comparison to Vulcan black.
Table 2.
The porosity and average pore diameter of the GDL samples.
3.4. Contact Angle
From the contact angle measurements (Figure 9), it can be seen that the addition of an MPL generally increases the contact angle. The uncoated sample of the GDL measures at 138° and the coated samples measure between 139° and 142°. This could be clearly attributed to the high amount of PTFE loading in the MPL (20 wt.%) compared to the carbon substrate (10 wt.%). Further, for the double-sided MPL-coated GDLs, the 1.25 mg/cm2 side was found to demonstrate a slightly higher contact angle than the 0.25 mg/cm2 side. This is most likely due to the fact that, as will be shown in the following micrographs, the MPLs with 0.25 mg/cm2 do not fully cover the surface of the carbon substrate, thus allowing for the structure of the carbon substrate (which has a lower contact angle) to lower the contact angle of the latter MPL.
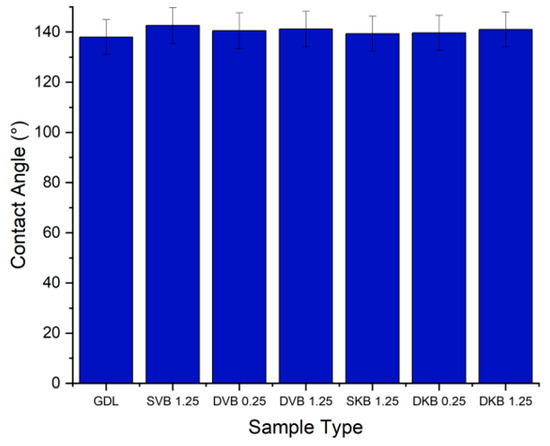
Figure 9.
Contact angle of the tested GDL samples.
3.5. Morphology
The SEM images used to examine the morphology of the samples are displayed in Figure 10 and Figure 11. Figure 10 shows the uncoated Toray GDL and the conventional single coating of an MPL of Vulcan black and Ketjenblack with an MPL loading of 1.25 mg/cm2. Figure 11 shows both sides of the double-sided coating of the MPL for both Ketjenblack and Vulcan black samples. The loading of these samples is 1.25 mg/cm2 facing the catalyst layer and 0.25 mg/cm2 facing the BPP. Firstly, it can be seen that for both the carbon blacks, the 1.25 mg/cm2 loading has full uniform coverage of the substrate. In the case of the 0.25 mg/cm2 loading, it can be seen that there are protrusions of the carbon fibre strands from the substrate. This is expected as a lower loading would result in a thinner MPL. As discussed in the methodology, the loading of 1.25 mg/cm2 was applied first. It was then allowed to dry out, flipped and the 0.25 mg/cm2 loading was then applied. This had the potential to damage the MPL loading on the 1.25 mg/cm2 side when the doctor blade applicator was being used. However, it can be seen from the SEM imaging that there is no noticeable damage to the 1.25 mg/cm2 MPLs. Furthermore, Figure 10 and Figure 11 show that Vulcan black has much finer particles than the Ketjenblack; the Ketjenblack appears slightly coarser on the surface. Upon examining the cross-sectional image presented in Figure 11, it is evident that the penetration of the Vulcan black MPL into the GDL substrate is more pronounced compared to the Ketjenblack. This is potentially the reason that the Vulcan black GDL samples have less macropores compared to Ketjenblack samples.
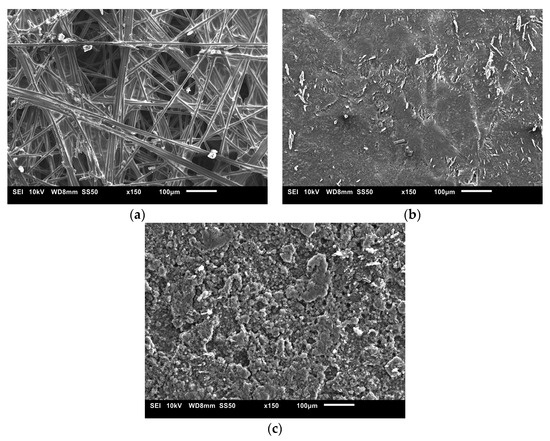
Figure 10.
SEM images for (a) uncoated Toray GDL, (b) single-sided coated GDL with 1.25 mg/cm2 Vulcan black and (c) single-sided coated GDL with 1.25 mg/cm2 Ketjenblack.
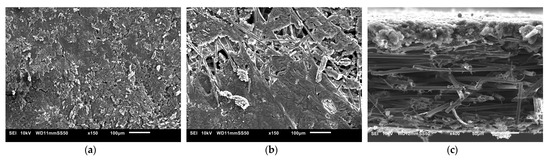
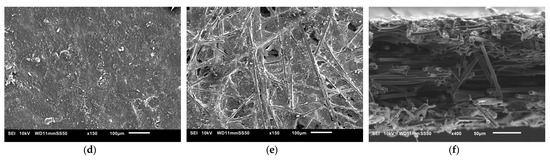
Figure 11.
SEM images for (a) double-sided coated GDL with 1.25 mg/cm2 Ketjenblack, (b) double-sided coated GDL with 0.25 mg/cm2 Ketjenblack, (c) cross-sectional of double-sided coated GDL with Ketjenblack (d) double-sided coated GDL with 1.25 mg/cm2 Vulcan black and (e) double-sided coated GDL with 0.25 mg/cm2 Vulcan black (f) cross-sectional of double-sided coated GDL with Vulcan black.
3.6. Fuel Cell Performance
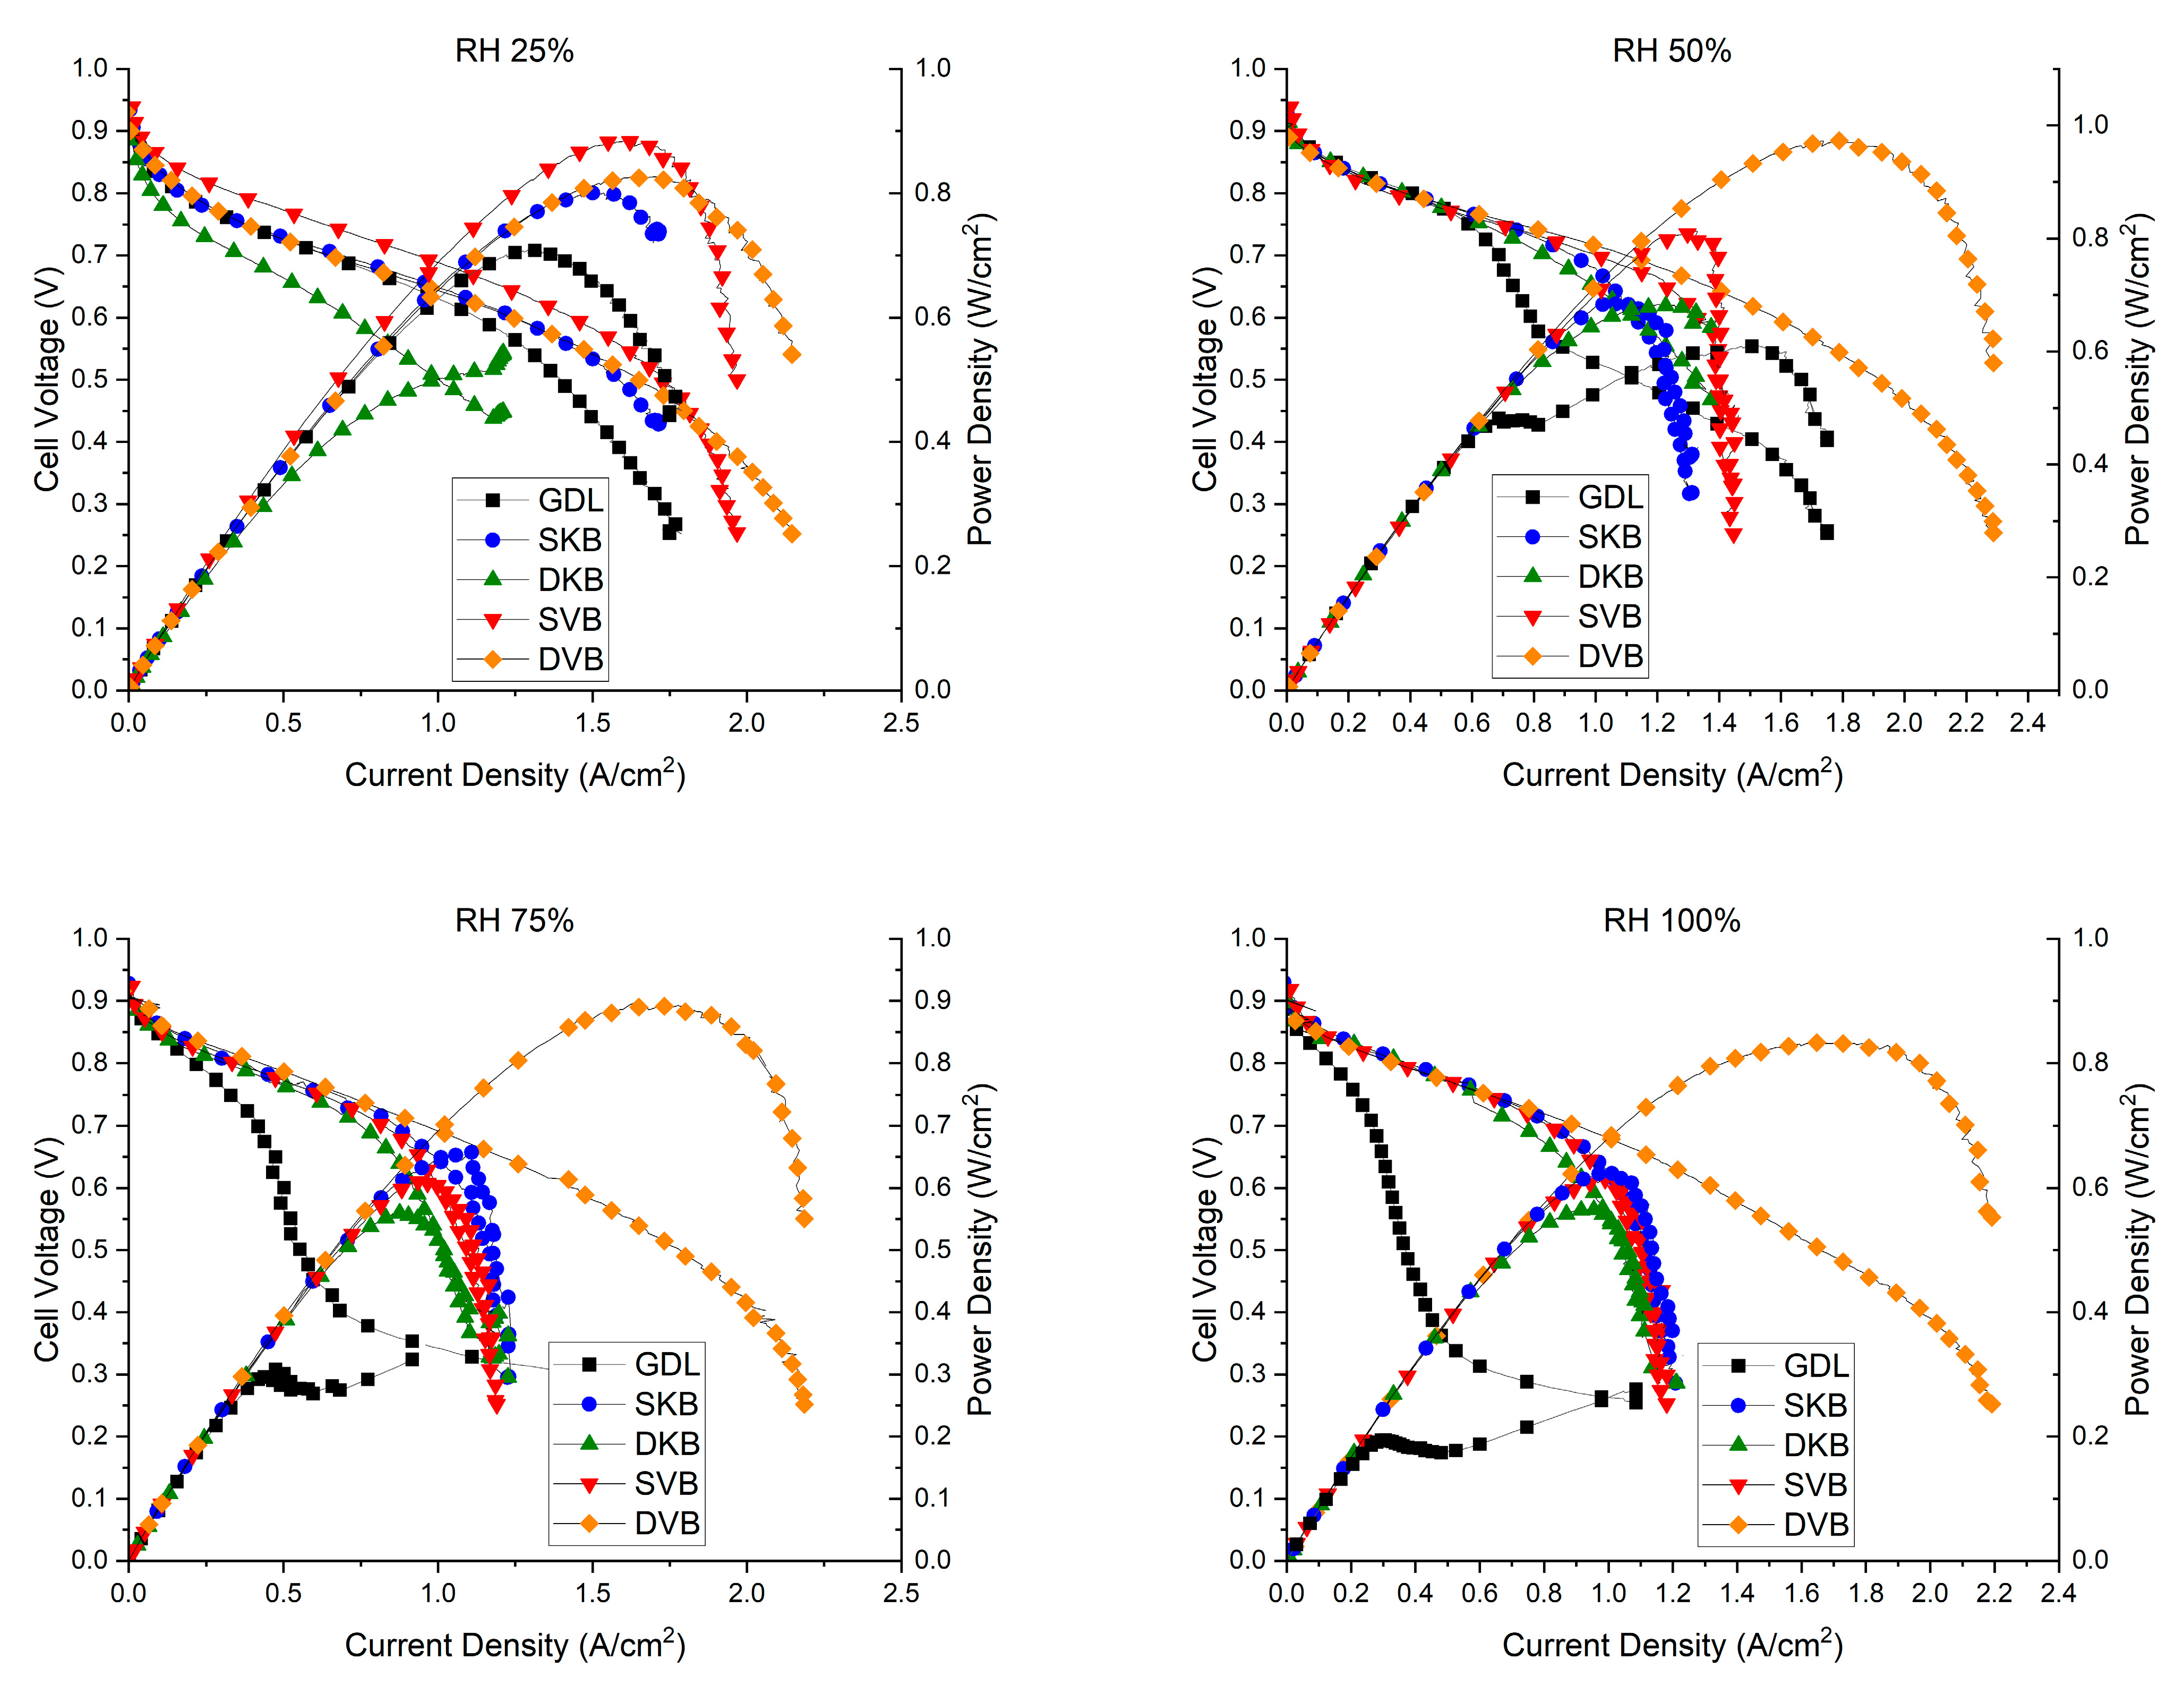
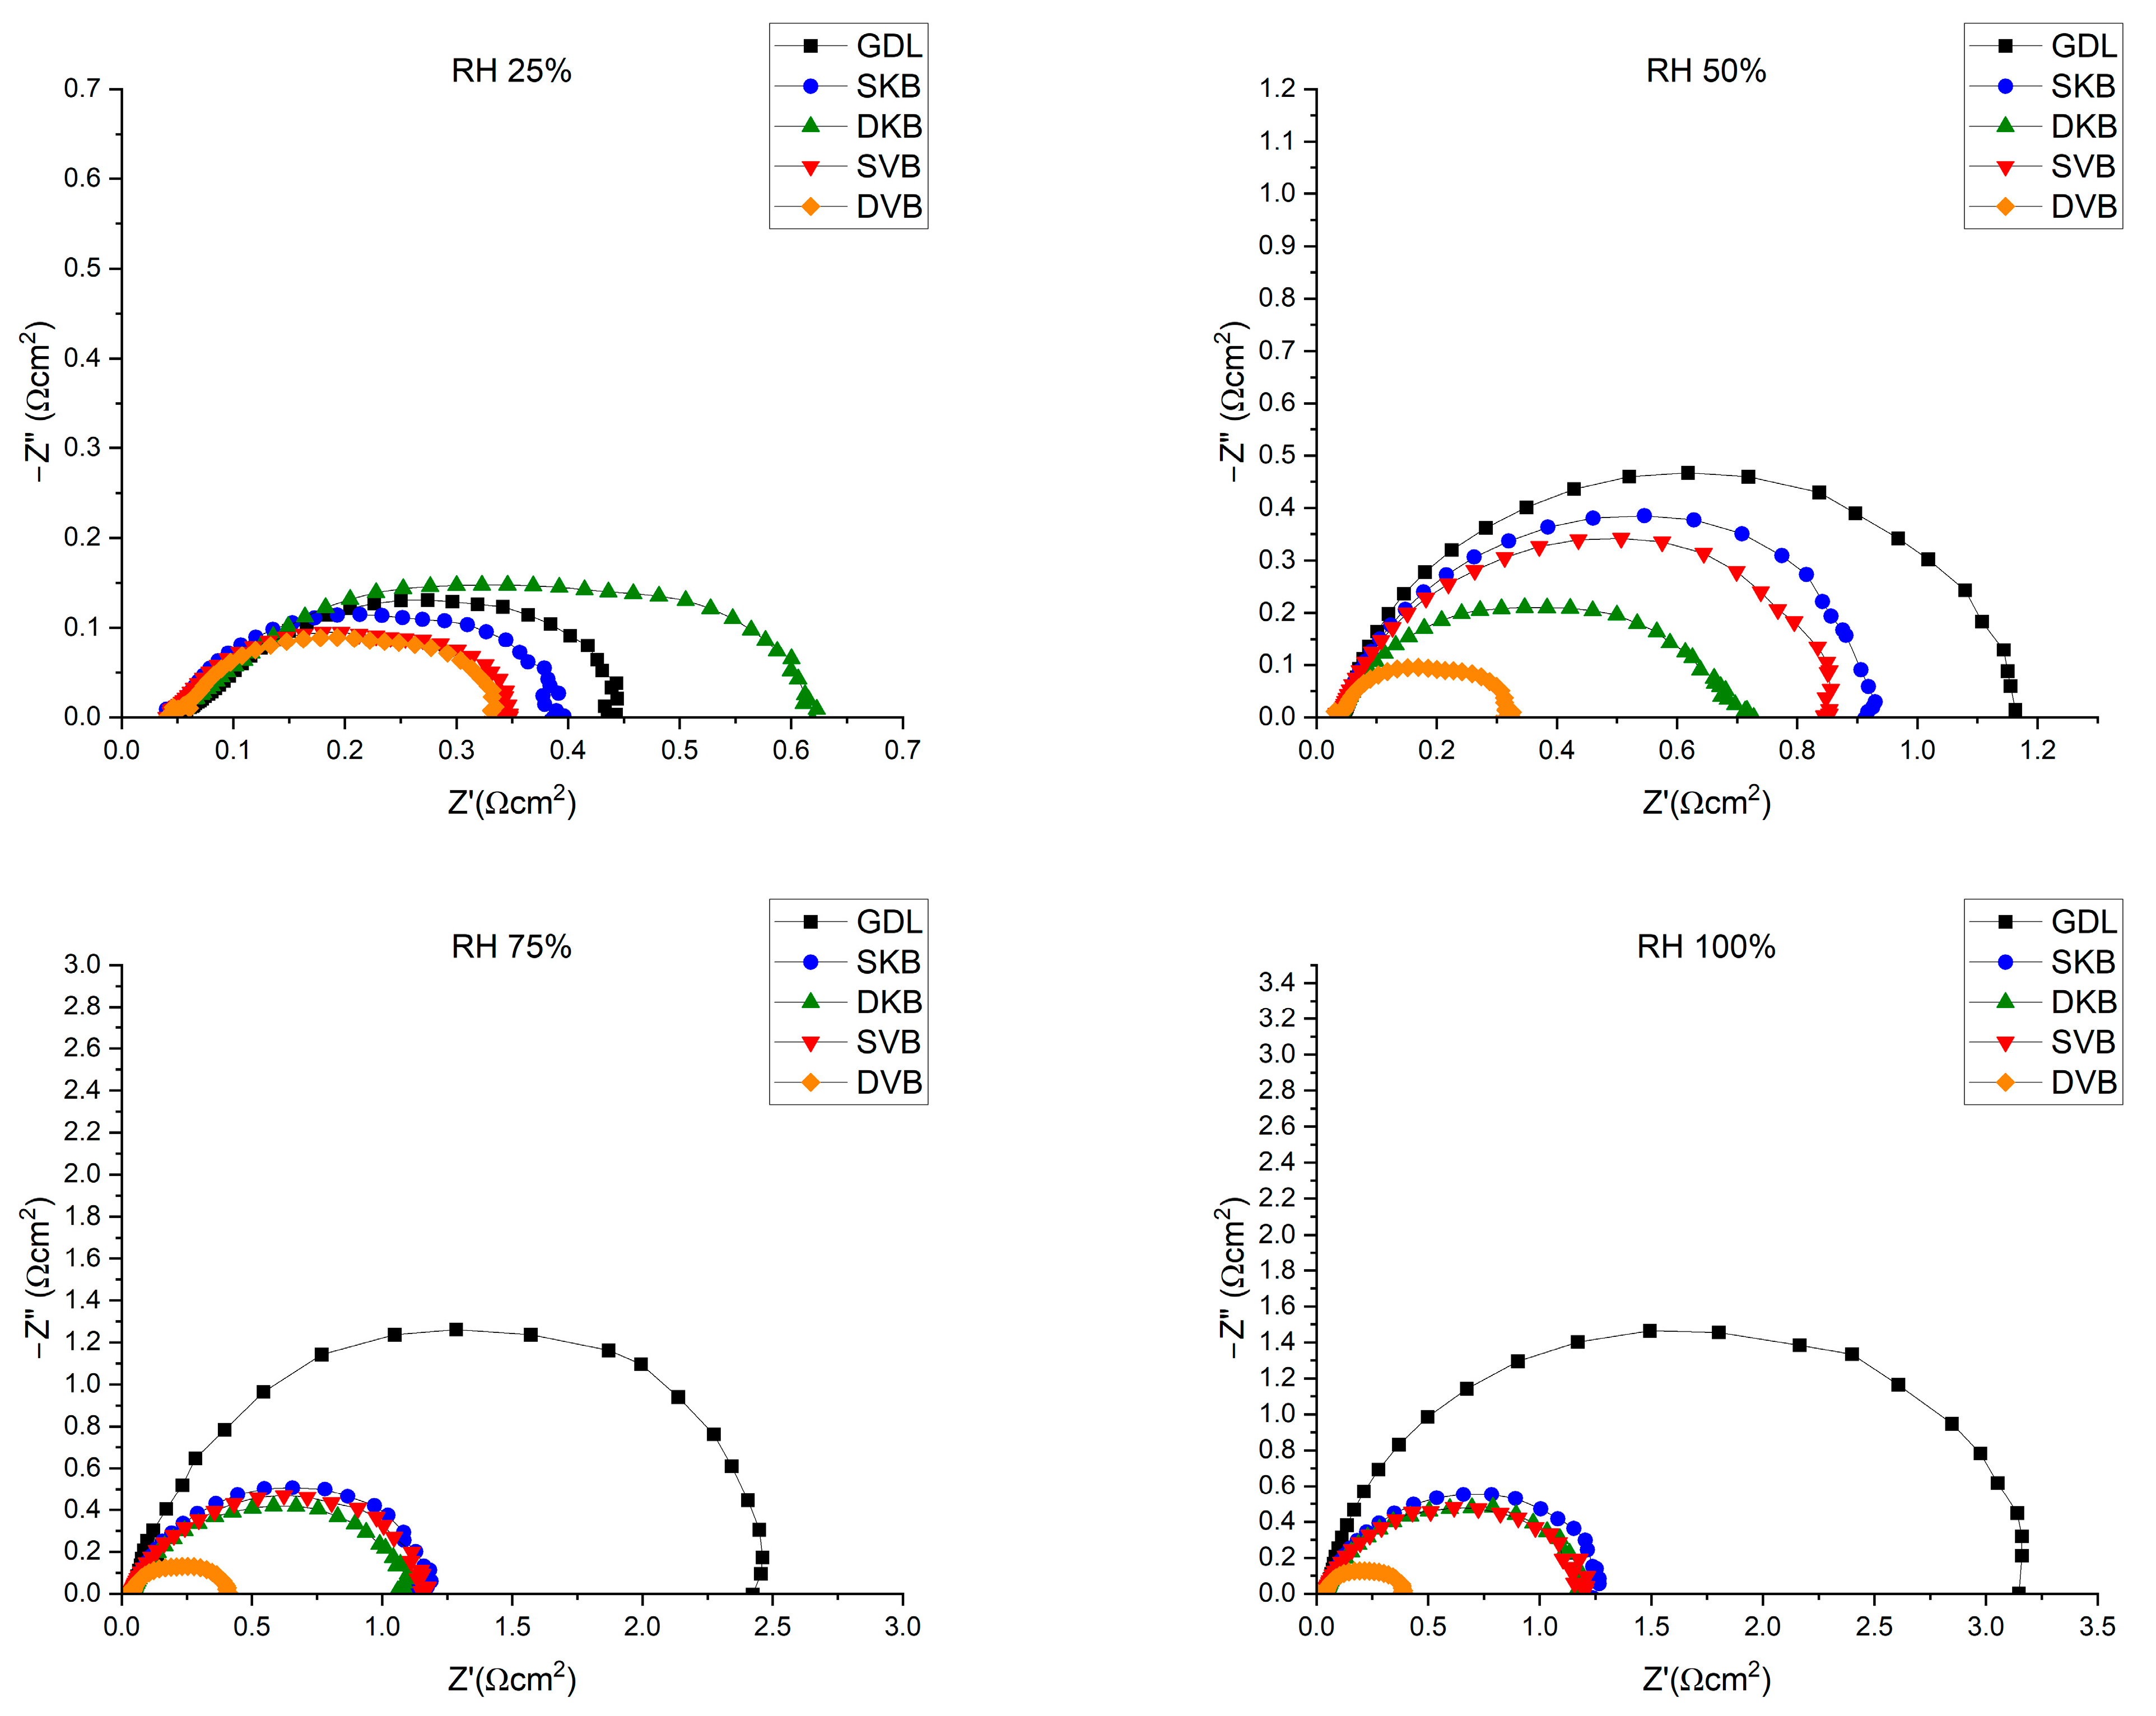
The fuel cell was tested for its performance at four different RH conditions (25, 50, 75 and 100%); Figure 12 shows the polarisation curves for the fuel cell operating with the investigated GDL samples at these humidity conditions. Furthermore, for reference, Table 3 shows the peak power density and the maximum current density (extracted from the corresponding polarisation curves) for each of the cases investigated. There are some observations that one could deduce from the polarisation curves. The first observation is that the fuel cell with the cathode uncoated GDL performs reasonably well at low humidity conditions (25% RH); however, the performance becomes worse as the relative humidity increases. The lack of the MPL renders the GDL unable to remove excess liquid water as effectively as compared to an MPL-coated GDL, thus resulting in water flooding [31]. This result is corroborated with the EIS measurements (Figure 13), which show that the fuel cell operating with the cathode uncoated GDL demonstrates a significant charge transfer resistance at high humidity conditions (75 and 100% RHs). The second observation is that the fuel cell with the double-sided Vulcan-black-coated GDL significantly outperforms all other GDL samples, as it shows the lowest charge transfer resistance (Figure 13). This could be attributed to the fact that this GDL lowers the contact resistance with the bipolar plate and has balanced volume fractions of micropores and mesopores (Figure 8); this turned out to be crucial when it came to draining excess liquid water, particularly for the side facing the bipolar plate. Research has indicated that MPLs with a suitable combination of micropores and mesopores exhibit improved water removal capabilities in high humidification conditions [32].
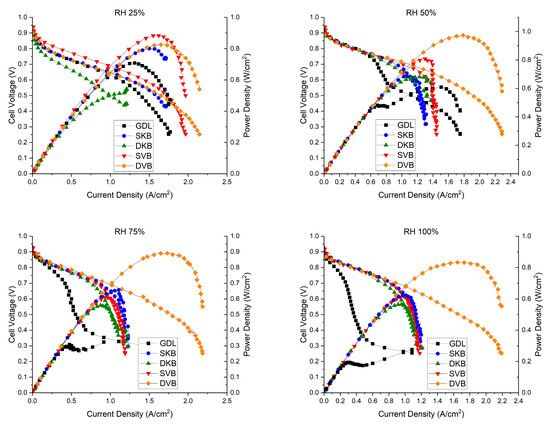
Figure 12.
The polarisation curves of the fuel cell operating with the investigated GDL samples at various humidity conditions (RH 25%, RH 50%, RH 75% and RH 100%). Note that the cell temperature was kept constant at 80 °C.
Table 3.
The peak power density and maximum current density for the cases investigated.
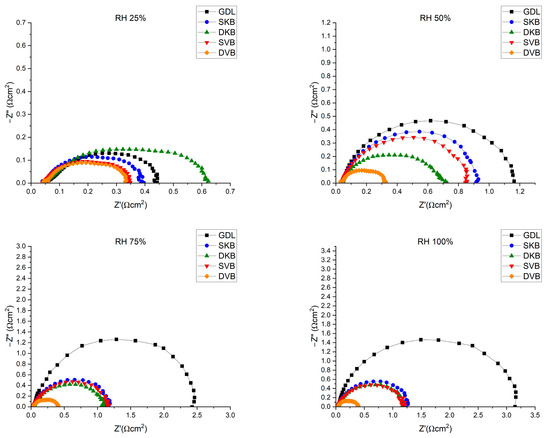
Figure 13.
EIS measurements for the fuel cell operating with the investigated GDL samples at 0.6 V.
On the other hand, the fuel cell with a double-sided Ketjenblack-coated GDL does not perform as well as the double-sided Vulcan-black-coated GDL. The MIP results shown in Figure 8, show that the Ketjenblack GDL samples have only micropores that are smaller than those of the Vulcan black samples. Such small micropores on both sides of the GDL appear to act as a trap for liquid water, which is an issue at higher current densities. This premise is corroborated by the fact that the single-sided Ketjenblack-coated GDL performs slightly better than the double-sided Ketjenblack-coated GDL at high humidity conditions (75 and 100% RH), implying that the second MPL facing the bipolar plate hinders the removal of liquid water from the GDL.
It is important to acknowledge that conducting fuel cell testing at lower relative humidity (RH 25%) is not ideal for optimal performance of the Nafion membrane [33,34]. This suboptimal condition can impact the overall results due to membrane dehydration, leading to membrane shrinkage, low ionic conductivity and poor contact between the membrane and electrode [33,34]. Despite this limitation, it can be seen that SVB and DVB samples demonstrate satisfactory performance under these challenging conditions.
4. Conclusions
The impact of a double-sided MPL on key properties and fuel cell performance has been investigated and compared with conventional single-sided MPL coatings. Two types of carbon black (Vulcan black and Ketjenblack) were employed to evaluate the sensitivity of the results to the type of carbon black. The MPL loadings applied to the surfaces of the GDL facing the catalyst layer and the bipolar plate were 1.25 and 0.25 mg/cm2, respectively.
The results indicated that the in-plane electrical conductivity of all the MPL-coated GDLs is slightly lower than that of the uncoated GDL. This decrease was attributed to the lower PTFE content in the carbon substrate. Furthermore, the study demonstrated that the in-plane electrical conductivity exhibits minimal sensitivity to the MPL loading or carbon black type. The permeability measurements indicated that the permeability is almost insensitive to whether the GDL is single- or double-sided MPL coated. It is more sensitive to the type of carbon black used. The MIP data showed that the addition of a MPL results in a favourable shift in pore size distribution, with prominent micropores observed in both single- and double-coated MPLs. The double-sided MPL coating slightly increased the micropores and mesopores when compared to the single-sided MPL coating. Contact angle measurements showed a slight increase in hydrophobicity with the addition of an MPL, but no significant differences were observed between the carbon black types or loading levels. SEM imaging showed that the 0.25 mg/cm2 loading did not fully cover the surface of the GDL. Also, the level of MPL penetration into the carbon substrate is higher in the case of Vulcan black compared to Ketjenblack. In situ fuel cell testing revealed that the DVB case performed exceptionally well under high humidity conditions, outperforming the SKB, DKB and SVB cases at 50%, 75% and 100% relative humidities. This can be attributed to the fact that, as indicated by the MIP results, the DVB case demonstrates a favourable balance of mesopores and micropores (particularly when compared to DKB), which is necessary for effective management of excess water. At 25% relative humidity, the SVB case exhibited better performance than the DVB case, indicating its suitability for low humidity conditions. This is attributed to the shorter diffusion paths demonstrated by the former case.
Further investigations can explore the behaviour of double-sided MPL-coated GDLs with novel materials such as graphene, providing insights for optimisation and enhanced performance in fuel cell applications. Such efforts hold potential for improved fuel cell efficiency and performance.
Author Contributions
F.R.: conceptualisation, methodology, formal analysis, investigation, writing—original draft preparation, writing—review and editing, visualisation. K.Z.: investigation, writing—review and editing. M.S.I.: conceptualisation, methodology, formal analysis, investigation, validation, writing—original draft, writing—review and editing, supervision. K.J.H.: supervision. D.B.I.: supervision, writing—review and editing. L.M.: supervision. M.P.: project administration. All authors have read and agreed to the published version of the manuscript.
Funding
This research was funded by the EPSRC Centre for Doctoral Training for Resilient Decarbonised Fuel Energy Systems (grant number EP/S022996/1) and the International Flame Research Foundation for their financial support.
Data Availability Statement
The data presented in this study are available on request from the corresponding author or could be directly digitally extracted from the graphs presented in the article.
Conflicts of Interest
The authors declare no conflict of interest.
Nomenclature
| A | Cross Sectional Area (m2) |
| C | Correction factor |
| d | Thickness (m) |
| i | Current density (A/m2) |
| I | Current (A) |
| k | Permeability (m2) |
| L | Thickness (m) |
| P | Pressure (Pa) |
| R | Electrical Resistance (Ω) |
| T | Temperature (K) |
| t | Thickness (m) |
| µ | Fluid Viscosity (Pa·s) |
| ρ | Electrical Resistivity (Ω/m) |
| σ | Electrical Conductivity (S/m) |
References
- Aldakheel, F.; Ismail, M.; Hughes, K.; Ingham, D.; Ma, L.; Pourkashanian, M.; Cumming, D.; Smith, R. Gas permeability, wettability and morphology of gas diffusion layers before and after performing a realistic ex-situ compression test. Renew. Energy 2020, 151, 1082–1091. [Google Scholar] [CrossRef]
- Barbir, F. PEM Fuel Cells: Theory and Practice; Elsevier Science & Technology: Amsterdam, The Netherlands, 2005. [Google Scholar]
- Hoogers, G. Fuel Cell Technology Handbook; CRC Press: Boca Raton, FL, USA, 2003. [Google Scholar]
- Park, S.; Lee, J.-W.; Popov, B.N. Effect of carbon loading in microporous layer on PEM fuel cell performance. J. Power Sources 2006, 163, 357–363. [Google Scholar] [CrossRef]
- Kitahara, T.; Konomi, T.; Nakajima, H. Microporous layer coated gas diffusion layers for enhanced performance of polymer electrolyte fuel cells. J. Power Sources 2010, 195, 2202–2211. [Google Scholar] [CrossRef]
- Weber, A.Z.; Newman, J. Effects of Microporous Layers in Polymer Electrolyte Fuel Cells. J. Electrochem. Soc. 2005, 152, A677–A688. [Google Scholar] [CrossRef]
- Ismail, M.; Damjanovic, T.; Ingham, D.; Pourkashanian, M.; Westwood, A. Effect of polytetrafluoroethylene-treatment and microporous layer-coating on the electrical conductivity of gas diffusion layers used in proton exchange membrane fuel cells. J. Power Sources 2010, 195, 2700–2708. [Google Scholar] [CrossRef]
- Gostick, J.T.; Ioannidis, M.A.; Fowler, M.W.; Pritzker, M.D. On the role of the microporous layer in PEMFC operation. Electrochem. Commun. 2009, 11, 576–579. [Google Scholar] [CrossRef]
- Okereke, I.C.; Ismail, M.S.; Ingham, D.B.; Hughes, K.; Ma, L.; Pourkashanian, M. Single- and Double-Sided Coated Gas Diffusion Layers Used in Polymer Electrolyte Fuel Cells: A Numerical Study. Energies 2023, 16, 4363. [Google Scholar] [CrossRef]
- Bednarek, T.; Tsotridis, G. Issues associated with modelling of proton exchange membrane fuel cell by computational fluid dynamics. J. Power Sources 2017, 343, 550–563. [Google Scholar] [CrossRef]
- Netwall, C.J.; Gould, B.D.; Rodgers, J.A.; Nasello, N.J.; Swider-Lyons, K.E. Decreasing contact resistance in proton-exchange membrane fuel cells with metal bipolar plates. J. Power Sources 2013, 227, 137–144. [Google Scholar] [CrossRef]
- Schmittinger, W.; Vahidi, A. A review of the main parameters influencing long-term performance and durability of PEM fuel cells. J. Power Sources 2008, 180, 1–14. [Google Scholar] [CrossRef]
- Makharia, R.; Mathias, M.F.; Baker, D.R. Measurement of Catalyst Layer Electrolyte Resistance in PEFCs Using Electrochemical Impedance Spectroscopy. J. Electrochem. Soc. 2005, 152, A970–A977. [Google Scholar] [CrossRef]
- Owejan, J.P.; Owejan, J.E.; Gu, W.; Trabold, T.A.; Tighe, T.W.; Mathias, M.F. Water Transport Mechanisms in PEMFC Gas Diffusion Layers. J. Electrochem. Soc. 2010, 157, B1456–B1464. [Google Scholar] [CrossRef]
- Wang, X.; Zhang, H.; Zhang, J.; Xu, H.; Zhu, X.; Chen, J.; Yi, B. A bi-functional micro-porous layer with composite carbon black for PEM fuel cells. J. Power Sources 2006, 162, 474–479. [Google Scholar] [CrossRef]
- Chang, H.-M.; Chang, M.-H. Effect of gas diffusion layer with double-side microporous layer coating on polymer electrolyte membrane fuel cell performance. J. Fuel Cell Sci. Technol. 2013, 10, 021005. [Google Scholar] [CrossRef]
- Huang, G.-M.; Chang, M.-H. Effect of Gas Diffusion Layer with Double-Side Microporous Layer Coating on Proton Exchange Membrane Fuel Cell Performance Under Different Air Inlet Relative Humidity. Int. J. Electrochem. Sci. 2014, 9, 7819–7831. [Google Scholar] [CrossRef]
- Smits, F.M. Measurement of Sheet Resistivities with the Four-Point Probe. Bell Syst. Tech. J. 1958, 37, 711–718. [Google Scholar] [CrossRef]
- Mench, M. Fuel Cell Engines; John Wiley & Sons: Hoboken, NJ, USA, 2008. [Google Scholar]
- Nitta, I.; Himanen, O.; Mikkola, M. Contact resistance between gas diffusion layer and catalyst layer of PEM fuel cell. Electrochem. Commun. 2008, 10, 47–51. [Google Scholar] [CrossRef]
- Orogbemi, O.; Ingham, D.; Ismail, M.; Hughes, K.; Ma, L.; Pourkashanian, M. Through-plane gas permeability of gas diffusion layers and microporous layer: Effects of carbon loading and sintering. J. Energy Inst. 2018, 91, 270–278. [Google Scholar] [CrossRef]
- Ozden, A.; Alaefour, I.E.; Shahgaldi, S.; Li, X.; Colpan, C.O.; Hamdullahpur, F. Gas Diffusion Layers for PEM Fuel Cells: Ex- and In-Situ Characterization. In Exergetic, Energetic and Environmental Dimensions; Academic Press: Cambridge, MA, USA, 2018. [Google Scholar] [CrossRef]
- Giesche, H. Mercury Porosimetry: A General (Practical) Overview. Part. Part. Syst. Charact. 2006, 23, 9–19. [Google Scholar] [CrossRef]
- El-Kharouf, A.; Mason, T.J.; Brett, D.J.; Pollet, B.G. Ex-situ characterisation of gas diffusion layers for proton exchange membrane fuel cells. J. Power Sources 2012, 218, 393–404. [Google Scholar] [CrossRef]
- Lee, H.-K.; Park, J.-H.; Kim, D.-Y.; Lee, T.-H. A study on the characteristics of the diffusion layer thickness and porosity of the PEMFC. J. Power Sources 2004, 131, 200–206. [Google Scholar] [CrossRef]
- Fang, Z.; Star, A.G.; Fuller, T.F. Effect of Carbon Corrosion on Wettability of PEM Fuel Cell Electrodes. J. Electrochem. Soc. 2019, 166, F709–F715. [Google Scholar] [CrossRef]
- Chen, W.; Jiang, F. Impact of PTFE content and distribution on liquid–gas flow in PEMFC carbon paper gas distribution layer: 3D lattice Boltzmann simulations. Int. J. Hydrogen Energy 2016, 41, 8550–8562. [Google Scholar] [CrossRef]
- Mench, M.M.; Kumbur, E.C.; Veziroglu, T.N. Polymer Electrolyte Fuel Cell Degradation; Academic Press: Amsterdam, The Netherlands, 2012; ISBN 9780123869364. [Google Scholar]
- Lee, F.; Ismail, M.; Ingham, D.; Hughes, K.; Ma, L.; Lyth, S.; Pourkashanian, M. Alternative architectures and materials for PEMFC gas diffusion layers: A review and outlook. Renew. Sustain. Energy Rev. 2022, 166, 112640. [Google Scholar] [CrossRef]
- Litster, S.; Sinton, D.; Djilali, N. Ex situ visualization of liquid water transport in PEM fuel cell gas diffusion layers. J. Power Sources 2006, 154, 95–105. [Google Scholar] [CrossRef]
- Li, H.; Tang, Y.; Wang, Z.; Shi, Z.; Wu, S.; Song, D.; Zhang, J.; Fatih, K.; Zhang, J.; Wang, H.; et al. A review of water flooding issues in the proton exchange membrane fuel cell. J. Power Sources 2008, 178, 103–117. [Google Scholar] [CrossRef]
- Chun, J.H.; Park, K.T.; Jo, D.H.; Lee, J.Y.; Kim, S.G.; Lee, E.S.; Jyoung, J.-Y.; Kim, S.H. Determination of the pore size distribution of micro porous layer in PEMFC using pore forming agents under various drying conditions. Int. J. Hydrogen Energy 2010, 35, 11148–11153. [Google Scholar] [CrossRef]
- Zhai, Y.; Zhang, H.; Hu, J.; Yi, B. Preparation and characterization of sulfated zirconia (SO42−/ZrO2)/Nafion composite membranes for PEMFC operation at high temperature/low humidity. J. Membr. Sci. 2006, 280, 148–155. [Google Scholar] [CrossRef]
- Kumar, G.G.; Kim, A.; Nahm, K.S.; Elizabeth, R. Nafion membranes modified with silica sulfuric acid for the elevated temperature and lower humidity operation of PEMFC. Int. J. Hydrogen Energy 2009, 34, 9788–9794. [Google Scholar] [CrossRef]


Disclaimer/Publisher’s Note: The statements, opinions and data contained in all publications are solely those of the individual author(s) and contributor(s) and not of MDPI and/or the editor(s). MDPI and/or the editor(s) disclaim responsibility for any injury to people or property resulting from any ideas, methods, instructions or products referred to in the content. |
© 2023 by the authors. Licensee MDPI, Basel, Switzerland. This article is an open access article distributed under the terms and conditions of the Creative Commons Attribution (CC BY) license (https://creativecommons.org/licenses/by/4.0/).