Abstract
Addressing the urgent need for sustainable energy sources due to the high costs and environmental impacts of fossil fuels, this research explores the integration of decentralized solar photovoltaic (PV) systems in urban Southern European settings. Specifically, we examine the effectiveness of a solar carport PV installation at a higher education institution, focusing on the challenges of energy surplus management within regulated markets that restrict grid energy injection. Our study employed a mixed-methods approach, combining quantitative data analysis of energy production with qualitative assessments of regulatory frameworks. The innovative aspect of our method lies in the development of a smart management system tailored to circumvent legal barriers, ensuring optimal use of locally produced energy and fostering the creation of an energy community with shared energetic, environmental, and social benefits. Preliminary results demonstrate that our system not only prevents energy loss but also enhances investment return by enabling the institution to become an energy prosumer within its community. A comparative analysis with traditional energy exercises reveals that our approach significantly improves energy self-sufficiency and sustainability, positioning decentralized PV systems as a viable solution in similar urban contexts.
1. Introduction
The use of photovoltaic (PV) solar energy for self-consumption has shown clear benefits in promoting a sustainable campus of Higher Education Institutions (HEIs) [1,2,3], especially in terms of the site’s carbon footprint reduction, energy costs reduction, or the possibility of reselling the electric energy generated to the national electricity grid when local regulation allows a situation of that kind. Solar panels are connected directly to the grid via inverters; therefore, the energy produced can be transmitted to the site for self-consumption, and, if possible, the excess can be sold to the national electric network and returned to the grid. There are, however, some situations in which the local grid operator does not allow the injection of electricity into the grid, shaping, therefore, a local network without authorization to export the produced energy that is designed to comply with the rules of a specific funding project or meet some specific regulation requirements. From the public energy supply network point of view, the injection of active energy is necessary to reduce pressure on the power grid and limit the reinforcement costs; however, the excess of locally produced energy is not always allowed to be exported. Based on this drawback, the question that needs to be answered is the following: what should be done when the site has excess power generation that cannot be injected into the grid, and how can different amounts of energy produced throughout the year be managed efficiently?
To help answer the question, a case study consisting of a photovoltaic solar system in a self-consumption regime, without energy injection into the public grid, was installed at the campus of the Technology and Management School of Polytechnic Institute of Viana do Castelo, Northwest Portugal; it constituted 225 monocrystalline PV modules (2.12 m × 1.05 m per module), with a peak power of 102.37 kWp covering a total installed area of 500.85 m2. The PV system is a two-column solar carport mounting system installed in a single bay and was designed to be a shield for parked cars by providing sun shading while generating energy. The solar panels face west and have a 10° incline. The energy produced by the PV system varies throughout the year, and energy storage using batteries deals with the accumulators’ low durability and reduced lifetime.
The growing concern about climate change and the urgent need to reduce greenhouse gas emissions have led to a greater interest in renewable energy sources by HEIs, where photovoltaic systems, due to their low investment cost, ease of installation [4,5], low maintenance needs, and quick assembly, are the most popular renewable energy solution; they are mainly used in southern European countries where solar availability is high. However, most funding programs that are mobilized to support system installation costs determine that electricity injection is prohibited, creating the so-called zero export systems. In practice, a “zero export system” implies that no part of the solar energy produced by the system is allowed to enter the grid and that excess solar energy is cut off by an injection limiter. The scenario is aggravated by the fact that in schools and universities, the demand for electricity on weekends and holidays is lower; therefore, there is a surplus of electrical production that must be managed smartly.
Given this, the main objective of this study is to discuss how self-consumption systems without grid injection can be complemented either by energy storage, load management, or even integration with energy communities to run excess electricity production in peak power generation situations, namely during summer months in the northern hemisphere. Universities are institutions that must be the engine for the energy transition; therefore, this discussion is of utmost importance [6,7,8,9].
This study’s novelty lies in its pragmatic approach to managing surplus photovoltaic energy in environments with strict grid injection regulations. Our contribution is threefold: First, we provide an innovative smart management model that maximizes the use of the solar energy produced, even under regulatory constraints. Second, we explore the potential of forming local energy communities within educational institutions as a strategic move towards energy autonomy. Third, this research introduces a unique analysis of load management techniques that can be leveraged in HEIs to balance energy production and consumption. The insights from this case study aim to serve as a blueprint for HEIs worldwide, emphasizing the role of educational institutions in leading the energy transition towards more sustainable practices.
The structure of this article is as follows: in Section 2, some related works regarding the smart use of PV solar energy in Higher Education Institutions are presented; in Section 3, the materials and methods used to implement this study are outlined; in Section 4, the results and discussion are put forward; and in Section 5, some straightforward conclusions are synthesized.
2. Related Works
The urgency to mitigate climate change through reduced carbon emissions has heightened the focus on sustainable energy solutions, with solar energy taking a central role due to its clean, abundant nature. Universities, as microcosms of larger society, serve as critical platforms for the demonstration and promotion of sustainability. They are uniquely positioned to lead by example, integrating solar energy systems into their infrastructure, thereby educating and influencing the next generation of policymakers, engineers, and consumers. Through robust research programs, universities can explore innovative solar technologies, assess their feasibility, and optimize their integration into existing energy grids. Research initiatives can also provide valuable data on performance and environmental impact, promoting continuous improvement in solar technology and encouraging its wider adoption. This research, especially when disseminated through academic and industry publications, raises awareness of solar energy’s potential and challenges, guiding policy decisions and incentivizing investments. By championing solar energy, universities contribute to a culture of sustainability, inspiring other sectors to adopt these practices and technologies, thereby amplifying the transition towards a low-carbon future [10]. Several examples can be found that deal directly with the installation of PV systems on university campuses. However, following the focus of the current article, the use of carport systems is not so common, and the advantages of the system are not completely identified yet, or at least not yet sufficiently valorized.
Alghamdi et al. addressed the subject as being a unique and innovative approach to harnessing solar power using car parking areas, which often remain an underutilized urban space, for the installation of solar photovoltaic (PV) systems [11]. One of the standout aspects of this study is its ability to turn a traditionally overlooked space, as the car parking areas usually are, into potential hubs of renewable energy. The authors state that the projected 50% return on investment over 25 years at an export tariff of USD ¢4.5/kWh is promising, especially when considering the dual benefits of power generation and car shading. However, a crucial observation is the comparison of estimated generation tariffs with existing PV projects. While the study’s tariff requirements are slightly higher, this could be attributed to the smaller scale and higher cost/kWp of the current PV deployment. As the scale of PV deployments increases, and as labor costs are adjusted for local conditions (like in Saudi Arabia), the tariffs could become more competitive. Their work shows that by using these parking areas on the selected campus, a photovoltaic installation with a capacity of 36.4 MWp can generate up to 66.2 GWh of electricity per year [11].
Returning to the initial item of the advantages of the carport system, besides the obvious energy generation, the integration of PV systems in car parks offers indirect benefits. In regions with extreme temperatures, these canopies provide necessary shade, reducing the energy required for car air conditioning. Moreover, carport canopies offer protection against harsh weather conditions, enhancing comfort and safety for individuals and vehicles alike. These PV installations in dense urban settings can significantly offset energy imports for large organizations, showing the potential for large-scale renewable integration in urban planning, as stated by Alghamdi et al., who consider that, in a broader context, the deployment of such PV systems aligns with international development targets, notably the Sustainable Development Goals [11]. By harnessing the power of the sun in urban environments, cities can move closer to becoming more “inclusive, safe, resilient, and sustainable”, which is in line with the goals set for 2030 [12].
A different and innovative approach is presented by Fakour et al., which can be considered as an upgraded follow-up of the traditional use of carport systems, at a time when electric vehicles (EVs) are being heralded as the future of sustainable transportation, and given the pressing need to decarbonize the cities [13]. The authors assume that the integration of renewable energy sources into EV infrastructure is crucial and discuss the feasibility of a solar carport canopy for EV charging in Kaohsiung City, Taiwan. In this way, the repurposing of open parking lots into solar farms with PV canopies emerges as a promising solution, be it located in a common car parking lot in any city or specifically located on a university campus. These installations allow the harnessing of renewable energy without compromising the utility of parking spaces. Open parking lots are easily accessible in urban areas and have the added benefit of providing shade for vehicles, reducing the need for air conditioning and, subsequently, the power consumption of EVs. Several studies, like those by Nunes et al. [14] and Malek et al. [15], have highlighted the potential benefits of such setups, from environmental to financial gains. However, as stated by the authors, the existing literature has largely ignored the broader implications of such integrations, especially considering various driving habits, EV brands, and the public benefits of connecting these structures to popular sites, as is the case of a university campus, and concluded that solar carports offer a sustainable solution to the pressing need for renewable energy integration into EV infrastructure, contributing to efficiently charge EV models, reduce CO2 emissions by a staggering 94% compared to traditional grid methods, and offer potential financial benefits to vehicle owners, especially if carbon pricing is introduced.
Despite the approach being traditional, it is possible to find a few more studies reporting the results of such systems. For example, Zomer et al. presented the results from the evaluation of the Fotovoltaica/UFSC solar energy laboratory in Florianópolis, Brazil, which occurred from August 2017 to February 2020 for its energy balance and performance of its photovoltaic (PV) systems [16]. Designed as a zero-energy building (ZEB), the lab had PV systems on rooftops and façades, striking a balance between aesthetics and energy output. Additional PV installations included a carport, an electric bus (eBus) shelter and charging station, and ground-mounted systems. Over the review period, the lab conducted monthly analyses on factors like solar irradiation availability, occupancy changes, PV system capacity, and energy generation versus consumption. Despite some downtimes in PV systems due to research activities, the lab’s PV generation (111 kWp) could fulfill 148% of the building’s energy requirements and 97% of the building combined with eBus needs. Optimally, the lab could have produced 38% extra energy, translating to 134% of the combined energy consumption. Hence, the lab transcends its ZEB design, emerging as a positive-energy building (PEB). This study underscores the potential of building integrated photovoltaics (BIPV) in achieving energy-positive structures.
Another study, by Horan et al., presents a novel method for quantitatively estimating the potential of decarbonization technologies in Higher Education Campuses (HECs) [17]. Recognizing a gap in standardized preliminary estimations, the authors introduce a method focused on building integrated photovoltaics, micro-wind turbines, rainwater harvesting, and ground-mounted PV on HECs. Utilizing Google Earth imagery and online HEC maps, two primary variables were identified to gauge the deployment potential: roof area and open parking area. The method’s practical application was showcased in Ireland’s higher education sector, revealing the significant potential for decarbonization technology deployment. An essential insight from the study is the adaptability of this approach: while tailored for HECs, the building decarbonization aspect can be applied to commercial and industrial sectors, given their similar building footprints. Additionally, the open park component is versatile enough for city-scale analysis, owing to the consistency in open park designs globally. This adaptability underscores the method’s broader implications, providing valuable insights for city-wide transitions toward decarbonization.
Regardless of the varied approaches taken by the multiple authors studied, there is a unanimous consensus regarding the sustainable potential of carport photovoltaic (PV) systems. Every piece of the literature analyzed, whether focusing on design specifics, integration techniques, or impact assessments, invariably points to the ecological and operational efficiency of PV carport solutions. These systems not only optimize the use of available open spaces but also contribute significantly to reducing carbon footprints, especially in urban environments. Moreover, as global energy demands surge and the urgency for renewable energy sources becomes paramount, the role of such innovative solutions is emphasized even more. The adaptability of PV carports, as highlighted in many studies, makes them suitable for diverse settings, from educational campuses to commercial establishments, and even city-wide applications [18]. Their dual functionality, providing shade and generating power, adds another layer of appeal to their deployment. In the broader context of sustainable urban development and the push for decarbonization, PV carports emerge as a practical, efficient, and environmentally friendly solution. The overwhelming evidence from various authors suggests that PV carport systems are not just a fleeting trend but a sustainable option that warrants serious consideration in our collective pursuit of a greener future [19,20,21].
3. Materials and Methods
3.1. Case Study
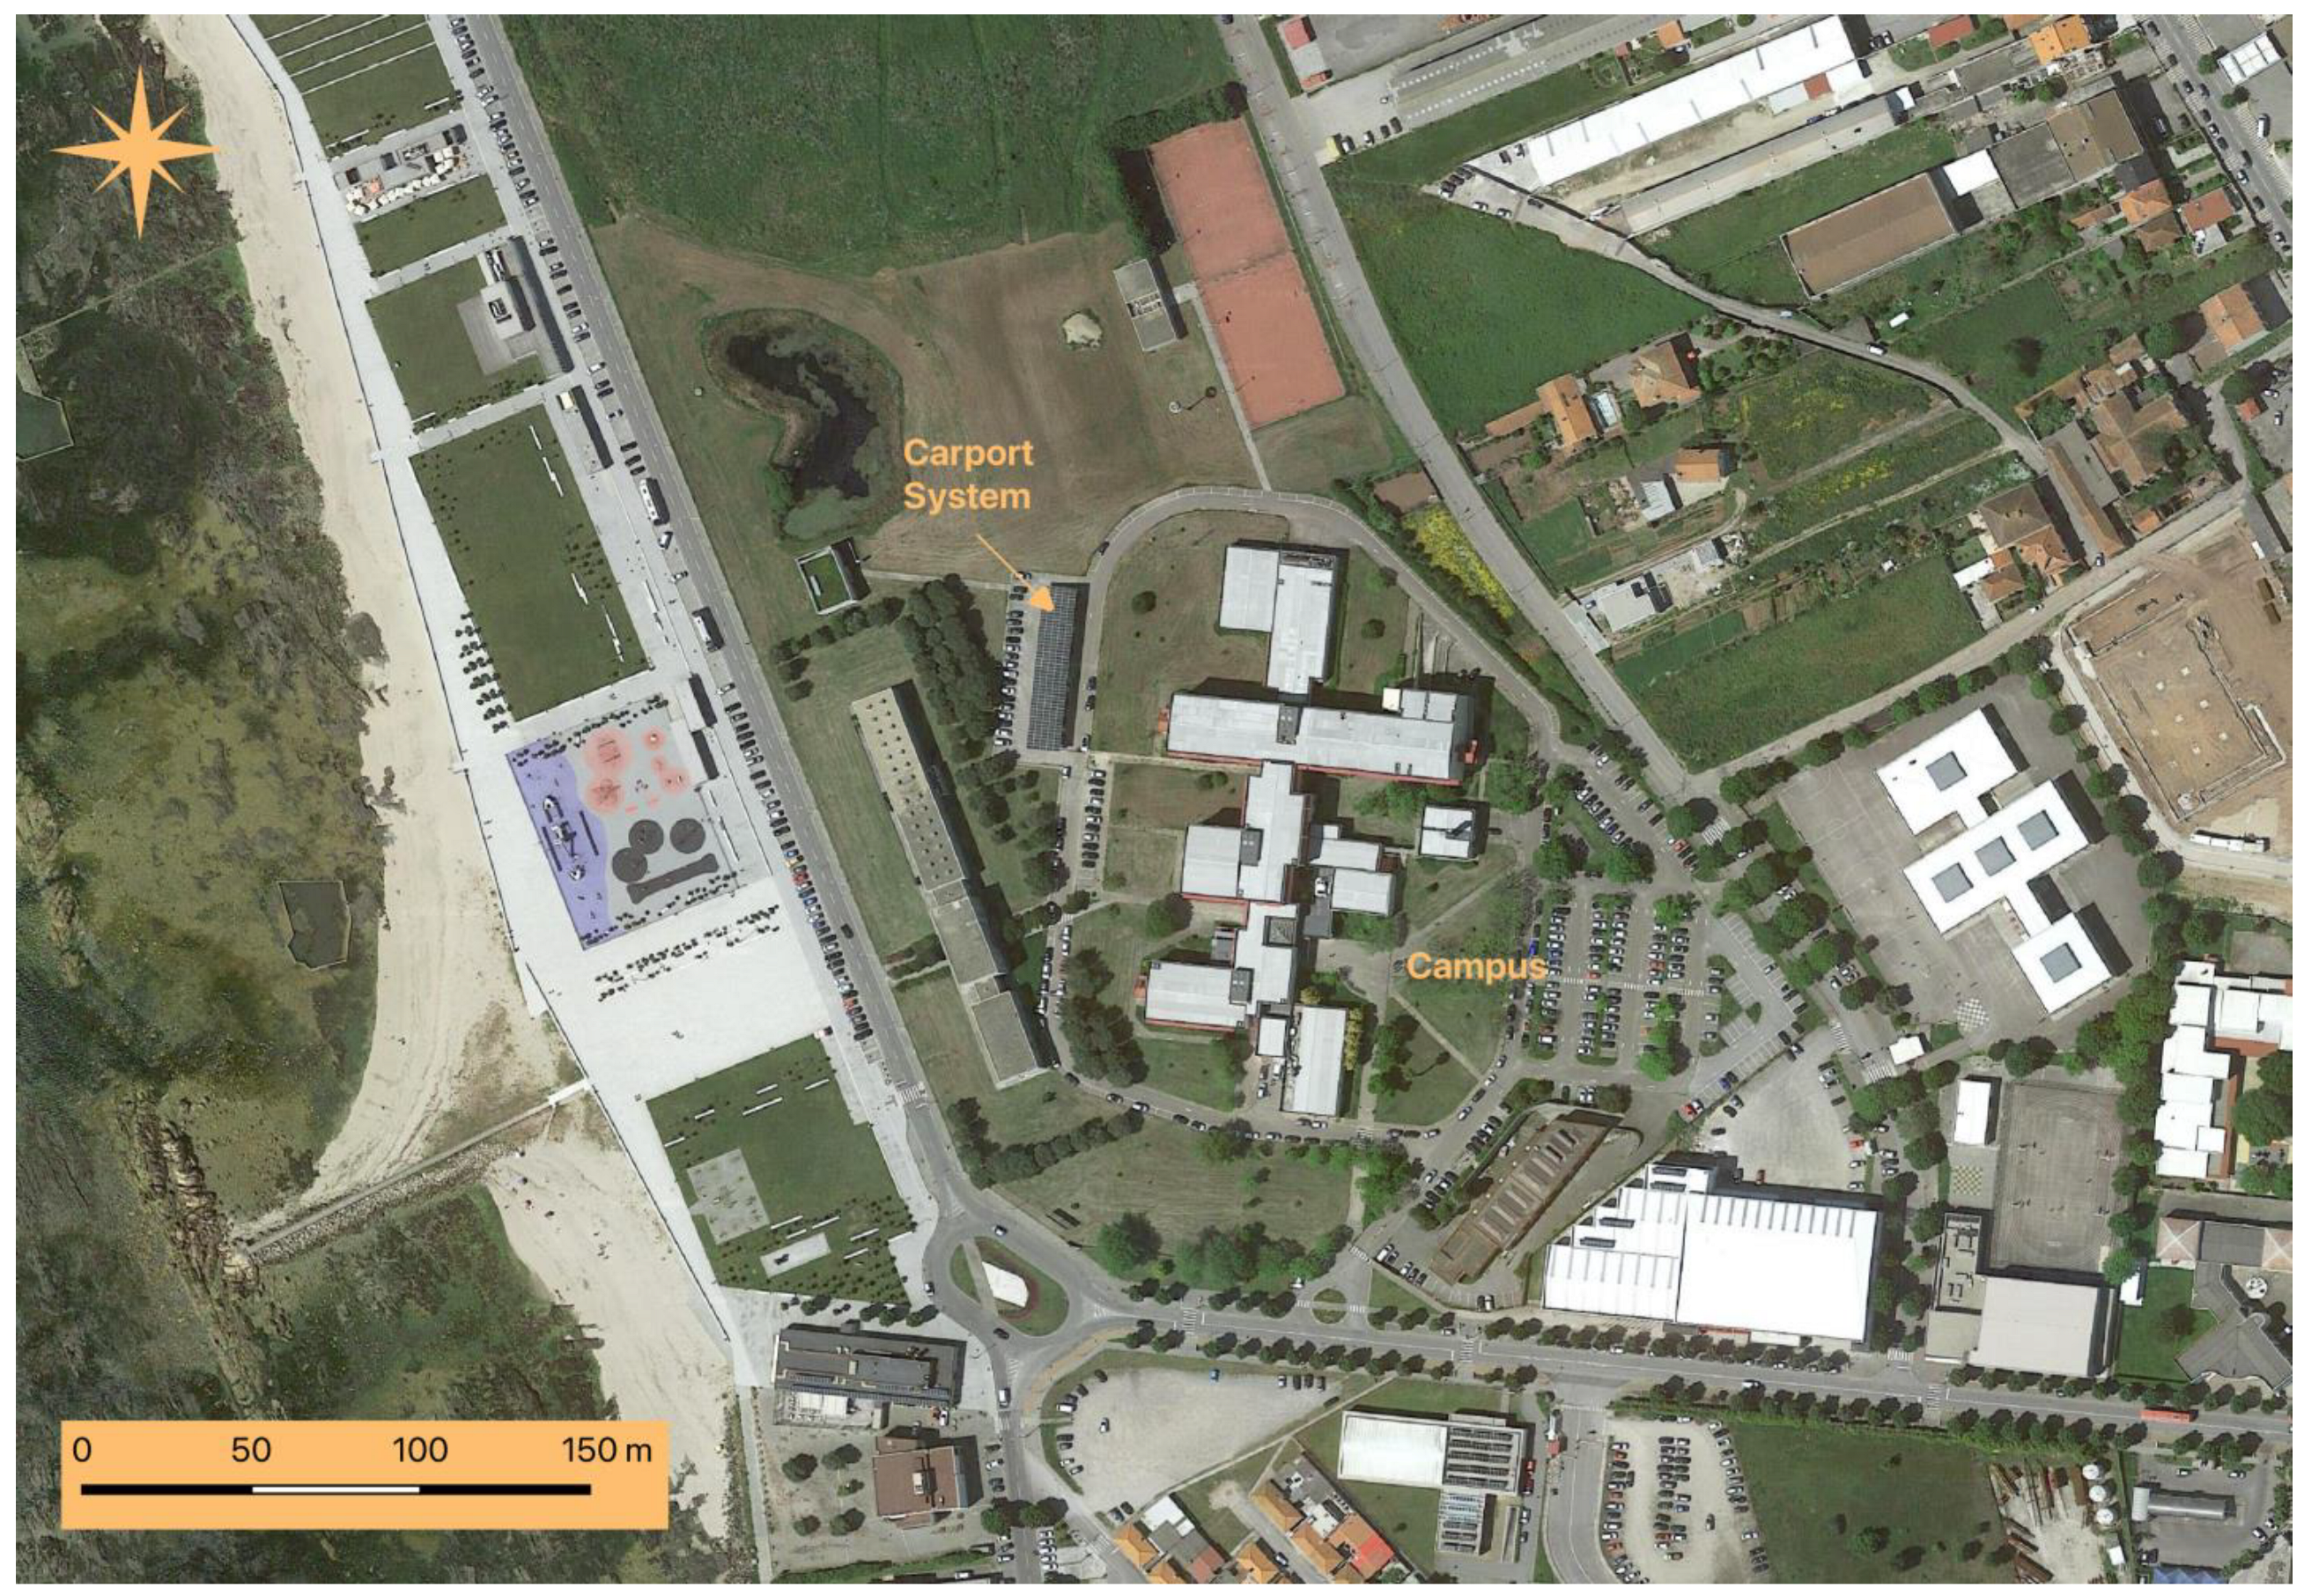
The case study under analysis is located at the Campus of the School of Technology and Management (ESTG) of the Polytechnic Institute of Viana do Castelo (IPVC), in the northwest region of Portugal. During the school period, the building is used by 2500 students and 181 staff members who support all teaching and research activities. The campus is composed of a set of buildings destined for teaching, research, and workshops, a library, and an exhibition, including two electricity delivery points designed for the whole campus. The photovoltaic system is currently integrated into one of these electricity delivery points, which is made up of two buildings; the main one consists of a four-story classroom building and a two-story workshop building including woodworking machines and a design lab. Most of these buildings were recently renovated to improve their energy efficiency, involving the thermal insulation of the envelopes, the replacement of the window frames, and the adoption of shading devices on the glazed openings to the south, east, and west. New high-performance equipment was applied to improve energy efficiency by replacing two ineffective boilers with two low-condensation, high-efficiency natural gas heaters. Additionally, a rooftop air-conditioning system was installed for the school auditorium acclimatization. All lighting systems were upgraded to LED technology, and a carport-type photovoltaic production system with a peak power of 102.8 kW was installed on campus. As represented in Figure 1, the photovoltaic installation is a carport solar panel racking system designed to be waterproof and to have high salt tolerance and strong corrosion resistance due to the proximity to the sea. The campus is placed next to the North Atlantic coastline.

Figure 1.
Aerial view of the photovoltaic carport parking system located at the campus.
Carport-type photovoltaic installations are covered parking structures that are designed to accommodate vehicles while also acting as a platform for the installation of photovoltaic solar panels. This approach offers several advantages, including the generation of solar energy, weather protection for vehicles, and the possibility of taking advantage of parking spaces for the generation of renewable energy. The installation of these structures must consider not only the regular circulation of vehicles and their parking but also the orientation and inclination of the photovoltaic panel based on the latitude of the location in order to optimize solar capture throughout the year.
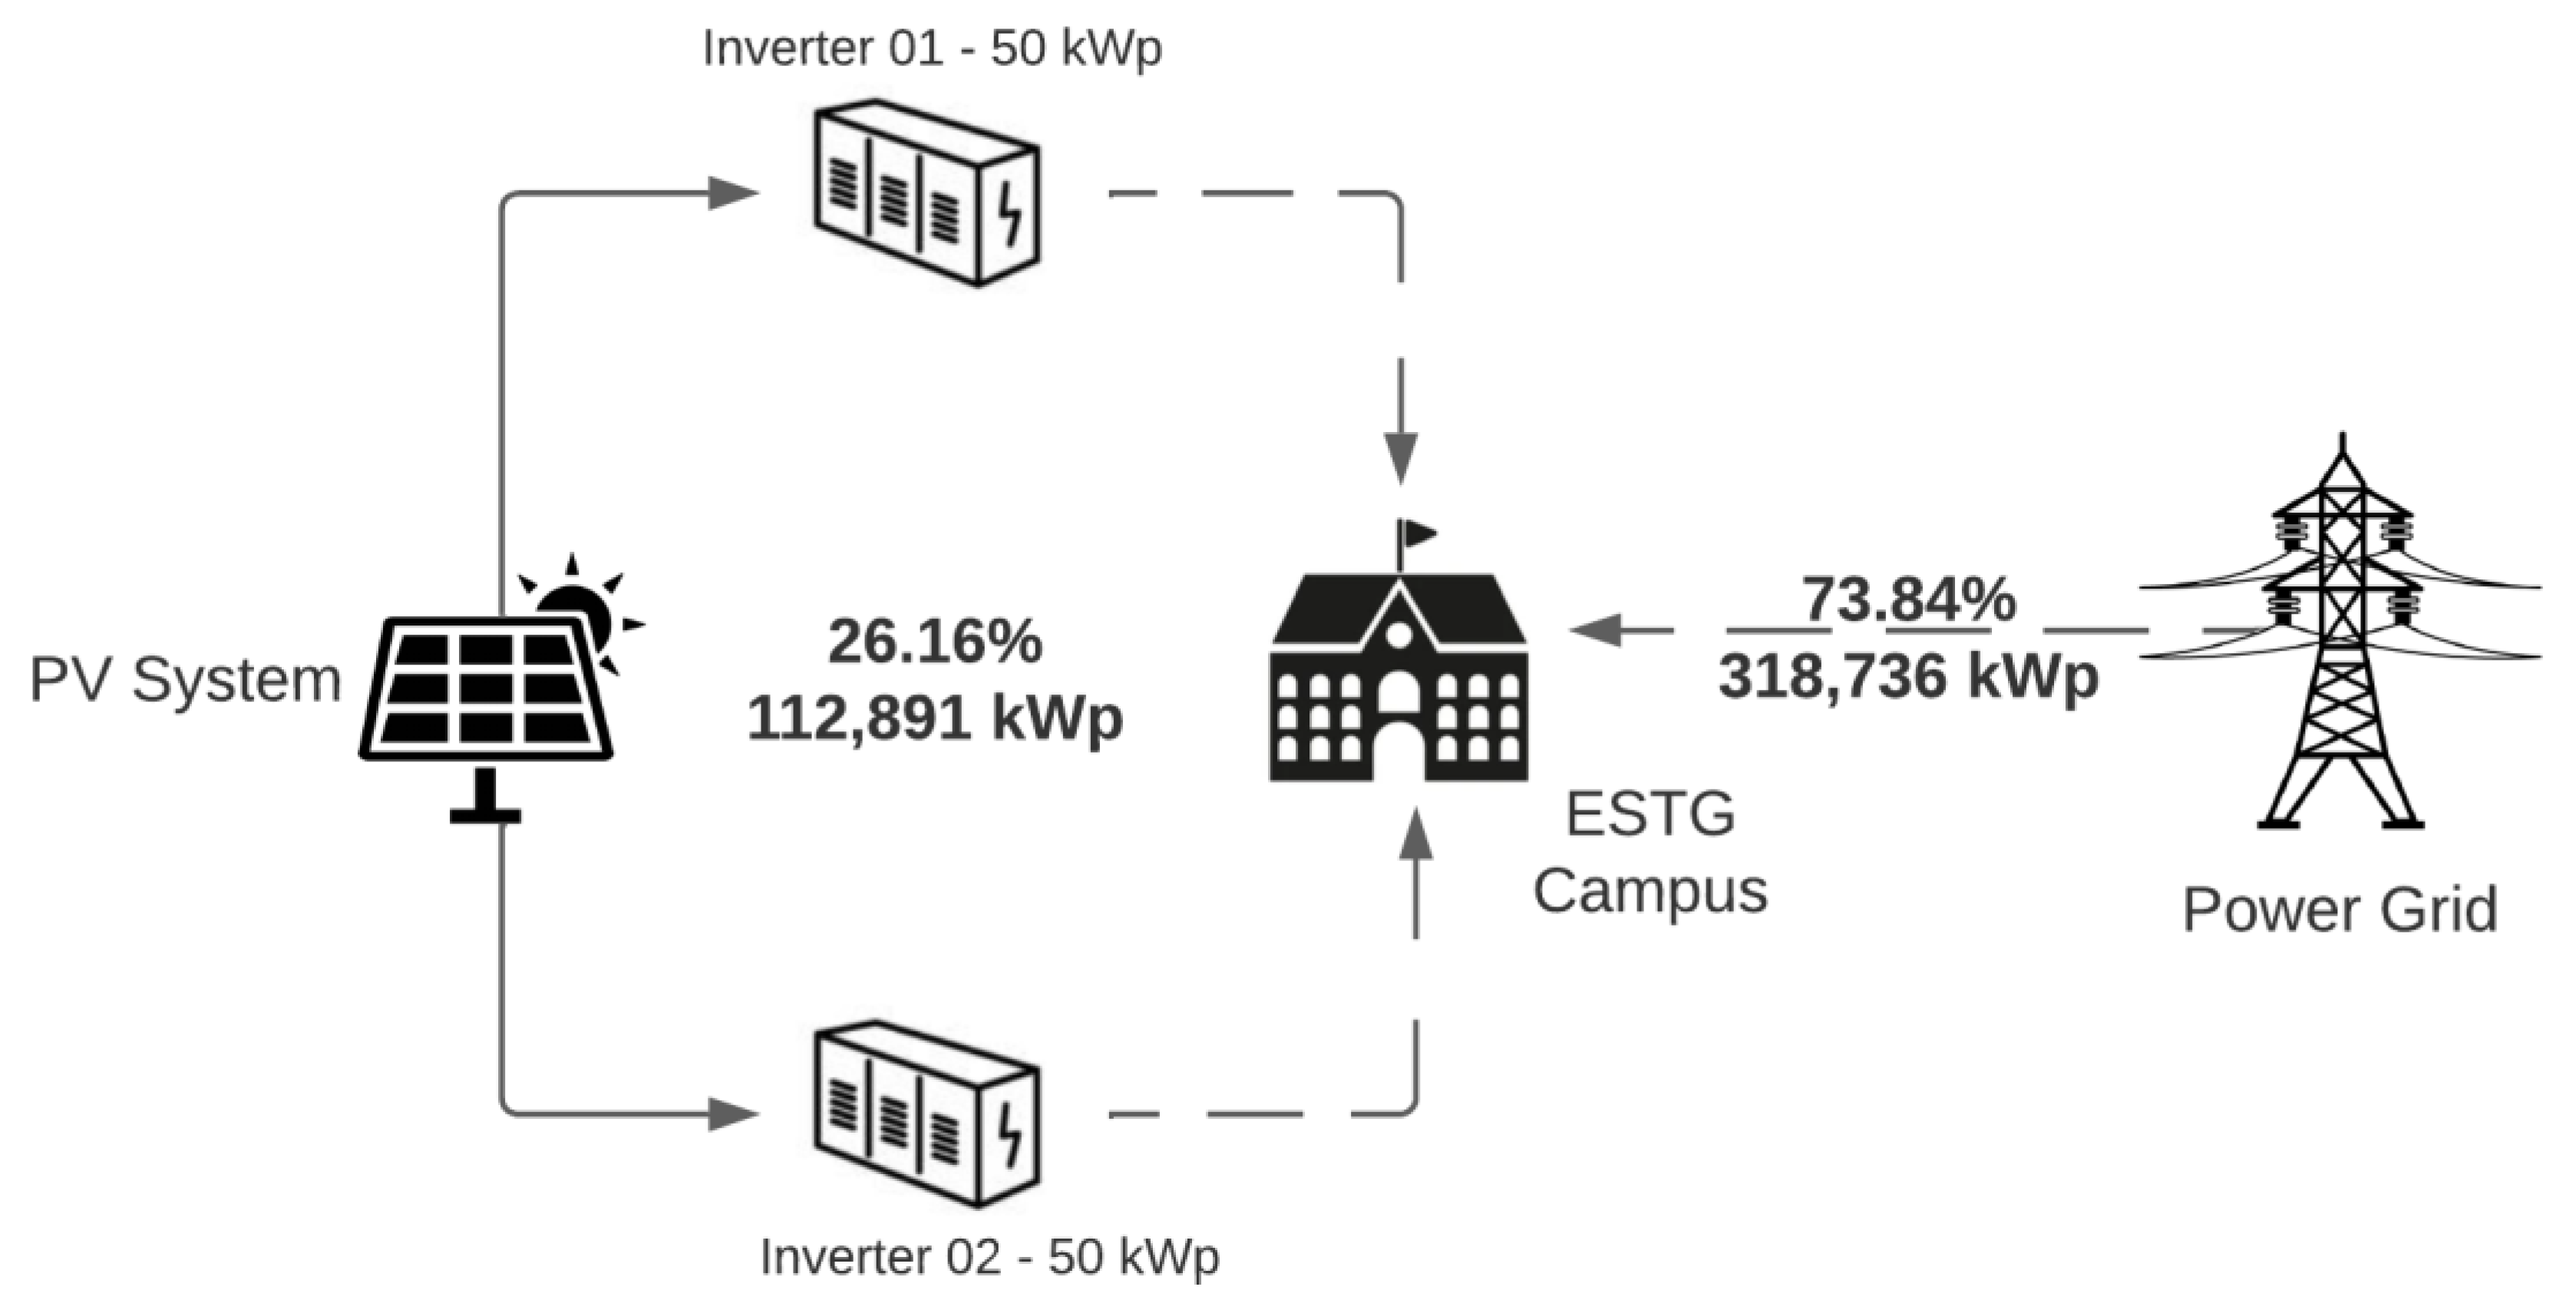
Figure 2 shows the integration of the building with the public grid and the photovoltaic system. The 102.8 kWp photovoltaic generator is divided into two subsystems, each of which will generate energy and send it to each of the inverters, which are devices that receive a direct current and convert it to an alternating current. After this transformation, the energy is injected into any point in the network where it can be absorbed, making it available through the electrical installation. As mentioned, the installation of this photovoltaic system is funded by a program that does not allow the generated electricity to be injected into the grid. Therefore, whenever the energy produced is higher than the energy consumed, the grid analyzer at the interconnection of the private installation with the power grid sends this information to the inverters that reduce the production power and adjust it to the current consumption.
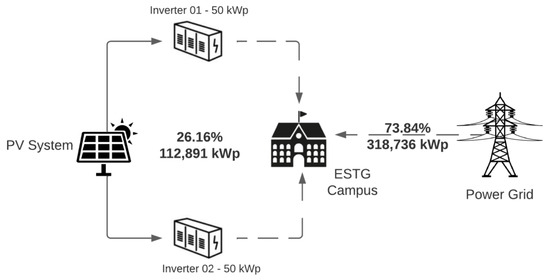
Figure 2.
Simplified scheme on the workings of the photovoltaic installation.
Table 1 shows the main technical characteristics of the photovoltaic modules installed in situ, with a maximum power (Pmax) of 455 W, a voltage (Vmp) of 41.82 V, and a current (Impp) of 10.88 A. The open circuit voltage (Voc) stands at 49.85 V, while the short circuit current (Isc) is measured at 11.41 A. These modules can operate within a temperature range of −40 °C to 85 °C. The temperature coefficients for Pmax, Voc, and Isc are −0.350%/°C, −0.272%/°C, and +0.044%/°C, respectively.

Table 1.
Specification of the used photovoltaic modules at standard test conditions.
3.2. Data Analysis
The data used to carry out the analysis were obtained from different sources and focused on the results that were intended to be achieved with this study. To estimate the production of the installed photovoltaic system, the PVGIS (Photovoltaic Geographical Information System) platform was used (available at https://joint-research-centre.ec.europa.eu/photovoltaic-geographical-information-system-pvgis_en, accessed on 14 July 2023). To obtain production data, the SMA Solar Technology AG platform directly, which allows data to be obtained in 15 min periods, was accessed. Consumption data were obtained from the load diagram of the Portuguese energy distributor E-REDES. Data were also collected from monthly electricity bills between 2014 and 2022, which allowed us to understand the consumption history of the facility under analysis.
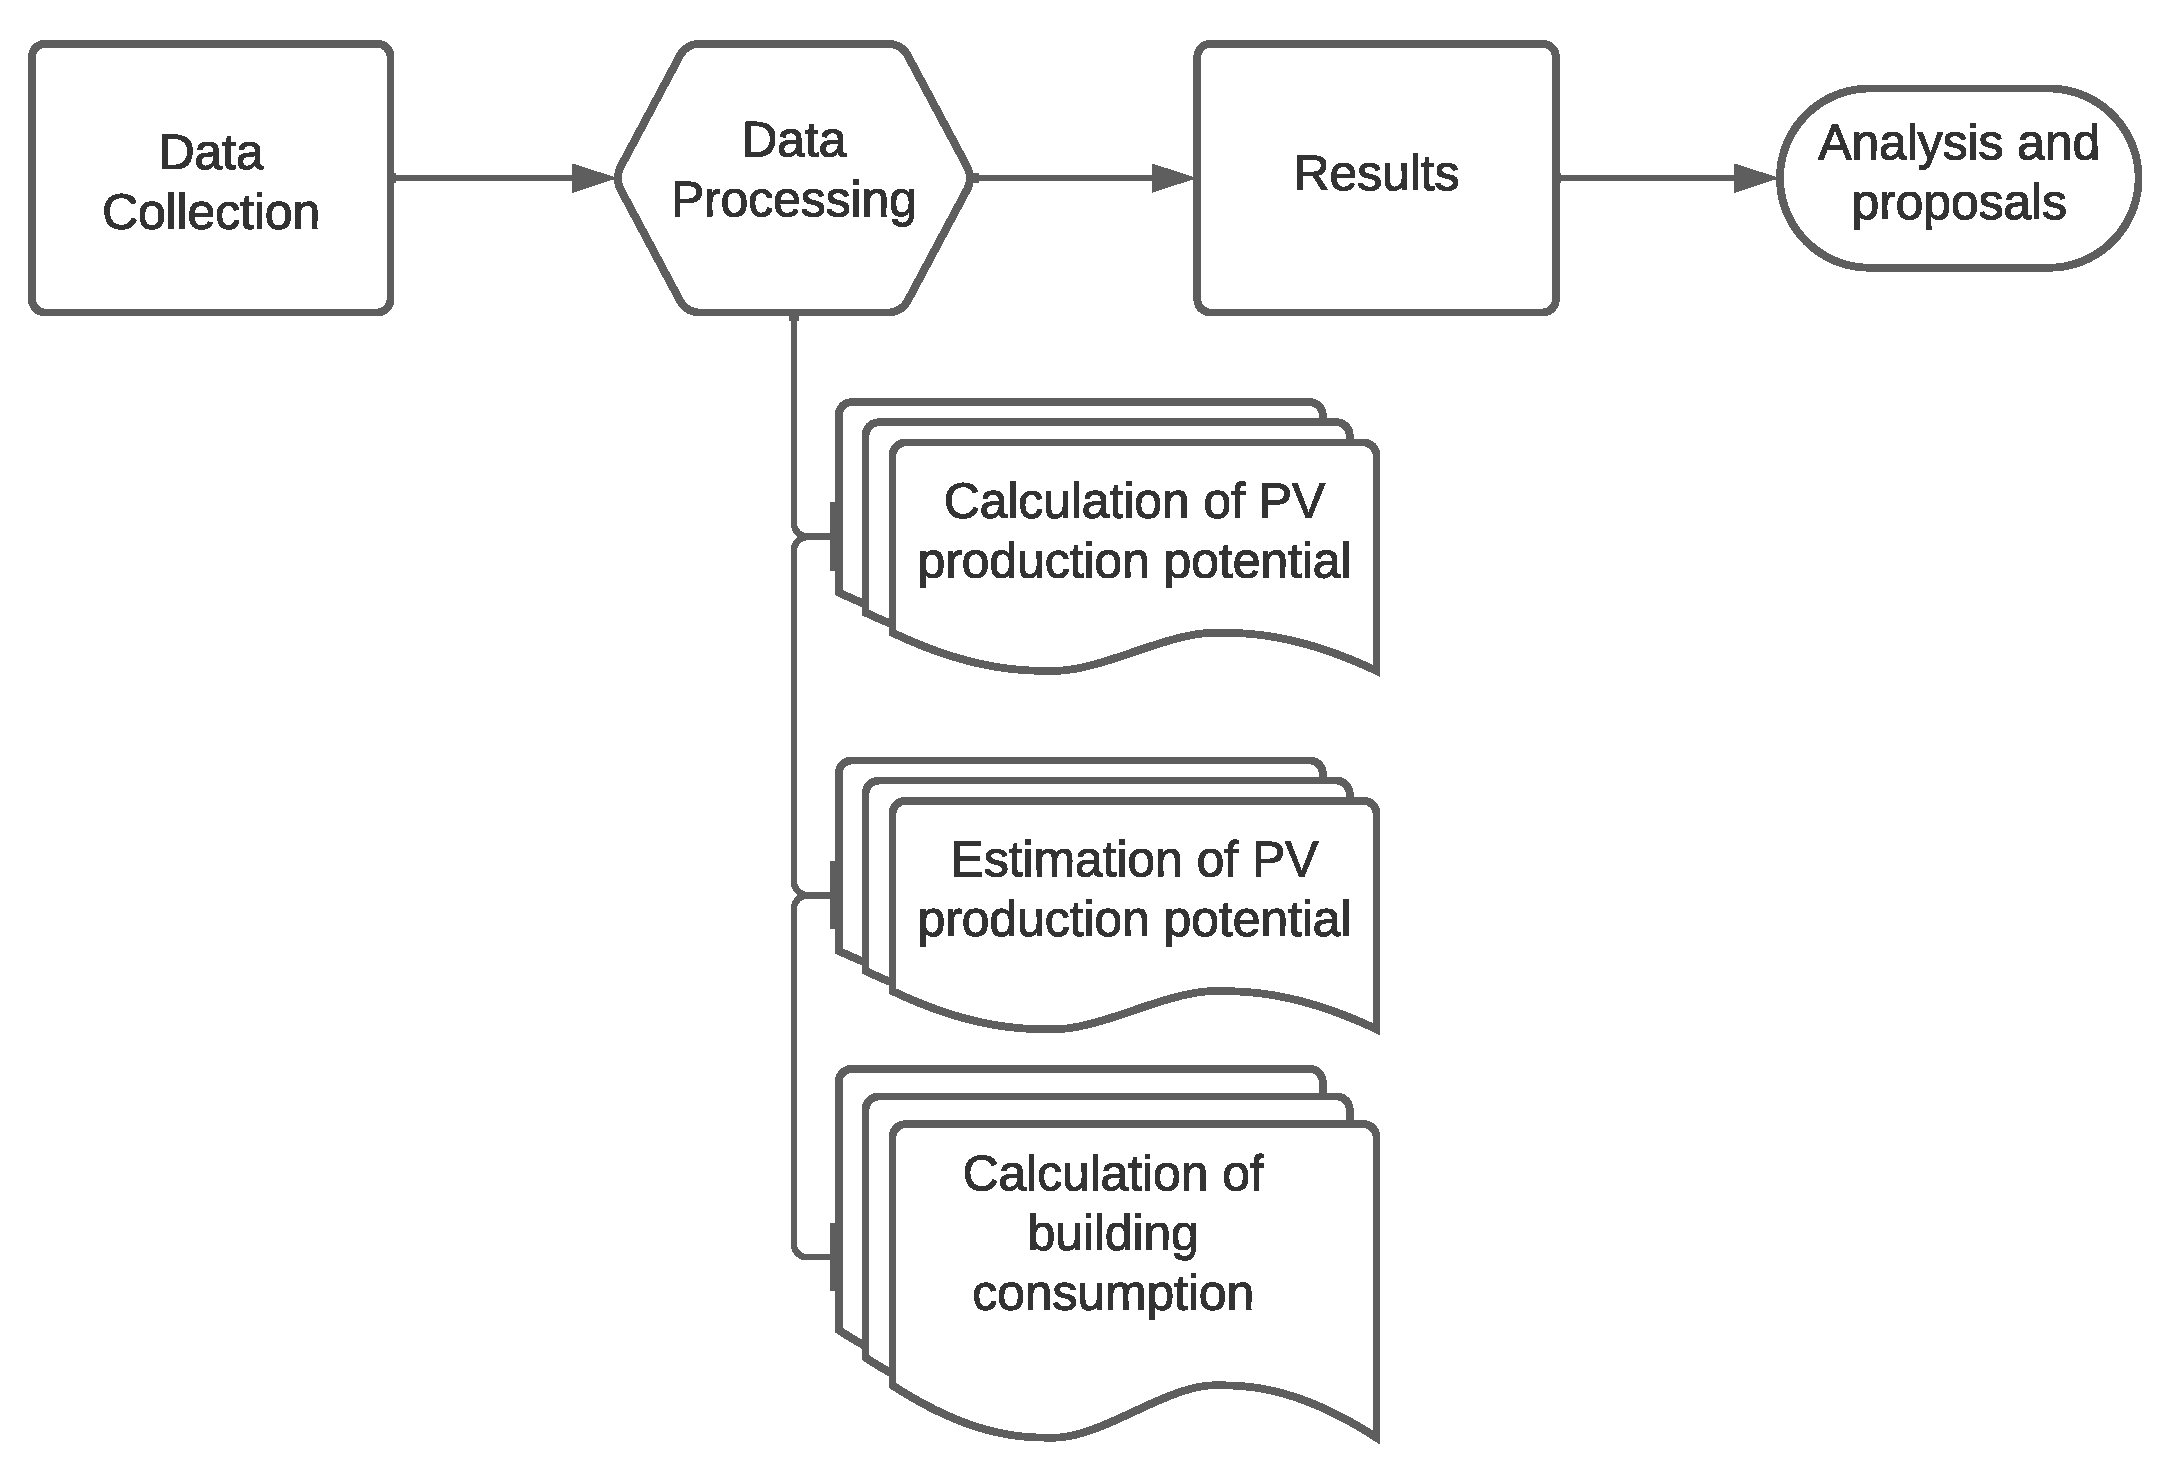
The data were collected, and the results were obtained using the algorithm shown in Figure 3.
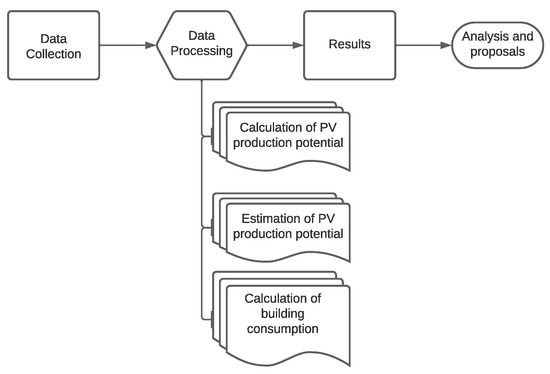
Figure 3.
Methodological algorithm used in this study.
3.3. Energy Sharing
Recently, two concepts have emerged enabling individuals, communities, or groups to collectively manage, consume, and share energy resources. These concepts are renewable energy communities (RECs) and collective self-consumption. Both initiatives aim to promote renewable energy use, community involvement, and sustainable energy practices.
RECs comprise various individuals or legal entities collaboratively producing, consuming, and managing energy. Their primary goal is to boost renewable energy production, foster local energy generation, and engage citizens in energy transition.
Collective self-consumption refers to a scheme where a group shares energy produced from renewable sources, like solar panels. Surplus energy can be fed back into the grid, benefiting the collective’s other members.
The European Union has supported energy communities through several legislative measures. Notably, the “Clean Energy for All Europeans” package, adopted in 2018, supports the growth of renewable energy communities. This package encompasses the following:
- The Renewable Energy Directive (2018/2001/EU): This directive provides guidelines to aid renewable energy projects, including those by energy communities [22].
- The Electricity Market Directive (2019/944/EU): This seeks to integrate renewable energy sources better and eases the energy communities’ participation in the electricity market [23].
- The Governance Regulation (2018/1999/EU): This regulation outlines rules for integrated planning and relaying information on Member States’ energy and climate actions, including provisions about energy communities [24].
Several EU Member States have adapted their energy laws to encourage the formation and functioning of energy communities and collective producers. The following are examples:
- -
- In Germany, the Renewable Energy Sources Act (Erneuerbare-Energien-Gesetz or EEG) allows energy communities to engage in the electricity market and receive financial support for renewable energy production [25].
- -
- Spain introduced regulations in 2019, like the Real Decreto 244/2019 [26], enabling collective self-consumption, where multiple consumers can co-own and benefit from a renewable energy installation.
- -
- Italy initiated a framework for energy communities in 2019 through the “Climate Decree”, aiming to back community-level renewable energy projects [27].
Following European directives, Portugal has also released national legislation to support this transition:
- -
- The early steps in the self-consumption regime were introduced by Decree-Law No. 153/2014 [28], regulating collective self-consumption in Portugal.
- -
- In 2019, Decree-Law No. 162/2019 [29] established the legal framework for energy communities in Portugal. This legislation was complemented by Ordinance No. 14/2019.
- -
- In 2022, Decree-Law No. 15/2022 [30], superseding Decree-Law 162/2019 [29], adapted the legal framework for self-consumption.
Collective self-consumption optimizes photovoltaic systems. In specific installations, nearby public and private entities can benefit from energy sharing, especially when consumption profiles differ, enhancing the photovoltaic system’s utilization [31,32].
4. Results and Discussion
4.1. Calculation of PV Energy Production Potential and Distribution of Production
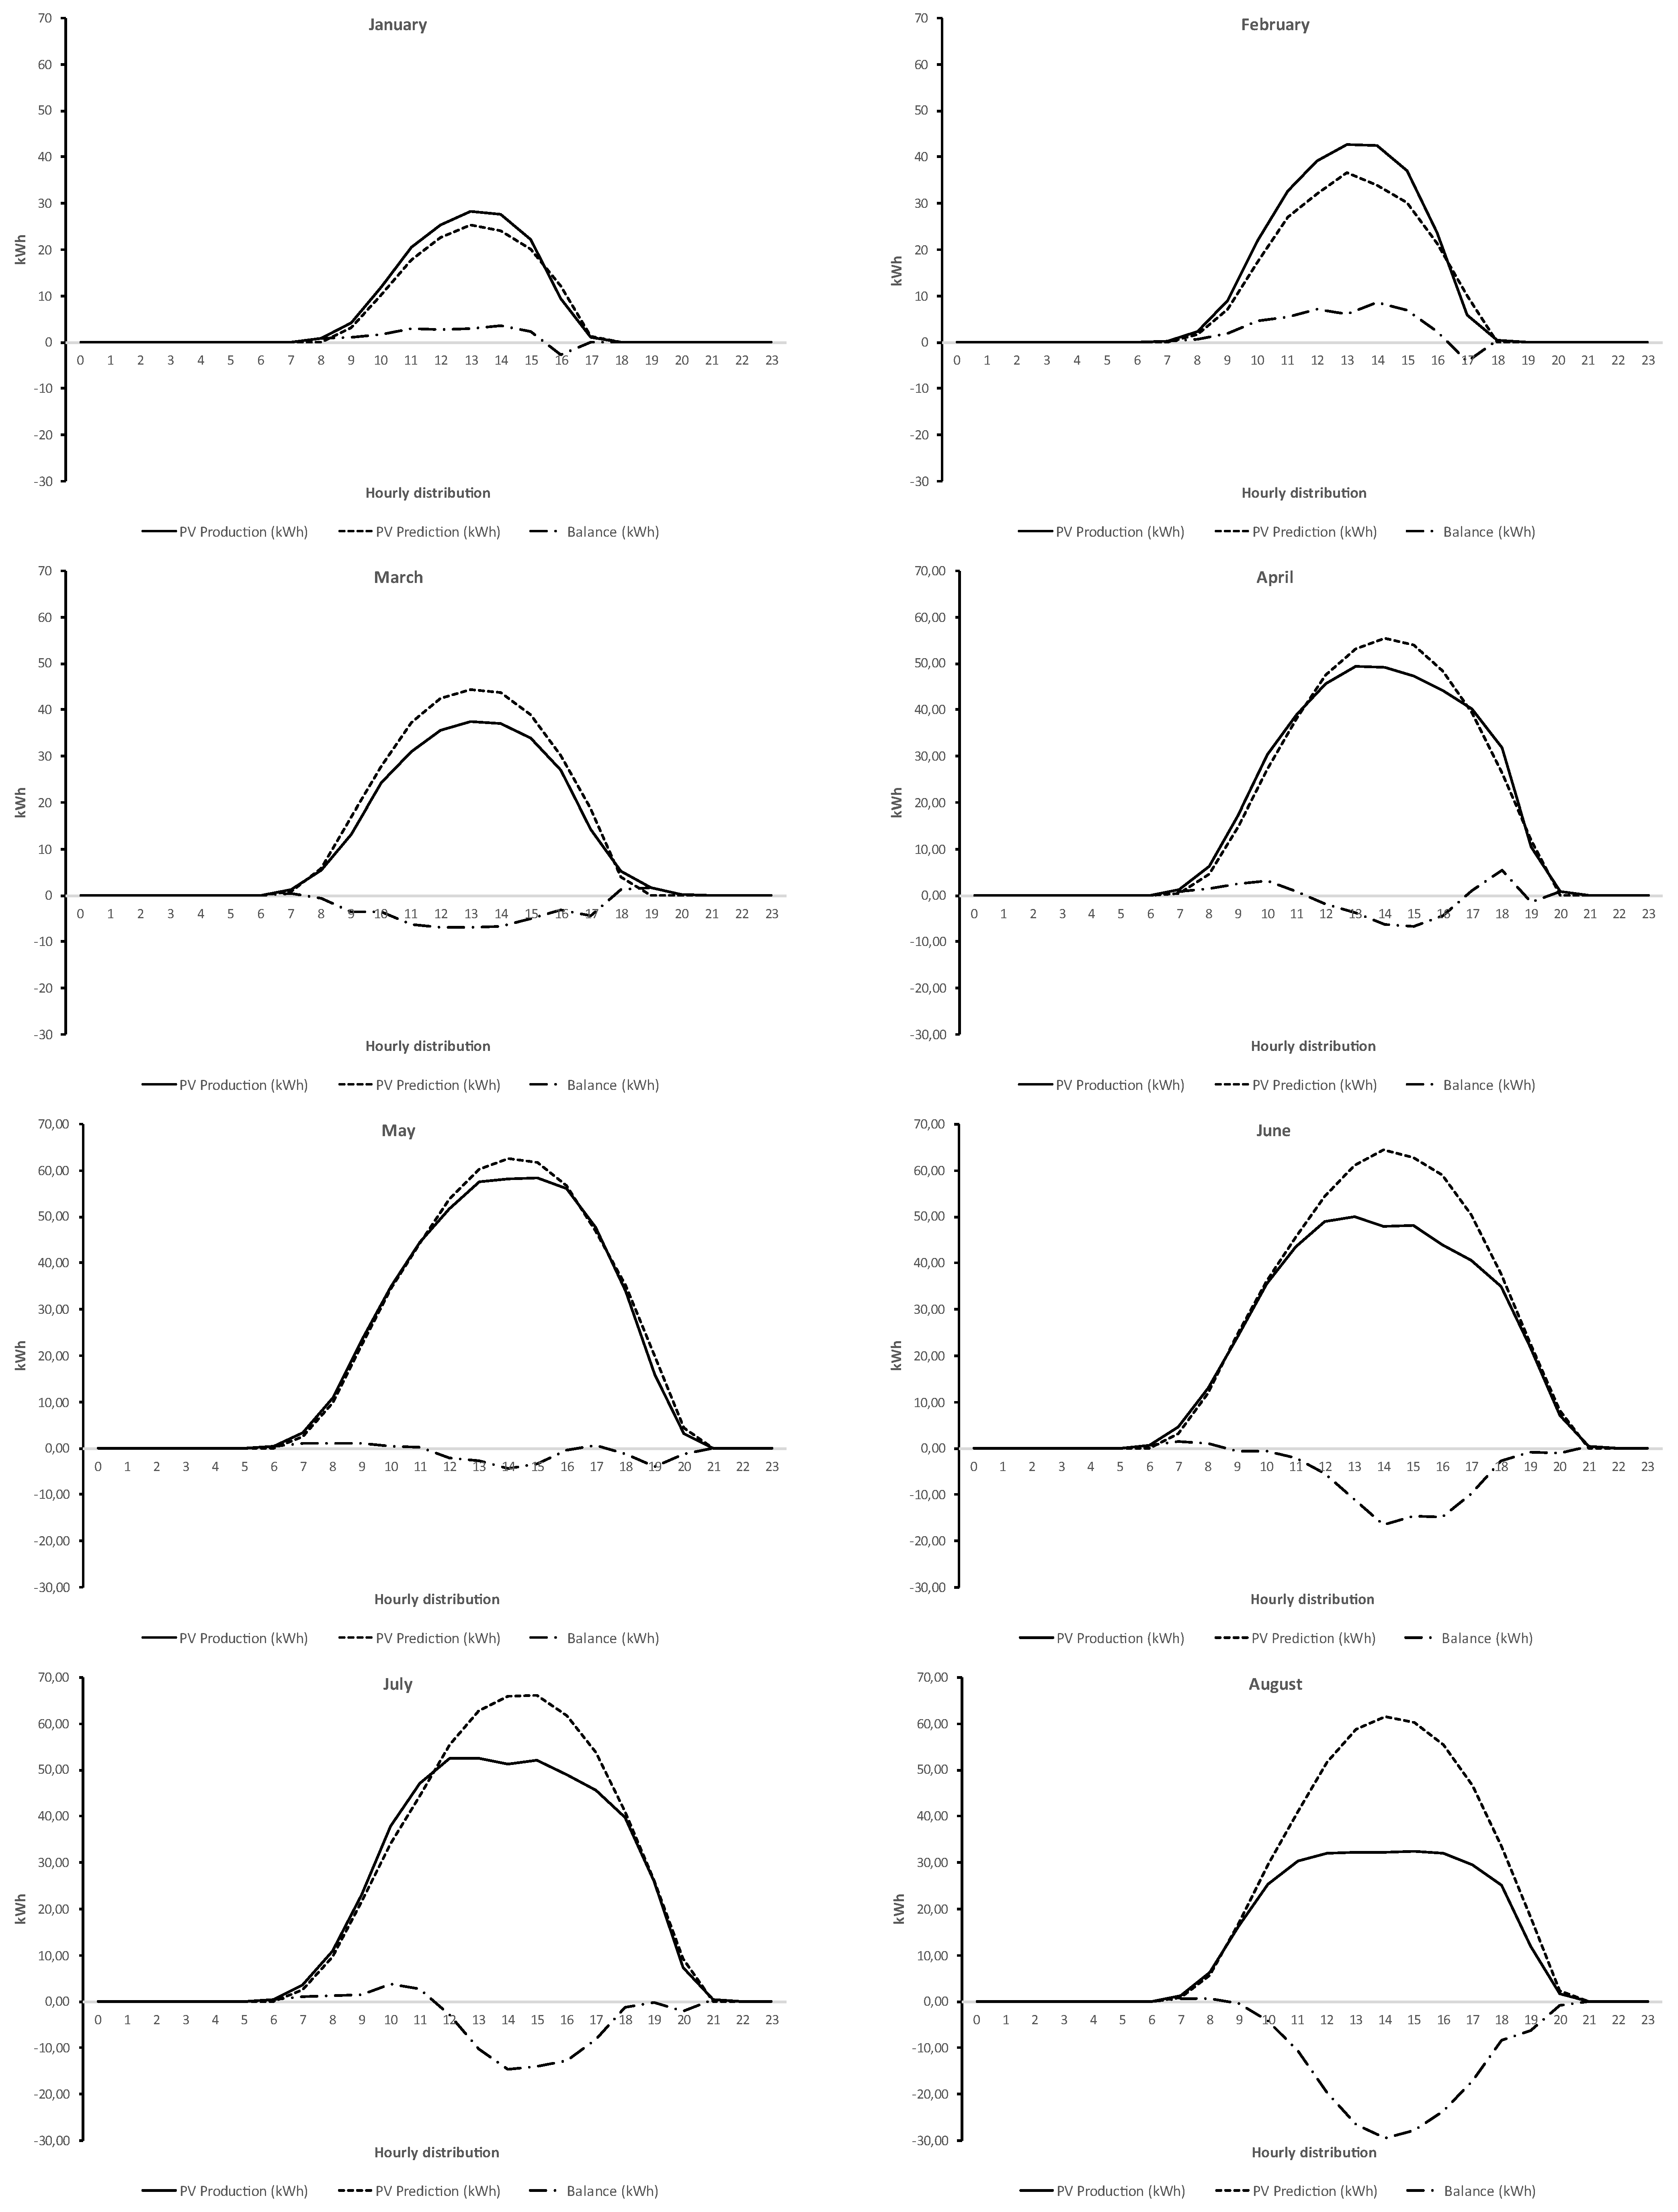
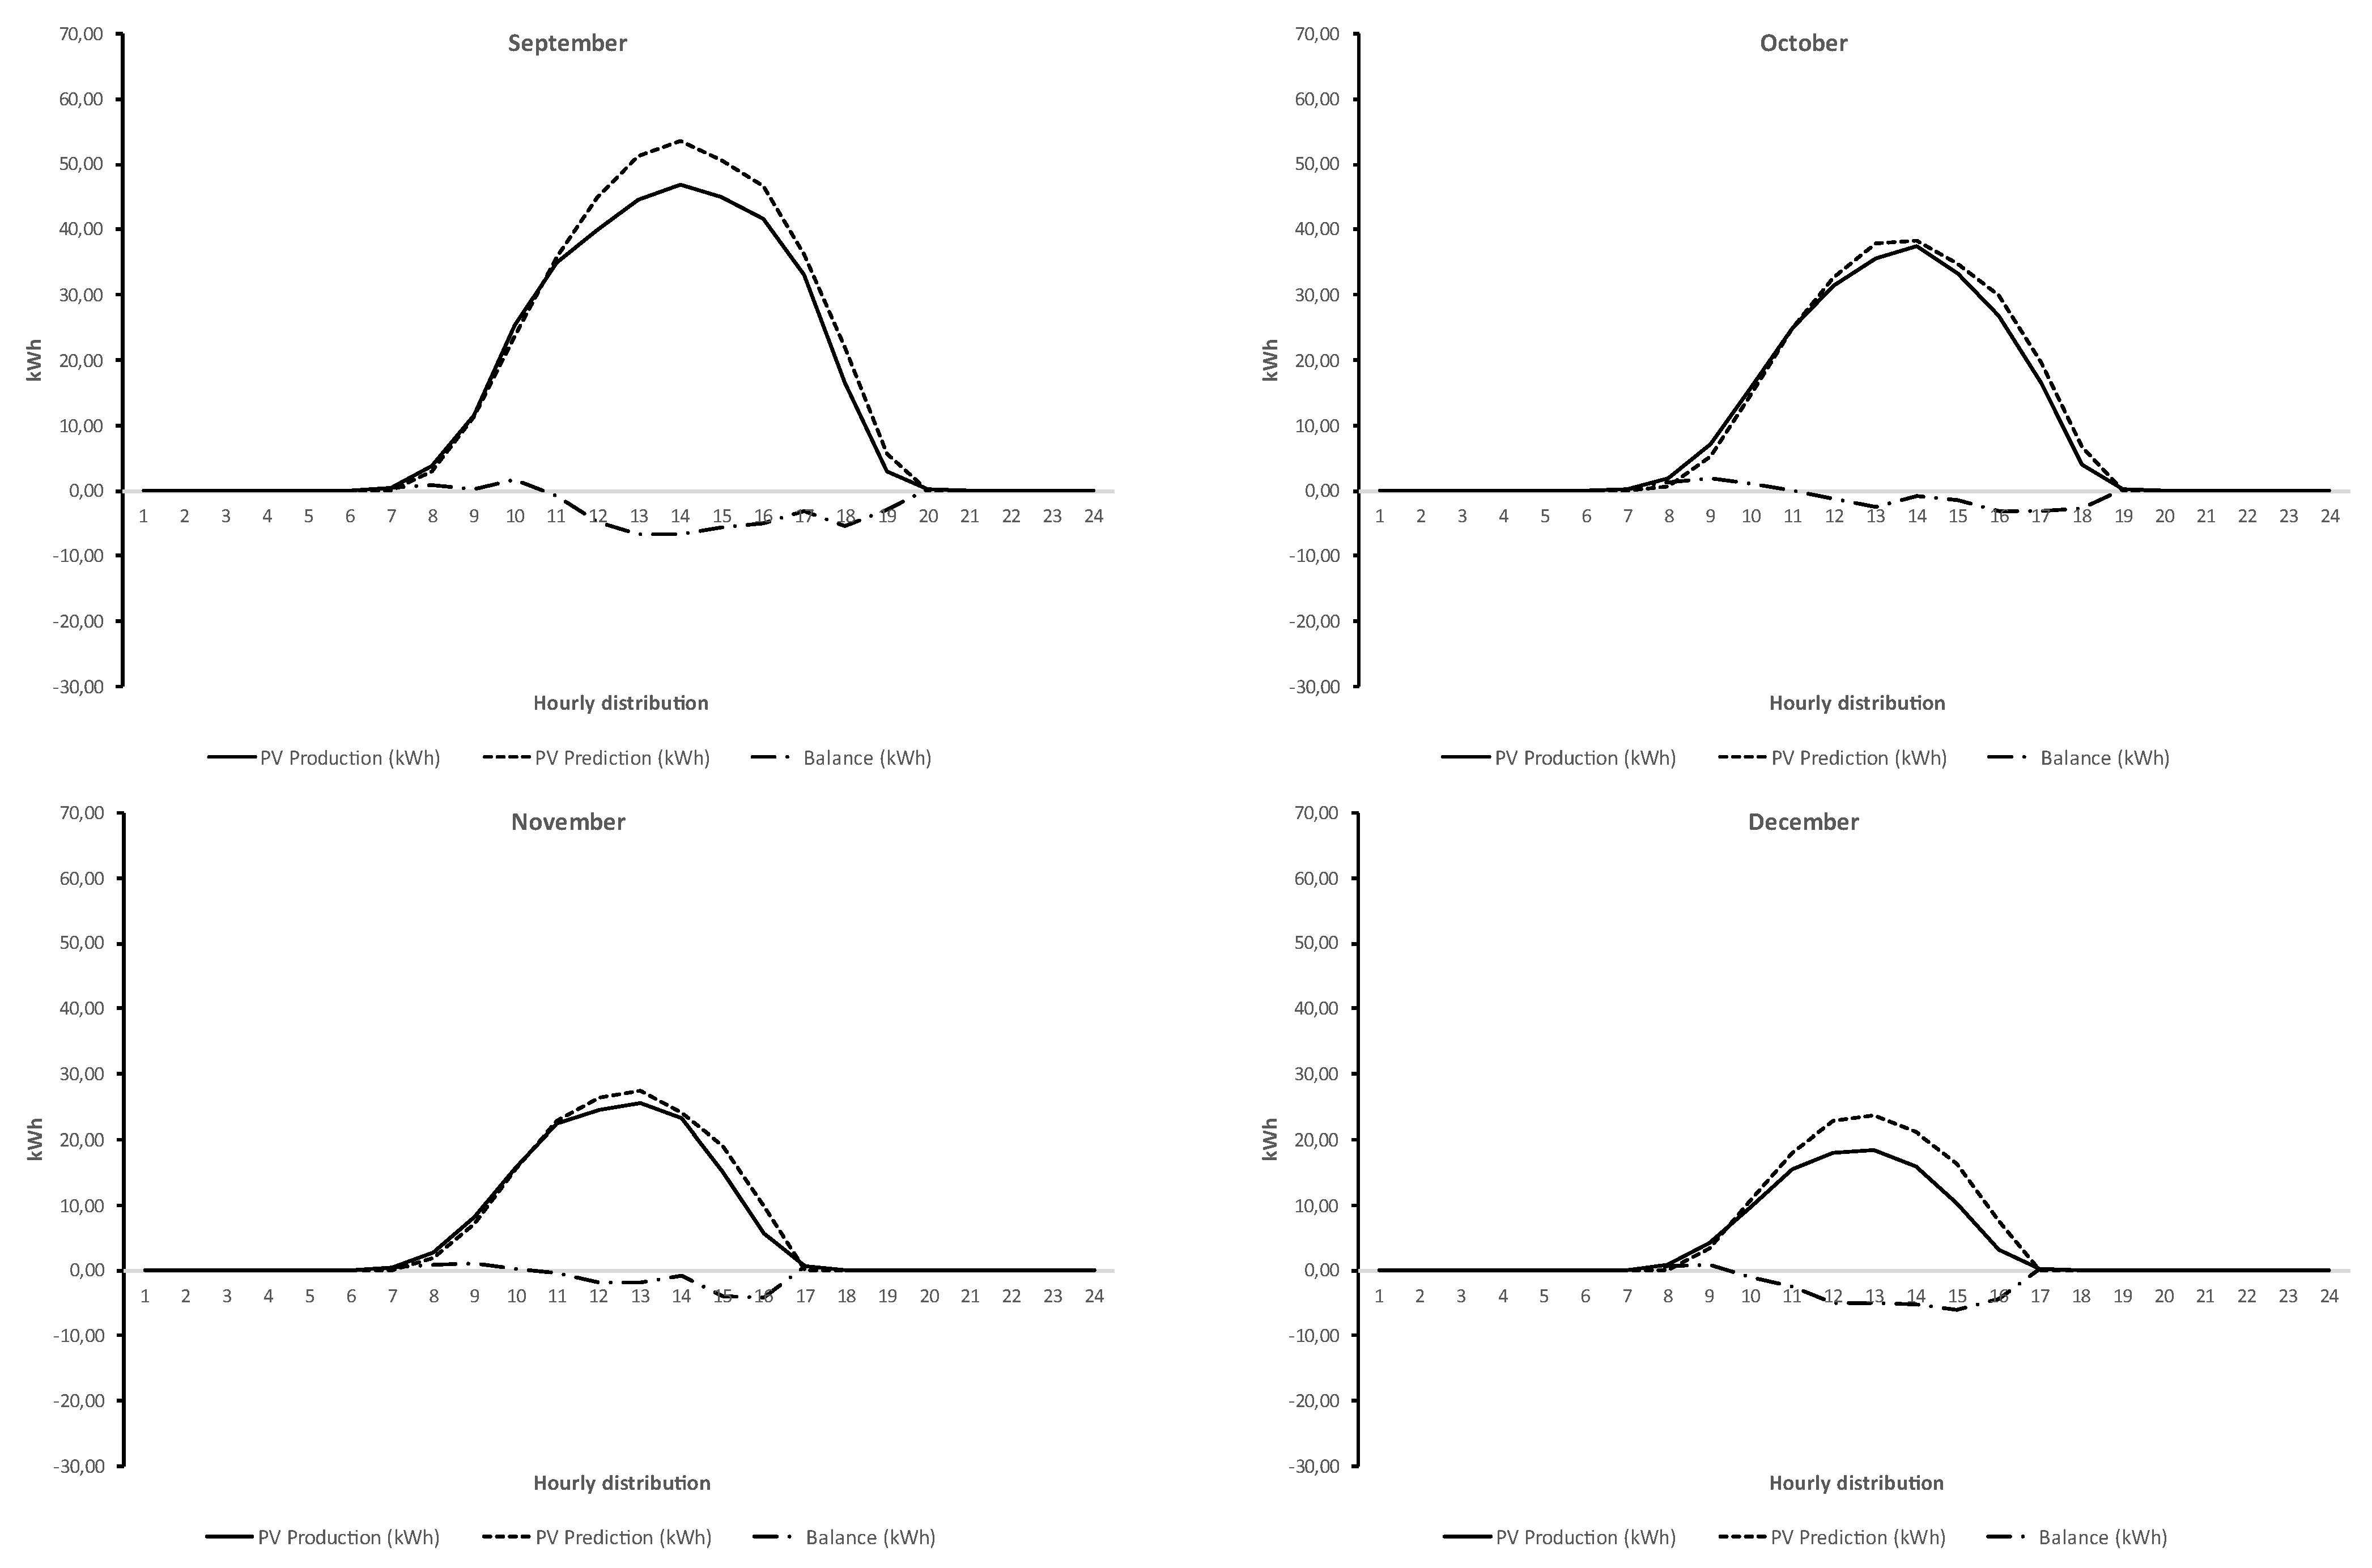
The graphs presented in Figure 4 show the 12-month production data of the 102.8 kWp photovoltaic system installed at the ESTG campus and the production estimate obtained using the PVGIS (Photovoltaic Geographical Information System) platform (available at https://joint-research-centre.ec.europa.eu/photovoltaic-geographical-information-system-pvgis_en, accessed on 15 March 2023) based on the data obtained between 2010 and 2020, as well as the balance between these two variables (PV production vs. PV prediction). The analysis of the results shows that when the balance is positive, production is higher than average, and when the balance is negative, it means that the production is lower than the value estimated by prediction. This scenario occurs mainly between March and December, due to the fact the electricity produced by the PV system is not injected into the grid. As expected, this value is higher in the summer months (June, July, and August), because electricity production increases with the solar radiation, and the consumption gradually falls with the end of the school year, reaching a minimum value in August, when the school is almost empty.


Figure 4.
Distribution of production, prediction, and average monthly balance on an hourly basis.
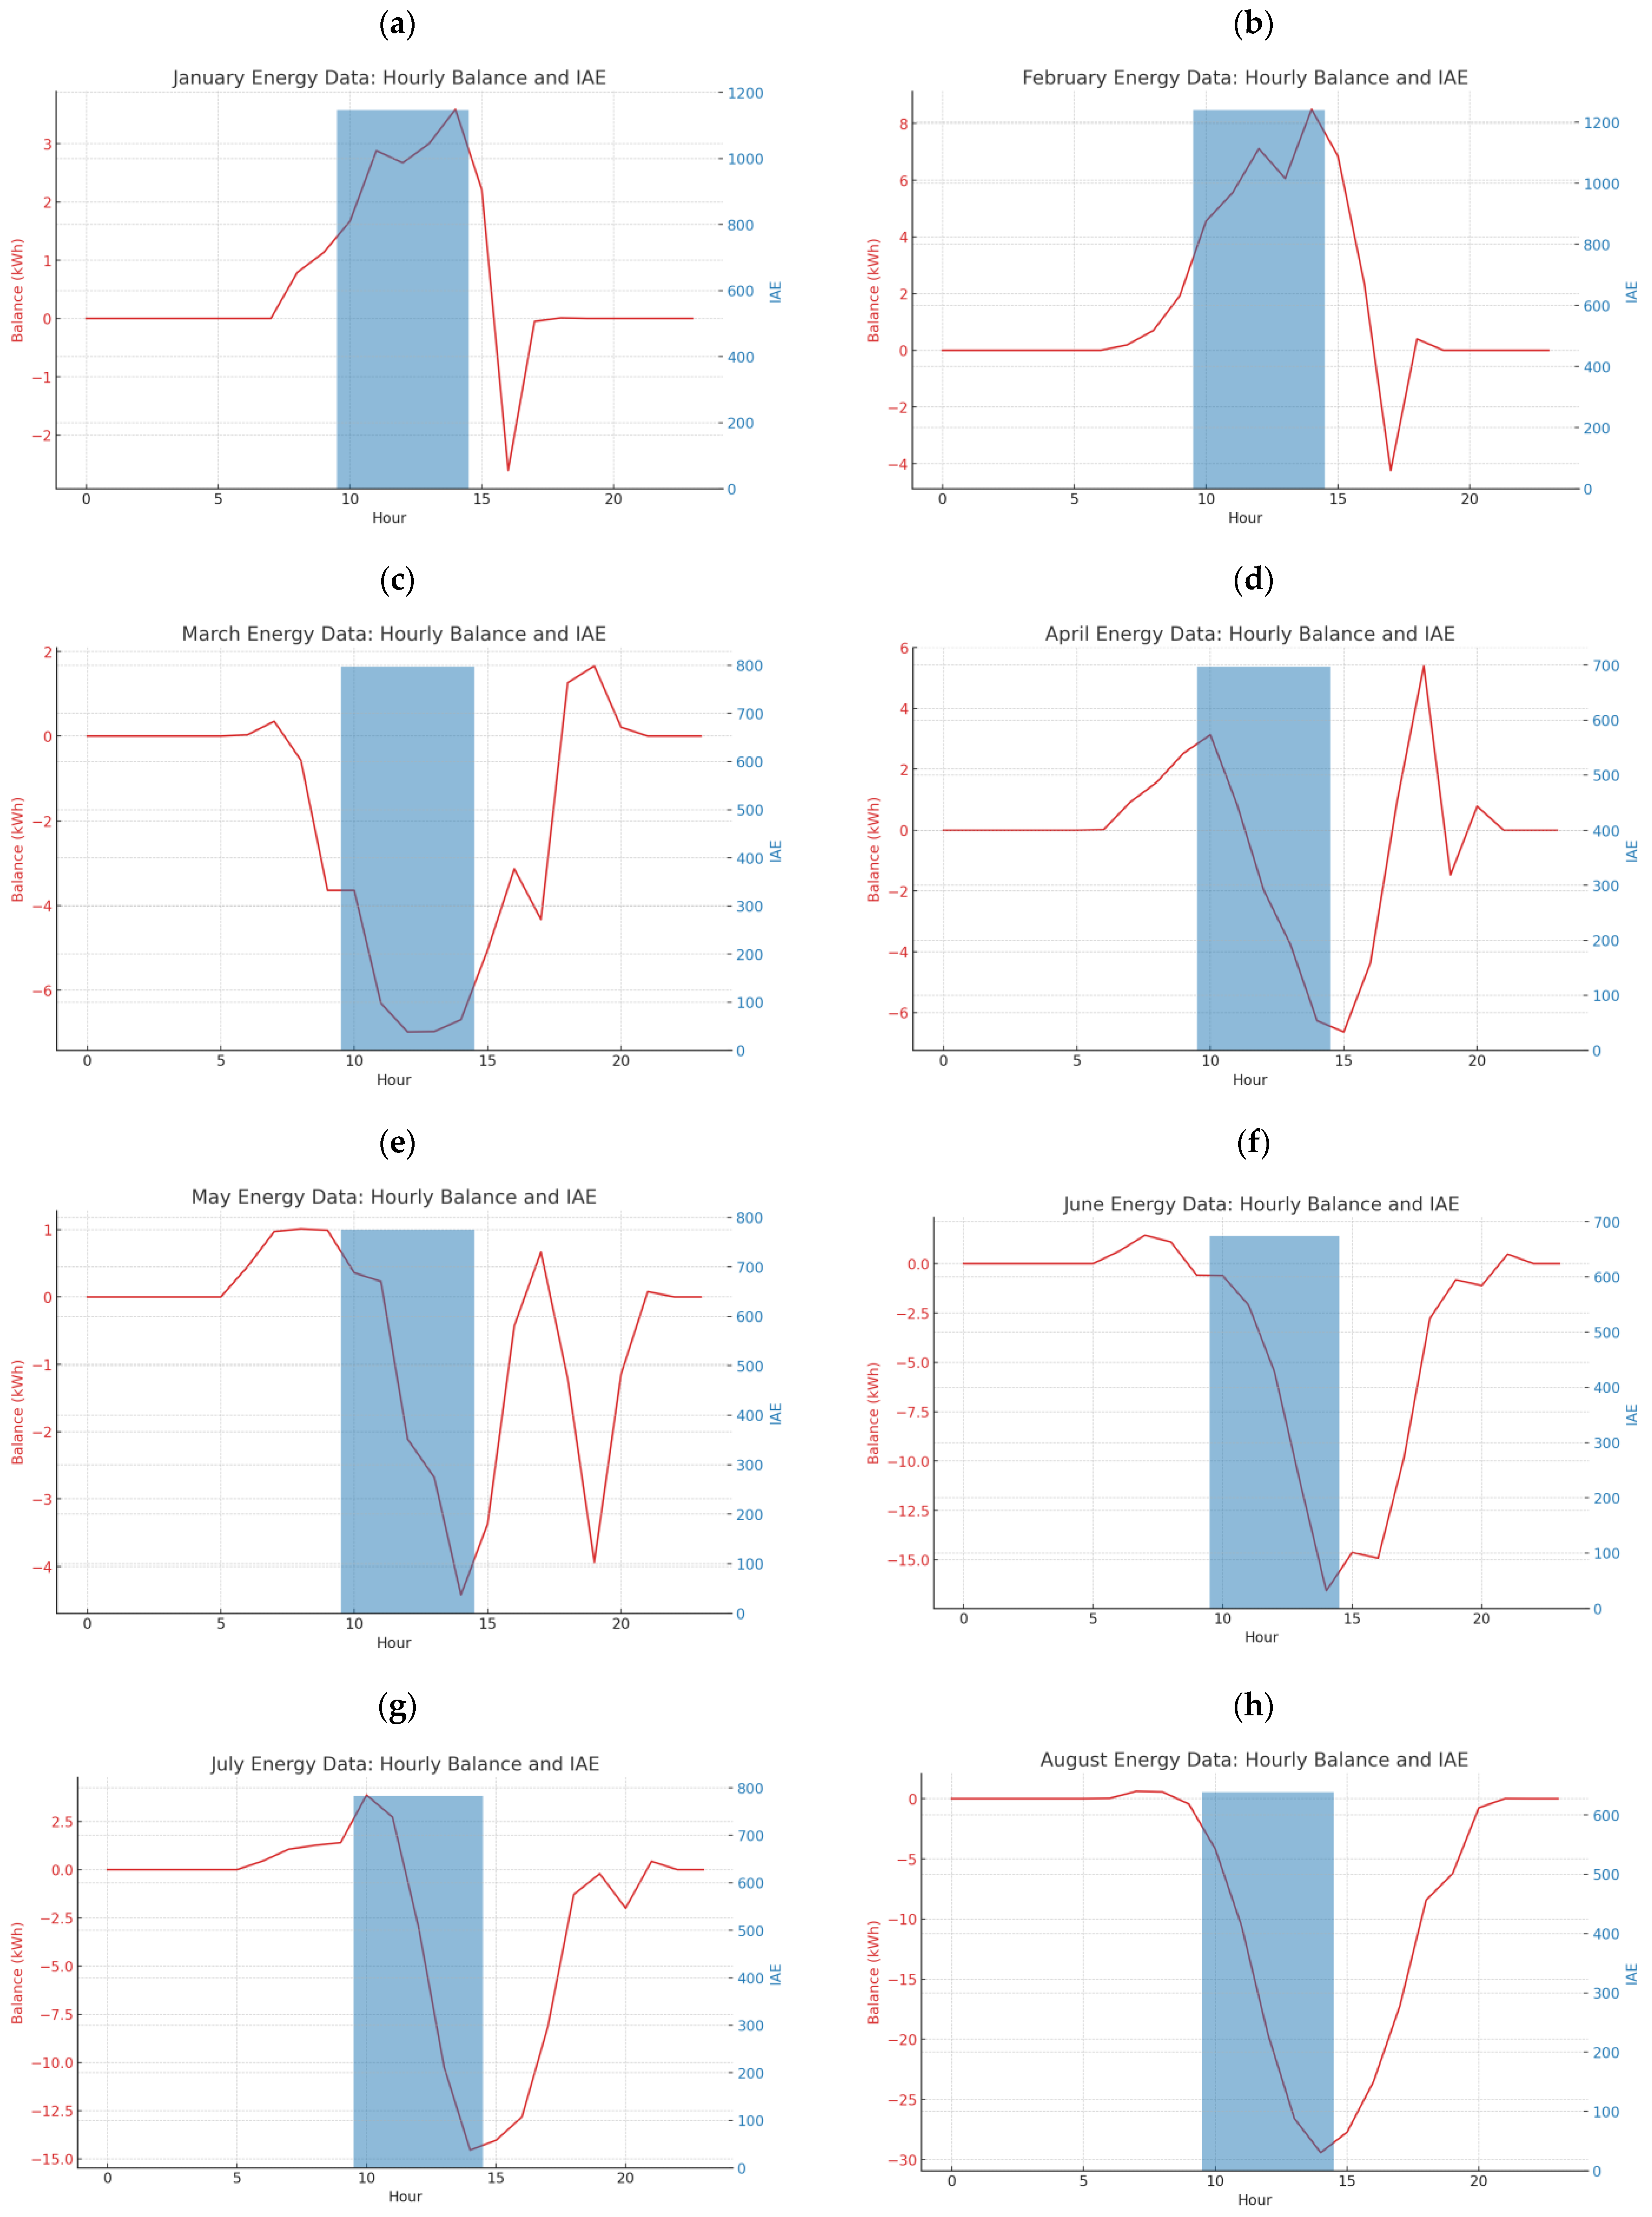
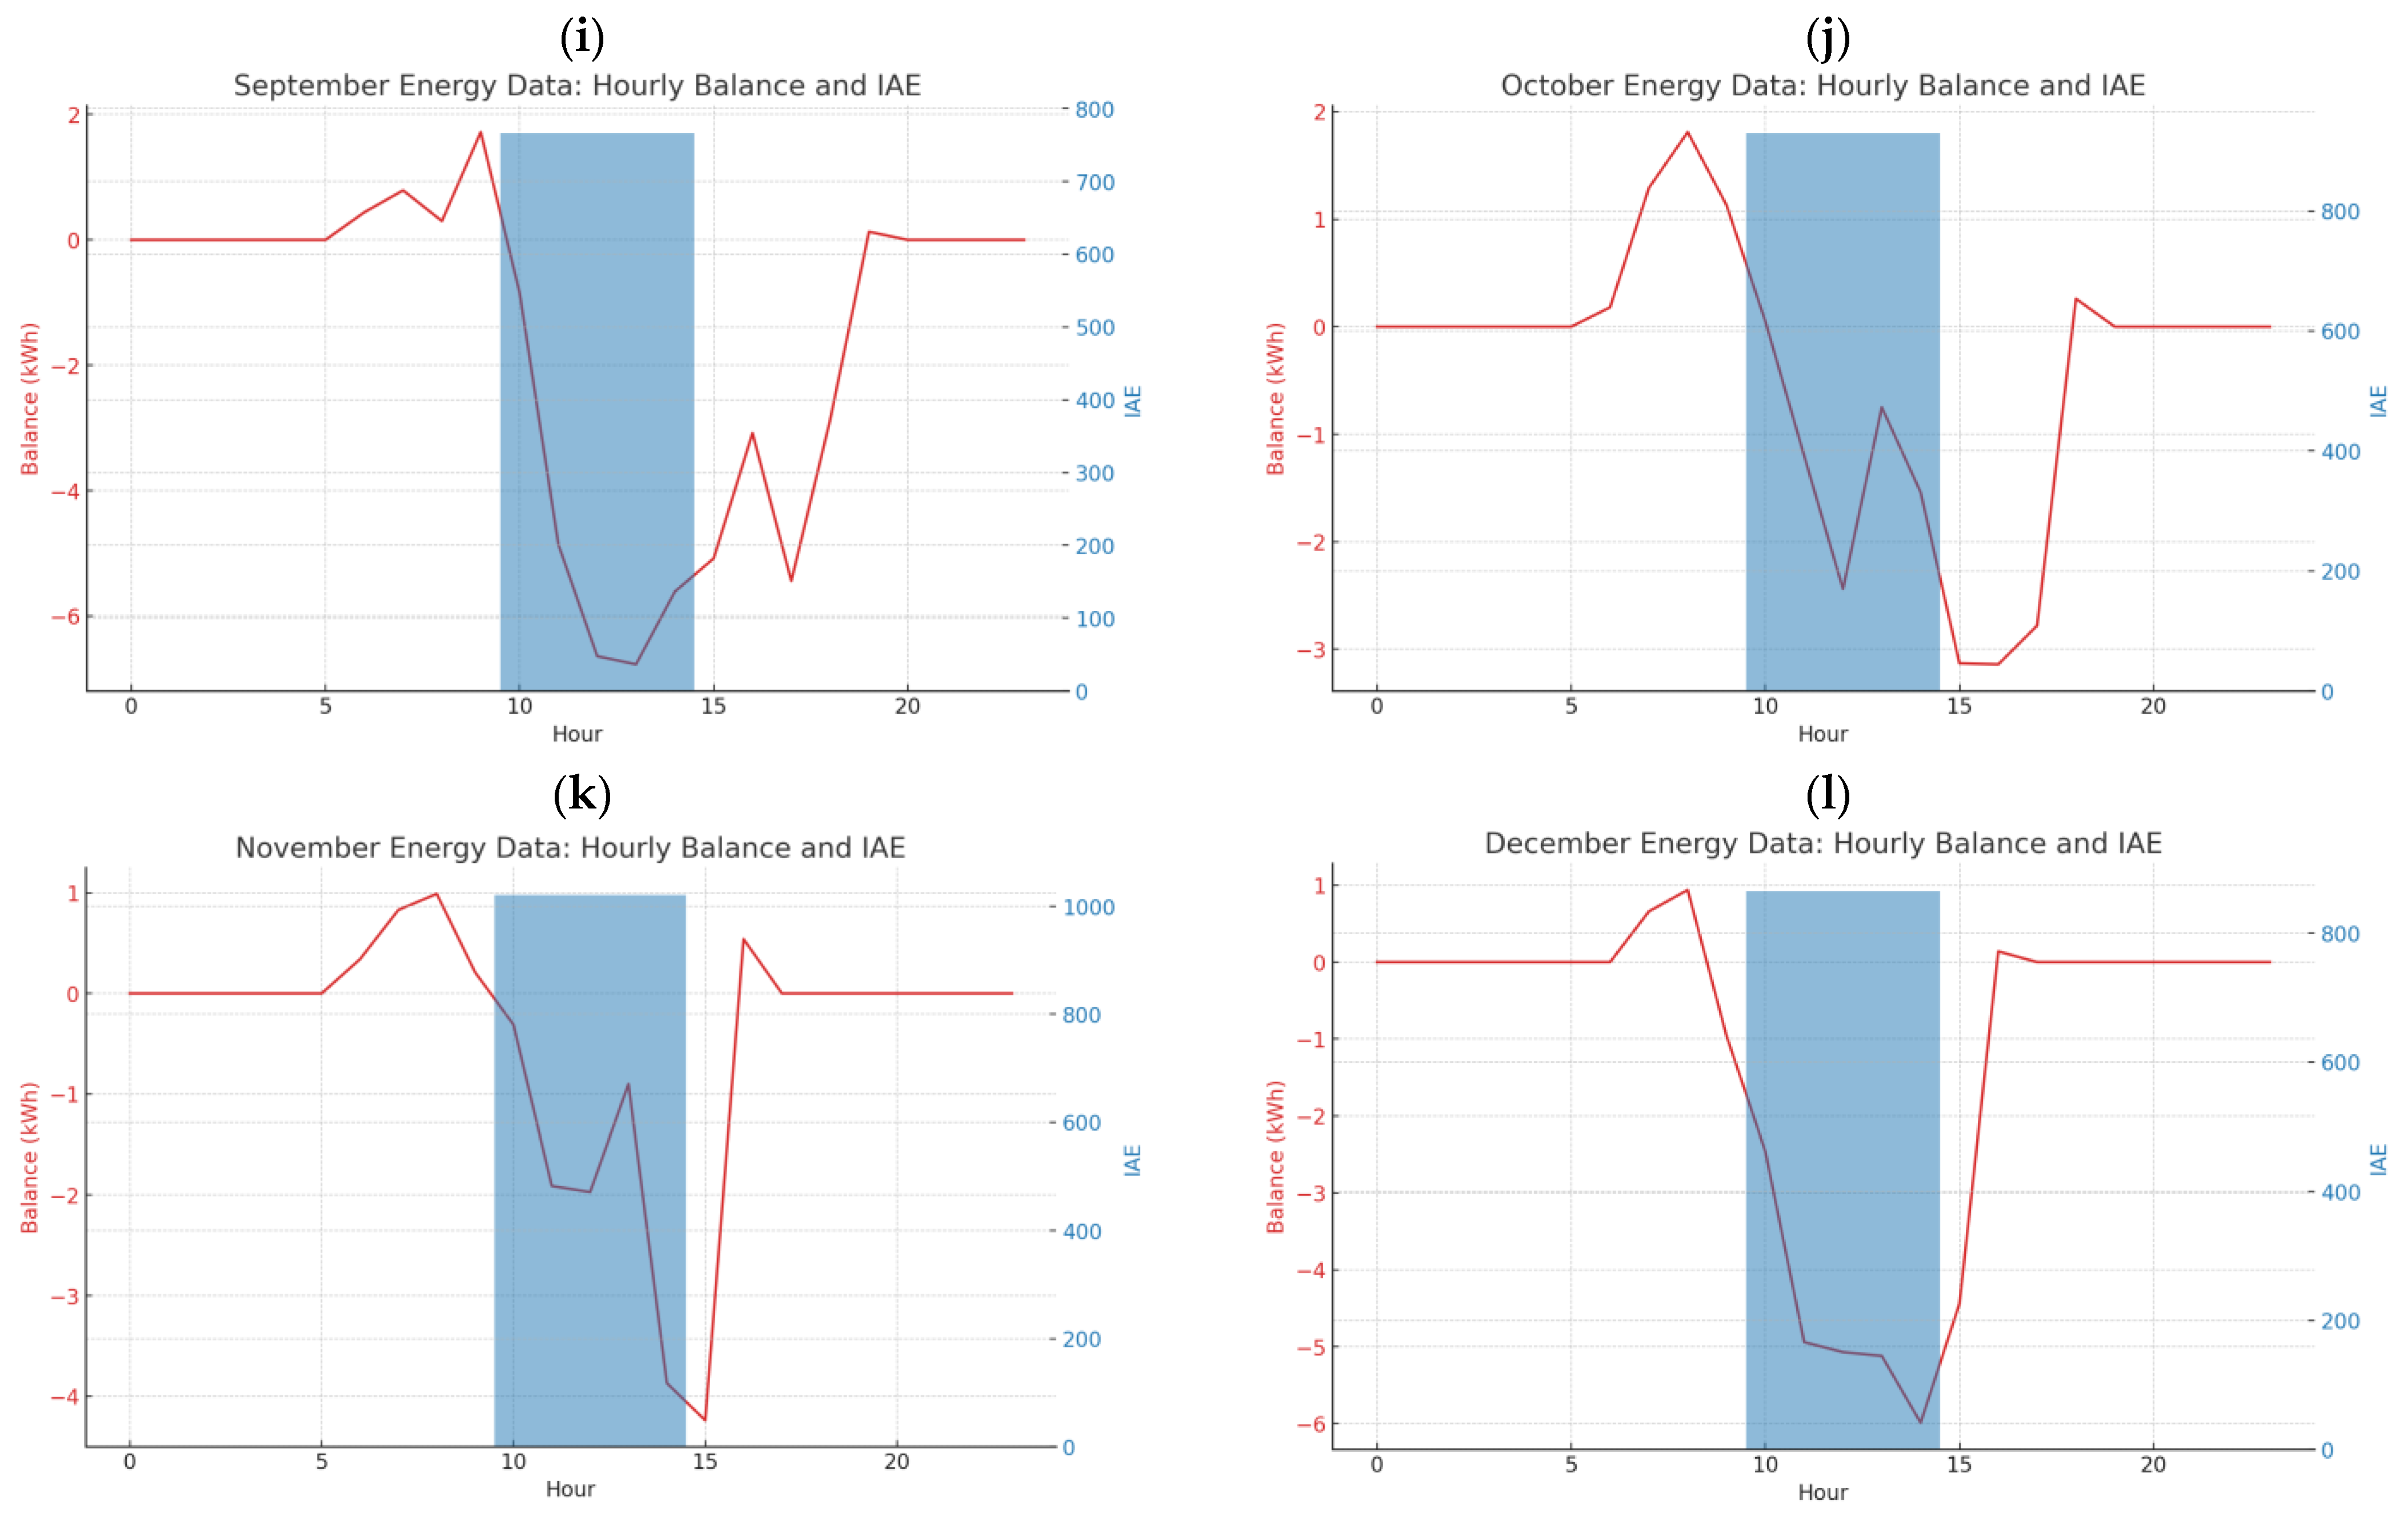
When analyzing the results, the integral absolute error (IAE) and standard deviation (SD) are metrics used to quantify errors and variability in data, respectively. The IAE for January is 1146.97, for February it is 1239.58, and for March it is 796.83. These values represent the cumulative absolute differences between consumption and production across each month, indicating that February had the highest imbalance, followed by January, with March being the most balanced month. The standard deviation for January is approximately 12.61, for February it is about 12.83, and for March it is around 13.47. These values measure the variability of the energy balance from the average for each month. A higher standard deviation indicates a larger spread of balance values around the mean. March shows the highest variability, which may be due to the presence of energy production data that slightly offsets the otherwise constant negative balance due to consumption. The IAE for April, May, and June are 696.89, 774.96, and 674.07, respectively. These values indicate that May had the highest total imbalance, suggesting that the energy system faced the largest cumulative shortfall between energy consumption and production during this month. The SD measures the dispersion of the balance values around their mean. The SDs for April, May, and June are approximately 27.70, 32.30, and 27.79, respectively. The higher SD in May corroborates with the IAE findings, suggesting that not only was the imbalance greater in May, but the fluctuations in the balance were also more pronounced compared to April and June. This could imply more variability in either consumption patterns or production output or both during May. Overall, these metrics suggest that the energy system’s performance was most erratic in May, with both higher discrepancies and greater variability in the energy balance. For July, the IAE was calculated at 782.96, indicating the total magnitude of the energy deficit over the month. The SD was 34.87, reflecting the variability in the hourly balance. August showed an improvement with a lower IAE of 638.39 and a smaller SD of 27.69, suggesting a more consistent and closer energy balance between consumption and production. In September, while the IAE increased slightly to 766.03 compared to August, the SD remained relatively similar at 27.83, indicating stability in the balance fluctuations despite the higher total deficit. The reduction in the IAE from July to August implies an overall improvement in the balance, which is possibly due to better energy management or increased production. The consistency in the SD between August and September, despite a higher IAE, might suggest that while the overall deficit increased, the balance did not become more volatile, which could be seen as a positive aspect of energy management for those months. In October, the IAE was 929.20, which reflects the sum of absolute differences between production and consumption. For November, this value slightly increased to 1020.69, suggesting a larger overall imbalance. December showed a reduction in imbalance, with an IAE of 865.09. October had the highest SD at 17.33, indicating that the balance values vary more widely from the mean compared to the other months. November and December had lower SDs of 11.94 and 8.22, respectively, suggesting less fluctuation in the balance values. November had the highest total imbalance, while December had the least. The month of October showed the most variability in its energy balance, whereas December was the most consistent. These results suggest that the energy system’s performance varied, with November being the most challenging month in terms of managing the balance between consumption and production. The results are summarized in Table 2 and schematically presented in Figure 5.
Table 2.
Monthly breakdown of the integral absolute error (IAE) and standard deviation (SD) in an unspecified measurement context for a year. The IAE column indicates the cumulative absolute differences over each month, revealing February as the month with the highest imbalance and August as the month with the lowest. The SD column measures the spread of individual values around the mean, with July showing the highest variability and December the least. This data can inform assessments of system performance or stability over time.
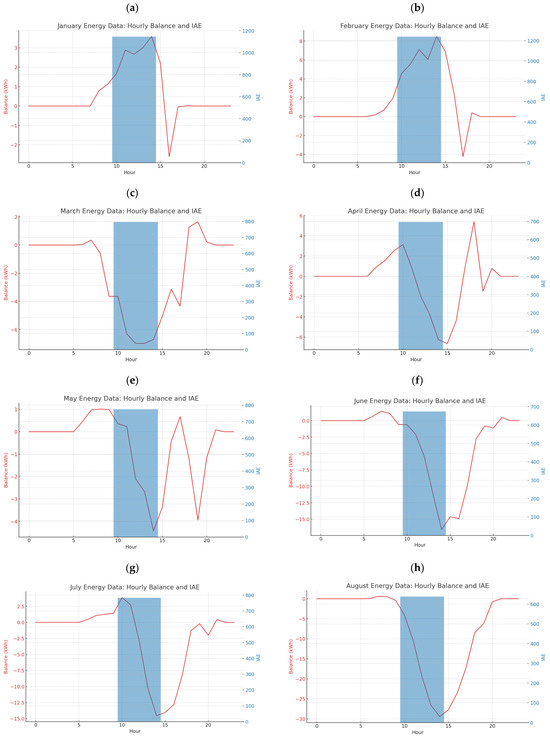
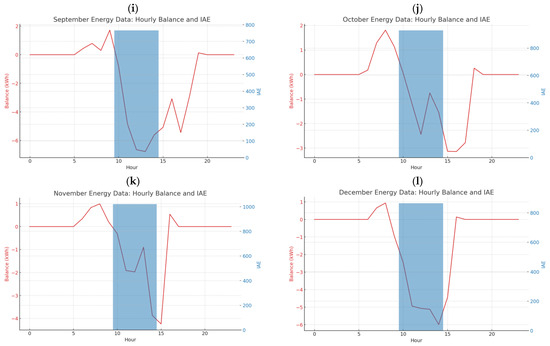
Figure 5.
The red line shows the hourly energy balance and the blue bar represents the integral absolute error (IAE), providing a visual representation of the daily energy balance fluctuations in relation to the total energy imbalance as determined by the IAE.
Throughout the year, the energy balance data, when considering PV energy production, reveals significant fluctuations in the IAE and SD across different months. The IAE, which measures the cumulative absolute difference between consumption and production, indicates that the energy system experienced the highest imbalance in February and the lowest in March. These variations in IAE could be attributed to changing weather conditions, which directly affect PV energy production, with February perhaps having less sunlight or more cloud cover. The SD reflects the spread of balance values around the mean, with March displaying the highest variability. This suggests that while overall energy production and consumption were more balanced, the hourly fluctuations were significant, possibly due to the erratic availability of solar energy or shifts in consumption patterns. As the year progressed, May exhibited both a high IAE and SD, indicating not only a substantial energy shortfall but also significant variability in energy balance. This could mean that May faced several days with poor solar irradiation or that consumption was particularly high or erratic during this period. The summer months of July and August showed an improvement in the IAE, with August having a lower IAE and SD, suggesting a better-managed energy balance, potentially due to longer daylight hours enhancing PV energy production. In the latter part of the year, November presented the greatest challenge with the highest IAE, reflecting a substantial energy deficit. However, the SD was lower in November and December compared to October, indicating less variability despite the higher deficits. This could be due to shorter daylight hours leading to reduced PV production, coupled with possibly consistent consumption patterns. Overall, the data suggest a correlation between the balance of PV energy production and consumption with seasonal changes. The variability and deficits in energy production could have consequences such as increased reliance on non-renewable energy sources or the need for energy conservation measures during periods of low PV output. The energy management strategies must therefore account for these fluctuations to enhance the reliability of PV energy throughout the year.
In comparison to other regions, the performance of our installed photovoltaic system aligns with global trends of increased efficiency and productivity in solar energy generation. Specifically, when juxtaposing our results with systems in similar climatic zones, we observe that the energy production potential in our study is consistent with the higher end of PV output reported in Mediterranean climates. For instance, studies on PV systems in regions like Southern Spain and Italy show comparable seasonal productivity patterns, particularly with peak production in the summer months. Nevertheless, our case stands out in its ability to maintain a relatively high level of production efficiency during the winter months, surpassing the average yields of similar latitude installations by a noticeable margin. This suggests that the specific technological choices and management strategies implemented in our system may offer valuable insights for optimizing photovoltaic energy production in educational institutions, which could be beneficial when considering the design and operation of PV systems in these environments worldwide.
The high IAE values observed indicate a significant discrepancy between experiment and prediction. This large error could be a result of several factors. Firstly, the method of prediction used may not be well-suited to the complexity or nature of the data. If the model is too simple or does not capture all the influential variables, it could lead to inaccurate predictions and thus a high IAE. Secondly, the quality of the data used for training and testing the model could be a contributing factor. Data that are noisy, contain outliers, or are non-representative of the system can lead to poor model performance. Thirdly, the parameters and settings of the model could be suboptimal. This might include the learning rate, the number of layers in a neural network, or the selection of features used for prediction. It is also possible that the large IAE could be due to a fundamental change in the system that occurred after the model was trained, which the model could not anticipate. From this, and analyzing all possibilities, it is entirely possible that the high IAE could be attributed to the use of real-measured data that are subject to natural variability, such as daily sunlight hours, cloud cover, and other environmental factors. These factors can introduce a significant amount of unpredictability into the system being modeled, especially in contexts such as renewable energy production where solar and wind power outputs can fluctuate dramatically due to weather conditions.
If the predictive model was developed under the assumption of certain stable conditions or without accounting for the full range of natural variability, this could lead to a mismatch between predicted and actual values, hence a high IAE. For instance, if the model for predicting solar power output was trained on data from a period with consistent weather patterns, it might not perform well when faced with the more variable conditions that naturally occur over different seasons or weather events. To address this, in a future approach, the model can be enhanced by incorporating weather-related variables directly into the model if they are not already included. Machine learning models can be equipped to handle complex, non-linear relationships and interactions between variables, which might capture the impact of environmental factors more accurately; utilize more sophisticated time series analysis techniques that can account for seasonal trends, cyclical patterns, and other temporal dynamics; implement a dynamic modeling approach that updates predictions based on real-time data inputs, allow the model to adjust to current conditions; consider stochastic modeling techniques that can factor in the inherent randomness of certain inputs and offer a range of possible outputs with associated probabilities; or even increase the granularity of the data, which might involve using hourly measurements instead of daily averages, to capture fluctuations more accurately. In this way, by refining the predictive model to take into account the stochastic nature of environmental factors, the accuracy of predictions shall improve, and the IAE shall decrease accordingly.
Justifying the high IAE found with environmental variability can indeed be supported by looking at the relationship between the IAE and SD from the data obtained. The SD reflects the variability or spread of the individual errors around the mean error, which, in the context of environmental data, can be indicative of natural fluctuations. In the results, months like April, May, June, July, and September exhibit both a relatively lower IAE and a higher SD compared to other months like January and February, which have a higher IAE but a lower SD. This suggests that even though the predictive errors (IAEs) for the former set of months are lower, the variability of these errors is greater, which could be indicative of the impact of environmental factors such as changes in weather. For instance, the higher SD in the summer months (April through July) could be due to the greater variability in weather conditions, like cloud cover and the number of sunlight hours, which are more pronounced during these months and can affect solar energy production predictions. Despite this variability, the IAE is relatively low, which might suggest that the prediction model is somewhat robust to these changes, but not entirely accurate. Conversely, the winter months (November and December) show a lower SD and a higher IAE. This could imply that while the variability due to environmental factors is less pronounced (possibly due to consistently poorer weather conditions), the prediction errors are higher, which might suggest other factors at play, such as a model that does not account well for seasonal changes.
4.2. Analysis of the Evolution of Production, Consumption, and Balance in an Annual Time Horizon
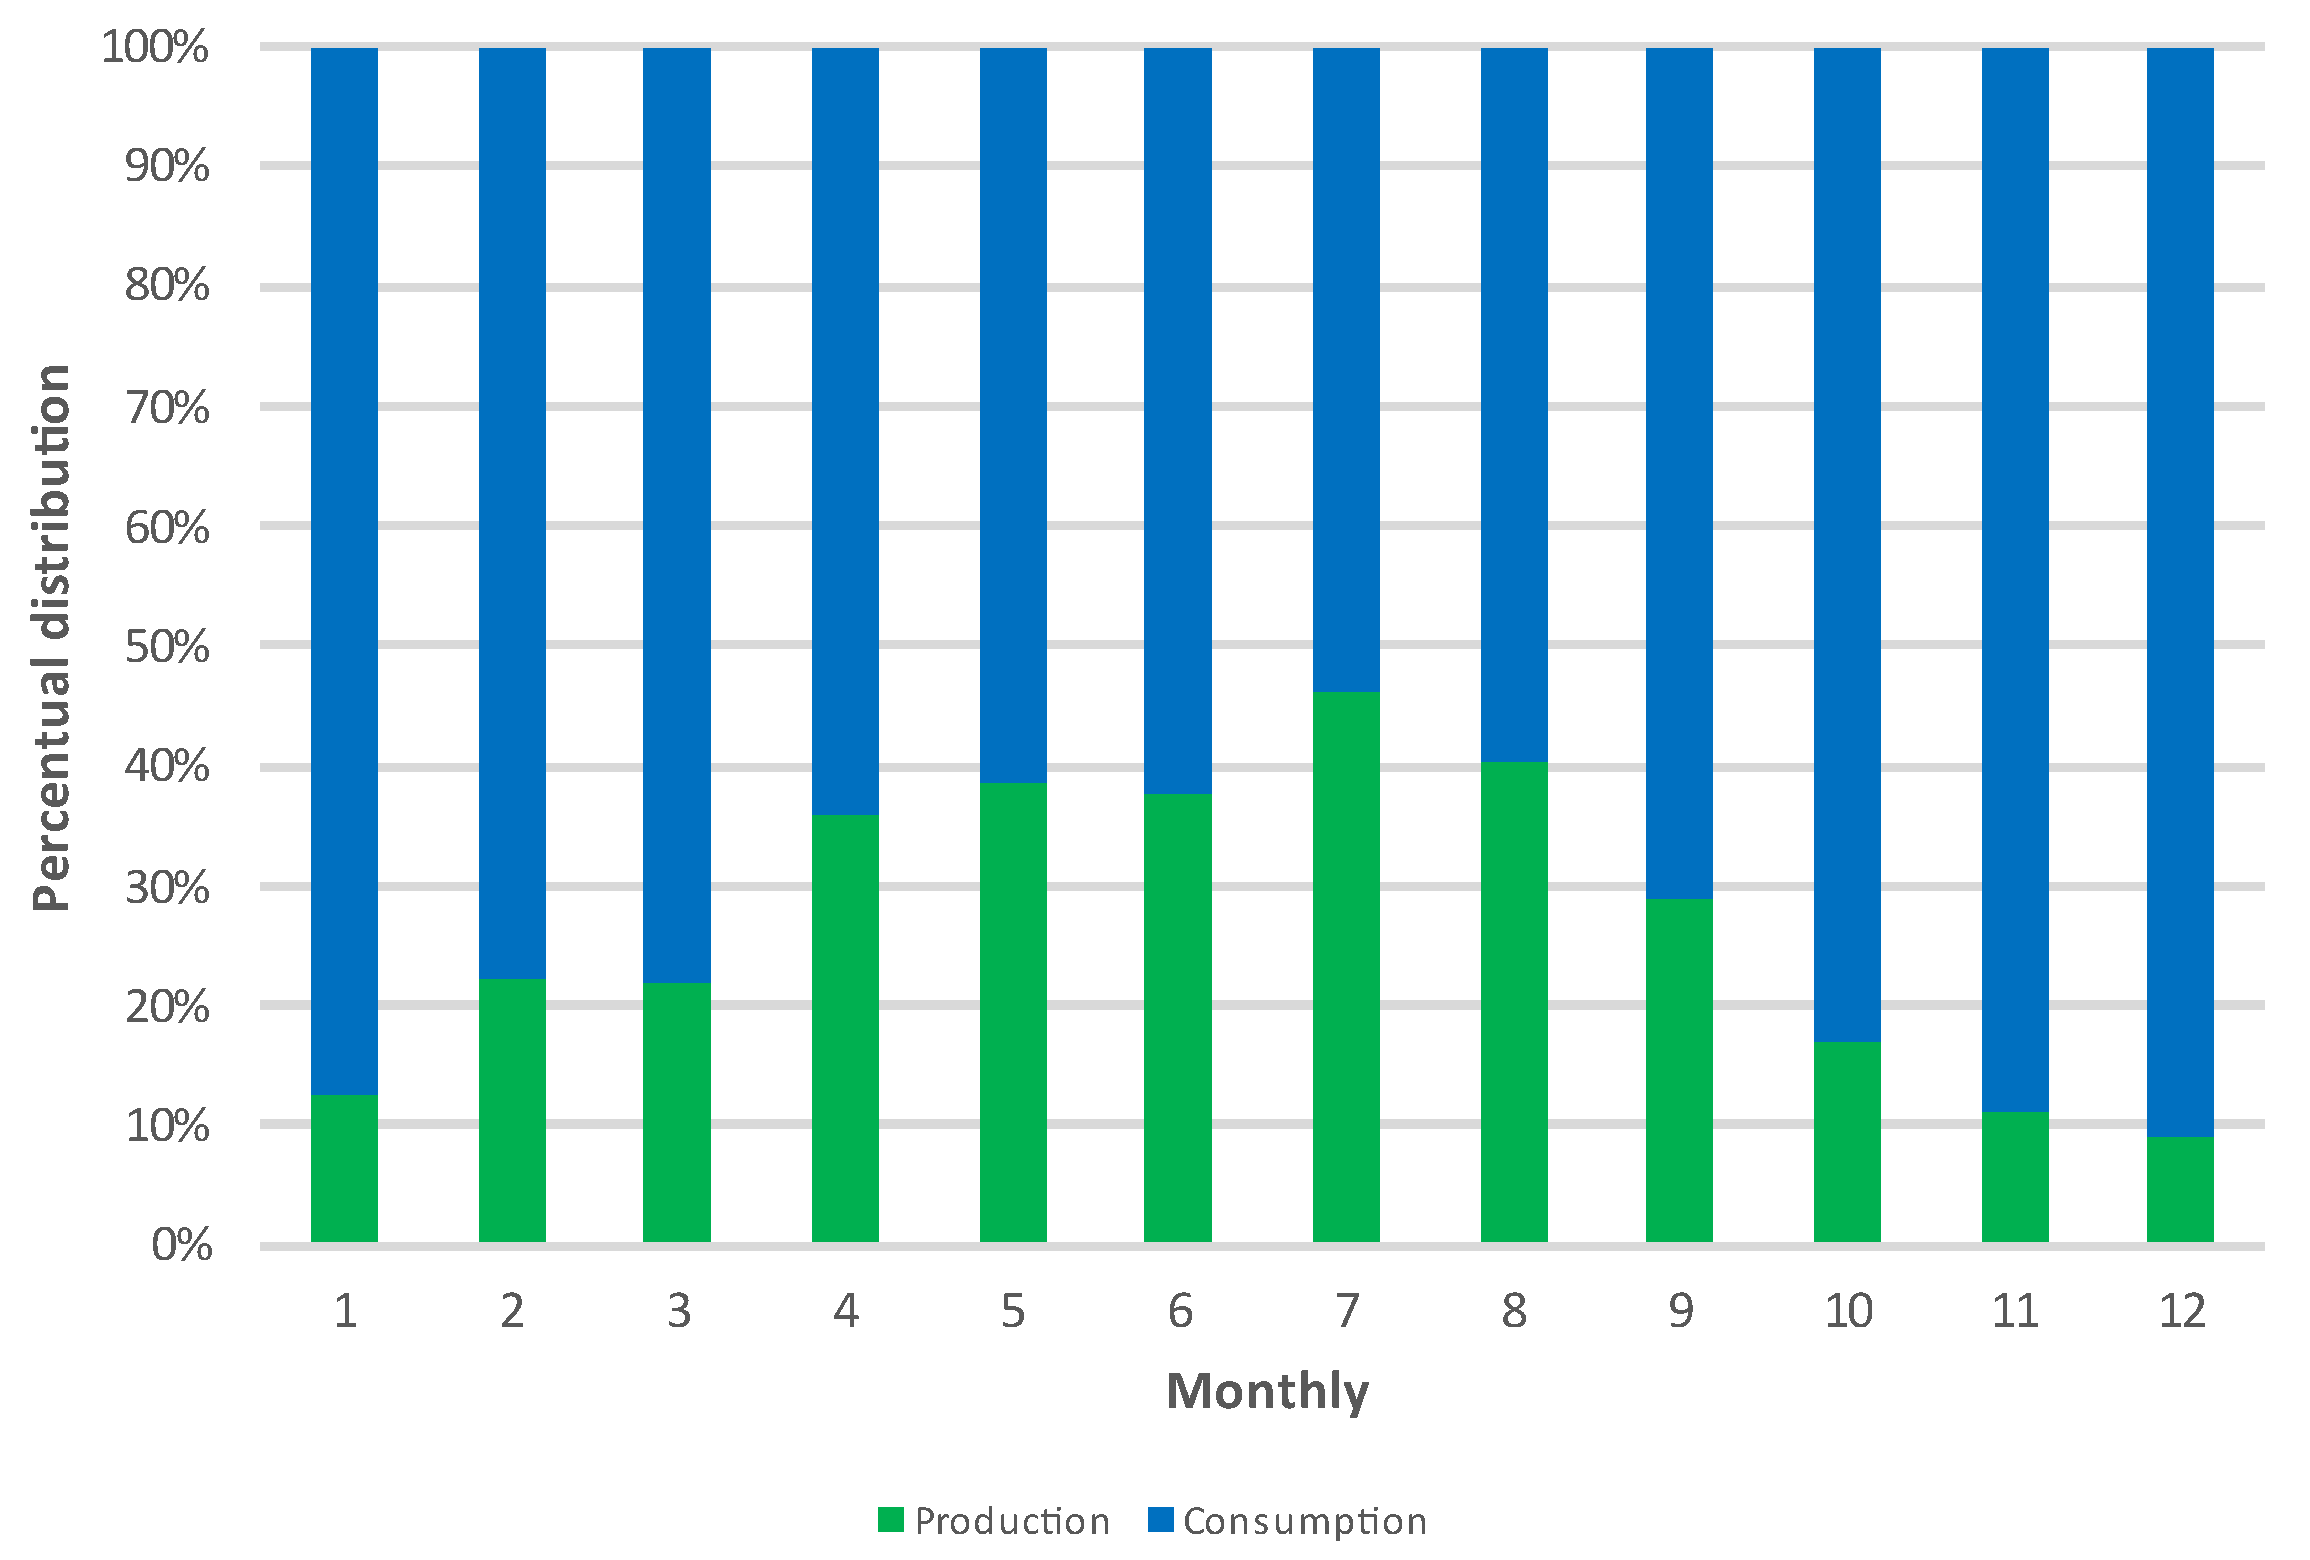
The installation of renewable energy systems to produce electricity for self-consumption, as is the case of the situation under analysis in this article, presupposes that the photovoltaic system installed can offset at least a significant part of consumption since this is the only possible way to amortize the investment made by reducing electricity costs. From a purely economic analysis of the situation, it seems that the total estimated PV energy produced corresponds to 26.1% of the campus consumption on average (Figure 6). In a first analysis, this value seems to be relatively reduced due to several factors: there is high energy consumption on the campus during the non-production period, at night, and in some specific periods of the year, energy consumption is lower than the energy production, so the potential production is not at its maximum because the installed system is designed without grid injection, and, based on this, the system’s inverter cuts and blocks energy production according to the consumption profile.
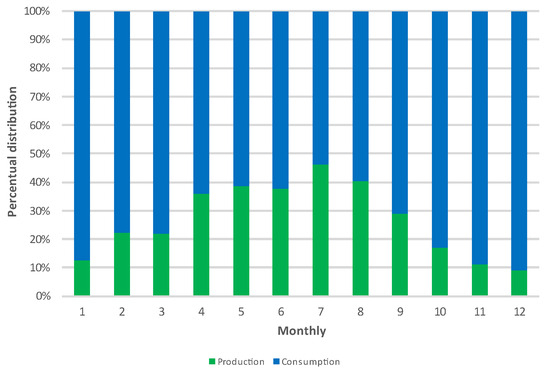
Figure 6.
Percentage distribution for energy production and energy consumption.
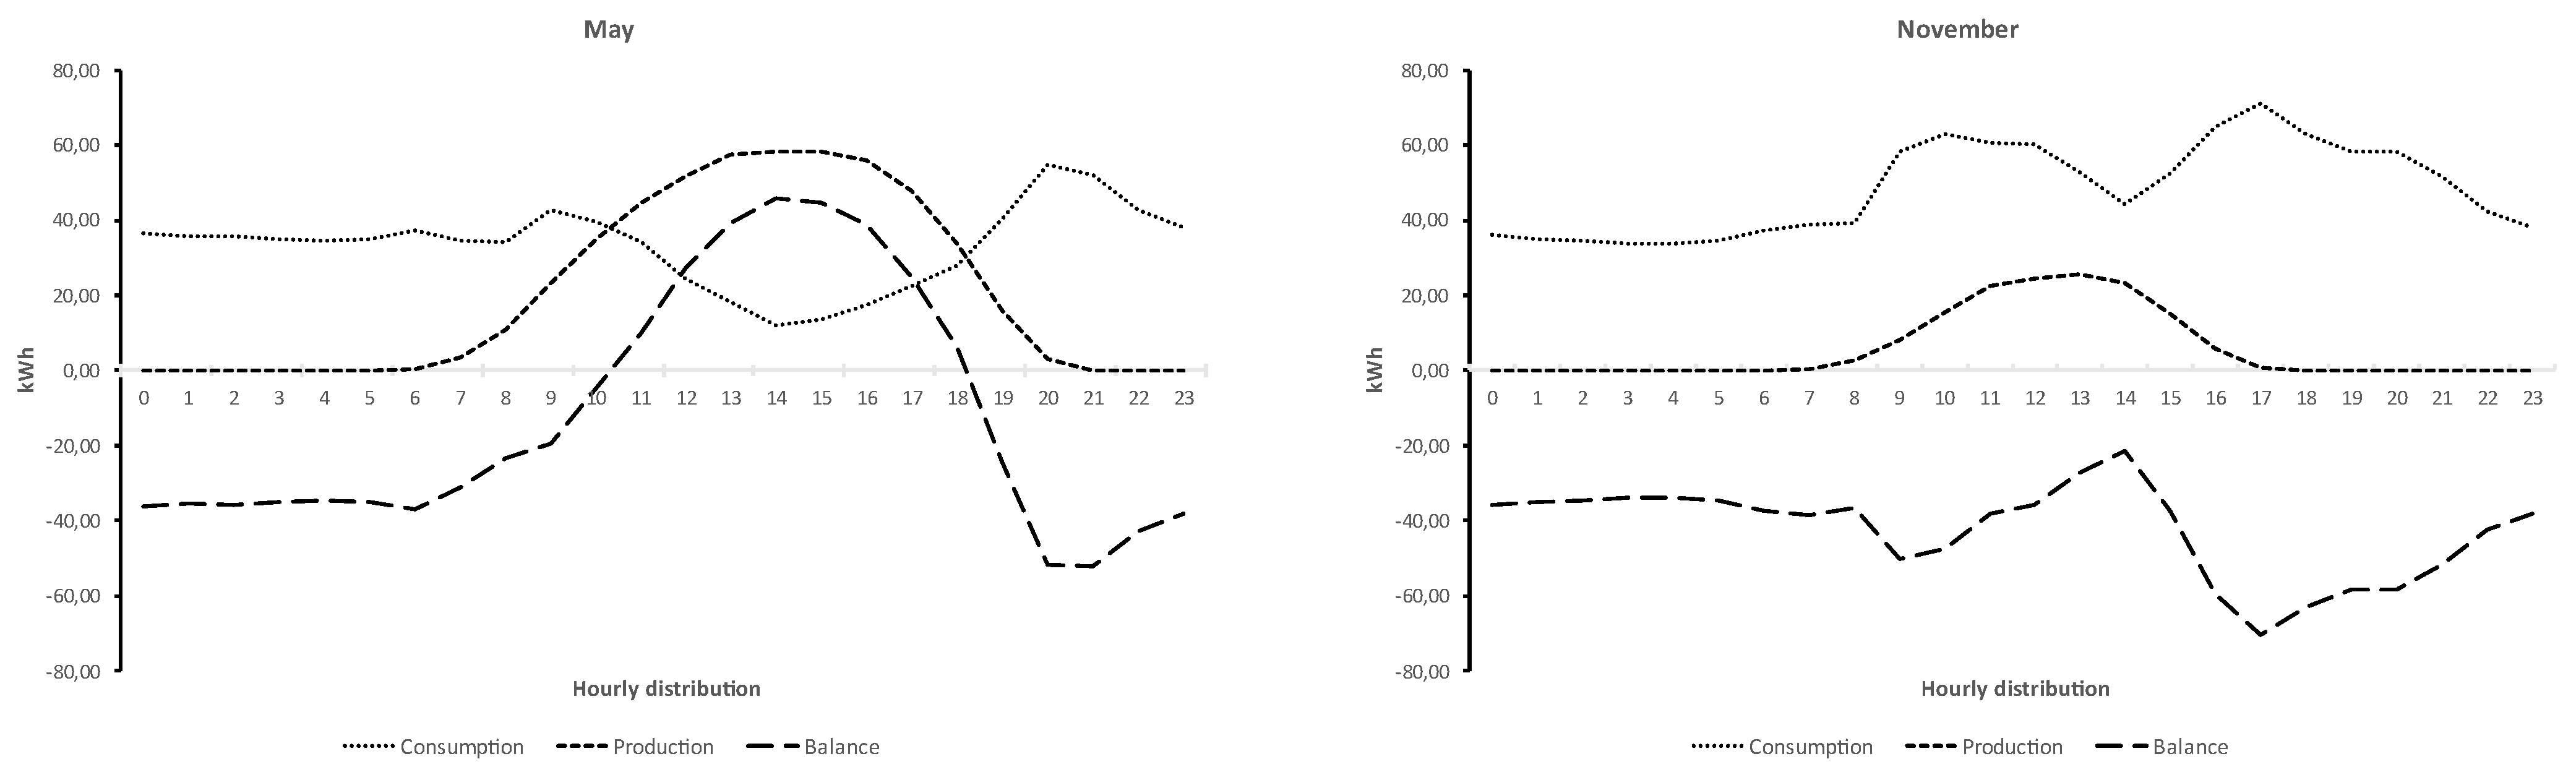
The graphs in Figure 7 show how the installed photovoltaic system works in a so-called “typical month”, which is associated with the highest and the lowest annual energy production. By considering the summer and winter solstices and the building’s consumption periods, it was decided to analyze the months of May and November as examples of a “typical month” for summer and winter, respectively. By analyzing the monthly hourly average energy production for the two graphs, it can be observed that in May, the production corresponds to 38.49% of the total energy consumed, while in November, the production only reaches 11.01%. If the same analysis is carried out by considering the average period between sunrise and sunset, from 6 a.m. to 9 p.m., in May, the energy production corresponds to 49.69% of the total energy consumed, i.e., there are significant differences in the system’s performance depending on the period of analysis.

Figure 7.
Distribution of production, consumption, and average monthly balance on an hourly basis for May and November.
This discrepancy in the system’s performance between both periods of the year influences the produced energy usage profile, which is derived from the model imposed by the legal framework laid down in the contract of the funded project. According to the current application model for the project that financed the installed PV system, there is no possibility to inject the produced energy into the grid. In other words, if there is no consumption on the campus, there will be no energy production, so there is no way of using the surplus energy to repay the original investment. As the periods of photovoltaic energy production coincide with the building’s peak use periods, it is also certain that, even in the winter months, there will be maximum use of the energy produced.
Based on this, the question that needs to be answered is the following: what should be done when the site has excess power generation that cannot be injected into the grid, and how should different amounts of energy produced throughout the year be efficiently managed? A straightforward alternative to the problem would be to install a battery system to accumulate surplus energy, allowing it to be used in periods outside the range of PV energy production. However, there is not yet a complete consensus on the effectiveness of this system and, above all, on the investment required, given the campus energy needs. To guarantee greater storage capacities and high reliability, the cost of a battery system can be expensive and cost as much as the photovoltaic system as a whole (panels, inverters, and power optimizers). Additionally, batteries are hard to maintain (in a sealed lead-acid deep cycle battery, for instance, the water levels have to be checked periodically, and the terminals kept clean); the useful life of a battery will depend on the type of battery to be used and its discharge capacity, which is usually low, and, due to environmental issues, they are not recommended because components are hard to be recycled.
Another solution to the problem would be to take advantage of the accurate forecast of the PV energy production schedules and make users aware of the need to adjust major energy consumers to these periods, especially those that are routine as they are associated with normal operating activities, such as the cafeteria, canteen, or laboratory services. Where possible, this change can be supplemented with an automatic load management and consumption monitoring system, changing behaviors, and reorganizing tasks so that, as far as possible, they are carried out in intervals during the period of PV energy production. In this way, consumption is carried out using the PV energy produced, rather than the energy supplied by the power grid, thereby effectively helping to reduce energy costs.
Last but not least, energy communities and/or collective self-consumption are a viable way of improving the performance of a photovoltaic system. This shared vision of the energy issue allows the overproduction to be shared with other neighborhood installations that are operating during the PV energy production period and are out of phase with the peak consumption of the campus where the photovoltaic system is located. For example, sports facilities (pavilions and swimming pools) near the school campus have high energy usage on the weekends when there is practically no school activity, and hotels in the vicinity consume energy mainly in the morning period and from 5 pm onwards. Additionally, if there is still room in the PV production period, the generated energy can be used to heat domestic hot water using electric resistance, preheat water for other types of use, or use air conditioning systems, which should operate only at times when there is an excess of energy production. These possibilities allow the maximization of the use of the photovoltaic energy production system, relying on a good control and monitoring system to manage energy usage in real-time.
4.3. Distribution of Monthly Consumption Data from 2014 to 2022
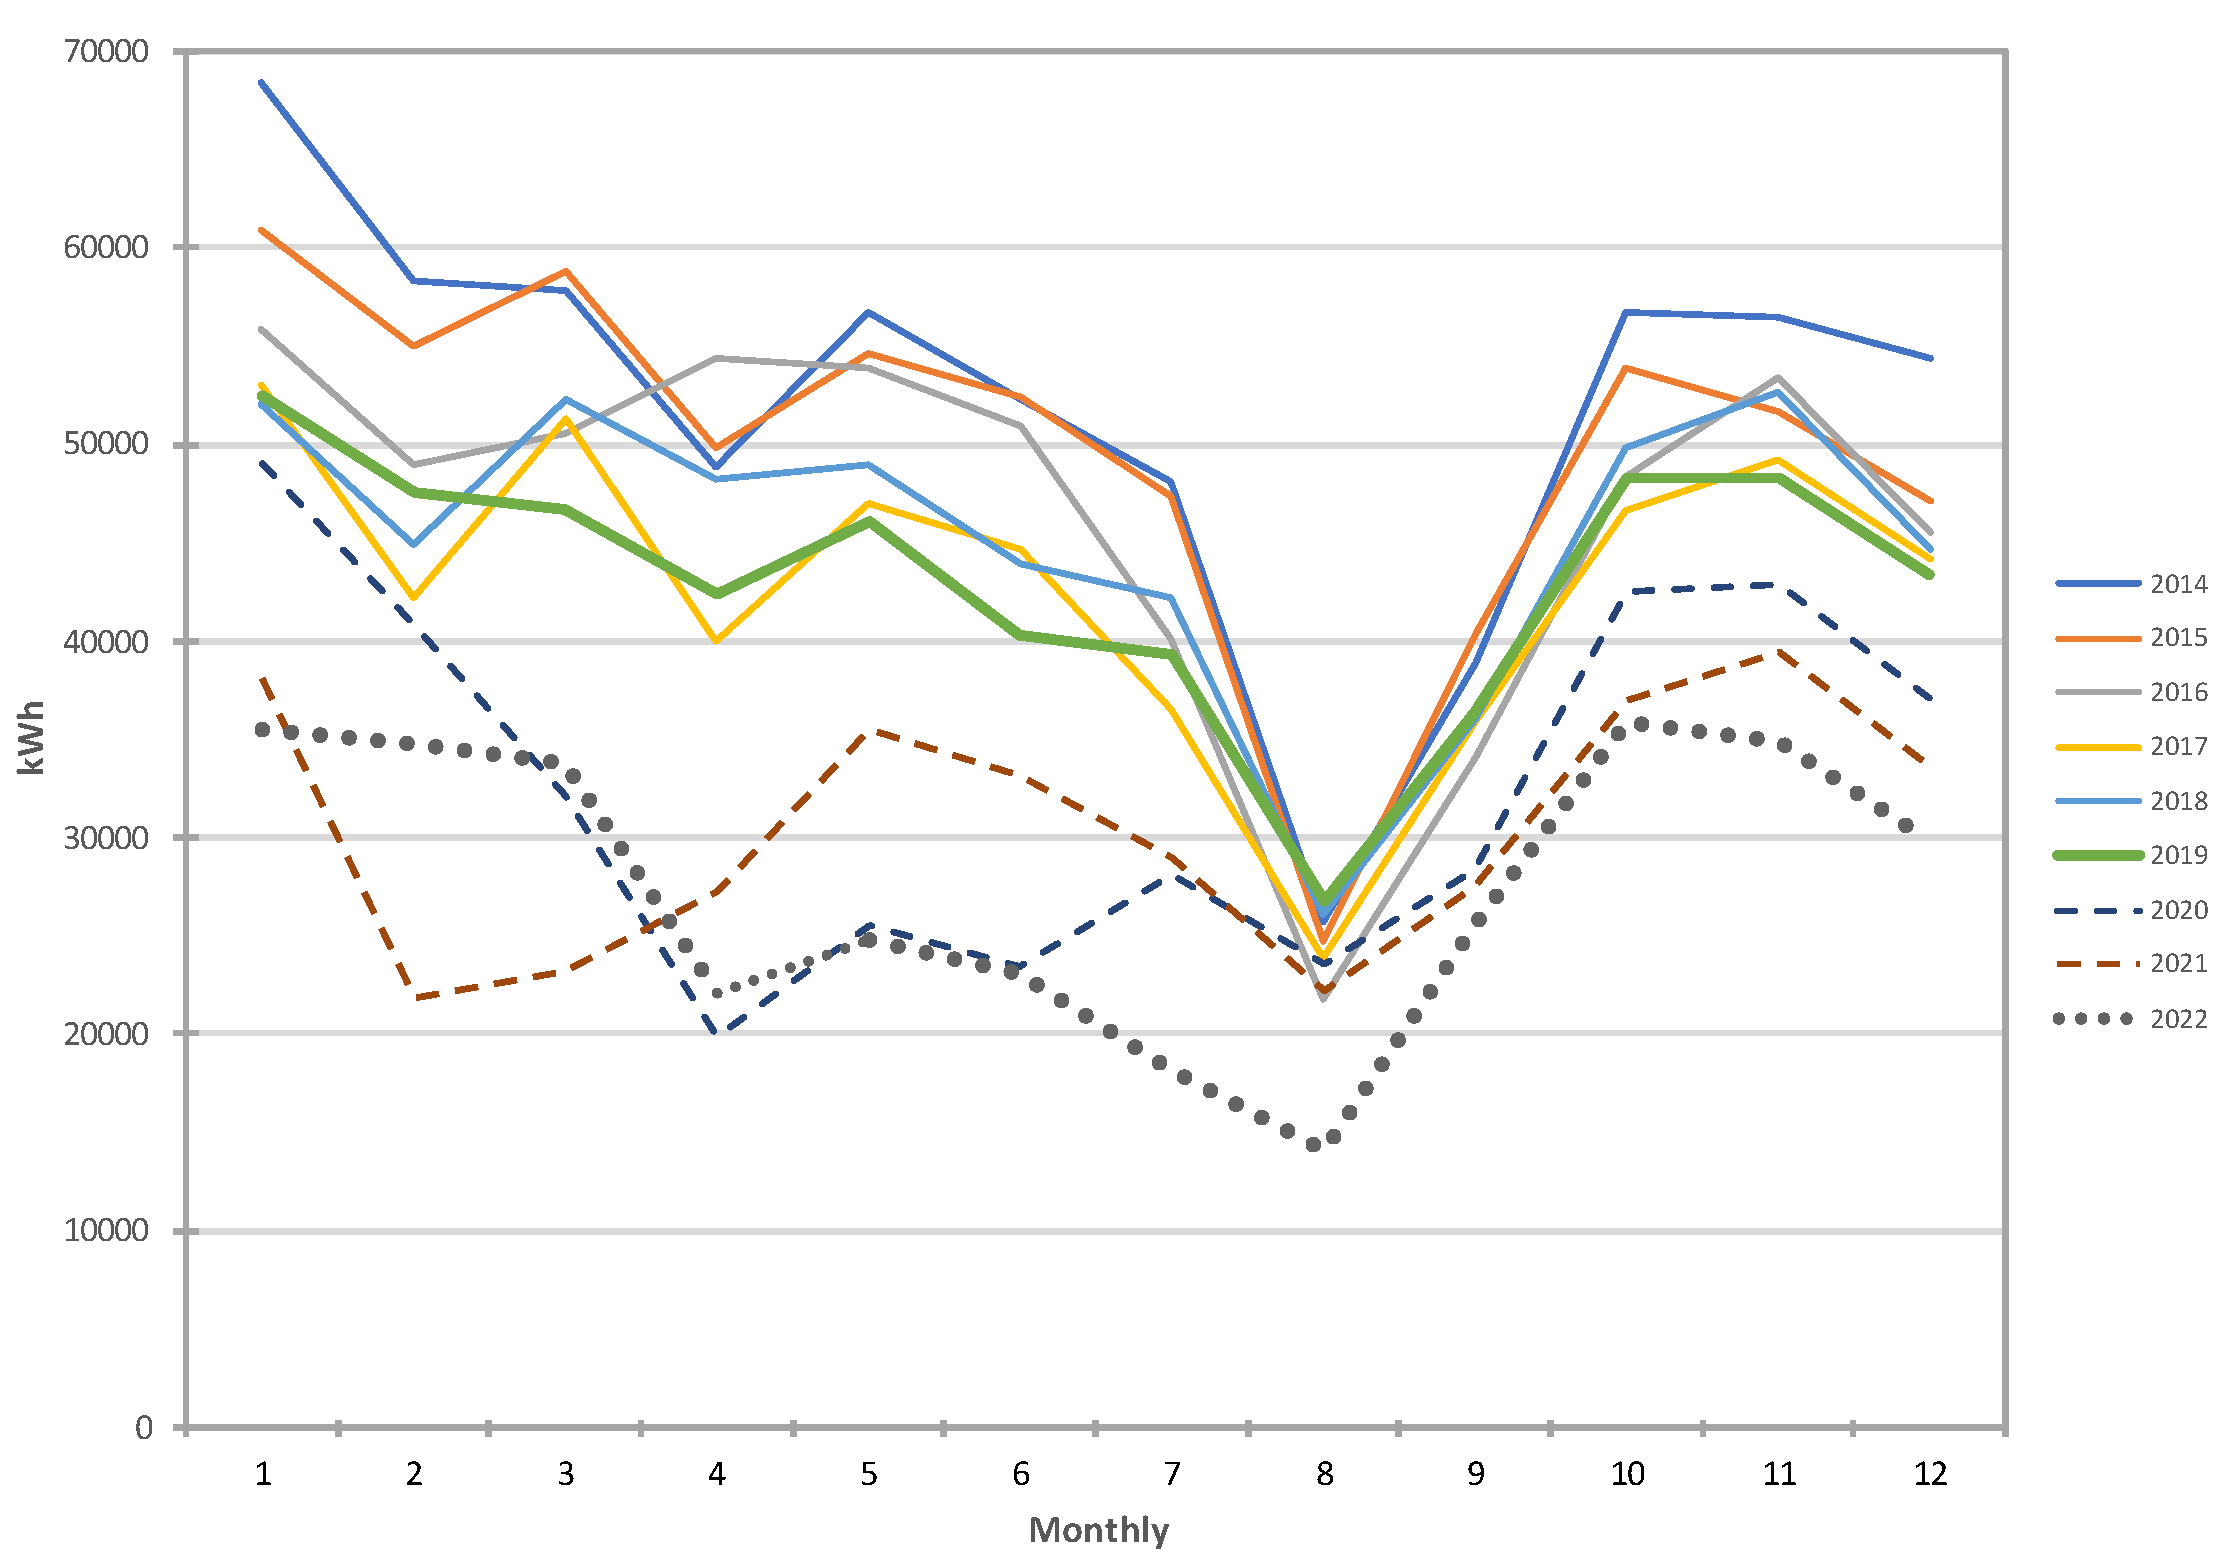
The graphs presented in Figure 8 show the consumption per month of the grid energy and the production of the photovoltaic system that will be spent on the campus since the system does not allow injection into the grid. The total consumption of the campus would be the grid energy consumption plus the photovoltaic production. Daily photovoltaic production rarely exceeds energy grid consumption, and the grid energy consumption is never zero because there are periods during the night when there is no sun and therefore PV production does not occur. It is also possible to observe that consumption drops considerably on the weekend, as expected, and the same happens with PV production because it is a system without grid injection and forces the inverters to cut production. Figure 8 also shows the history of monthly consumption from 2014 to 2022; 2020 and 2021 were atypical years due to the global COVID-19 pandemic.
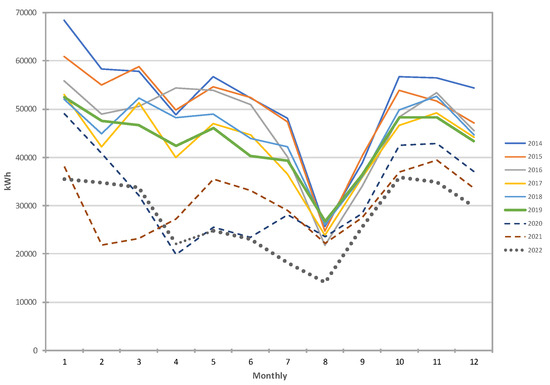
Figure 8.
Distribution of monthly consumption data from 2014 to 2022.
As mentioned before, photovoltaic production is already reflected in this figure for 2022, which means that the reduction in the energy consumption visible in this graph is due to the funded project that was implemented. The main energy efficiency measures, besides PV system installation, were the following: replacement of the existing lighting with LED technology, replacement of the window frames and shading devices, addition of thermal insulation to the roof and the buildings’ facades, replacement of two natural gas boilers with two low-condensation, high-efficiency natural gas boilers, and installation of a rooftop to improve summer thermal comfort.
This graph depicts the monthly consumption data of an entity from 2014 to 2022 measured in kWh. Multiple lines represent different years, allowing for a comparative analysis over time. It is observable that consumption trends follow a similar pattern annually, with two noticeable peaks around the 3rd and 9th months, which likely correspond to periods of higher activity or operational demands, possibly due to seasonal variations or academic calendars if related to an educational institution. In 2020 and 2021, there is a distinctive drop in consumption, potentially reflecting reduced operations due to the global COVID-19 pandemic. The data for 2022 present a visible decrease in consumption compared to previous years (except 2020 and 2021), possibly indicating the implementation of energy-saving measures or the integration of alternative energy sources like photovoltaic systems. The dashed line representing 2022 suggests either projected data or ongoing data collection for this period. It is also worth noting the overall variability in consumption, indicating a dynamic energy usage pattern subject to various influencing factors.
5. Conclusions
This research was conducted against the backdrop of global climate change challenges, with a focus on enhancing the use of renewable energy in the academic sector. This study centered on the optimization of self-consumption photovoltaic (PV) systems at the Technology and Management School of the Polytechnic Institute of Viana do Castelo, Portugal. We critically evaluated existing excess energy management strategies given the legal constraints on grid energy injection in such institutions.
Our analysis revealed that while battery storage provides a viable method for managing excess energy, it is beset with high costs and environmental concerns. As such, this study proposed two pragmatic approaches: firstly, the adaptation of consumption patterns to more closely align with periods of energy production; secondly, the creation of local energy communities that facilitate shared consumption.
The results of our interventions indicate a significant potential for reducing energy wastage. By adjusting energy consumption patterns to align with peak production times, we observed a potential reduction in energy overflow. Furthermore, the establishment of local energy communities could enhance the utilization of PV systems by up to 40%, thereby fostering more inclusive and sustainable communities. This aligns with Sustainable Development Goal 11, which advocates for sustainable cities and communities.
Our findings underscore the feasibility and benefits of implementing strategic energy consumption patterns and the communal use of energy resources as measures to increase energy efficiency in Higher Education Institutions. Such measures not only have the potential to optimize energy use but also serve as a model for sustainable practices that can be replicated in similar settings globally. This study’s outcomes are quantified to reflect the tangible improvements in energy utilization, emphasizing the practical implications for policy and decision-making in the realm of renewable energy management.
Author Contributions
Conceptualization, L.J.R.N. and A.C.; methodology, L.J.R.N. and A.C.; validation, I.A. and L.J.R.N.; formal analysis, A.C. and I.A.; investigation, I.A., L.J.R.N. and A.C.; resources, A.C.; data curation, I.A. and L.J.R.N.; writing—original draft preparation, I.A., L.J.R.N. and A.C.; writing—review and editing, I.A., L.J.R.N. and A.C.; visualization, I.A., L.J.R.N. and A.C.; supervision, L.J.R.N. and A.C. All authors have read and agreed to the published version of the manuscript.
Funding
This work is a result of the project TECH, Technology, Environment, Creativity and Health, Norte-01-0145-FEDER-000043, supported by Norte Portugal Regional Operational Program (NORTE 2020), under the PORTUGAL 2020 Partnership Agreement, through the European Regional Development Fund (ERDF). L.J.R.N. was supported by Prometheus, Research Unit on Energy, Materials, and Environment for Sustainability, UIDP/05975/2020, which is funded by national funds through FCT—Fundação para a Ciência e Tecnologia.
Data Availability Statement
The data presented in this study are available per request to the corresponding author.
Conflicts of Interest
The authors declare no conflict of interest.
References
- Fiaschi, D.; Bandinelli, R.; Conti, S. A case study for energy issues of public buildings and utilities in a small municipality: Investigation of possible improvements and integration with renewables. Appl. Energy 2012, 97, 101–114. [Google Scholar] [CrossRef]
- Bilir, L.; Yildirim, N. Photovoltaic system assessment for a school building. Int. J. Hydrogen Energy 2017, 42, 17856–17868. [Google Scholar] [CrossRef]
- Al-Otaibi, A.; Al-Qattan, A.; Fairouz, F.; Al-Mulla, A. Performance evaluation of photovoltaic systems on Kuwaiti schools’ rooftop. Energy Convers. Manag. 2015, 95, 110–119. [Google Scholar] [CrossRef]
- Yang, T.; Athienitis, A.K. A review of research and developments of building-integrated photovoltaic/thermal (BIPV/T) systems. Renew. Sustain. Energy Rev. 2016, 66, 886–912. [Google Scholar] [CrossRef]
- Delisle, V.; Kummert, M. Cost-benefit analysis of integrating BIPV-T air systems into energy-efficient homes. Sol. Energy 2016, 136, 385–400. [Google Scholar] [CrossRef]
- Nölting, B.; Molitor, H.; Reimann, J.; Skroblin, J.-H.; Dembski, N. Transfer for Sustainable Development at Higher Education Institutions—Untapped Potential for Education for Sustainable Development and for Societal Transformation. Sustainability 2020, 12, 2925. [Google Scholar] [CrossRef]
- Helmers, E.; Chang, C.C.; Dauwels, J. Carbon footprinting of universities worldwide: Part I—Objective comparison by standardized metrics. Environ. Sci. Eur. 2021, 33, 30. [Google Scholar] [CrossRef]
- Henke, J.; Pasternack, P.; Schmid, S. Third Mission bilanzieren. Die Dritte Aufgabe der Hochschulen und Ihre Öffentliche Kommunikation. HoF-Handreichungen; Institut für Hochschulforschung (HoF), Halle-Wittenberg: Lutherstadt Wittenberg, Germany, 2016; Volume 8. [Google Scholar]
- Henke, J.; Pasternack, P.; Schmid, S. Mission, Die Dritte. Gesellschaftliche Leistungen der Hochschulen Neben Forschung und Lehre: Konzept und Kommunikation der Third Mission; BWV—Berliner Wissenschafts-Verlag: Berlin, Germany, 2017. [Google Scholar]
- McCowan, T.; Leal Filho, W.; Brandli, L. Universities Facing Climate Change and Sustainability; GHC Hamburg: Hamburg, Germany, 2021. [Google Scholar]
- Alghamdi, A.S.; Bahaj, A.S.; Wu, Y. Assessment of large scale photovoltaic power generation from carport canopies. Energies 2017, 10, 686. [Google Scholar] [CrossRef]
- United Nations. Transforming Our World: The 2030 Agenda for Sustainable Development, A/RES/70/1; United Nations: New York, NY, USA, 2015.
- Fakour, H.; Imani, M.; Lo, S.-L.; Yuan, M.-H.; Chen, C.-K.; Mobasser, S.; Muangthai, I. Evaluation of solar photovoltaic carport canopy with electric vehicle charging potential. Sci. Rep. 2023, 13, 2136. [Google Scholar] [CrossRef] [PubMed]
- Nunes, P.; Figueiredo, R.; Brito, M.C. The use of parking lots to solar-charge electric vehicles. Renew. Sustain. Energy Rev. 2016, 66, 679–693. [Google Scholar] [CrossRef]
- Malek, A.; Kośko, M.; Łusiak, T. Urban logistics of small electric vehicle charged from a photovoltaic carport. Arch. Automot. Eng./Arch. Motoryz. 2018, 82, 63–75. [Google Scholar] [CrossRef]
- Zomer, C.; Custódio, I.; Goulart, S.; Mantelli, S.; Martins, G.; Campos, R.; Pinto, G.; Rüther, R. Energy balance and performance assessment of PV systems installed at a positive-energy building (PEB) solar energy research centre. Sol. Energy 2020, 212, 258–274. [Google Scholar] [CrossRef]
- Horan, W.; Shawe, R.; Moles, R.; O’Regan, B. Development and evaluation of a method to estimate the potential of decarbonisation technologies deployment at higher education campuses. Sustain. Cities Soc. 2019, 47, 101464. [Google Scholar] [CrossRef]
- Neumann, H.M.; Schär, D.; Baumgartner, F. The potential of photovoltaic carports to cover the energy demand of road passenger transport. Prog. Photovolt. Res. Appl. 2012, 20, 639–649. [Google Scholar] [CrossRef]
- Sokolovskij, E.; Małek, A.; Caban, J.; Dudziak, A.; Matijošius, J.; Marciniak, A. Selection of a Photovoltaic Carport Power for an Electric Vehicle. Energies 2023, 16, 3126. [Google Scholar] [CrossRef]
- Kulik, A.C.; Tonolo, É.A.; Scortegagna, A.K.; da Silva, J.E.; Junior, J.U. Analysis of scenarios for the insertion of electric vehicles in conjunction with a solar carport in the city of curitiba, Paraná—Brazil. Energies 2021, 14, 5027. [Google Scholar] [CrossRef]
- Iringová, A.; Kovačic, M. Design and optimization of photovoltaic systems in a parking garage—A case study. Transp. Res. Procedia 2021, 55, 1171–1179. [Google Scholar] [CrossRef]
- The Renewable Energy Directive (Directive (EU) 2018/2001). Available online: http://data.europa.eu/eli/dir/2018/2001/oj (accessed on 11 September 2023).
- Internal Electricity Market Directive (Directive (EU) 2019/944). Available online: http://data.europa.eu/eli/dir/2019/944/oj (accessed on 11 September 2023).
- The Governance Regulation (2018/1999/EU). Available online: https://eur-lex.europa.eu/legal-content/PT/TXT/PDF/?uri=OJ:L:2018:328:FULL (accessed on 11 September 2023).
- Federal Law Gazette (Bundesgesetzblatt) Volume 2016 Part I No. 49, Issued in Bonn on 18 October 2016, Berlin, Germany; pp. 2258–2357. Available online: http://www.bgbl.de/xaver/bgbl/start.xav?startbk=BundesanzeigerBGBl&jumpTo=bgbl116s2258.pdf (accessed on 11 September 2023).
- Real Decreto n. 244/2019 of 5 of April from Ministerio Para la Transicion Ecológica.BOE: N.º 83. Madrid, España, 2019; pp. 35674–35719. Available online: https://www.boe.es/eli/es/rd/2019/04/05/244 (accessed on 11 September 2023).
- De Medici, S. Italian Architectural Heritage and Photovoltaic Systems. Matching Style with Sustainability. Sustainability 2021, 13, 2108. [Google Scholar] [CrossRef]
- Decree-Law n. 153/2014 of 20 of October from Ministério do Ambiente, Ordenamento do Território e Energia. Diário da República: 1.ª Série, N.º 202. Lisboa, Portugal, 2014; pp. 5298–5311. Available online: https://files.diariodarepublica.pt/1s/2014/10/20200/0529805311.pdf (accessed on 11 September 2023).
- Decree-Law n. 162/2019 of 25 of October from Presidência do Conselho de Ministros. Diário da República: 1.ª série, N.º 206. Lisboa, Portugal, 2019; pp. 45–62. Available online: https://files.diariodarepublica.pt/1s/2019/10/20600/0004500062.pdf (accessed on 11 September 2023).
- Decree-Law n. 15/2022 of 14 of January from Presidência do Conselho de Ministros. Diário da República: 1.ª Série, N.º 10. Lisboa, Portugal, 2022; pp. 3–185. Available online: https://files.diariodarepublica.pt/1s/2022/01/01000/0000300185.pdf (accessed on 11 September 2023).
- Reis, V.; Almeida, R.H.; Silva, J.A.; Brito, M.C. Demand aggregation for photovoltaic self-consumption. Energy Rep. 2019, 5, 54–61. [Google Scholar] [CrossRef]
- Roberts, M.B.; Bruce, A.; MacGill, I. A comparison of arrangements for increasing self-consumption and maximising the value of distributed photovoltaics on apartment buildings. Sol. Energy 2019, 193, 372–386. [Google Scholar] [CrossRef]
Disclaimer/Publisher’s Note: The statements, opinions and data contained in all publications are solely those of the individual author(s) and contributor(s) and not of MDPI and/or the editor(s). MDPI and/or the editor(s) disclaim responsibility for any injury to people or property resulting from any ideas, methods, instructions or products referred to in the content. |
© 2023 by the authors. Licensee MDPI, Basel, Switzerland. This article is an open access article distributed under the terms and conditions of the Creative Commons Attribution (CC BY) license (https://creativecommons.org/licenses/by/4.0/).