Article

Technical Impacts of Virtual Clean Hydrogen Plants: Promoting Energy Balance and Resolving Transmission Congestion Challenges

1
Department of Electronic and Electrical Engineering, Keimyung University, 1095 Dalgubeol-daero, Daegu 42601, Republic of Korea
2
KEPCO Research Institute (KEPRI), 105 Munji-ro, Yuseong-gu, Daejeon 34056, Republic of Korea
3
Department of Electrical Energy Engineering, Keimyung University, 1095 Dalgubeol-daero, Daegu 42601, Republic of Korea
*
Author to whom correspondence should be addressed.
Energies 2023, 16(22), 7652; https://doi.org/10.3390/en16227652
Submission received: 3 September 2023 / Revised: 3 November 2023 / Accepted: 14 November 2023 / Published: 18 November 2023
(This article belongs to the Section A: Sustainable Energy)

Abstract

:
This paper presents the VCHP platform as a solution to address PV curtailment and line congestion in scenarios of increasing renewable energy penetration. Solar PV generation profiles and load profiles were generated for three scenarios (2025, 2030, and 2035) using data provided by KPX. Modifications were made to the IEEE 30 Bus model to accurately reflect the Korean power system, including the introduction of PCA and LCA at relevant buses. Line congestion was evaluated using metrics such as TUR, STUR, and TLR. The research findings indicate that integrating the VCHP platform in all scenarios effectively alleviates line congestion, as shown by the TUR remaining below 1. Importantly, the reduction in line losses exceeds the decrease in power flow, demonstrating the effectiveness of VCHP in reducing power losses. The results suggest that as renewable energy sources increase, line congestion issues may arise in the existing power system. However, integrating the proposed VCHP platform is a valuable solution for effectively utilizing surplus PV energy and improving the stability of the power grid. The adoption of such a platform can significantly enhance the operation and management of the power system.

1. Introduction

In recent years, there has been a growing interest in understanding the potential impacts of Virtual Clean Hydrogen Plants (VCHP) in the context of the increasing penetration of renewable energy sources, particularly solar photovoltaic (PV) systems [1]. To mitigate climate change and reduce greenhouse gas emissions, countries worldwide have committed to stringent targets, including the pursuit of the ambitious goal of limiting global average temperature rise to below 1.5 °C compared to pre-industrial levels. South Korea, like many nations, has set forth its Nationally Determined Contribution (NDC), aiming for a 37% reduction in greenhouse gas emissions by 2030 [2]. In response to these targets, the power industry in South Korea has undergone a significant transformation, shifting from conventional power generation sources, such as nuclear and coal-fired plants, toward renewable energy alternatives, most notably PV and wind power.
However, the rapid expansion of PV generation has brought to light several critical concerns related to the stability and reliability of the power grid. Renewable energy sources inherently introduce variability and unpredictability into the grid, leading to challenges in accurately estimating power generation [3]. This issue becomes even more pronounced as PV energy capacity continues to grow [4]. Of particular concern is the scenario where PV energy production exceeds the immediate power demand, resulting in surplus energy. This necessitates the curtailment of PV energy to ensure a consistent and stable supply of electricity [5,6]. This phenomenon is projected to occur more frequently as part of the medium to long-term plans for expanding renewable energy adoption, leading to reduced capacity utilization rates of PV generation and financial losses for IPPs (Independent Power Producers) [7].
Adding to the complexity, the South Korean power grid is characterized by a unique configuration. As illustrated in Figure 1, a substantial portion of electric power is generated from nuclear and thermal power plants, primarily located along the coastline. Over 40% of the total power demand in the metropolitan area is satisfied through what is known as “northward power flow” [8]. This type of power grid necessitates the use of long-distance and high-capacity transmission lines. The continuous rise in power demand, coupled with the growing presence of renewable energy sources at the grid’s peripheries, raises concerns about voltage stability and the potential for power outages [9]. Moreover, scenarios projecting the increased adoption of renewable energy sources predict that PV capacity in the Jeolla region may account for up to 40% of the total capacity. This influx of PV energy into a grid already influenced by northward power flow could exacerbate transmission line congestion issues.
Various solutions have been proposed to tackle these pressing challenges. Among these, the concepts of VPPs (Virtual Power Plants) and MES (Multi Energy Systems) have emerged as promising strategies to address the issues of PV curtailment and transmission congestion.
A VPP is a system operated by an AGG (Aggregator) that integrates distributed energy resources into a unified virtual power plant [10]. Unlike traditional power plants, a VPP consolidates power from geographically dispersed locations, enabling the AGG to collect PV energy from IPPs and formulate comprehensive power supply plans [11]. AGGs actively participate in the power market, reserve power market, demand response initiatives, and various other services. Additionally, IPPs engage in PV energy forecasting to fulfill contractual obligations with AGGs [12]. By minimizing prediction errors associated with PV energy integration into the grid, a higher degree of reliability can be achieved in the power system.
MES, on the other hand, represents an integrated system that harmonizes diverse energy sources, technologies, and infrastructure to meet energy demands efficiently and sustainably [13]. It encompasses the coexistence of multiple energy mediums, including electricity, gas, heat, and hydrogen. One of the significant advantages of MES is its ability to balance supply and demand among various energy mediums. In particular, MES facilitates the efficient integration and utilization of intermittent renewable energy by converting surplus energy generated from renewables into gas energy or heat. With the establishment of a hydrogen infrastructure by AGGs, surplus PV energy can be alleviated through P2G (Power-to-Gas) technology [14]. Moreover, by transporting the produced hydrogen via tanker trucks and supplying it back to densely populated areas through fuel cells, power can be delivered without heavy reliance on the existing power grid, thereby alleviating congestion on transmission lines.
The platform that encompasses the aforementioned concepts of VPP and MES is referred to as the VCHP (Virtual Clean Hydrogen Plant). It is essential to note that much attention has been given to CVPP (Commercial Virtual Power Plants) and TVPP (Technical Virtual Power Plants). Refs. [15,16,17] focuses on the introduction of VPP from the perspective of CVPP, with an emphasis on generating revenue in the energy market and developing business models for energy trading and operations. Refs. [18,19] investigates and develops technical solutions for potential challenges that may arise from implementing VPP in the actual power system, considering the TVPP viewpoint. South Korea is currently moving forward with the CHPS (Clean Hydrogen Portfolio Standard) system as part of its efforts to establish a hydrogen infrastructure [20]. This initiative is expected to have significant implications for the economic assessment of hydrogen production facilities, particularly concerning subsidy calculations. However, the technical aspects of integrating VCHP into the power system have yet to be rigorously validated. Therefore, a comprehensive analysis of the technical challenges associated with the introduction of hydrogen energy into the power system is imperative.
The primary objective of this paper is to investigate the feasibility of implementing the VCHP platform while addressing two critical technical issues that arise with increased renewable energy adoption: PV energy curtailment and transmission line congestion. To achieve this goal, we have developed a power system model that accurately reflects the energy landscape of South Korea, with a specific focus on the IEEE 30 Bus Transmission network. This model serves as the foundation for our research, allowing us to explore the effectiveness and potential benefits of integrating VCHP as a solution to the anticipated technical challenges stemming from the widespread use of renewable energy sources.

2. VCHP Platform

2.1. Introduction of the VCHP Platform

The VCHP platform is a sophisticated system built on the CHPS system. It specializes in the conversion of surplus energy generated from PV sources into hydrogen, its subsequent storage, and controlled supply to the power grid as per the operator’s objectives. The VCHP technology plays a pivotal role in ensuring sustainable energy production and a stable power supply. By harnessing the VCHP platform, surplus renewable energy is efficiently captured and stored in the form of hydrogen. This stored energy can then be utilized during periods of peak power demand or when renewable energy generation exceeds the grid’s capacity [21]. This strategic integration of hydrogen as an energy carrier enables effective management and utilization of intermittent renewable energy sources, thereby enhancing the stability and reliability of the overall power system.

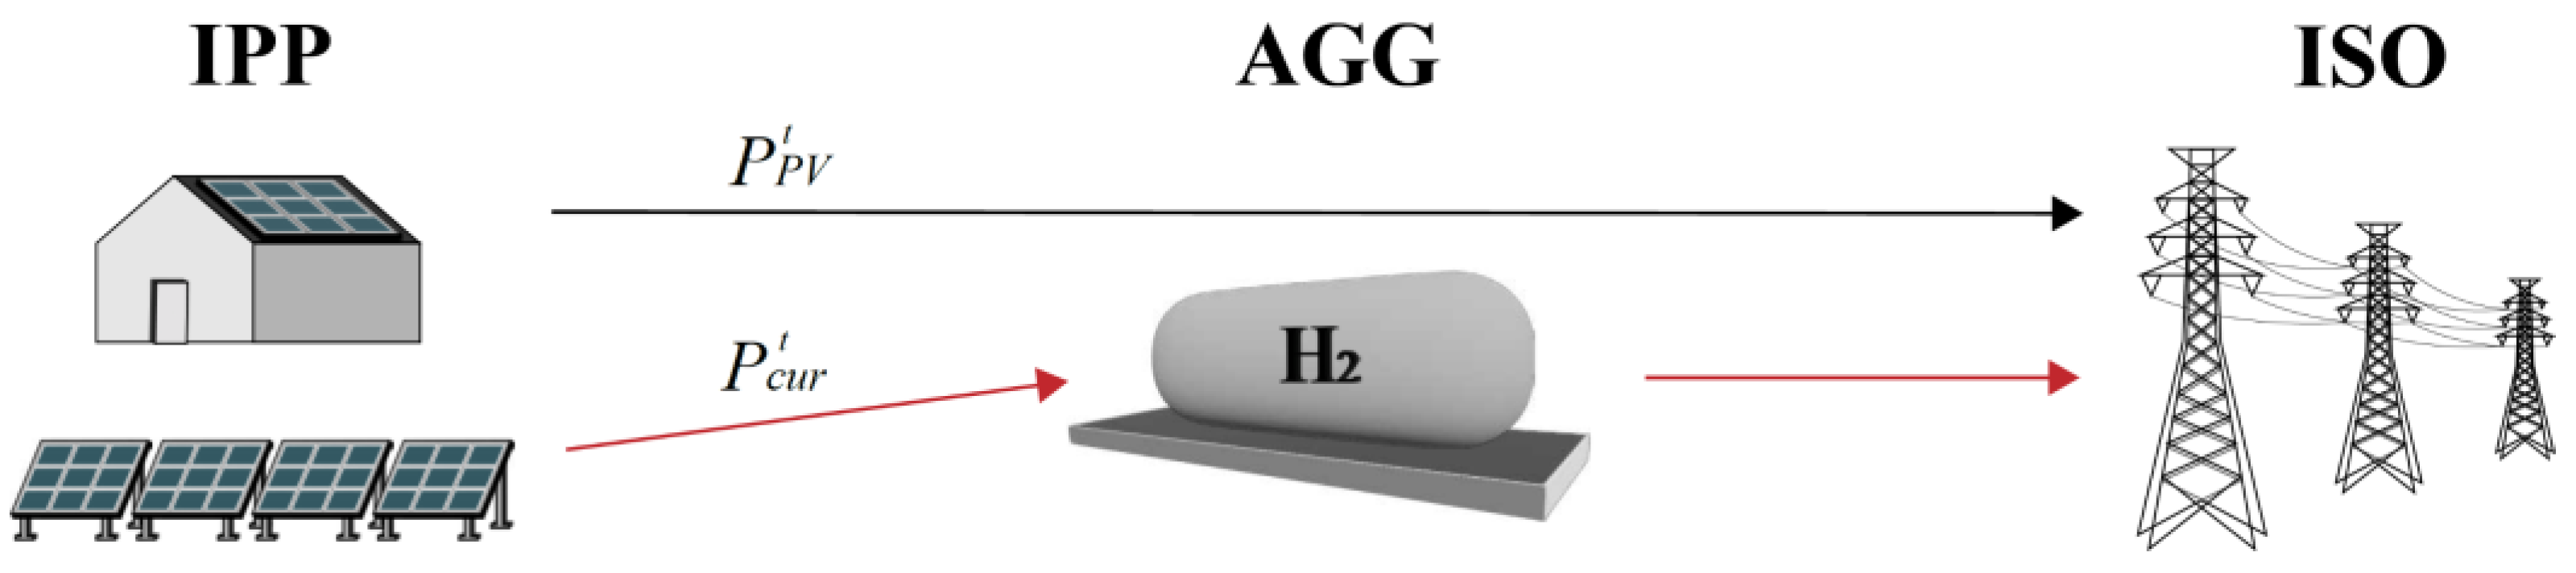
2.2. Description of ISO, IPP, and AGG within the VCHP Platform

  • ISO: The ISO manages and coordinates information related to power generation, consumption, and markets to ensure the stability and efficiency of power supply. Specifically, they work to reduce the variability of PV energy over time, thereby increasing the stability and reliability of the power grid while also reducing costs.
  • IPP: IPP refers to companies or organizations that own and operate power generation facilities, such as PV [22]. Within the VCHP platform, IPPs enter into power purchase agreements with the AGG to provide their generated energy and generate revenue. Additionally, IPPs perform forecasts for PV energy, which are utilized by the AGG in developing power supply plans. In the case of forecast errors, penalties may be imposed on IPPs according to the agreement with the AGG, motivating them to improve the accuracy of their energy forecasts and fulfill their obligated energy.
  • AGG: The AGG, or Aggregator, functions as the intermediary entity responsible for collecting and consolidating electricity generated from DERs (Distributed Energy Resources) and independent power producers within the VCHP platform [23]. What sets the AGG apart in this context is its ability to establish and operate a hydrogen production system. It collects surplus power generated by PV installations and converts it into hydrogen, which can be transported using methods like tanker shipments to fuel cells located near densely populated areas. Consequently, the AGG enables power supply to densely populated regions without overburdening the traditional power grid.

2.3. VHCP Platform Operation and Hydrogen Production

The VCHP platform operates based on surplus power data collected through AGG, as illustrated in Figure 2.
The operation is described by the following equations:
P I P P t = P P V t + P c u r t
P A G G t = P c u r t
P E l z t = 1 T ( S O C t 1 + t t + T P A G G t )
H H E S S t = P E l z t · η E l z / H H V H 2
P F C t = H H E S S t · η H E S S
Equation (1) represents the total energy that IPPs can produce through PV. Before integrating with the VCHP platform, IPPs were limited to generating energy P P V t solely through PV. However, by integrating with the VCHP platform, IPPs can generate additional curtailed energy P c u r t . In this paper, AGG collects only P c u r t from IPP, which can be expressed as Equation (2). AGG can have various operational modes depending on the type of AEL. In this paper, an AEL (alkaline electrolyzer) is utilized, which generates a fixed quantity of hydrogen periodically, as represented in Equation (3). In Equation (4), the calculation for the amount of hydrogen stored in the hydrogen storage system considers the efficiency of the AEL and the HHV (Higher Heating Value) [24]. Additionally, when supplying the hydrogen stored in the HESS to the power system according to AGG’s plan, the efficiency of the hydrogen tanks is taken into account as shown in Equation (5).

2.4. Revenue Structure of the VCHP Platform

Currently, IPPs are unable to meet the minimum PV capacity required for bidding in the electricity market. As a result, they rely on PPA (Power Purchase Agreement) contracts with the ISO to receive settlements for their generated power [25]. However, the integration of the VCHP platform provides AGG with the opportunity to directly contract with multiple IPPs. This allows AGG to secure sufficient PV capacity and participate in the bidding processes of the electricity market. By doing so, AGG can sell the power collected from IPPs, denoted as P I P P t through bidding in the electricity market. This integration enables AGG to generate revenue by receiving settlement payments based on the electricity market bids from ISO. It expands AGG’s market participation and creates new revenue streams by leveraging the surplus power collected from IPPs. Furthermore, the integration of the VCHP platform allows AGG to produce hydrogen, enabling them to receive additional premium settlement payments under the CHPS scheme [26]. This presents an opportunity for IPPs to generate higher revenue compared to their existing PPA contracts with ISO. By distributing the additional premium settlement payments alongside the revenue from the new contracts with AGG, IPPs can increase their overall earnings. This revenue model ensures a guaranteed income for both AGG and IPPs within the VCHP platform.

3. Modeling for Power System Test Cases

In this section, we provide a comprehensive overview of our approach to modeling power system test cases, which served as the foundation for our analysis of PV energy curtailment and line flows.

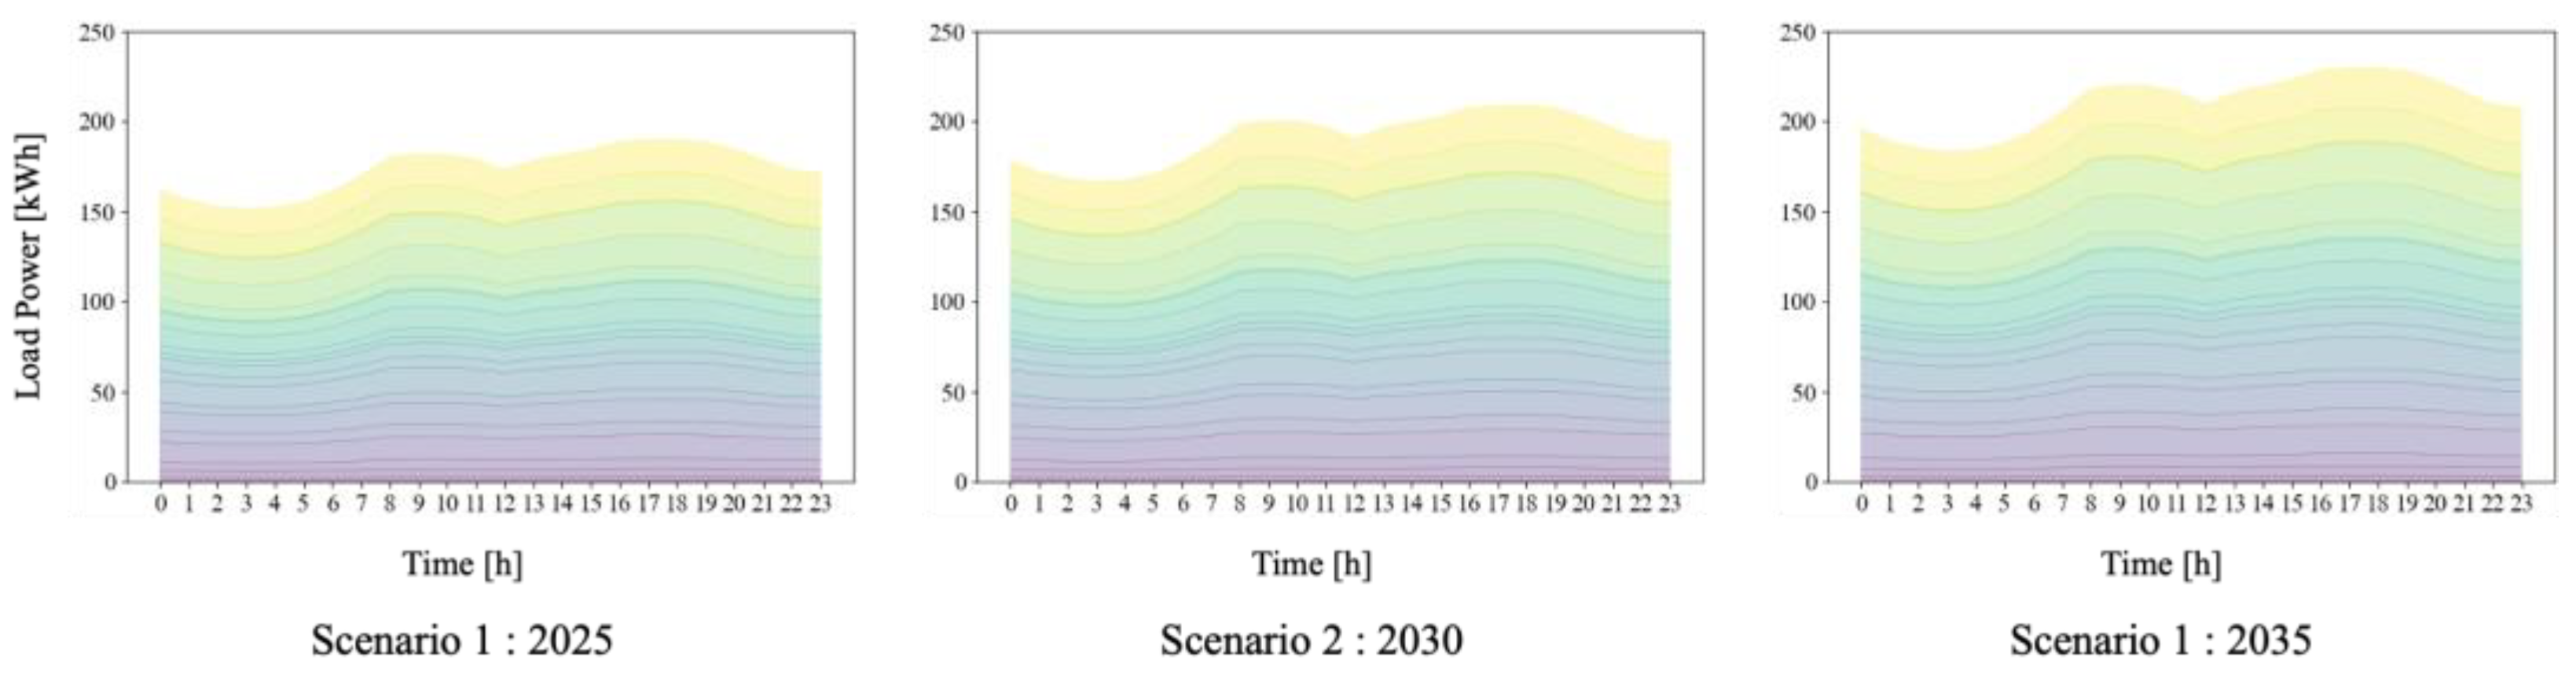
3.1. Data Collection and Scenario: PV Energy Curtailment

In our study, we conducted a thorough analysis of PV energy generation patterns and their impact on the power grid, focusing on a time-of-day basis using 24-h data. To ensure the accuracy and reliability of our analysis, we adopted a meticulous data collection process:
  • PV Energy and Load Data: We collected time-based PV energy data and load data from the KPX (Korea Power Exchange), a reputable authority in the energy sector [27]. This data formed the basis for our simulations and allowed us to replicate realistic energy generation and consumption patterns.
In addition to data collection, we meticulously designed three distinct scenarios, each corresponding to a different year (2025, 2030, and 2035). These scenarios were crafted with a forward-looking perspective, aiming to anticipate and address challenges in the evolving energy landscape over the next decade. Our scenario design was informed by critical data outlined in “The 10th Basic Plan of Long-Term Electricity Supply and Demand”, which provided essential insights into PV capacity and peak load projections for each year [28]. Table 1 provides detailed configurations of PV capacity, peak load, and curtailed energy for each scenario, forming the basis for our simulations and analyses. The profile used to reflect PV capacity and peak load in the scenario is shown in Figure 3 and Figure 4. Figure 3 and Figure 4 show the cumulative graph of all PV Profiles and Load Profiles, respectively.

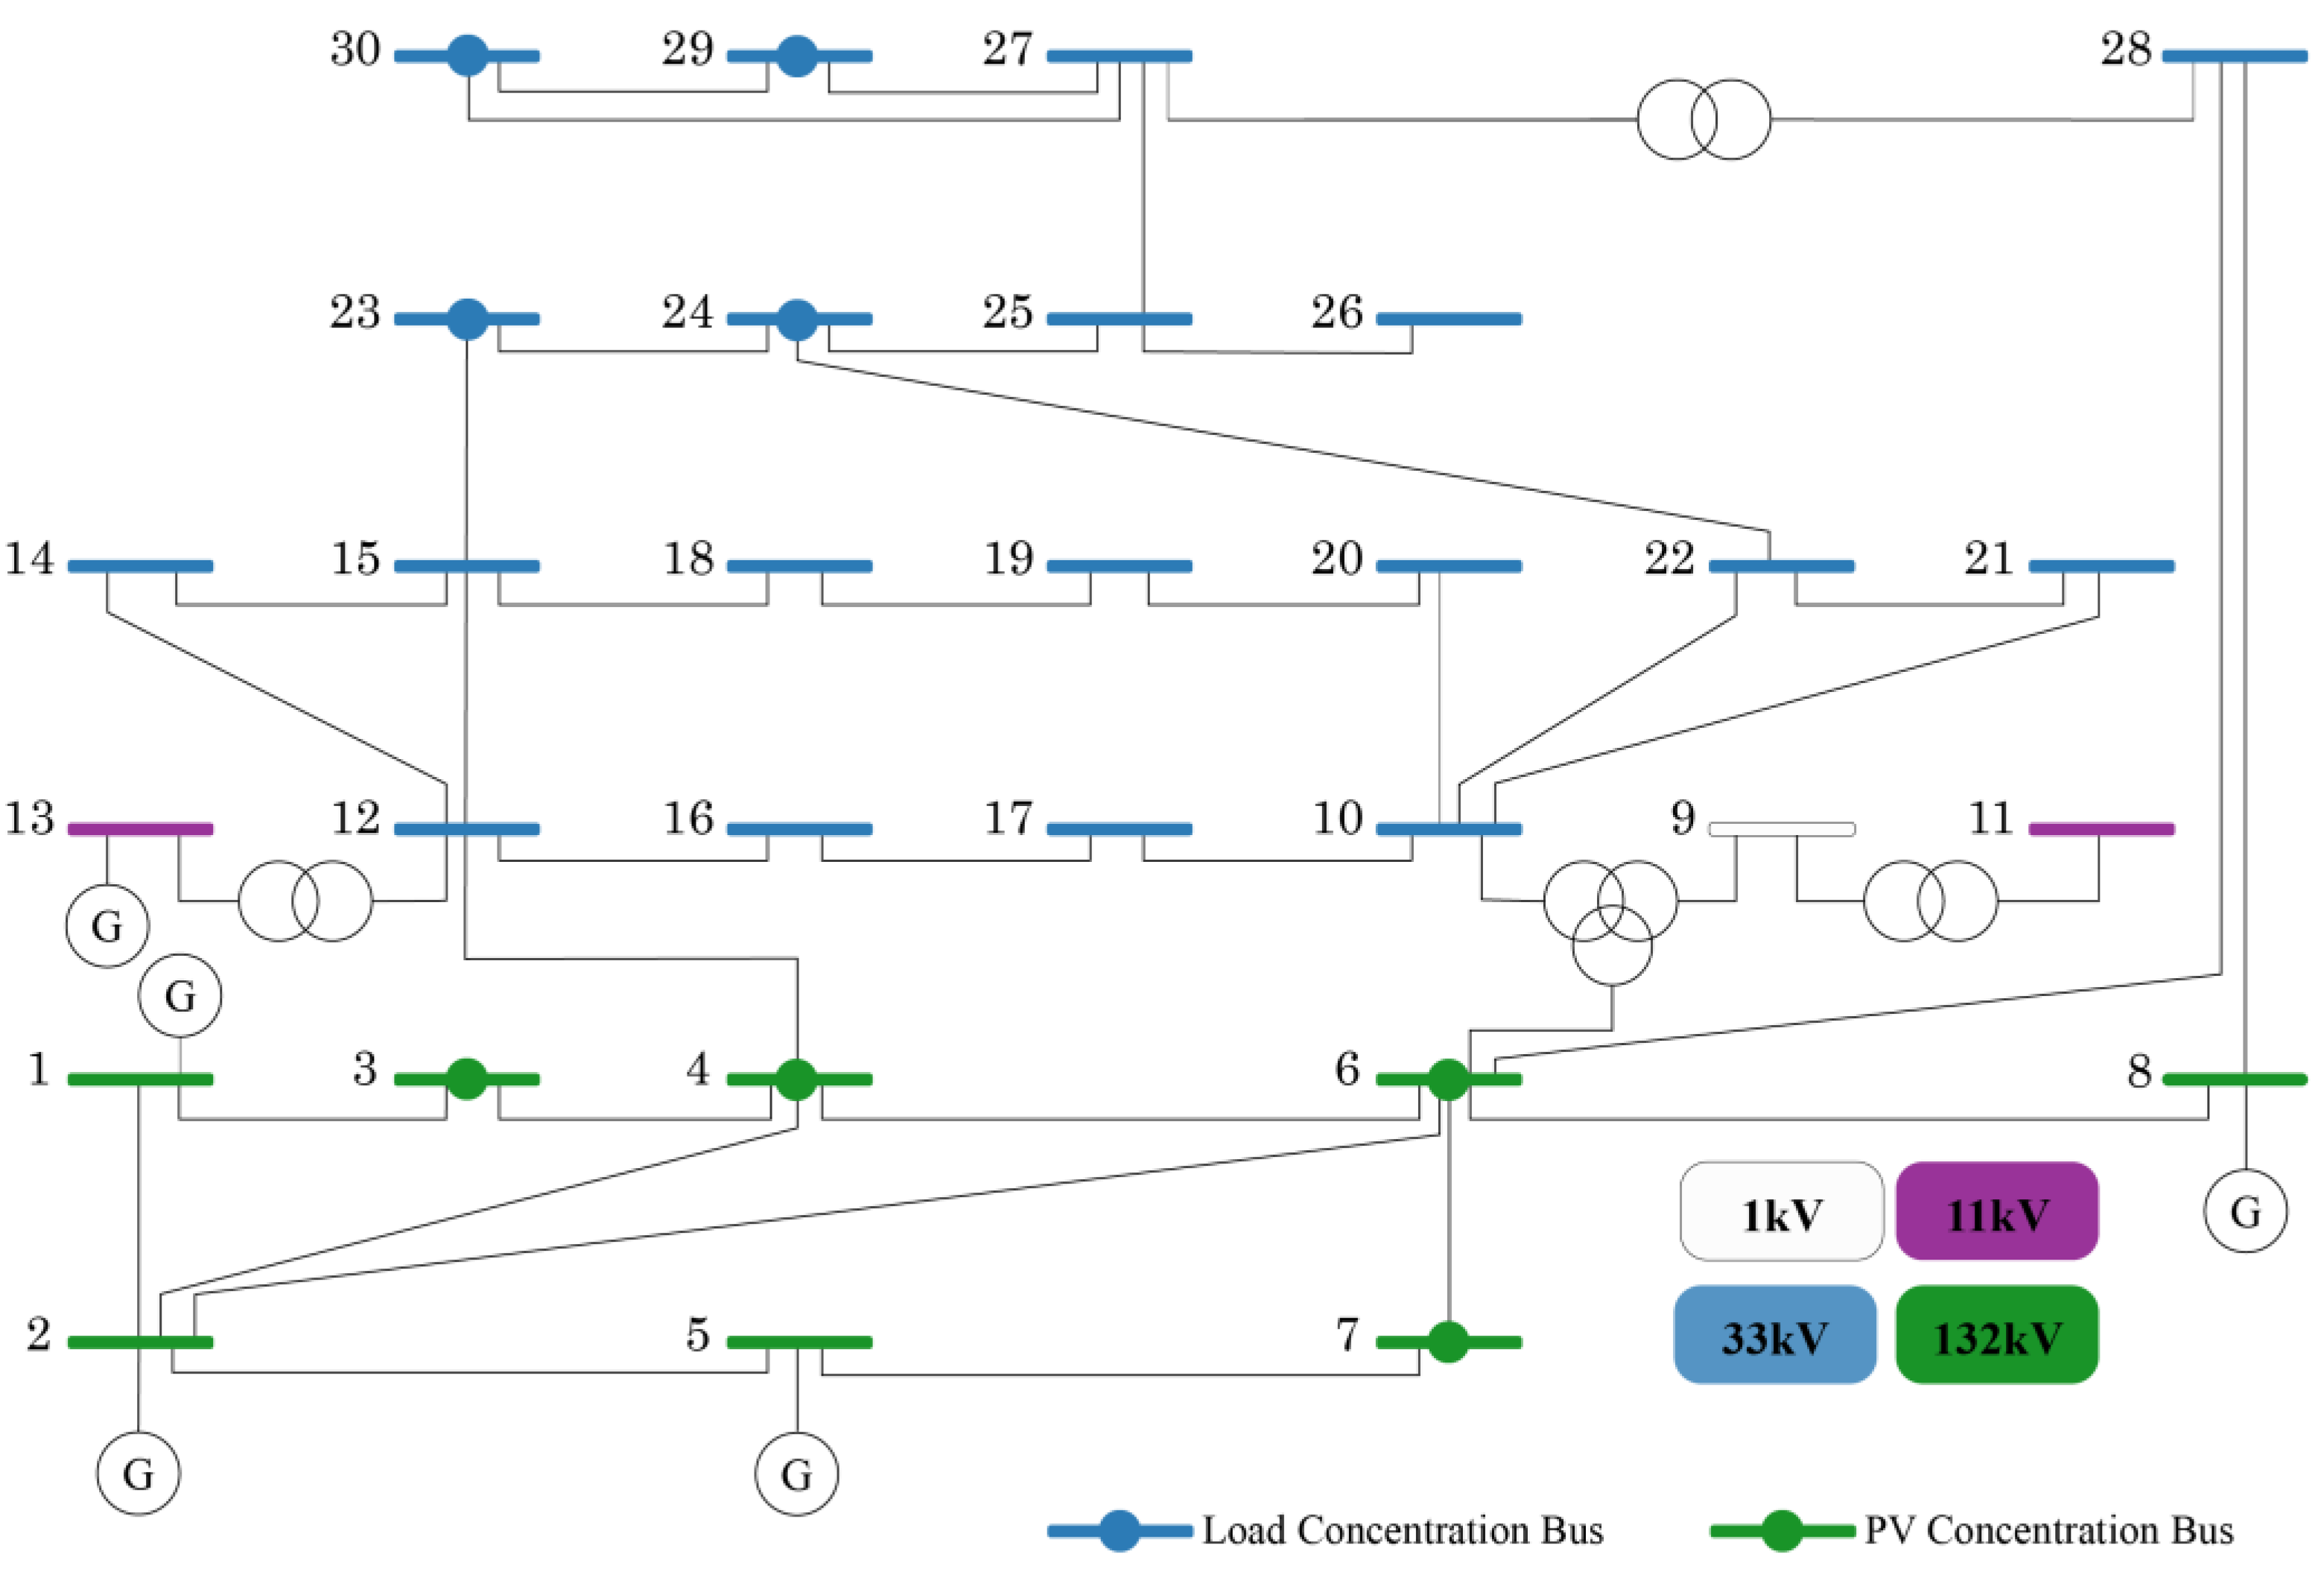
3.2. Modeling for Power System Test Cases

To simulate the South Korean power system, we utilized the widely recognized IEEE 30 Bus model, a standard in power transmission system research. However, to accurately reflect the characteristics of South Korea’s power system, we introduced specific modifications:
  • Bus and Line Configurations: We retained the fundamental bus and line configurations of the IEEE 30 Bus model, ensuring compatibility with existing research in the field.
  • Load Concentrated Areas (LCA): Recognizing the high load density in metropolitan areas, we established Load Concentrated Areas (LCA) at buses 23, 24, 29, and 30. Approximately 40% of the total load was allocated to these buses, in accordance with low voltage constraints.
  • PV Concentrated Areas (PCA): To account for concentrated PV generation in the Jeolla region, we designated PV Concentrated Areas (PCA) at buses 3, 4, 6, and 7. The PV capacity at these buses was adjusted to align with the scenarios outlined in Table 1.
These modifications allowed us to construct an accurate representation of South Korea’s power system, considering the unique characteristics of high load density in metropolitan areas and concentrated PV generation in specific regions.
Our overall power system configuration, inclusive of LCA, PCA, and additional modifications, is depicted in Figure 5, providing a visual representation of our model. Through these detailed modeling efforts, we aimed to create a robust foundation for our analysis, enabling a thorough examination of PV energy curtailment and its implications for the South Korean power grid.

4. Power System Line Congestion Analysis

4.1. TUR (Transmission Line Utilization Rate)

In our comprehensive analysis, we placed significant emphasis on evaluating line congestion within the power system using the Transmission Line Utilization Rate (TUR). The TUR is a fundamental metric calculated as the ratio of the actual power transmitted through a given transmission line during a specific time period to its designated capacity, expressed mathematically as follows (Equation (6)):
T U R = P o w e r   T r a n s m i t t e d   t h r o u g h   t h e   L i n e L i n e   C a p a c i t y
By systematically measuring the TUR and employing it as a pivotal parameter for line congestion analysis, we gain valuable insights into the extent of congestion experienced by individual transmission lines. A high TUR reading indicates that a particular line is bearing an excessive load, potentially leading to undesirable outcomes such as increased power losses and voltage drops.

4.2. STUR (Standardized Transmission Line Utilization Rate)

Within the context of VCHP integration and line congestion assessment, we introduced a novel metric known as the STUR (Standardized Transmission Line Utilization Rate). The STUR is calculated as the standard deviation of TUR data for all transmission lines within the system, as defined by Equation (7):
S T U R = ( T U R l μ T U R ) 2 n
T U R l —TUR for each line, μ T U R —The average of TUR, n —The number of lines
STUR casts a wide net, offering a comprehensive overview of the distribution of TUR values across the entire network. It enables us to assess the degree to which individual lines deviate from the system’s average TUR. When the STUR value registers higher, it signals significant disparities in TUR values among various lines. This disparity, in turn, points to areas of concentrated overload, potentially foreshadowing an elevated Transmission Line Loss Rate (TLR).

4.3. TLR (Transmission Line Loss Rate)

The TLR (Transmission Line Loss Rate) is a crucial parameter defined as the ratio of power losses occurring within the transmission lines to the total power transmitted. It is mathematically represented by Equation (8).
T L R = L i n e   L o s s L i n e   F l o w × 100
A higher TUR reading is often indicative of an increased likelihood of line losses stemming from excessive load conditions, ultimately resulting in escalated power losses. Moreover, an elevated STUR value suggests significant variations in TUR among different transmission lines, implying areas of potential concentrated overload and correspondingly heightened TLR.

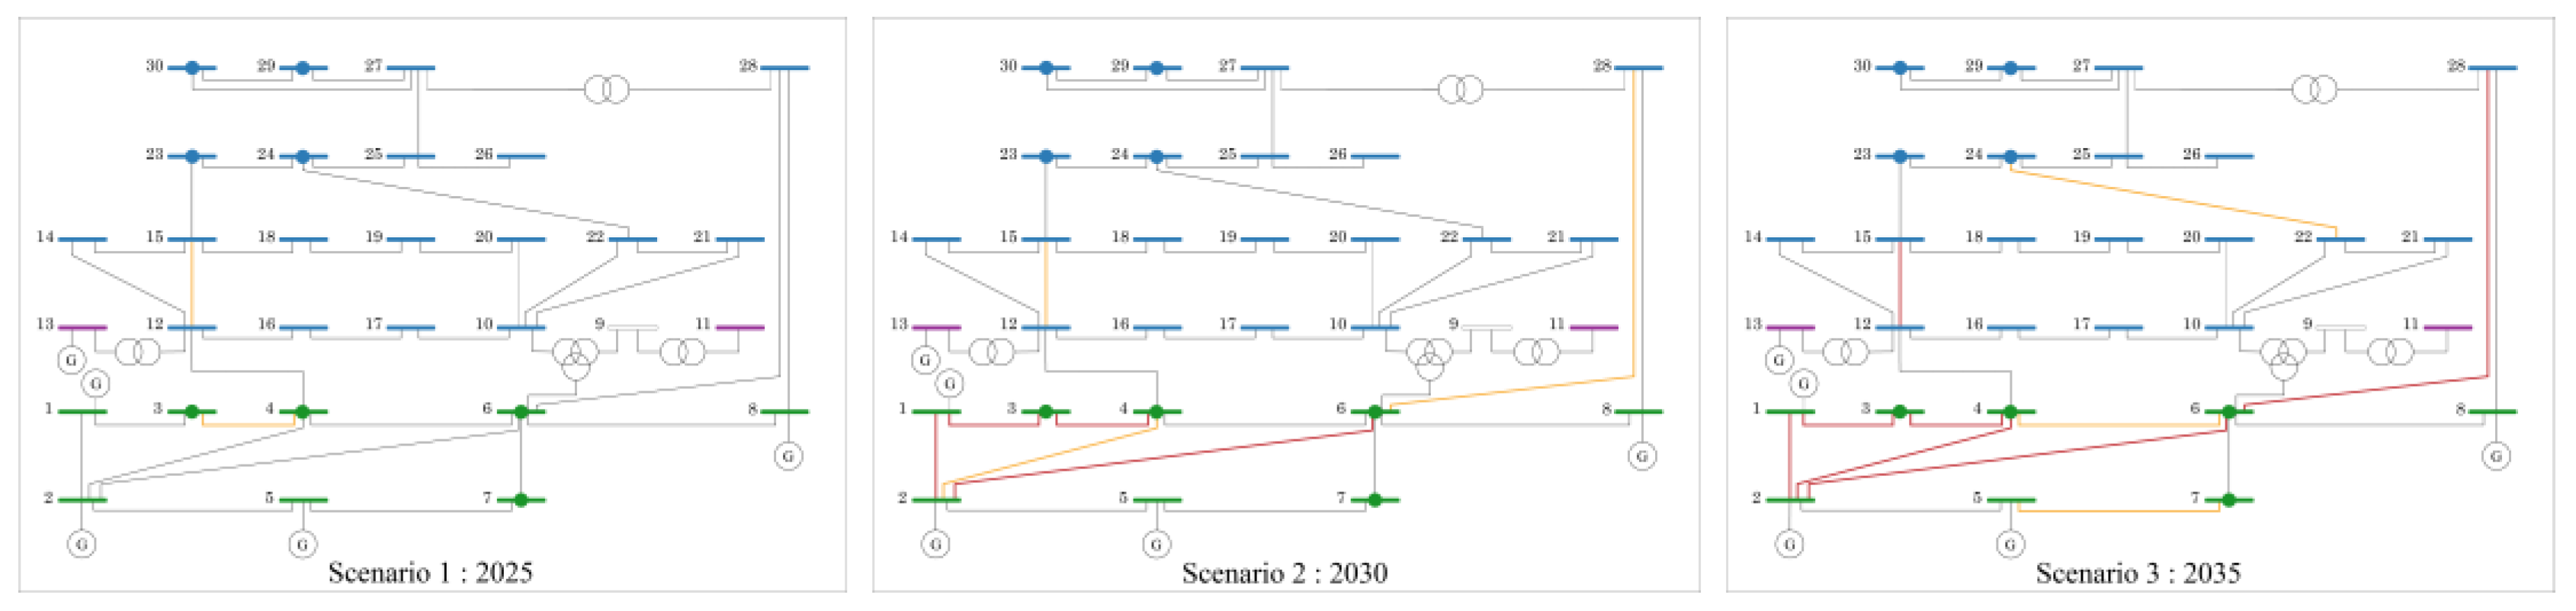
4.4. Line Congestion Analysis with Scenario Consideration

This section of our study delves into the meticulous analysis of line congestion within the constructed power system while carefully considering different scenarios. Table 2 provides a detailed breakdown of our line congestion analysis, offering insights into the specific time periods during which congestion occurred, the number of lines affected, and the maximum TUR recorded for each scenario.
Scenario 1 represents a scenario where no congestion was observed within the system. It serves as a reference point, allowing us to understand the baseline performance of the power system without VCHP integration. However, in Scenario 2, a nuanced congestion pattern emerges during the hours of 17:00 to 18:00. This specific time frame witnesses congestion affecting four transmission lines, all situated strategically within the generation-concentrated area. Scenario 3 paints a more intricate congestion picture, with congestion predominantly occurring within the generation-concentrated area throughout the entire 24-h cycle. Notably, this congestion pattern persists during all hours, except for the period when PV generation is at its peak. Conversely, regions outside the generation-concentrated zone also experience congestion, primarily during the PV generation period.
To provide enhanced visual clarity and facilitate a deeper understanding of our line congestion analysis, we have thoughtfully prepared Figure 6. This visual representation concentrates on the pivotal time frame of 17:00 in Scenarios 2 and 3, where congestion incidents are most likely to manifest. In this graphical depiction, transmission lines exceeding the critical TUR thresholds of 90% and 100% are vividly highlighted. Lines breaching the 90% threshold are indicated using a distinctive yellow hue, signifying areas where congestion concerns are emerging. Furthermore, lines surpassing the 100% TUR threshold are portrayed in a striking red color, underscoring the most critical areas that require immediate attention and mitigation strategies. This graphical analysis provides stakeholders and policymakers with a clear visualization of regions within the power system that are susceptible to congestion, thereby enabling targeted measures to enhance grid stability and operational efficiency.

5. Case Study

This chapter embarks on an immersive journey into the intricacies of the VCHP (Virtual Clean Hydrogen Plant) platform’s practical application. Our focus pivots toward the real-world deployment of VCHP within the multifaceted framework of the South Korean power system. Here, we present an in-depth exploration of two key facets: the repercussions of PV energy curtailment and the tangible benefits of VCHP integration in alleviating line congestion.

5.1. PV Curtailment Applied VCHP Platform

In this section, we delve into the phenomenon of curtailed PV energy in the current scenario, which serves as the baseline for our analysis. We examine the extent of PV energy curtailment and its proportion relative to the total energy output in the absence of VCHP integration.
Central to our analysis is the “PV Energy Ratio [%],” signifying the proportion of PV energy within the overall energy generation. This metric reverberates the global shift toward an augmented reliance on renewable energy sources. As evident from Table 3, the escalating penetration of PV energy is intricately linked to substantial curtailed energy in scenarios devoid of VCHP integration. These findings underscore the challenges of accommodating high PV penetration, including the ever-looming specters of energy curtailment and potential line congestion. It serves as a clarion call, emphasizing the urgency of pioneering solutions like the VCHP platform to effectively tackle these issues, thereby unlocking the full potential of renewable energy sources.

5.2. Line Congestion Due to VCHP Platform

In this pivotal segment of our study, we embark on a quest to determine whether VCHP integration serves as the antidote to line congestion, which often plagues modern power systems. Our analytical compass guides us through a comparison of three vital parameters: maximum Transmission Line Utilization Rate (TUR), Standardized Transmission Utilization Rate (STUR), and Transmission Line Loss Rate (TLR) across the various scenarios, as meticulously documented in Table 4, Table 5 and Table 6.
Table 4 unearths a compelling revelation: certain lines in Scenarios 2 and 3 witness maximum TUR values surpassing the critical threshold of 1.0, signaling congestion. However, the introduction of VCHP heralds a transformative shift. Post-integration, TUR values plummet below 1.0, underlining the platform’s remarkable efficacy in taming line congestion. VCHP emerges as a guardian, adept at regulating the load on transmission lines, fostering seamless power flow, and ultimately enhancing system stability.
Table 5 illustrates the decrease in STUR across the entire set of scenarios due to VCHP integration. The decrease in STUR signifies a decrease in the overall dispersion of congestion, indicating a more balanced distribution of power across the entire network of lines. This highlights the improved efficiency and effectiveness of power allocation achieved through VCHP integration. The decrease in STUR implies that the integration of VCHP enables a more equitable distribution of power among the lines, promoting fairness in energy allocation. This leads to enhanced system efficiency, contributing to a more stable and reliable transmission network. By mitigating congestion and achieving a more balanced power distribution, VCHP integration plays a crucial role in improving the overall performance and reliability of the transmission network.
Table 6 serves as an unequivocal testament to the transformative power of VCHP integration. It casts a spotlight on the direct impact on transmission line losses. As line flows diminish, so do line losses. The calculated TLR unequivocally reveals that the reduction in line flow magnitude corresponds to a pronounced decrease in line losses. Put simply, by moderating the flow magnitude in the transmission lines, VCHP effectively curtails loss rates, enabling the resolution of line congestion. This table also meticulously quantifies the tangible improvements stemming from VCHP integration, underlining its pivotal role in reducing power losses and elevating system performance.
In sum, our comprehensive case study illustrates that VCHP integration within the South Korean power system not only curtails the specter of PV energy curtailment but also acts as a potent antidote to the scourge of line congestion. These findings bear monumental significance for the global pursuit of sustainable energy production and reliable power supply. VCHP emerges as a transformative solution poised to redefine the landscape of modern power systems, ushering in an era of enhanced efficiency, equitable power distribution, and unparalleled reliability.

6. Conclusions

In conclusion, our exploration of the VCHP (Virtual Clean Hydrogen Plant) platform signifies a pivotal step toward revolutionizing power systems to meet the challenges and demands of a rapidly evolving energy landscape. As we journeyed through the intricate intricacies of integrating renewable energy sources, curbing PV generation curtailment, and combating line congestion, we unearthed profound insights that underscore the paramount importance of the VCHP platform.
In the backdrop of an energy paradigm increasingly shaped by renewable sources, our meticulous analysis depicted a daunting challenge—the looming specter of line congestion. As scenarios projected forward into 2025, 2030, and 2035, we observed an undeniable trend in the escalation of the Transmission Line Utilization Rate (TUR). This metric, emblematic of line congestion, presented a formidable concern for power grid stability. Yet, the introduction of the VCHP platform heralded a transformative shift. Across all scenarios, the TUR remained consistently below the critical threshold of 1, marking a resounding victory in our battle against line congestion. This respite in congestion, attributed to the ingenious utilization of surplus PV energy, reaffirmed the VCHP platform’s indispensable role in reshaping the energy landscape.
The Standardized Transmission Line Utilization Rate (STUR) served as our compass, guiding us through the intricate labyrinth of power distribution. Its steady descent following VCHP integration testified to a more balanced power allocation, thus promoting fairness in energy distribution. This pronounced reduction in STUR values signaled an overarching decline in congestion, resonating with the spirit of equitable power distribution.
Crucially, the Transmission Line Loss Rate (TLR) unveiled the profound impact of VCHP integration. Our analysis discerned a decline in both maximum and average TLR values, a phenomenon paralleling the reduction in line flow magnitude. This salient revelation underscored the VCHP platform’s unparalleled effectiveness in diminishing power losses. Importantly, the reduction in line losses exceeded the decrease in power flow, a testament to the platform’s prowess in resolving line congestion.
Our findings emphasize that while renewable energy is essential for sustainability, it presents complex challenges in power system management. Nevertheless, the VCHP platform emerges as an innovative solution that not only harnesses surplus PV energy but also enhances power system stability and resilience.
Looking ahead, our research agenda is firmly anchored in enhancing the VCHP platform’s applicability to our national grid. We are committed to refining our modeling techniques, ensuring a more accurate representation of the intricacies of our domestic power system. Moreover, a central focus of our future work lies in optimizing solutions that account for time-of-day variations in congestion patterns.
These strategic directions underscore our dedication to advancing the practical implementation of the VCHP platform. By aligning our research with the specific needs and dynamics of our nation’s energy infrastructure, we aim to catalyze a more efficient, sustainable, and resilient power system.
As we embark on this journey of refining and applying our research, we anticipate a ripple effect, transcending the boundaries of our national grid. The VCHP platform’s adaptability positions it as a valuable blueprint for regions facing similar energy challenges worldwide. Our findings and methodologies are poised to influence not only our domestic energy landscape but also global conversations on transitioning to sustainable energy.
In closing, our research represents a significant stride toward harnessing renewable energy potential while fortifying our power system’s stability. With a steadfast commitment to refining and expanding the VCHP platform’s capabilities, we aspire to shape a more sustainable energy future, both locally and on a global scale.

Author Contributions

Conceptualization, G.-T.D. and S.-Y.K.; Data curation, G.-T.D. and E.-T.S.; Formal analysis, G.-T.D. and B.-C.O.; Investigation, G.-T.D.; Methodology, E.-T.S. and B.-C.O.; Project administration G.-T.D.; and Resources, H.-J.K. and H.-S.R. and J.-T.C.; Software, H.-J.K. and H.-S.R. and J.-T.C.; Supervision, S.-Y.K.; Validation, G.-T.D. and S.-Y.K.; Visualization, G.-T.D. and E.-T.S. and B.-C.O.; Writing—original draft, G.-T.D.; Writing—review & editing, G.-T.D. All authors have read and agreed to the published version of the manuscript.

Funding

This research was funded by KEPCO Research Institute (KEPRI) grant number R20DA16.

Data Availability Statement

Publicly available datasets were analyzed in this study. This data can be found here: [https://new.kpx.or.kr/menu.es?mid=a10107020000, https://www.kier.re.kr/resources/download/tpp/policy_230113_data.pdf (accessed on 1 January 2023)].

Conflicts of Interest

The authors declare no conflict of interest.

Abbreviations

AGGAggregator
CHPSClean Hydrogen Portfolio Standard
CVPPCommercial Virtual Power Plant
DERDistributed Energy Resources
IPPIndependent Power Producers
ISOIndependent System Operator
LCALoad Concentrated Areas
MESMulti Energy System
PCAPV Concentrated Areas
PPAPower Purchase Agreement
PVPhotovoltaic
P2GPower-to-Gas
STURStandardized Transmission Line Utilization Rate
TLRTransmission Line Loss Rate
TURTransmission Line Utilization Rate
TVPPTechnical Virtual Power Plant
VCHPVirtual Clean Hydrogen Plants
VPPVirtual Power Plant

References

  1. Ju, L.; Zhao, R.; Tan, Q.; Lu, Y.; Tan, Q.; Wang, W. A multi-objective robust scheduling model and solution algorithm for a novel virtual power plant connected with power-to-gas and gas storage tank considering uncertainty and demand response. Appl. Energy 2019, 250, 1336–1355. [Google Scholar] [CrossRef]
  2. Jeong, W.C.; Lee, D.H.; Roh, J.H.; Park, J.B. Scenario Analysis of the GHG Emissions in the Electricity Sector through 2030 in South Korea Considering Updated NDC. Energies 2022, 15, 3310. [Google Scholar] [CrossRef]
  3. Badami, M.; Fambri, G.; Mancò, S.; Martino, M.; Damousis, I.G.; Agtzidis, D.; Tzovaras, D. A Decision Support System Tool to Manage the Flexibility in Renewable Energy-Based Power Systems. Energies 2020, 13, 153. [Google Scholar] [CrossRef]
  4. Olatomiwa, L.; Mekhilef, S.; Ismail, M.; Moghavvemi, M. Energy management strategies in hybrid renewable energy systems: A review. Renew. Sustain. Energy Rev. 2016, 62, 821–835. [Google Scholar] [CrossRef]
  5. Bird, L.; Lew, D.; Milligan, M.; Carlini, E.M.; Estanqueiro, A.; Flynn, D.; Gomez-Lazaro, E.; Holttinen, H.; Menemenlis, N.; Orths, A.; et al. Wind and solar energy curtailment: A review of international experience. Renew. Sustain. Energy Rev. 2016, 65, 577–586. [Google Scholar] [CrossRef]
  6. O’Shaughnessy, E.; Cruce, J.R.; Xu, K. Too much of a good thing? Global trends in the curtailment of solar PV. Sol. Energy 2020, 208, 1068–1077. [Google Scholar] [CrossRef]
  7. Son, Y.G.; Oh, B.C.; Acquah, M.A.; Kim, S.Y. Optimal facility combination set of integrated energy system based on consensus point between independent system operator and independent power producer. Energy 2023, 266, 126422. [Google Scholar] [CrossRef]
  8. Park, W.Y.; Lee, S.L.; Kim, J.Y. The Effect of Fuel Price Changes and the Electricity Mix on Electricity Market Stability. 2021. Available online: http://www.keei.re.kr/web_keei/en_publish.nsf/fcdfe4cf427d25e749257b03004199bd/f8312a84c8cdcbda492588fe00063db2/$FILE/BAS2111e.pdf (accessed on 2 September 2023).
  9. Hosseinzadeh, N.; Aziz, A.; Mahmud, A.; Gargoom, A.; Rabbani, M. Voltage Stability of Power Systems with Renewable-Energy Inverter-Based Generators: A Review. Electronics 2021, 10, 115. [Google Scholar] [CrossRef]
  10. Tang, W.-J.; Yang, H.-T. Optimal Operation and Bidding Strategy of a Virtual Power Plant Integrated with Energy Storage Systems and Elasticity Demand Response. IEEE Access 2019, 7, 79798–79809. [Google Scholar] [CrossRef]
  11. Lu, X.; Li, K.; Xu, H.; Wang, F.; Zhou, Z.; Zhang, Y. Fundamentals and business model for resource aggregator of demand response in electricity markets. Energy 2020, 204, 117885. [Google Scholar] [CrossRef]
  12. Sarker, M.R.; Dvorkin, Y.; Ortega-Vazquez, M.A. Optimal Participation of an Electric Vehicle Aggregator in Day-Ahead Energy and Reserve Markets. IEEE Trans. Power Syst. 2016, 31, 3506–3515. [Google Scholar] [CrossRef]
  13. Mancarella, P. MES (multi-energy systems): An overview of concepts and evaluation models. Energy 2014, 65, 1–17. [Google Scholar] [CrossRef]
  14. Son, Y.-G.; Oh, B.-C.; Acquah, M.A.; Fan, R.; Kim, D.-M.; Kim, S.-Y. Multi Energy System with an Associated Energy Hub: A Review. IEEE Access 2021, 9, 127753–127766. [Google Scholar] [CrossRef]
  15. Wang, S.; Jia, R.; Shi, X.; Luo, C.; An, Y.; Huang, Q.; Guo, P.; Wang, X.; Lei, X. Research on Capacity Allocation Optimization of Commercial Virtual Power Plant (CVPP). Energies 2022, 15, 1303. [Google Scholar] [CrossRef]
  16. Pourghaderi, N.; Fotuhi-Firuzabad, M.; Kabirifar, M.; Moeini-Aghtaie, M. Energy Management Framework for a TVPP in Active Distribution Network with Diverse DERs. In Proceedings of the 2019 27th Iranian Conference on Electrical Engineering (ICEE), Yazd, Iran, 30 April–2 May 2019; pp. 714–719. [Google Scholar] [CrossRef]
  17. Liu, H.; Li, Z.; Liu, P.; Cheng, Q.; Ji, Y.; Qu, J. Recent Advances on Distributed Dispatching and Control Algorithms in Virtual Power Plant. J. Physic. 2022, 2247, 012031. [Google Scholar] [CrossRef]
  18. Pourghaderi, N.; Fotuhi-Firuzabad, M.; Moeini-Aghtaie, M.; Kabirifar, M. Commercial Demand Response Programs in Bidding of a Technical Virtual Power Plant. IEEE Trans. Ind. Inform. 2018, 14, 5100–5111. [Google Scholar] [CrossRef]
  19. Gough, M.; Santos, S.F.; Lotfi, M.; Javadi, M.S.; Osorio, G.J.; Ashraf, P.; Castro, R.; Catalao, J.P.S. Operation of a Technical Virtual Power Plant Considering Diverse Distributed Energy Resources. IEEE Trans. Ind. Appl. 2022, 58, 2547–2558. [Google Scholar] [CrossRef]
  20. Hong, S.; Kim, E.; Jeong, S. Evaluating the sustainability of the hydrogen economy using multi-criteria decision-making analysis in Korea. Renew. Energy 2023, 204, 485–492. [Google Scholar] [CrossRef]
  21. Zhou, S.; Sun, K.; Wu, Z.; Gu, W.; Wu, G.; Li, Z.; Li, J. Optimized operation method of small and medium-sized integrated energy system for P2G equipment under strong uncertainty. Energy 2020, 199, 117269. [Google Scholar] [CrossRef]
  22. Tor, O.B.; Guven, A.N.; Shahidehpour, M. Promoting the Investment on IPPs for Optimal Grid Planning. IEEE Trans. Power Syst. 2010, 25, 1743–1750. [Google Scholar] [CrossRef]
  23. Yi, Z.; Xu, Y.; Wang, H.; Sang, L. Coordinated Operation Strategy for a Virtual Power Plant with Multiple DER Aggregators. IEEE Trans. Sustain. Energy 2021, 12, 2445–2458. [Google Scholar] [CrossRef]
  24. Son, Y.-G.; Son, E.-T.; Acquah, M.-A.; Choo, S.-H.; Jo, H.-S.; Lee, J.-E.; Kim, D.-M.; Kim, S.-Y. Independent Power Producer Approach to Optimal Design and Operation of IES with Wind Power Plants. Energies 2023, 16, 28. [Google Scholar] [CrossRef]
  25. Lee, J.; Shepley, M.M. Benefits of solar photovoltaic systems for low-income families in social housing of Korea: Renewable energy applications as solutions to energy poverty. J. Build. Eng. 2020, 28, 101016. [Google Scholar] [CrossRef]
  26. Son, Y.G.; Kwag, H.G.; Lee, S.H.; Kim, S.Y. Marginal fixed premium for clean hydrogen portfolio standard (CHPS) considering techno-economic analysis of clean hydrogen production based on hydropower plants. Energy Rep. 2023, 10, 1356–1368. [Google Scholar] [CrossRef]
  27. Available online: https://new.kpx.or.kr/menu.es?mid=a10107020000 (accessed on 8 August 2022).
  28. Available online: https://www.kier.re.kr/resources/download/tpp/policy_230113_data.pdf (accessed on 1 January 2023).
Figure 1. Distribution of power plant facilities and regional electrical load in South Korea.
Energies 16 07652 g001
Figure 2. Diagram of VCHP platform for utilizing IPP curtailment.
Energies 16 07652 g002
Figure 3. PV profile by scenario.
Energies 16 07652 g003
Figure 4. Load profile by scenario.
Energies 16 07652 g004
Figure 5. IEEE 30 bus topology.
Energies 16 07652 g005
Figure 6. IEEE 30 bus line congestion by scenario.
Energies 16 07652 g006
Table 1. PV capacity and peak load based on the scenario.
ScenariosYearPV Capacity
[MW]
Peak Load [MW]Curtailed Energy
[MWh]
#1202580190.02.33
#22030140209.0110
#32035190229.9210
Table 2. Line congestion analysis by scenario.
ScenariosYearLine Congestion Occurrence Time [h]Number of
Congested Lines
Max TUR [p.u.]
#12025--0.919
#2203017–1841.143
#320350–2461.312
Table 3. PV Curtailment and proportion of PV relative to total energy.
ScenariosBefore Applied VCHPScenarios
Curtailed E [MWh]PV Energy Ratio [%]Number of
Congested Lines
Curtailed E
[MWh]
#12.3334.12#12.33
#211039.05#2110
#321043.82#3210
Table 4. Comparison of maximum TUR with respect to VCHP platform integration.
ScenariosMax TUR before Applied VCHP [p.u.]Max TUR after Applied VCHP [p.u.]
#10.9190.910 (−0.9%)
#21.1430.950 (−19.3%)
#31.3120.989 (−32.3%)
Table 5. Comparison of STUR with respect to VCHP platform integration.
ScenariosSTUR before Applied VCHP [p.u.]STUR after Applied VCHP [p.u.]
#10.2960.295 (−0.1%)
#20.3500.308 (−4.2%)
#30.4080.334 (−7.4%)
Table 6. Comparison of TLR with respect to VCHP platform integration.
ScenariosBefore Applied VCHPAfter Applied VCHPTotal Loss Difference
[MWh]
Max TLR [%]Average TLR [%]Max TLR [%]Average TLR [%]
#18.6391.8618.6391.8610.000
#29.5552.1189.1471.9863.921
#310.5772.4129.8752.1726.878
Disclaimer/Publisher’s Note: The statements, opinions and data contained in all publications are solely those of the individual author(s) and contributor(s) and not of MDPI and/or the editor(s). MDPI and/or the editor(s) disclaim responsibility for any injury to people or property resulting from any ideas, methods, instructions or products referred to in the content.

