Abstract
Furan tests provide a non-intrusive and cost-effective method of estimating the degradation of paper insulation, which is critical for ensuring the reliability of power grids. However, conducting routine furan tests can be expensive and challenging, highlighting the need for alternative methods, such as machine learning algorithms, to predict furan concentrations. To establish the generalizability and robustness of the furan prediction model, this study investigates two distinct datasets from different geographical locations, Utility A and Utility B. Three scenarios are proposed: in the first scenario, a round-robin cross-validation method was used, with 75% of the data for training and the remaining 25% for testing. The second scenario involved training the model entirely on Utility A and testing it on Utility B. In the third scenario, the datasets were merged, and round-robin cross-validation was applied, similar to the first scenario. The findings reveal the effectiveness of machine learning algorithms in predicting furan concentrations, and particularly the stacked generalized ensemble method, offering a non-intrusive and cost-effective alternative to traditional testing methods. The results could significantly impact the maintenance strategies of power and distribution transformers, particularly in regions where furan testing facilities are not readily available.
1. Introduction
Power and distribution transformers are critical and costly components in any power system grid. They play a vital role in ensuring the reliability of the power grid by transferring electrical energy from one voltage level to another. The overall health condition of these transformers is mainly dependent on the state of their insulation system, and especially the paper insulation [1]. Overloading or internal faults during operation can expedite the aging process of the transformer paper insulation. Hence, monitoring the transformer insulation paper’s health condition is critical to ensure its satisfactory performance, efficiency, and longevity. To ensure the stability and reliability of the power system, it is crucial to monitor, maintain, diagnose, and upgrade transformers regularly. This helps prevent costly accidents and damage, extend transformer life, increase grid reliability, and reduce maintenance costs [2,3,4]. Accurately evaluating the condition of power transformers is essential for creating and sustaining a highly reliable power system [5,6].
One key parameter in assessing the health condition of the transformer paper insulation is the concentration of furan compounds. A correlation between the level of furan in transformer oil and the degree of polymerization (DP) has been reported [7,8,9]. Moreover, many studies have correlated the remaining lifespan of transformers with the condition of the oil–paper insulation system [10,11,12]. Therefore, measuring the amount of furan in transformer oil can effectively assess the transformer’s paper health condition. Thus, furan measurements offer a non-intrusive way to estimate the degradation of the paper insulation instead of measuring the DP and tensile strength (TS) of cellulose insulation paper, which requires taking a sample from the paper itself. This non-intrusive method is not only less invasive but also reduces the need for transformers to be taken out of service, which can be costly and disruptive to utilities.
Predicting furan concentrations can reduce the overall transformer maintenance cost. This is mainly due to the fact that the furan testing facilities may not be readily available for some countries, and hence testing one oil sample can be expensive [13]. This highlights the importance of developing alternative methods, such as machine learning (ML) algorithms, to predict furan concentration.
ML algorithms have seen significant advancements in recent years, proving efficacy in numerous applications. Previous studies have applied intelligent techniques to monitoring and diagnosing transformers. Most of these studies use intelligent techniques to analyze and predict dissolved gas, oil tests, or transformer health [5,6]. Jahromi et al. presented a practical approach to implementing the computed HI, which can serve as a basis for developing a capital plan to replace assets nearing the end of their lifespan [14]. This method has proven to be an effective tool for assessing the likelihood of transformer failure and determining the remaining lifespan of the equipment. Another study developed an AI-based health index approach to accurately assess power transformer conditions while handling data uncertainty [15]. A hybrid AI system for the prognostic health management of power transformers that integrates various algorithms and models for diagnostics, health monitoring, and maintenance optimization has also been introduced.
In a different study, a general regression neural network (GRNN) was created to evaluate the health index (HI) of four different conditions (very poor, poor, fair, and good). The transformer’s health condition was predicted with 83% accuracy using six crucial inputs, namely the oil’s total dissolved combustible gas, furan levels, dielectric strength, acidity, water content, and dissipation factor [16]. Alqudsi et al. focused on utilizing ML to predict the insulation health condition of medium voltage distribution transformers based on oil test results. The study demonstrated the effectiveness of ML algorithms by testing large databases of transformer oil samples. The research highlights the potential cost reduction in transformer asset management using ML prediction models [17]. Different ML algorithms have been proven to be beneficial for the assessment of the transformer health index. A study compared seven different ML approaches and found that random forest has the highest predicting accuracy [15]. Another work employed the k-Nearest Neighbors (kNN) algorithm to classify distribution transformers’ health index, and achieved good accuracy [18].
Leveraging ML techniques to predict furan concentrations in transformers can provide a more economical and accessible approach to monitoring the health of transformer paper insulation. Thus, some studies have focused on predicting such expensive tests as furan concentrations. Ghunem et al. used an artificial neural network to predict furan content based on input parameters such as carbon monoxide, carbon dioxide, water content, acidity, and breakdown voltage [19]. The results showed an average prediction accuracy of 90%. Another paper took a similar approach and utilized a neural network with stepwise regression to predict furan content in transformer oil using oil quality parameters and dissolved gases as inputs. The model achieved around 90% prediction accuracy [20]. Mahdjoubi et al. used a different methodology and used least squares support vector machines (LS-SVM) to predict furan in power transformers [21]. In this work, dissolved gases (carbon monoxide and carbon dioxide) were used as input variables. This approach was proven to reduce testing time and provides a good estimation of results validated by experimental tests. Another work investigated using dissolved gas analysis, breakdown voltage, oil properties, and furan compounds to estimate the degree of polymerization of transformer insulating paper, which indicates paper aging and remaining transformer life [22]. Furan content in transformer oil can also be estimated via a fuzzy logic approach using UV-Vis spectroscopy, which was developed in [23].
This paper investigates the prediction of furan using two distinct datasets, Utility A and Utility B, representing different geographical locations. To ensure the generalizability of the model, three scenarios are proposed based on common features between the two datasets. In the first scenario, round-robin cross-validation was employed by training on 75% of the data from Utility A and testing on the remaining 25%, with results averaged across all iterations. In the second scenario, the model was trained on the entirety of Utility A and tested on Utility B. In the third scenario, the Utility A and Utility B datasets were merged to create a new combined dataset, which was used for round-robin cross-validation similar to the first scenario. These three scenarios are explored to establish the robustness and generalizability of the furan prediction model across different geographical locations.
In the context of learning-based problems, the primary objective is to identify a model that can accurately predict the output. Relying solely on a single model may not yield the best results, as its accuracy is not guaranteed. To overcome this limitation, a stacked regression model is proposed to generate a final, more robust model. This stacked generalized model offers a more comprehensive and reliable approach to predicting outputs by incorporating a diverse range of models. This can enhance the accuracy and effectiveness of learning-based systems.
Given the shortcomings of the previous works, the difference between the scientific contributions of this paper and the other ones can be summarized as follows:
- The proposed ML regression models (ExtraTress, KNN, and XGBoost) have been proven to be effective in assessing the quality of transformer oils in numerous studies [17,18,24]. These algorithms are successful in many fields, such as image processing, biomedicine, and data science. They have anti-noising advantages and better generalization abilities relative to other models [17]. Algorithms like ExtraTrees and KNN are also suitable for building prediction models with small amounts of data. Previous studies have applied these algorithms separately but not in a combined way. We propose a novel approach that stacks all the models in a generalized regression framework. This method is known to produce the most accurate predictions and is among the best ML techniques in many data science contests. Two different metrics evaluate these algorithms.
- The robustness of the models was tested on two datasets from different regions and on three scenarios. A step-wise regression was also used to select the most relevant oil test features for predicting the HI value and to eliminate the less-important ones.
To validate the model, a method known as round-robin cross-validation is employed, which offers significant advantages over traditional training and testing approaches. Unlike the conventional method, where a limited number of new cases is used for testing, cross-validation allows us to utilize all available data for training and testing the regression model concurrently. This comprehensive approach enables us to assess the algorithm’s performance at multiple stages, such as before and after each data filtration step. By doing so, we gain valuable insights into the influence of each filtering process on the results produced by the classifier. This approach provides a better understanding of the model’s effectiveness and improves our ability to make informed decisions.
2. Materials and Methods
2.1. Datasets
This study used two distinct datasets: Utility A and Utility B. The Utility A dataset includes maintenance records for 730 power transformers from a local Gulf region utility. The dataset encompasses test results of dissolved gas analysis (DGA) and oil quality tests, such as breakdown voltage, water content, acidity, and furan content. The transformers in this dataset were produced between 1960 and 2011, with power ratings ranging from 12.5 to 40 MVA and voltage levels of 66/11 kV. Utility B comprises 327 transformer oil samples with a voltage level of 33/11 kV and a rating of 15 MVA. As some oil test results in Utility A are absent in Utility B, only the common features between these two datasets were considered in this study. For instance, CO, CO2, color, and dissipation factor data do not exist in Utility B and were therefore excluded from Utility A to construct a comparable model. Notably, both datasets differ in geographical location and were obtained from two different countries. Table 1 shows nine common features between Utility A and Utility B that were used in this study, along with their corresponding index.

Table 1.
List of used features.
2.2. Data Pre-Processing
The pre-processing of the data was divided into two main steps to ensure the quality of the data used for regression. In the first step, outliers were identified and removed, as they can significantly impact a regressor’s performance and lead to inaccurate results. Each feature’s mean and standard deviation were computed to identify and remove outliers, and any observation whose absolute difference from the mean exceeded three times the standard deviation was removed. In the second pre-processing step, the data were normalized to ensure that all features had the same significance. This was important because features with larger values can dominate the learning process, leading to biased results. A standard scaling method was employed, which involved subtracting the mean from each feature and dividing by the standard deviation. This resulted in a feature with a mean of zero and a standard deviation of one, which ensured that all features had equal weight in the learning process and reduced the impact of any outliers that were not removed in the first step.
2.3. The Machine Learning Methodology
This study used an ML approach to predict furan content. This approach involves three phases: training, testing, and deployment. During the training phase, data with known target values, which in this study were furan, were collected, and a subset of features was selected to construct a predictive model, specifically a regressor. In the testing phase, the performance of the models was evaluated on a separate set of data not used for training, which ensures that the model can generalize well to new unseen data. Finally, the model was applied to new data in the deployment phase to predict the furan content. A feature selection method called stepwise regression was employed to eliminate irrelevant and redundant features, reducing noise and dimensionality, which will be discussed later.
There are several algorithms available to build ML-based regression models, and in this study, ExtraTrees, k-Nearest Neighbors, and Extreme Gradient Boosting were used to predict furan content, followed by a stacked regression model that combines all of these algorithms together, which will be discussed later. Each algorithm has its strengths and weaknesses and may adapt differently to the given data. A brief description of the machine learning algorithms that were used in this study is presented below:
- ExtraTrees is an ensemble learning method that builds on decision tree algorithms, similar to Random Forests (RF) [25]. It utilizes an ensemble of decision trees trained on different subsets of the input data. By averaging the predictions from multiple decision trees, RF achieves better predictive performance and helps prevent overfitting compared to using a single decision tree model. While Random Forests uses bootstrap aggregating (bagging) to sample different variations of the training data for each decision tree, ExtraTrees differs in that it trains each decision tree using the full dataset. ExtraTrees randomly selects feature values to split on when creating child nodes in the trees [26]. This reduces bias but increases variance and computation cost, though ExtraTrees still tend to be faster than Random Forests.
- The k-Nearest Neighbor (kNN) algorithm is a popular supervised learning technique widely used in various ML applications. The core principle of kNN involves classifying objects based on their proximity to the training examples in the feature space. Specifically, the algorithm seeks to identify a predefined number of training samples that are closest in distance to a given query instance and then uses these samples to predict the label of the query instance [27]. While kNN shares some similarities with decision tree algorithms, it is unique in that it seeks to find a path around the graph rather than constructing a tree.
- XGBoost, or Extreme Gradient Boosting, is a powerful ML technique that combines decision trees and gradient boosting to achieve high accuracy in both regression and classification tasks. The algorithm works by repeatedly refining decision trees using the errors from previous trees [28]. To improve the accuracy of the model, a loss function is minimized to measure the discrepancy between predicted and actual values. This is achieved through gradient descent, which involves adding new decision trees that better fit the training data. To avoid overfitting, XGBoost includes a regularization term in its objective function. What sets XGBoost apart is its speed, scalability, and ability to work with high-dimensional features. It is also adept at handling missing values, selecting important features, and performing parallel processing.
A stacked regression approach is proposed to enhance the generalizability and performance of the predictive model. Relying on a single model may not always yield optimal results; therefore, a stack of multiple ML algorithms is used. The key concept behind this approach is to overcome the limitations of individual algorithms, as a weakness of one algorithm might be a strength of another [29].
For instance, kNN assumes that similar values close to each other are likely to belong to the same class [27], which may not hold true in many physical systems where features are not correlated. However, this method requires loading all labeled data points into memory and computing distances between them and the test data points to assign a label. Combining these algorithms in a stacked regression model allows us to leverage their strengths while overcoming limitations, leading to a more robust and accurate prediction model.
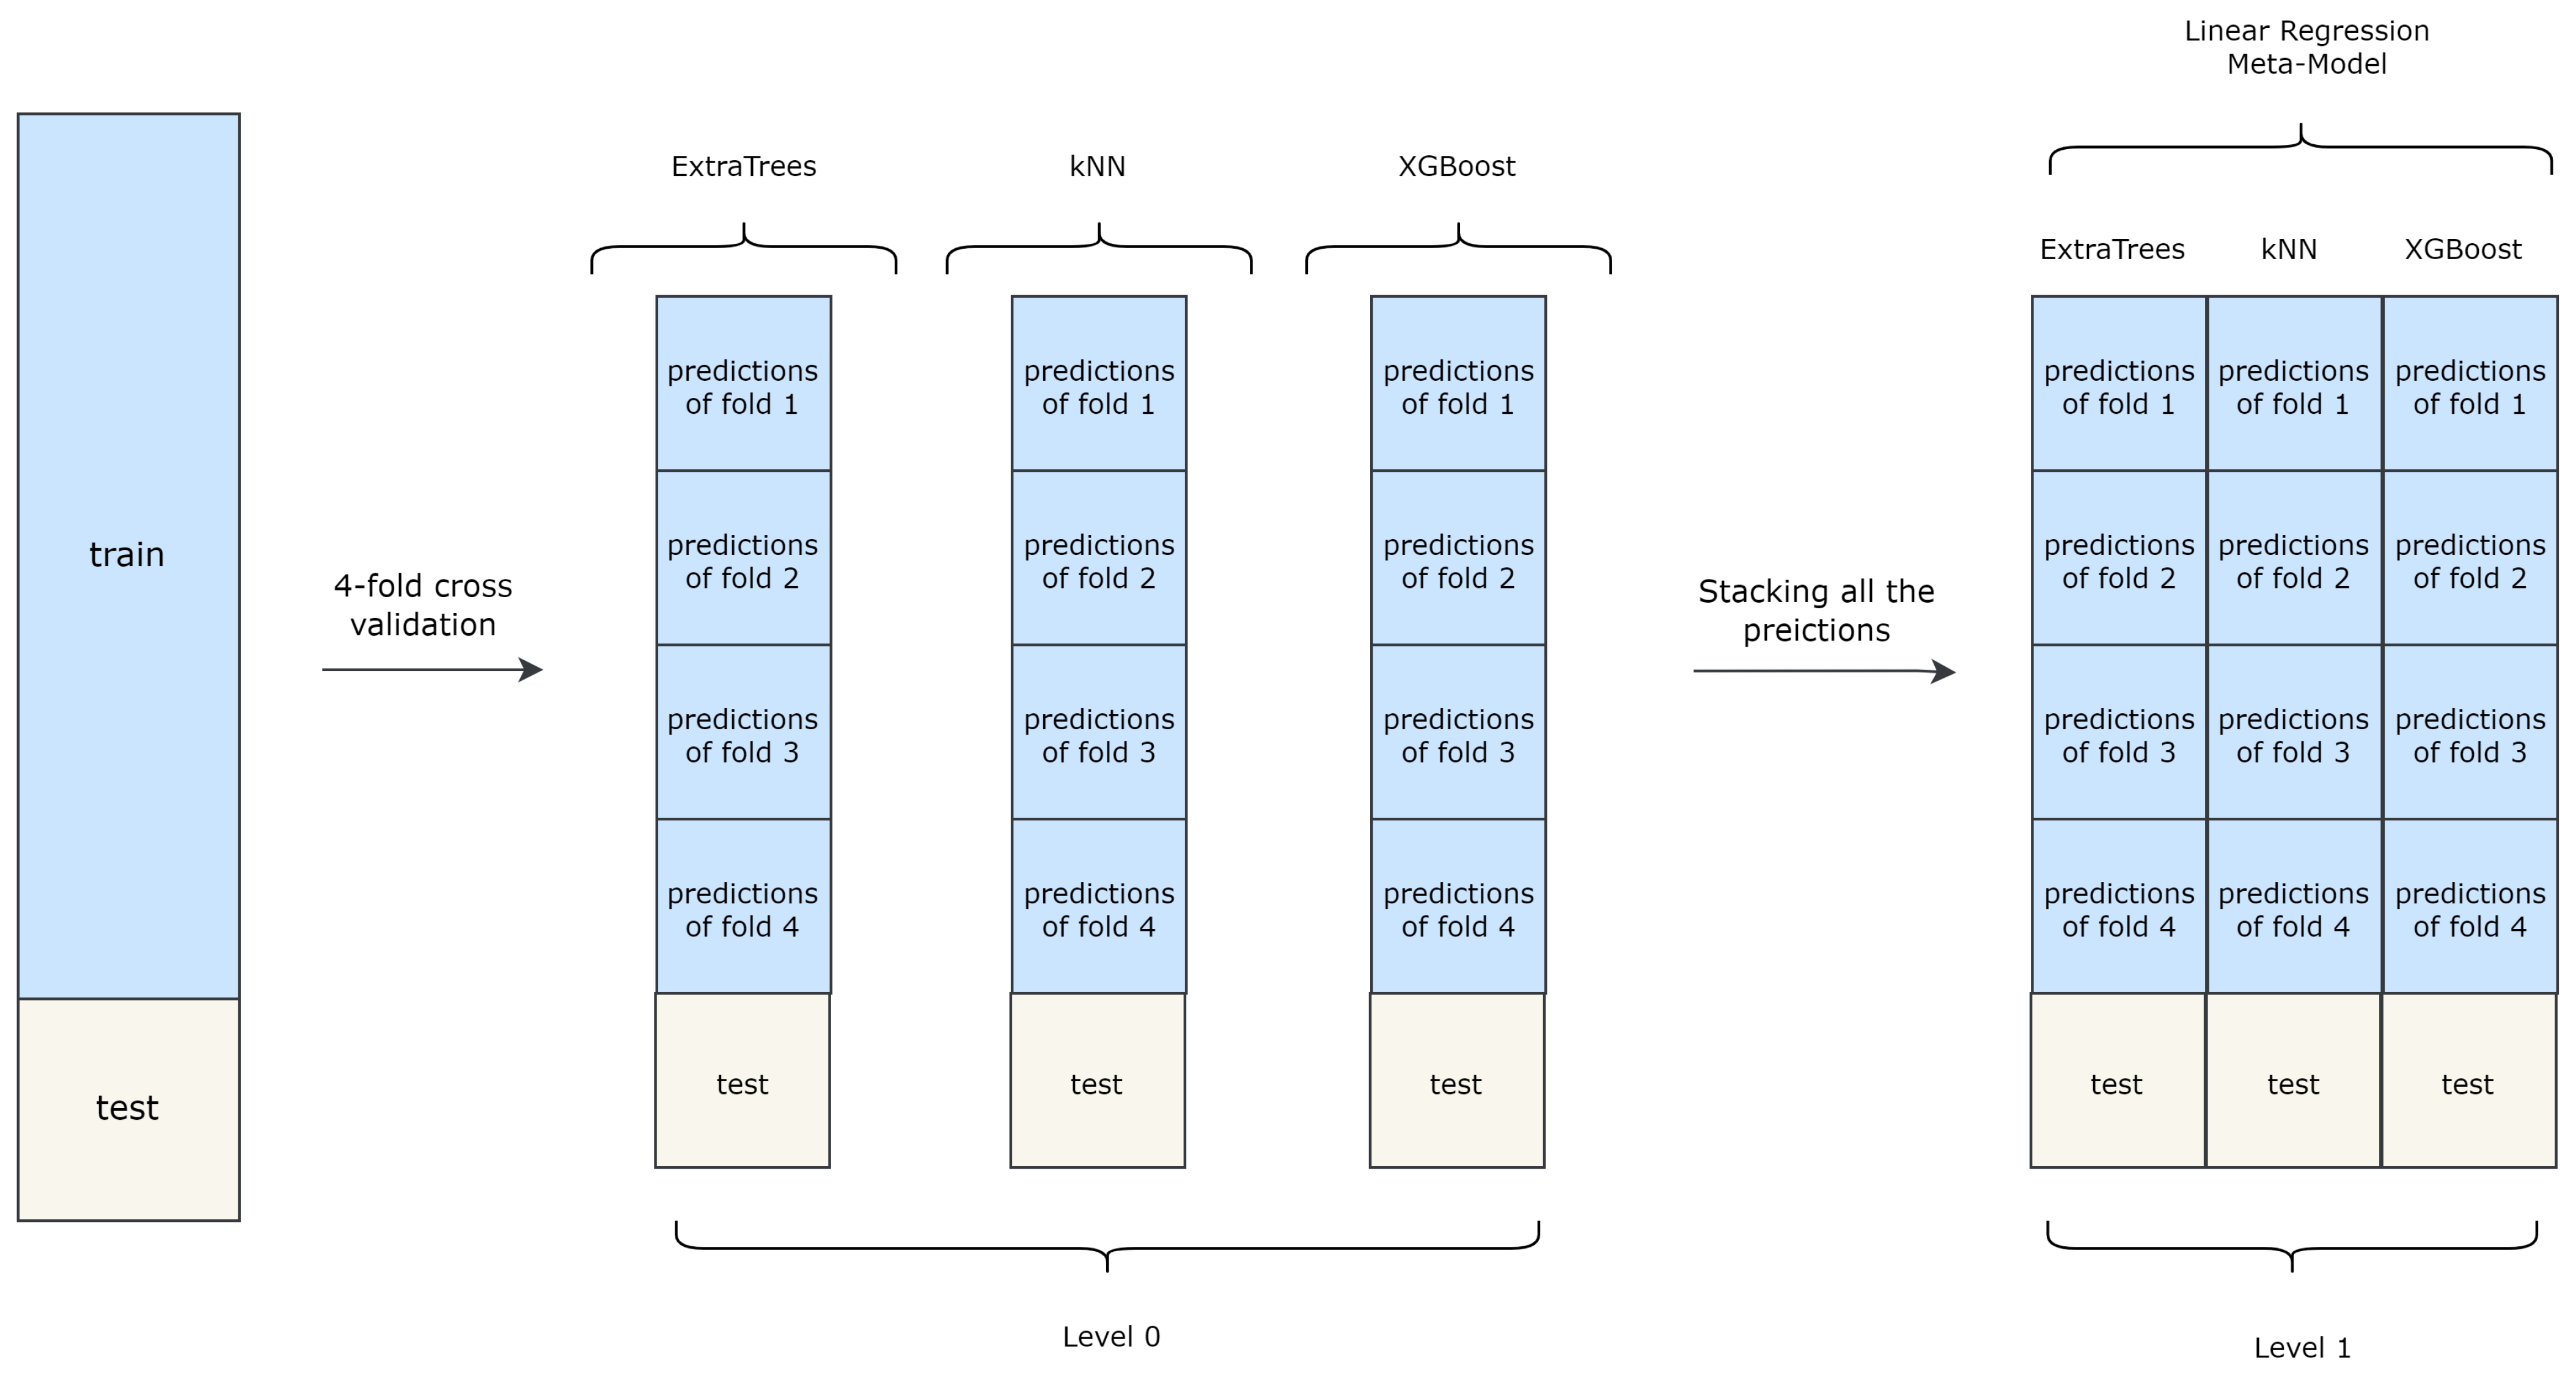
Stacked Generalization, an ensemble learning technique originally proposed by [30], involves creating a meta-model by combining the predictions of multiple-base ML models, also known as weak learners, using k-fold cross-validation. The meta-model is then trained with an additional ML model called the “final estimator”, which in this study is a simple linear regression model. The Stacked Generalization method consists of two stages of training, referred to as “level 0” and “level 1”. Figure 1 illustrates a Stacked Generalization architecture comprising three base models (weak learners) and a final estimator.
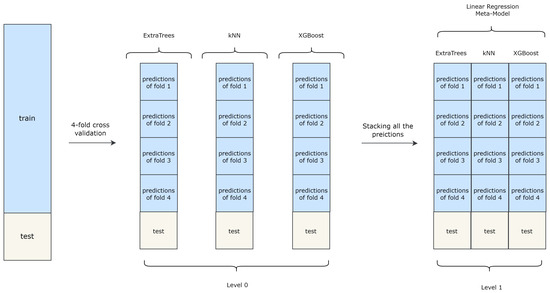
Figure 1.
Stacked regression model architecture containing three machine learning algorithms as base models and a final estimator.
In the initial stage (level 0), k-fold cross-validation is implemented for each weak learner to generate training data for the meta-model. The predictions of the weak learners are then aggregated to create the new training set for the meta-model. In the second stage (level 1), the meta-model is trained using the predetermined final estimator.
The key idea behind stacked generalization is to use the outputs of the initial weak learners as the inputs to train a higher-level learner. By leveraging the predictions of the weak learners, the meta-model can achieve better performance than any individual base model. While stacked generalization is a powerful technique for improving ML models’ accuracy, it has drawbacks. One of the main drawbacks of stacked generalization methods is their computation cost and slow processing time. The technique involves training multiple base models, which can be computationally expensive, and then using them to generate predictions for a meta-model, which increases the computational burden. Additionally, the need for k-fold cross-validation and multiple training stages can further slow down the process.
2.4. Stepwise Regression as a Feature Selection Method
Decreasing the number of tests needed to forecast furan levels will additionally lower the cost of testing the transformer. As a feature selection method, Stepwise Regression is a widely used statistical technique for selecting the most relevant features in a dataset by iteratively adding and removing them from a predictive model based on their statistical significance. The primary goal of this approach is to eliminate irrelevant and redundant features and identify the most significant ones for building an accurate predictive model. By applying feature selection, the dimensionality of the data is reduced, and the computation cost is minimized without compromising the model’s performance.
As described in [31] and detailed in [32], the stepwise regression approach involves analyzing the statistical significance of a set of candidate features with respect to the target variable. In this study, the stepwise regression technique is used to determine which of the nine oil test features are sufficient for predicting the HI value accurately while eliminating insignificant ones. The stepwise regression process develops a final multilinear regression model for predicting the target variable by adding or removing candidate features in a stepwise manner.
The process begins by including a single feature in the regression model and then adding additional features to assess the incremental performance of the model in predicting the target variable. In each step, the F-statistic of the added feature in the model is computed. The F-statistic measures the significance of the relationship between the added feature and the target variable. If the F-statistic is significant, the feature is retained, and the process continues by adding another feature to the model. Otherwise, the feature is removed, and the process continues with the remaining features until the optimal model is obtained. The F-statistic is found using Equation (1).
where the regression coefficient determines the association between a given feature and the outcome variable, and the F-statistic value is calculated for each feature when added to the regression model, accounting for the other existing features in the model. The regression sum of squares represents the difference between the model’s predicted output and the actual values of the dataset. The mean squared error measures the error of the model with all its current features.
During the stepwise feature selection process, a p-value is calculated for the F-statistic of each added feature and tested against the null hypothesis. If the p-value is below the pre-defined entrance threshold, the null hypothesis is rejected, indicating that the feature is statistically significant to the target variable and is added to the model.
Once the forward stepwise process is completed, the backward stepwise process begins. If a feature in the model has an F-statistic p-value above the exit threshold, the null hypothesis is accepted and removed from the final model.
2.5. Evaluation Metrics
After the training phase, the model’s performance is evaluated on the test set using commonly used metrics for evaluating regression models. The mean absolute error (MAE) measures the average absolute difference between the predicted and actual values. It is calculated by taking the sum of absolute differences between predicted and actual values and dividing it by the number of observations. The formula for the MAE is given in Equation (2).
where n is the number of observations, is the actual value for observation i, and is the predicted value for observation i.
The mean squared error (MSE) is a metric for evaluating the performance of regression models that measures the average squared difference between the predicted values and the actual values, as depicted in Equation (3).
where n is the number of observations, is the actual value for observation i, and is the predicted value for observation i.
3. Results and Discussion
As previously discussed, three different scenarios were followed to achieve the main objective of this paper and to ensure the generalizability of the model based on common features of Utility A and Utility B. The results of each scenario are discussed in the following subsections.
3.1. First Scenario: Round-Robin Cross-Validation on Utility A
In the first scenario, round-robin cross-validation was used by training on 75% of the data, and then it was tested on the remaining 25%. The reported MSE and MAE results in Table 2 are the average of four folds. As illustrated in Table 2, a marginal improvement is evident in the Stacked Regression model.
Table 2.
Evaluation metrics of each of the individual machine learning algorithms trained on all features for the first scenario.
By performing stepwise regression as a feature selection method and selecting only a subset of features, not only was the computation cost and training time reduced, but also, as shown in Table 3, there was a marginal improvement in the accuracy of the models, since the noises of the dataset were reduced. The corresponding indices of the features are represented in Table 1.
Table 3.
Evaluation metrics of each of the individual machine learning algorithms with selected features for the first scenario.
3.2. Second Scenario: Training on Utility A and Testing on Utility B
In this scenario, models that were trained on Utility A were tested on Utility B to assess their generalizability to unfamiliar data from a different geographical location. This method was chosen to avoid bias in the evaluation and ensure that the models perform well on unseen data. By testing the models on Utility B, insights can be gained into their robustness and potential limitations. The MSE and MAE of different ML algorithms for this scenario are reported in Table 4.
Table 4.
Evaluation metrics of each of the individual machine learning algorithms trained on all features for the second scenario.
By performing stepwise regression as a feature selection method, a subset of features was selected, and as shown in Table 5, there was a significant improvement in the accuracy of the models, since the noises of the dataset were reduced. The Extreme Gradient Boosting algorithm’s accuracy was slightly higher than the stacked regression model in this scenario. Similar to the first scenario, the stepwise regression improved the results of most of the cases.
Table 5.
Evaluation metrics of each of the individual machine learning algorithms with selected features for the second scenario.
3.3. Third Scenario: Round-Robin Cross-Validation on the Mixed Dataset
The data from Utility A and Utility B were joined together to make a new dataset. This new merged dataset was then used for round-robin cross-validation in the same way as in the first scenario. The MSE and MAE of different machine learning algorithms for this scenario are reported in Table 6. In the first scenario, round-robin cross-validation was used by training on 75% of the data, and then it was tested on the remaining 25%. The reported data in Table 6 are the average of four folds. As shown in Table 6, the stacked regression model outperformed the other ML models.
Table 6.
Evaluation metrics of each of the individual machine learning algorithms trained on all features for the third scenario.
When performing stepwise regression, a subset of features was chosen, and the models with the best combination of features that resulted in the highest accuracy are presented in Table 7. It is clear from Table 7 that the stepwise regression method, though it still reduced the dimensionality of the data and training time, was not as effective as it was in scenarios 1 and 2 in terms of accuracy.
Table 7.
Evaluation metrics of each of the individual machine learning algorithms with selected features for the third scenario.
It is worth mentioning that among all features, water content, acidity, and interfacial tension were the only features that were present in all reduced models. This is evident when calculating the feature importance using a stepwise regression algorithm as shown in Figure 2a,b for utility A and B, respectively. While in the Utility A data set acidity was the most important feature, water content was the most important feature for Utility B data set. On the other hand, dissolved analysis tests were not consistent in the reduced models. Nevertheless, at least two dissolved analysis gases were present in all models. Hence, while dissolved analysis gasses can be used to detect incipient faults, oil test results are better indicators of the overall aging state of the transformer insulation system.
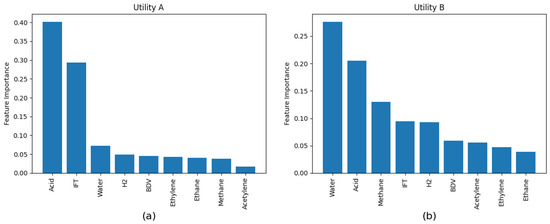
Figure 2.
Feature Importance of features based on stepwise regression for the (a) Utility A and (b) Utility B datasets.
4. Conclusions
Prediction of furan content provides a cost-effective approach for assessing the insulation condition of transformers. This study demonstrates that ML algorithms can effectively predict furan concentrations in transformer oil, which offers utilities a more economical approach to assess paper insulation conditions. To assess the reliability of the models, they were evaluated on two distinct datasets from different geographical regions under three different scenarios. No algorithm achieved the best performance across all metrics among individual ML models. However, using a stacked generalized ensemble model that combines multiple algorithms provided the most robust and consistent predictions. Applying stepwise regression for feature selection improved the accuracy in most of the models by reducing noise and dimensionality. Key inputs that emerged and proved to be strong predictors were acidity, interfacial tension, and water content, which were present in all reduced models. While dissolved gases were inconsistent, at least two of them were always present in the reduced models. The achieved promising accuracy supports machine learning’s viability for inexpensive furan concentration prediction. This data-driven method is especially valuable where testing facilities are limited. Further operational validation could expand machine learning’s role in transformer asset management by deploying these models.
Author Contributions
Conceptualization, A.E.-H.; methodology, M.A.F. and A.S.; software, M.A.F.; validation, A.S.; formal analysis, A.S.; investigation, M.A.F. and A.S.; resources, A.S.; data curation, M.A.F. and A.S.; writing—original draft preparation, M.A.F. and A.S.; writing—review and editing, A.E.-H.; visualization, M.A.F.; supervision, A.E.-H.; project administration, A.E.-H. All authors have read and agreed to the published version of the manuscript.
Funding
This research received no external funding.
Data Availability Statement
Data are contained within the article.
Conflicts of Interest
The authors declare no conflict of interest.
References
- Abu Bakar, N.; Abu-Siada, A. A Novel Method of Measuring Transformer Oil Interfacial Tension Using UV-Vis Spectroscopy. IEEE Electr. Insul. Mag. 2016, 32, 7–13. [Google Scholar] [CrossRef]
- Ivanov, G.; Spasova, A.; Mateev, V.; Marinova, I. Applied Complex Diagnostics and Monitoring of Special Power Transformers. Energies 2023, 16, 2142. [Google Scholar] [CrossRef]
- Alvarez, L.I.; Lozano, C.; Bravo, D. Machine learning for predictive maintenance scheduling of distribution transformers. J. Qual. Maint. Eng. 2022, 29, 188–202. [Google Scholar] [CrossRef]
- Youssef, M.; Ibrahim, R.; Desouki, H.; Moustafa, M. An Overview on Condition Monitoring & Health Assessment Techniques for Distribution Transformers. In Proceedings of the 2022 6th International Conference on Green Energy and Applications (ICGEA), Singapore, 4–6 March 2022; pp. 187–192. [Google Scholar] [CrossRef]
- Guo, H.; Guo, L. Health index for power transformer condition assessment based on operation history and test data. Energy Rep. 2022, 8, 9038–9045. [Google Scholar] [CrossRef]
- Padmanaban, S.; Khalili, M.; Nasab, M.A.; Zand, M.; Shamim, A.G.; Khan, B. Determination of power transformers health index using parameters affecting the transformer’s life. IETE J. Res. 2022. [Google Scholar] [CrossRef]
- Dong, M.; Zhang, G.; Yan, Z. Synthetic furfural analysis for transformer ageing. In Proceedings of the 17th Annual Meeting of the IEEE Lasers and Electro-Optics Society, LEOS 2004, Boulder, CO, USA, 20 October 2004; pp. 245–248. [Google Scholar] [CrossRef]
- Talib, M.; Aziz, M.; Balasubramaniam, Y.; Ghazali, Y.; Abidin, M.; Yousof, F. Transformer Ageing Investigation and Correlation of Furanic Compound and Degree of Polymerization for Power Transformer Life Assessment. In Proceedings of the 2020 IEEE International Conference on Power and Energy (PECon), Penang, Malaysia, 7–8 December 2020; pp. 240–244. [Google Scholar] [CrossRef]
- Meissner, M.; Darmann, M.; Schober, S.; Mittelbach, M.; Sumereder, C. Reliability Study of Furan Level Analysis for Transformer Health Prediction. In Proceedings of the 2019 IEEE 20th International Conference on Dielectric Liquids (ICDL), Roma, Italy, 23–27 June 2019; pp. 1–4. [Google Scholar] [CrossRef]
- El-Aal, R.; Helal, K.; Hassan, A.; Dessouky, S. Prediction of Transformers Conditions and Lifetime Using Furan Compounds Analysis. IEEE Access 2019, 7, 102264–102273. [Google Scholar] [CrossRef]
- Soni, R.; Chakrabarti, P.; Leonowicz, Z.; Jasiński, M.; Wieczorek, K.; Bolshev, V. Estimation of Life Cycle of Distribution Transformer in Context to Furan Content Formation, Pollution Index and Dielectric Strength. IEEE Access 2021, 9, 37456–37465. [Google Scholar] [CrossRef]
- Anghel, I.; Gatman, E. Transformer lifetime management by analyzing the content of furan and gas dissolved in oil. E3S Web Conf. 2019, 112, 04004. [Google Scholar] [CrossRef]
- Electricity, D.; Authority, W. Services Guide, 5th ed.; Naval Institute Press: Annapolis, MD, USA, 2016. [Google Scholar]
- Jahromi, A.; Piercy, R.; Cress, S.; Service, J.; Fan, W. An approach to power transformer asset management using health index. Electr. Insul. Mag. 2009, 25, 20–34. [Google Scholar] [CrossRef]
- Rediansyah, D.; Prasojo, R.; Harjo, S. Study on Artificial Intelligence Approaches for Power Transformer Health Index Assessment. In Proceedings of the 2021 International Conference on Electrical Engineering and Informatics (ICEEI), Kuala Terengganu, Malaysia, 12–13 October 2021; pp. 1–4. [Google Scholar] [CrossRef]
- Islam, M.M.; Lee, G.; Hettiwatte, S. Application of a general regression neural network for health index calculation of power transformers. Int. J. Electr. Power Energy Syst. 2017, 93, 308–315. [Google Scholar] [CrossRef]
- Alqudsi, A.; El-Hag, A. Application of Machine Learning in Transformer Health Index Prediction. Energies 2019, 12, 2694. [Google Scholar] [CrossRef]
- Javid, J.; Mughal, M.; Karim, M. Using kNN Algorithm for classification of Distribution transformers Health index. In Proceedings of the 2021 International Conference on Innovative Computing (ICIC), Lahore, Pakistan, 9–10 November 2021; pp. 1–6. [Google Scholar] [CrossRef]
- Ghunem, R.; El-Hag, A.; Assaleh, K. Prediction of furan content in transformer oil using artificial neural networks (ANN). In Proceedings of the 2010 IEEE International Symposium on Electrical Insulation, San Diego, CA, USA, 6–9 June 2010; pp. 1–4. [Google Scholar] [CrossRef]
- Ghunem, R.; Assaleh, K.; El-Hag, A. Artificial Neural Networks with Stepwise Regression for Predicting Transformer Oil Furan Content. IEEE Trans. Dielectr. Electr. Insul. 2012, 19, 414–420. [Google Scholar] [CrossRef]
- Mahdjoubi, A.; Zegnini, B.; Belkheiri, M. A new approach using Least Squares Support Vector Machines (LS-SVM) to predict Furan in power transformers. Przeglad Elektrotechniczny 2014, 90, 142. [Google Scholar] [CrossRef]
- Ghoneim, S. The Degree of Polymerization in a Prediction Model of Insulating Paper and the Remaining Life of Power Transformers. Energies 2021, 14, 670. [Google Scholar] [CrossRef]
- Abu-Siada, A.; Lai, S.; Islam, S. A Novel Fuzzy-Logic Approach for Furan Estimation in Transformer Oil. IEEE Trans. Power Deliv. 2012, 27, 469–474. [Google Scholar] [CrossRef]
- Senoussaoui, M.; Brahami, M.; Fofana, I. Transformer Oil Quality Assessment Using Random Forest with Feature Engineering. Energies 2021, 14, 1809. [Google Scholar] [CrossRef]
- Rokach, L.; Maimon, O. Data Mining with Decision Trees: Theory and Applications; World Scientific Publishing Co Pte Ltd.: Singapore, 2008; Volume 69. [Google Scholar] [CrossRef]
- Geurts, P.; Ernst, D.; Wehenkel, L. Extremely Randomized Trees. Mach. Learn. 2006, 63, 3–42. [Google Scholar] [CrossRef]
- Witten, I.H.; Frank, E. Data Mining: Practical Machine Learning Tools and Techniques. Biomed. Eng. Online 2006, 5, 1–2. [Google Scholar]
- Chen, T.; Guestrin, C. XGBoost: A Scalable Tree Boosting System. In Proceedings of the 22nd ACM SIGKDD International Conference on Knowledge Discovery and Data Mining, San Francisco, CA, USA, 13–17 August 2016; ACM: New York, NY, USA, 2016; pp. 785–794. [Google Scholar] [CrossRef]
- Polikar, R. Ensemble learning (Revision #186077). Scholarpedia 2009, 4, 2776. [Google Scholar] [CrossRef]
- Wolpert, D.H. Stacked generalization. Neural Netw. 1992, 5, 241–259. [Google Scholar] [CrossRef]
- Alqudsi, A.; El-Hag, A. Assessing the power transformer insulation health condition using a feature-reduced predictor mode. IEEE Trans. Dielectr. Electr. Insul. 2018, 25, 853–862. [Google Scholar] [CrossRef]
- Montgomery, D.C.; Runger, G.C. Applied Statistics and Probability for Engineers; John Wiley & Sons: Hoboken, NJ, USA, 2010. [Google Scholar]

Disclaimer/Publisher’s Note: The statements, opinions and data contained in all publications are solely those of the individual author(s) and contributor(s) and not of MDPI and/or the editor(s). MDPI and/or the editor(s) disclaim responsibility for any injury to people or property resulting from any ideas, methods, instructions or products referred to in the content. |
© 2023 by the authors. Licensee MDPI, Basel, Switzerland. This article is an open access article distributed under the terms and conditions of the Creative Commons Attribution (CC BY) license (https://creativecommons.org/licenses/by/4.0/).