Abstract
A three-dimensional computational fluid dynamics (CFD) method coupled with multi-physics phenomena is developed and applied for a 10-cell full-scale SOEC stack in this study. Effects of gas flow patterns, operating temperature, and manifold configurations are simulated and analyzed for stack performance and thermal stress. It is demonstrated the hydrogen production and thermal stress obtained in cross-flow mode stack are about 8% and 36 MPa higher compared to that in other flow cases. Furthermore, it is found the temperature gradient is the predominant factor affecting the thermal stress distribution and failure probability. Lastly, a stack arrangement with 2-inlet and 1-outlet is proposed and analyzed to enhance gas distribution uniformity within the cell channels. The findings of this study hold significance as a reference for investigating the impact on the SOEC stack performance and thermal stress distribution.
1. Introduction
As excellent hydrogen production and energy storage technology, solid oxide electrolysis cell (SOEC) operating at high temperature (500–1000 °C) is capable of converting H2O into H2 and O2. Due to its elevated operating temperature, SOEC offers faster reaction kinetics compared to low-temperature electrolysis cells, such as proton exchange membrane electrolysis cell (PEMEC) and alkaline electrolysis cell (AEC) [1,2], which may result in higher H2 production efficiency. Furthermore, SOEC allows for modular operation, enabling controlled hydrogen production scaling. While individual SOEC unit cells have limited hydrogen production output, assembling multiple cells into a stack significantly enhances hydrogen production within a given time frame. However, at present, SOEC stack is prone to internal damage due to, e.g., cracking, crack propagation, and delamination during operation. These issues lead to a degradation in gas-tightness and overall performance of the stack, as well as a relatively short operational lifespan, which significantly impedes the commercialization process.
It is indicated non-uniform thermal stress distributed within SOEC stack is the primary cause of irreversible structural damage and performance degradation [3]. The high operating temperature and its gradient, as well as mismatched thermal expansion coefficients between involved materials, generate substantial thermal stress within the stack. Therefore, predicting thermal stress distribution in SOEC stack holds crucial implications for identifying failure mechanisms, optimizing stack structures, and extending operational lifespans [3,4]. Modeling and numerical simulations have been identified as essential tools for investigating the SOEC performance and thermal stress [5,6].
A numerical simulation of an electrolyte-supported SOEC was introduced by Nerat et al. [7]. By modifying the geometric shape of the SOEC and modeling the anode layer, an analysis was conducted on impact of the anode layer on the electrochemical performance of the SOEC. However, only the PEN was modeled in this study, i.e., other components such as flow channels and ribs were not taken into consideration. A three-dimensional (3-D in short hereafter) multi-physics field model was established by Navasa et al. [8] to conduct an in-depth investigation of the degradation phenomena in electrodes/electrolyte. However, the influence of thermal stress on the stack performance was not taken into consideration. A 3-D model was established by Du et al. [9] to investigate the impact of operating pressure on the co-electrolysis of water and carbon dioxide in SOEC, in which the reversible water-gas shift reaction and the direct internal reforming reaction were considered. The approach of homogeneous modeling was employed by Navasa et al. [10] aiming to reduce computational costs. However, due to the lack of consideration of the stack geometry details, the investigation of the impact of manifold arrangement and channel shape on the performance of the cell stack could not be pursued. A dynamic SOC stack model was developed by Wang et al. [11,12] to explore the impact of different design and operating parameters on the stack performance. It is a fact that most of the above-mentioned studies are based on simplified geometric models, which lack the detailed structure information on the various components, such as seals, ribs and manifolds. Experiments and simulations were combined by Bernadet et al. [13,14,15,16] to study the fundamental mechanisms affecting the performance of pressurized SOEC cells. However, the simulation was primarily focused on the influence of the operating pressure, with insufficient consideration given to the comprehensive impact of other operational parameters.
A 3-D CFD model was developed by Xu et al. [17] to investigate the operational characteristics of a 10-cell SOEC stack. The predicted flow, pressure, and temperature fields were analyzed under different mass flow rates and for individual cells located within the SOEC stack, where a parameterized analysis was conducted at the level of SOEC stack based on a full-scale modeling approach. However, the authors omitted analysis of the thermal stress distribution and failure probability. The thermal stress of the SOEC stack was modeled and examined by Cui et al. [18] through a 3-D planar SOEC unit cell model, in which a multi-physics field coupled with the thermal stress analysis method was applied. The impact of the operating voltage, H2O flow direction, and molar fraction, as well as operating pressure, was evaluated for the thermal stress. However, the differences in the thermal stress between different layers of the unit cells were not elucidated.
In conclusion, nowadays scholars have done a lot of simulation work on SOEC. At the level of single channel and single cell, the variation law of stack performance is deeply analyzed by exploring different operating parameters and structural design, which provides guiding suggestions for practical application of SOEC. However, there are relatively few studies of SOEC thermal stress in today’s studies, and most of them are based on simplified geometric models, lacking corresponding components such as seals, ribs and manifold, and there has been comparatively less research dedicated to full-scale SOEC stack, which results in a fact that the factors influencing stack performance and behavioral disparities between unit cells remain unclear.
To address the aforementioned issues, an effective full-scale multi-physics coupled CFD model of a SOEC stack is developed and applied in this study. It should be mentioned the developed model is solved by finite element method for coupled governing equations of mass, momentum, charge, heat transfer, and thermal stress, alongside with the electrochemical reactions occurring within each individual unit cells. The computational domain encompasses all components appearing in the typical SOEC stack structure, including the PEN (cathode, electrolyte layer, and anode), inlet/outlet manifolds, sealings, frames, and inter-connectors. The predicted parameters of the established model are compared with experimental data, aiming for confirming modeling accuracy and reliability. By means of the simulated results, a comparative analysis of the flow, temperature, and thermal stress distributions was performed for different flow configurations, while failure probabilities of the PEN components are also evaluated. Additionally, the influence of the operating temperature on the electrochemical reactions is explored, followed by the primary factors affecting the thermal stress being also identified. Multiple manifold options are proposed, with the objective to enhance the gas flow uniformity within the unit cells and to improve the electrolysis efficiency of the stack. The results and findings may be considered as a reference for future investigations of SOEC performance and the thermal stress distribution.
2. Model Development
This section outlines the multi-physics CFD coupled model of the full-scale SOEC stack under steady-state conditions. The developed model encompasses the geometric arrangement, the governing equations, and the boundary conditions, as well as model validation. The following assumptions are applied:
- (1)
- All gases are ideal and incompressible, while the flow is laminar.
- (2)
- Thermal radiation inside the SOEC is negligible.
- (3)
- External environmental temperature remains stable at 800 °C.
- (4)
- The materials employed for the cathode, electrolyte layer and anode are isotropic and homogeneous, as well as linear and elastic following the isotropic Hooke’s law.
- (5)
- Certain physical parameters of the cathode, electrolyte layer, and anode materials (e.g., coefficient of thermal expansion, elastic modulus, and Poisson’s ratio) evaluated at 800 °C are unaffected by the local temperature.
- (6)
- The interface between the anodes/electrolyte layers/cathodes, as well as between the inter-connectors/sealing materials is treated as continuous, which can be freely deformed as a whole without any fractures.
2.1. Full-Scale Stack Geometric Parameters and Modeling Methods
A 10-layer full-scale planar-structured SOEC stack is addressed in the current research, as illustrated in Figure 1. The gas enters and exits from the stack through the gas inlet/outlet manifolds, with the reacting gas isolated from air by the sealing materials. Each cell comprises the metallic inter-connectors, a cathode, an electrolyte layer, an anode, and the sealing components. Due to the physical and structural symmetry, as well as for saving computational time, only half of the stack is considered with the symmetry plane defined at the center along the x-z direction, as shown in Figure 1. It should be pointed out the effective area of the unit cell is 89 mm × 89 mm, while other geometry parameters of the stack are presented in Table 1.
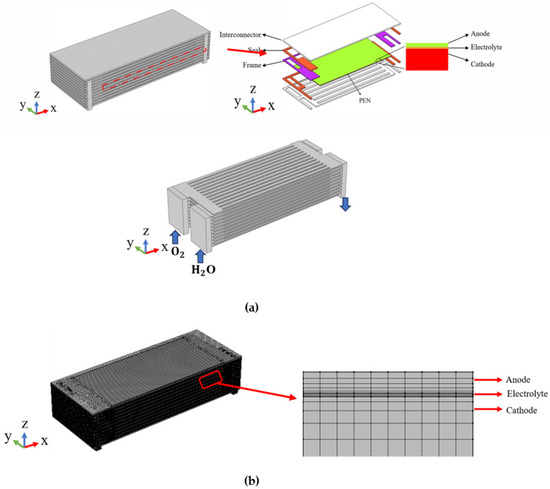
Figure 1.
(a) Geometry and (b) grid arrangement of modeled SOEC stack.

Table 1.
Modeled stack geometric parameters.
2.2. Governing Equations
2.2.1. Electrochemical Reactions
The operating voltage (V) of the SOEC stack is the sum of reversible voltage (Vrev), activation polarization (ηact,a and ηact,c), concentration polarization (ηact,a and ηact,c), and ohmic polarization (ηohm), as shown below:
where “a” and “c” represent the anode and cathode, respectively.
The reversible voltage of the SOEC can be calculated using the Nernst equation [19]:
where ΔG represents the Gibbs free energy; F is the Faraday’s constant (9.6485 × C/mol); R represents the ideal gas constant (8.3145 J/mol∙K); T represents the temperature (K); PH2, PH2O, and PO2 are the partial pressures of H2, H2O and O2 at the interface between the electrode and electrolyte layer, respectively.
The activation polarization is typically calculated using the Butler-Volmer (B-V) equation. For the cathode, the B-V equation for the electrochemical reduction of H2O can be expressed as [20]:
while for the anode, the B-V equation can be expressed as [20]:
in which j represents the current density, the exchange current density, β the asymmetry charge transfer coefficient. The exchange current density (j0,H2 and j0,O2) can be expressed as [21,22]:
in which γ represents the pre-exponential factor, Eact the activation energy, Pstd the reference pressure. Table 2 summarizes the values used in the current modeling [22].
Table 2.
Electrochemical reaction parameters.
While the ohmic polarization can be expressed as:
here Re represents the electrical resistance of the SOEC.
2.2.2. Gas Flow and Momentum Equations
The continuity equation is applied for conservation of the mass flowing in various regions of the stack as presented below. In the gas flow channels, based on the fact of the laminar flow assumed, the continuity equation is presented as [18]:
where ρ is the density of the mixed gases, and v represents the velocity vector. The variable Smass represents the mass source term as discussed below.
The commonly used Navier-Stokes equation is modified by adding a Darcy factor that takes into account the porosity of the electrodes to represent the conservation of the momentum in the porous electrodes:
among them, k represents the permeability, μ represents the dynamic viscosity of the mixed gases, I represents the identify matrix, while ε represents the electrode porosity.
Due to the multi-component mixed gases transported in the gas flow channels and the porous electrodes, the density and dynamic viscosity of the mixed gases can be obtained by the following:
where xi represents the mole fraction of the gas component i, and Mi is the molar mass of the substance.
2.2.3. Gas Species Transport Equation
The electrochemical reactions inside SOEC stack occur at triple-phase boundary (TPB) along with the porous electrode/dense electrolyte layer interface. To reach the TPB region, the gas must diffuse through the porous electrodes, in which the Knudsen diffusion plays a dominant role. The conservation equation of each gas species can be defined as [23]:
where is the effective diffusion coefficient of the gas species i, which is calculated from the Fick diffusion coefficient (Dm) and the Knudsen diffusion coefficient (Dk) [23], as shown below:
is the tortuosity factor.
2.2.4. Heat Transfer Equation
In SOEC stack, the heat conduction occurs in the materials connecting the solid materials and the electrolyte layer, while the convective heat transfer for the flowing gases in the flow channels and intake manifolds, while the combined heat transfer for the porous electrodes, which are further coupled with the electrochemical reactions modeled by kinetic reaction rates. The heat source in the operating SOEC stack is composed of the electrochemical reactions related exotherm and the ohmic loss related exotherm. The general energy conservation equation is as follows [24]:
in which, Cp represents the specific heat capacity of the mixed gases, λeff the effective thermal conductivity, and Q is the heat source term inside the SOEC stack. The effective thermal conductivity of the porous electrodes is calculated from the thermal conductivity of the solids and the gases corrected by the porosity [24]:
where λs and λg represent the thermal conductivity of the solid and gas mixture in the porous electrode, respectively. The parameters used in the above-mentioned governing equations are shown in Table 3.
Table 3.
Physical parameters of SOEC stack components [25].
2.2.5. Thermal Stress-Strain Relation and Failure Probability Analysis Equations
As assumed, all solid materials are linearly elastic, so the thermal stress-induced deformation is thought to be minimal. The stress might be stated as follows [24]:
where σ is the stress tensor, C is the elastic matrix, εel is the elastic strain, while σ0 is the initial stress.
The total strain ε in this study consists of two parts:
where εth is the thermal strain, εel is the elastic strain. The elastic strain can be obtained from the following:
while the thermal strain is calculated from the following:
where α is CTE, Tref represents the reference temperature of the zero thermal stress adopted.
The elastic matrix of an isotropic material is generally defined as [24]:
where E is the elastic modulus, and v is the Poisson ratio.
The thermal strain would induce the thermal stresses and possible microscopic structural cracks on brittle ceramic materials, which may break down the SOEC stack. To describe the corresponding possible failures, the Weibull approach (i.e., a failure analysis method based on the weakest link theory) is adopted and implemented to evaluate the failure probability of the brittle SOEC stack components in the present work. In this method, the failure probability of the brittle materials subjected to the multi-axial stress is calculated as follows [26]:
where V is the volume, are the principal stresses, and the Weibull strength of the brittle material, m is the Weibull modulus, while V0 is the reference volume obtained by the following formula:
in which σmax is the maximum principal stress of the brittle materials.
Table 4.
Weibull parameters of SOEC materials.
2.3. Boundary Conditions
In this study, the employed materials of various components in the SOEC stack are as follows: the cathode is made of Ni/YSZ cermet material, the electrolyte layer is composed of YSZ, the anode is made of LSM material, the inter-connector is constructed from stainless steel, while the sealing is Flexitallic 866, a flexible material.
The inlet reactant gas consists of 90% water vapor and 10% hydrogen gas. It is so because 100% water vapor is not applied as the presence of hydrogen is necessary to maintain a mildly reducing atmosphere at the electrodes during the electrolysis process. According to the geometric dimensions of the stack, the inlet flow rate of the cathodic reactant gas is 1.37 m/s, while the air inlet flow rate is 2.72 m/s. The SOEC stack operates at 800 °C, with an inlet gas temperature of 800 °C as well.
Considering practical operational conditions, the thermally insulated surfaces are assumed at the top and bottom ends of the stack, while the remaining surfaces experience the natural convection and radiative heat transfer with the environment. The convective heat transfer coefficient and surface emissivity are set to 2 W∙m−2∙K−1 [24] and 0.3 [29], respectively.
A crucial parameter in computing thermal stress is the free-stress temperature, denoted as Tfree. Recent studies suggest reducing NiO to Ni in a reducing atmosphere at 800 °C releases all stresses. Therefore, Tf = 800 °C is applied [30]. The detailed data is presented in Table 5.
Table 5.
The boundary conditions of the SOEC model.
2.4. Model Validation
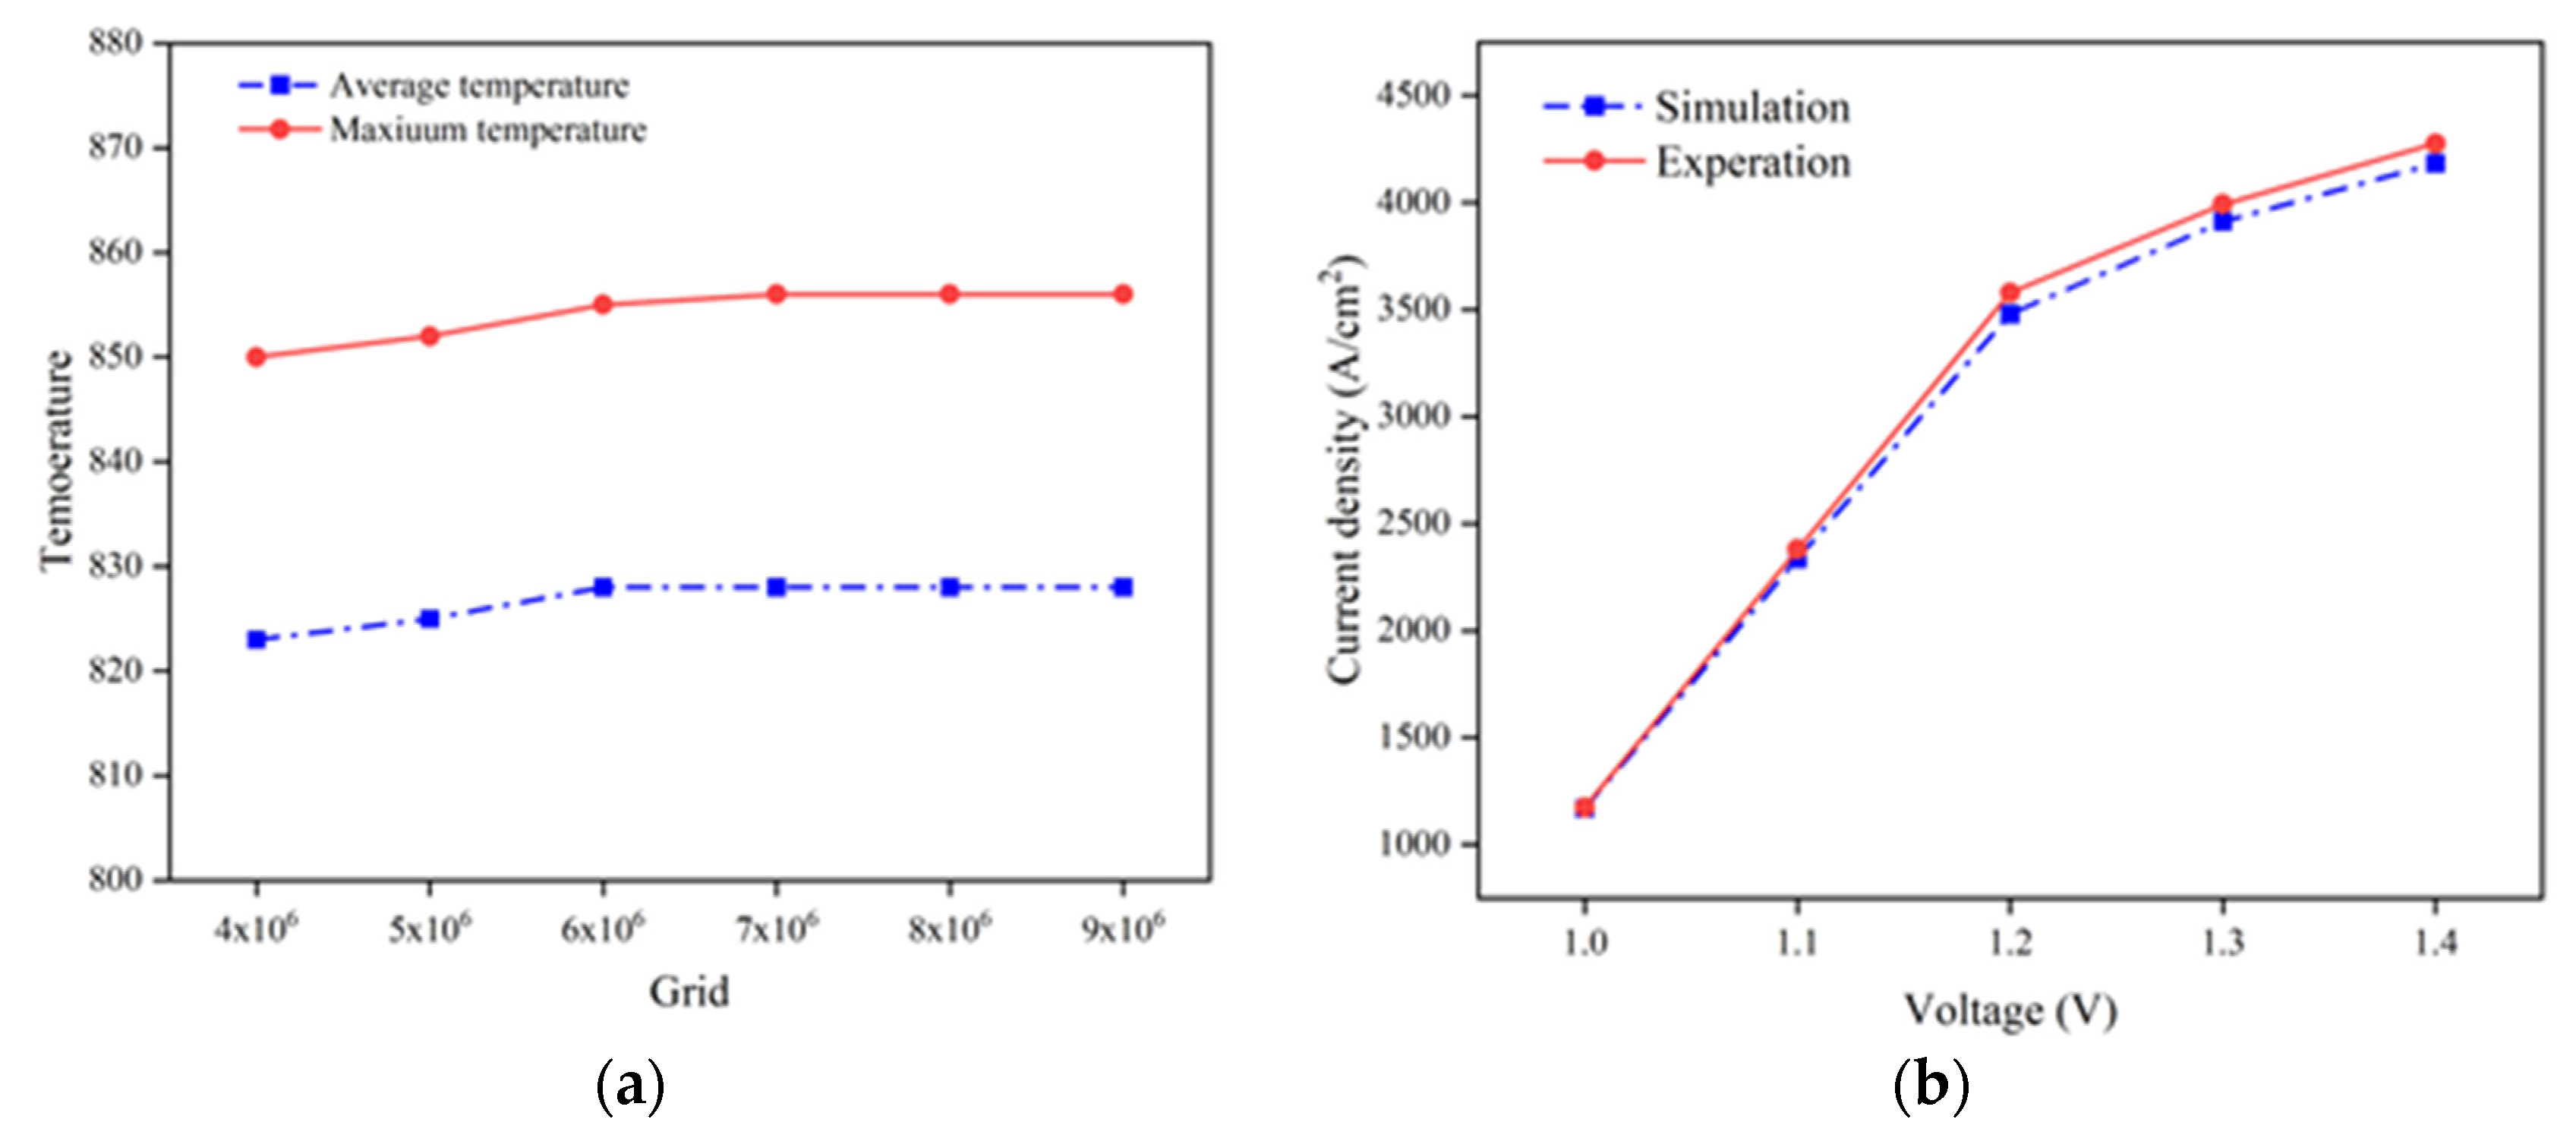
By using the highest and averaged stack temperature as the validation indicators, it is revealed that, when the total mesh number reaches 6.01 × 10⁶, the deviation of the predicted SOEC temperature is less than 1%, as presented in Figure 2a. This demonstrates the obtained simulation results become independent of the chosen mesh number and arrangement once this mesh number is applied.
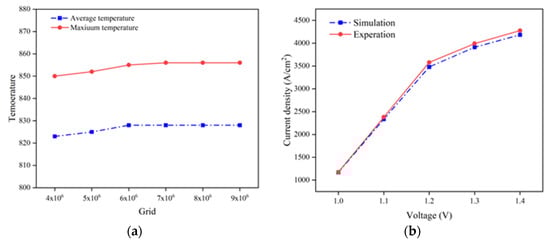
Figure 2.
(a) Grid independence testing performance in predicted temperature; (b) predicted V-J curve compared with the experimental one.
The developed SOEC CFD model is implemented in COMSOL Multi-physics 6.0 simulation software, while the prediction of the various parameters is compared with that by experimental measurement [17]. Due to the lack of detailed experimental data for SOEC stack in the existing research, the validation of the stack in the current study is primarily carried out by confirming the accuracy of the model through V-J curve measured on individual cells. It is found the computed V-J curve agrees well with the literature data, yielding a root mean square error of less than 5%, as shown in Figure 2b.
3. Results and Discussion
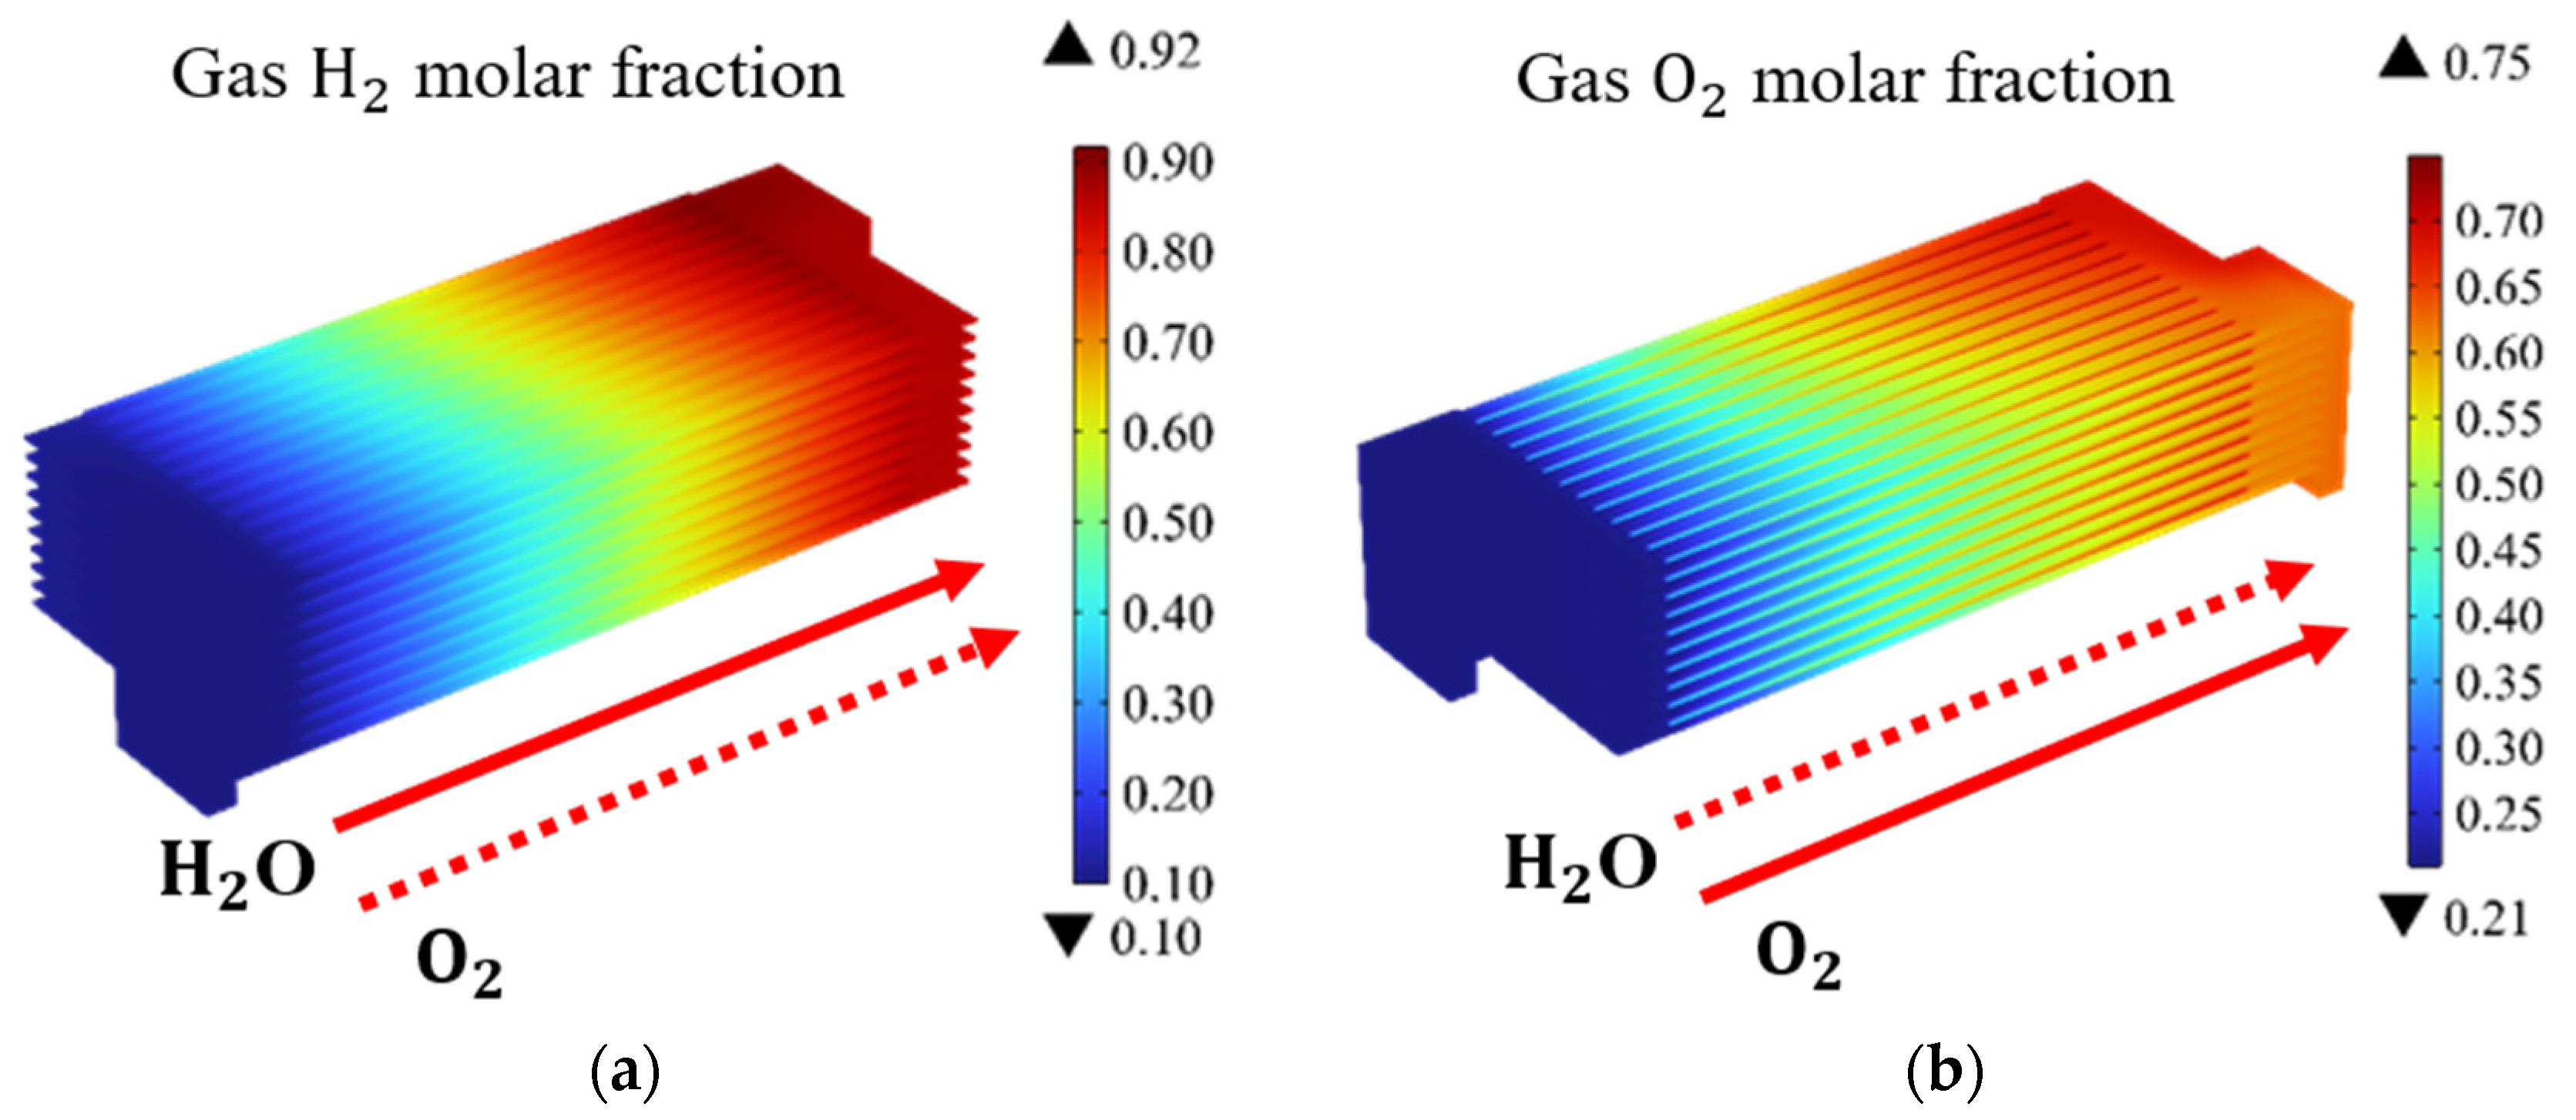
Based on the above data and boundary conditions, the gas, temperature, and thermal stress distributions of the SOEC stack are predicted and presented. Figure 3 illustrates the distribution of H2 and O2 molar fractions in the SOEC stack under co-flow configurations (at the operating voltage of 14 V). It is evident that the molar fractions of H2 and O2 exhibit a gradual increase along the main flow direction. Additionally, the electrochemical reactions in the upstream region, where the fresh reactants are introduced, are observed to proceed relatively slow, while intense electrochemical reactions occur within the mid-section of the channel along the flow direction. Notably, the maximum molar fractions of H2 and O2 are located at the outlet region of the channels. It is noteworthy that, due to the molar fraction of H2 being only 10% for the entrance region, a higher molar fraction of H2 at the outlet region signifies a greater amount of hydrogen produced through chemical reactions. Therefore, in this study, the average molar fraction of H2 at the outlet region is utilized as the metric for the hydrogen production performance.

Figure 3.
Molar fraction distribution of: (a) H2; and (b) O2; in SOEC stack under co-flow configurations (operating voltage: 14 V).
The thermal balance within the SOEC stack primarily consist of three aspects relating to the electrochemical reactions, the activation energy, and the ohmic heating due to electrons flowing across different components. Moreover, the SOEC stack may be operated at a thermoneutral condition. For a 10-cell stack, this thermoneutral voltage is 12.867 V. At this voltage, the heat absorption and heat release within the stack are equal. When the operating voltage exceeds 12.867 V, the heat released surpasses the heat absorbed, which is considered as an exothermic mode. Conversely, when the heat absorbed exceeds the heat released, it is considered as an endothermic mode. Therefore, for the case of the operating voltage being 14 V, the overall electrolyte temperature is maintained above 800 °C.
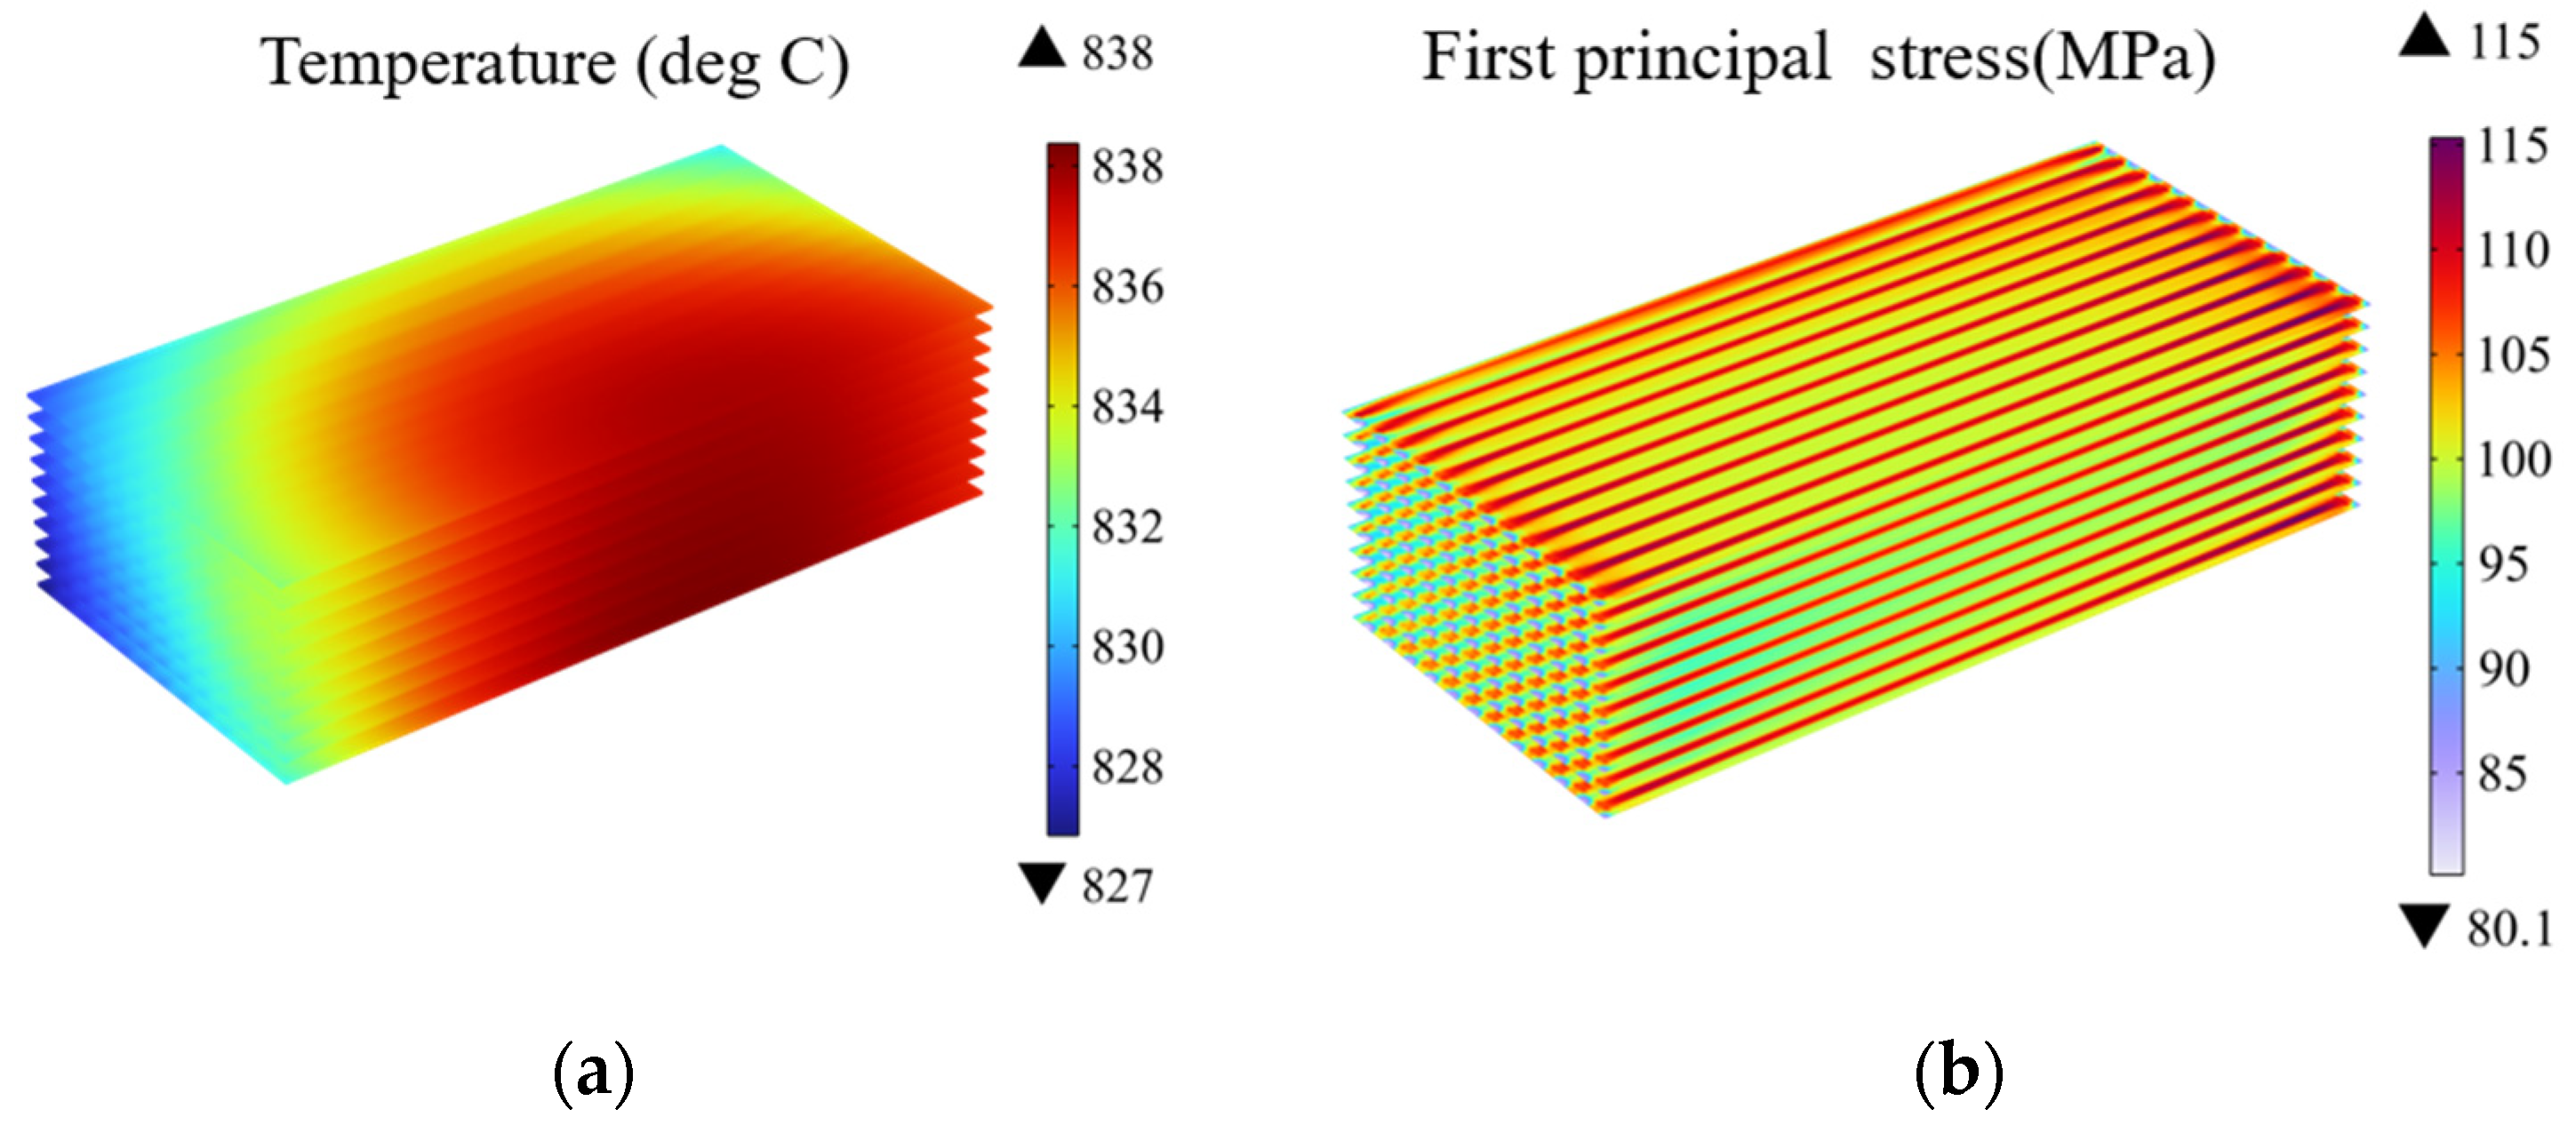
Figure 4 presents the predicted temperature and thermal stress distribution at the electrolyte layers. It can be observed the high temperature region primarily resides in the central region of the stack, with relatively low temperatures in the remaining regions. This phenomenon arises from the strong electrochemical reaction-related heat generation while limited heat transfer with the external environment.
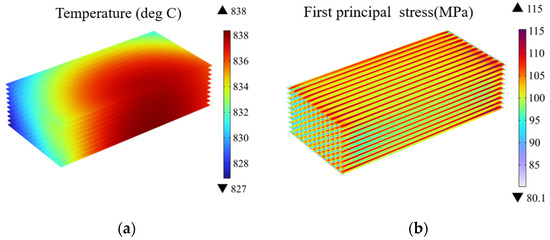
Figure 4.
(a) Temperature distribution and (b) thermal stress distribution at electrolyte layers in SOEC stack under co-flow configurations (operating voltage: 14 V).
Combining Figure 4a,b, it can be observed there are significant differences in the distribution of the temperature and the stress. In high temperature regions, there is no overlap with the high-stress regions. On the contrary, the thermal stress concentration is more pronounced along the interfaces under the ribs. This indicates the thermal stress is not solely dependent on the temperature but also related to the geometric structure. The reason behind the thermal stress concentration is attributed to the geometric and material discontinuities beneath the ribs, leading to the thermal stress concentration in the contacting regions between the adjacent components (i.e., the ribs and electrolyte layers).
On this basis, the performance and thermal stress of SOEC stack are analyzed and optimized by using different operating parameters and structural design. The distribution of the air flow rate, temperature, and thermal stress within a 10-cell SOEC stack is further predicted and analyzed for different flow configurations, namely co-flow, counter-flow, and cross-flow. An overview and discussion of the variations in the thermal stress and failure probability between different cells are also provided. Considering the significant impact of the operating temperature on the stack performance, the simulation is also conducted for three different operating temperatures (i.e., 700 °C, 800 °C, 900 °C) aiming to evaluate the hydrogen production and the current density, as well as to identify the primary factors affecting the thermal stress. Finally, potential approach to improve the gas uniformity within the channels is addressed by analyzing five manifold designs.
3.1. Effect of Gas Flow Arrangement and Stack Configuration
There are three primary gas flow patterns commonly employed in the planar designed SOEC stack: co-flow, counter-flow, and cross-flow. Different flow patterns exert distinct influences on the temperature and the thermal stress distribution within the stack. Figure 5 presents the predicted distribution of H2 and O2 at a working voltage of 14 V. Due to distinctive structural characteristics of the cross-flow mode, a symmetric configuration could not be employed while the complete stack is selected as the simulation domain. In Figure 5, blue color represents the regions with lower H2 concentration, while the red one the regions with higher H2 concentration. The region with a rapid color change indicates more intense electrochemical reactions, and visa verse. The simulation results in Figure 5 show, under different flow patterns, the variation in the gas composition follows the same pattern. The molar fraction of H2 gradually increases along the flow direction. It is observed the color change is slower in the upstream region, while the faster color change occurs in the middle section of the stack. Therefore, the electrochemical reactions are slower in the upstream region and more intense in the middle section. In other words, the electrochemical reactions in this region are slower.
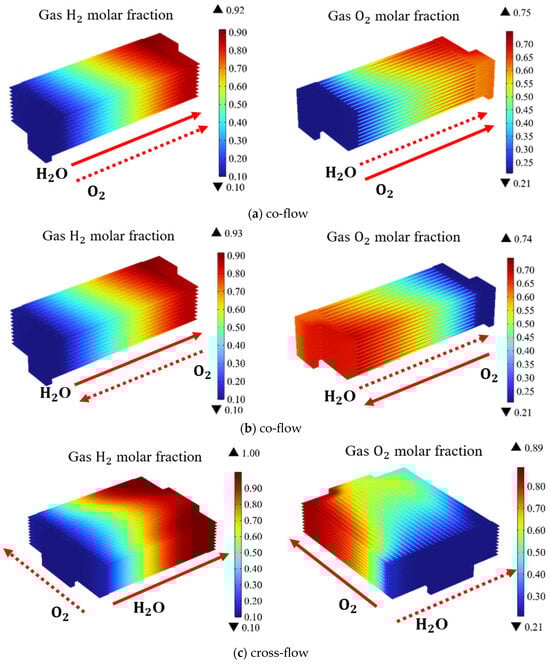
Figure 5.
Molar fraction distribution of H2; and O2; in SOEC stack under different gas flow configurations (operating voltage: 14 V) with: (a) co-flow, (b) counter-flow, (c) cross-flow.
In the co-flow and counter-flow cases, the blue areas in the channels have roughly the same area. However, in the cross-flow pattern, the blue area in the central channels is larger than in the two side channels, indicating there are more H2 generated in the central channels, which means the gas distribution in the channels is very uneven. It is noted, under co-flow and counter-flow cases, the hydrogen gas distribution within the channels remains relatively homogeneous. Despite the opposing directions of the air intake, the impact on the hydrogen production and its distribution is limited. However, in the case of the cross-flow, the hydrogen gas distribution within the channels is very uneven. This constraint limits the electrochemical reactions. However, the hydrogen production in the cross-flow configuration remains notably higher compared to that predicted for the co-flow and counter-flow cases.
It is demonstrated the average hydrogen molar fractions at the outlets for the co-flow, counter-flow, and cross-flow configurations are 88.4%, 89%, and 96.6%, respectively. In the cross-flow mode, the hydrogen production is 8% higher compared to co-flow and counter-flow modes. Consequently, among these three distinct flow patterns, the cross-flow exhibits the most favorable electrolysis performance. However, addressing the issue of improving gas uniformity within the cross-flow channels remains a challenge to be tackled.
As depicted in Figure 6, the electrolyte layer is chosen as the presented region. The temperature distribution of the electrolyte under three different flow patterns is compared. It is evident that, under distinct flow patterns, the location of predicted high temperature within the stack differ from each case. For example, in the co-flow pattern, the high temperature is located at the downstream of the main flow directions. In contrast, under the counter-flow, the high temperature region is found at the downstream of the air flow, which corresponds to the upstream of the cathode side flow. In other words, the air flow rate mainly affects the temperature distribution. Similarly, in the cross-flow case, the high temperature region is predicted at the downstream of the air flow. Additionally, these different flow patterns induce variations in the stack temperature. The temperature ranges for the electrolyte layer in the co-flow, counter-flow, and cross-flow configurations are 827 °C to 838 °C, 829 °C to 839 °C, and 828 °C to 843 °C, respectively, with the biggest tem-eature difference of 15 °C predicted for the cross-flow case (about 5 °C higher than that in other two cases).
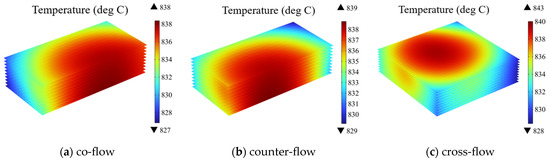
Figure 6.
Temperature distribution at electrolyte layers in SOEC stack under different gas flow configurations (operating voltage: 14 V) of: (a) co-flow, (b) counter-flow, (c) cross-flow.
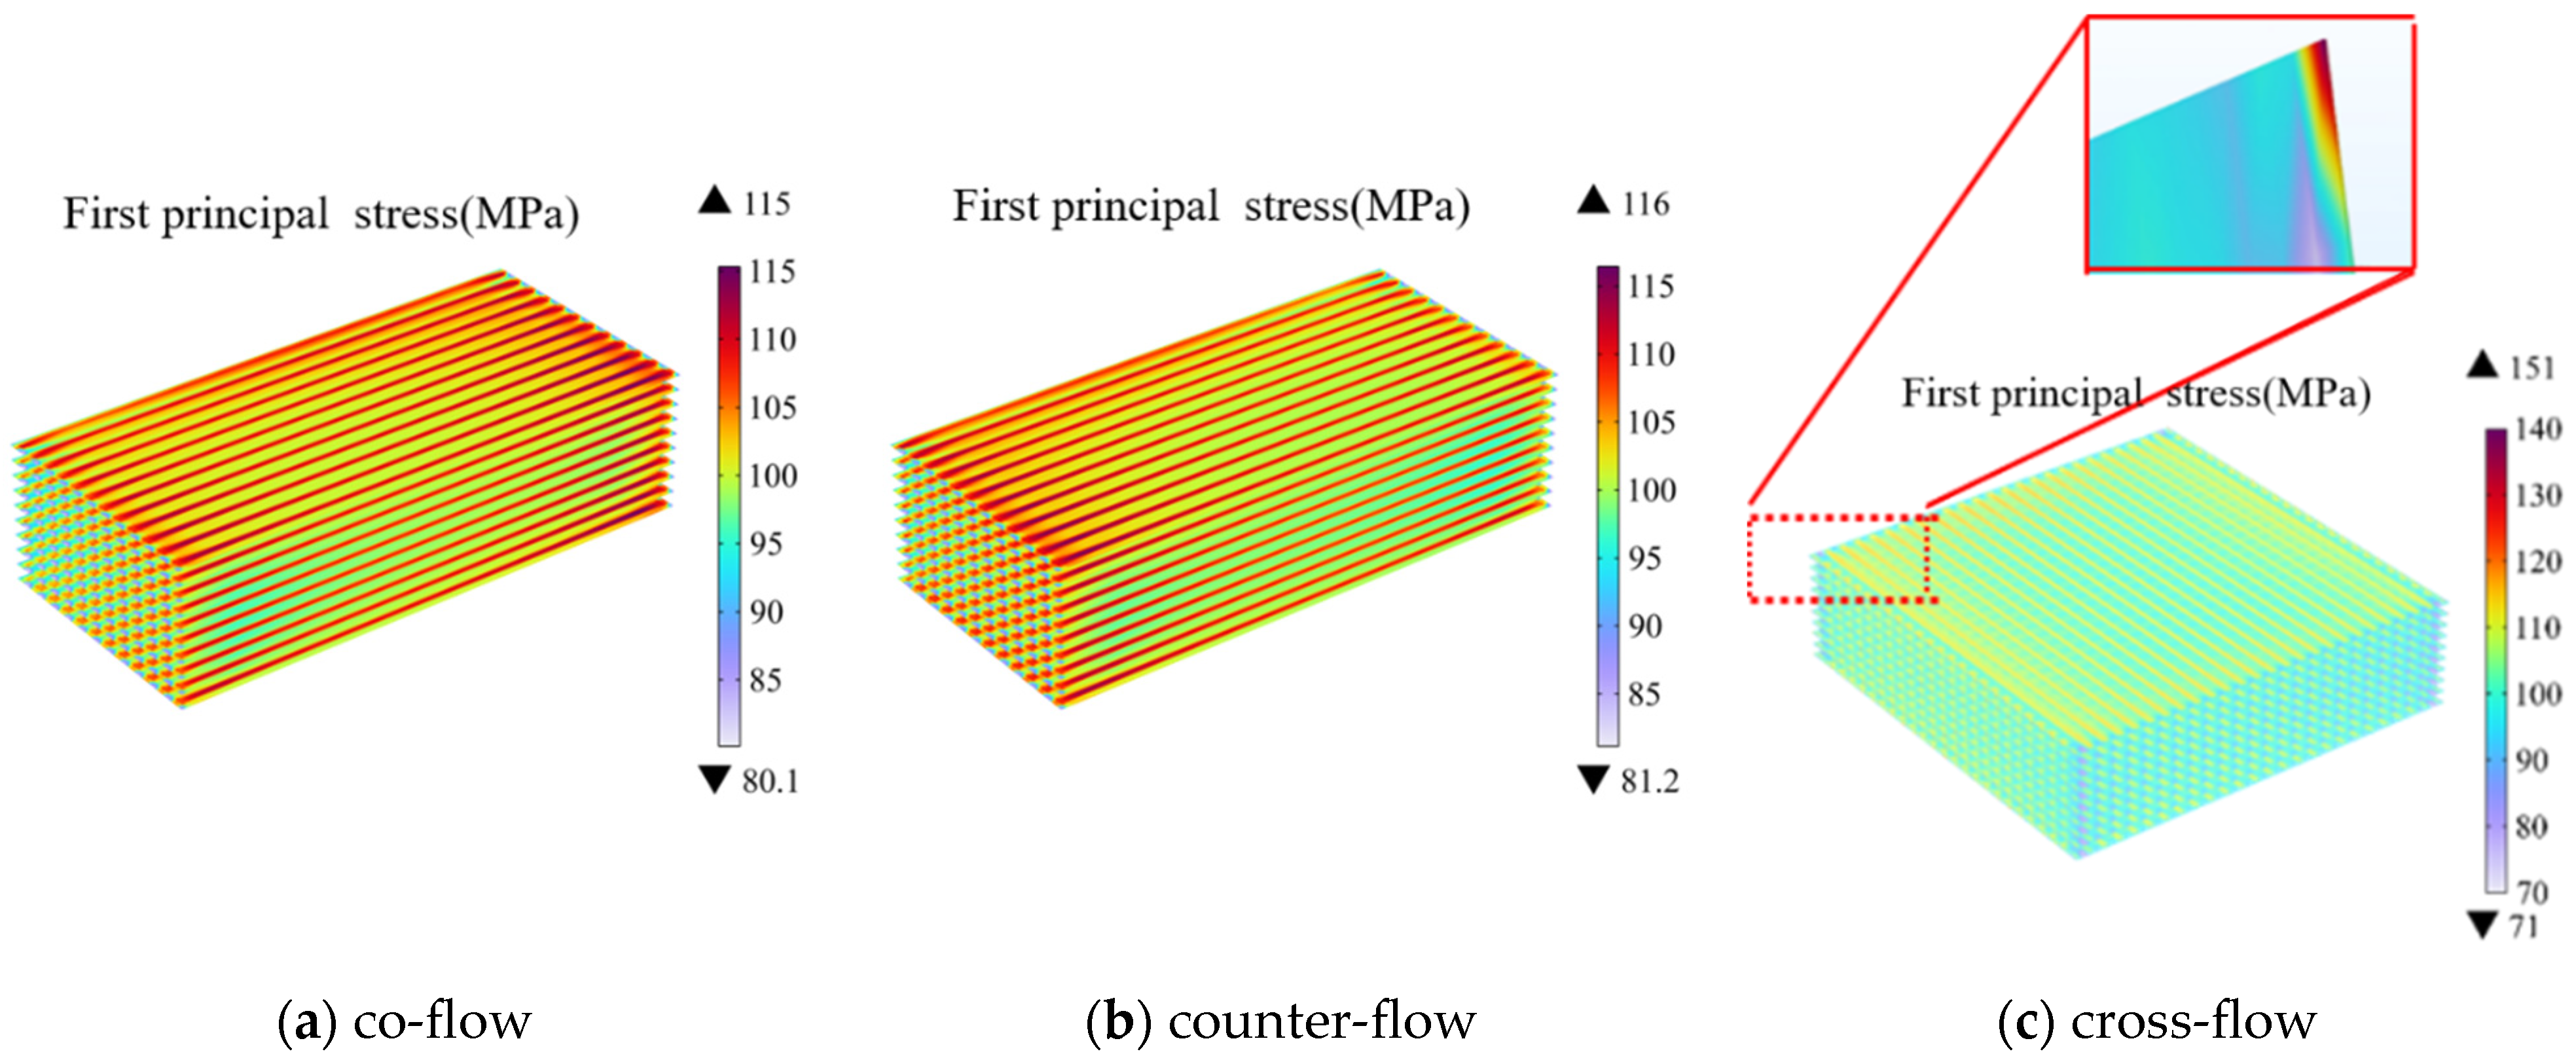
The first principal stress is suitable for analysis of thermal-mechanical performance for the ceramic and metallic materials, which effectively distinguishes between the maximum tensile stress and compressive stress (neglecting shear stress perpendicular to the plane). Therefore, distribution of the first principal stress is predicted as the major focus of the current study, where positive and negative values represent tensile and compressive stresses, respectively. As depicted in Figure 7, the electrolyte layer is mainly influenced by the tensile stress. It is also true that the stress distribution between the co-flow and counter-flow patterns are very similar, i.e., the maximum stress is located beneath the ribs with a notable concentration of the thermal stress in this region, particularly near the gas inlet and outlet region.

Figure 7.
Thermal stress distribution at electrolyte layers in SOEC stack under different gas flow configurations (Operating Voltage: 14 V) of: (a) co-flow, (b) counter-flow, (c) cross-flow.
Among the three flow patterns, the cross-flow pattern generates the highest thermal stress due to the structural peculiarities. However, the overall thermal stress distribution across the electrolyte layer is more uniform in the case of the cross-flow compared with those of other cases, which effectively alleviates the thermal stress concentration beneath the ribs. Notably different from the previous two patterns, the location of the maximum thermal stress in the cross-flow pattern is at the left-top corner of the electrolyte in Figure 7c, while its value (i.e., 151 MPa) is much higher compared with that predicted for the other two cases (i.e., 115 MPa and 116 MPa, respectively).
Figure 8 analyzes the failure probabilities of different components (i.e., the cathode, anode, and electrolyte layer) under various flow patterns. It is evident that the anode exhibits the highest failure probability followed by the electrolyte layer, while the cathode displays the lowest failure probability. The maximum failure probability occurs within the anode, rather than in the electrolyte layer where the highest first principal stress is predicted. This observation can be elucidated through the Weibull strength and modulus presented in Table 4. It is clear that a higher Weibull strength indicates greater material stability, and vice versa. The dense electrolyte exhibits the highest Weibull strength and the second-highest Weibull modulus, indicating its exceptional stability. Conversely, the anode possesses the lowest Weibull strength and modulus. Therefore, the cracks are most likely to initiate within the anode, which demands considerable attention in the cell and stack design.
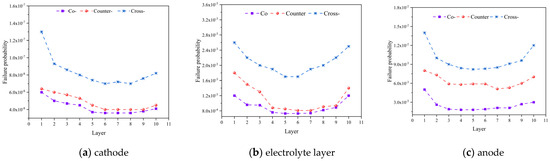
Figure 8.
Failure probability predicted for: (a) cathode, (b) electrolyte layer, (c) anode with different flow configurations.
It should be noted that the lowest cell is denoted as the 1st one, while the top-most one is the 10th cell. Additionally, with an increase in number of the cells in the stack, the failure probabilities of the positive electrode-electrolyte-negative electrode (PEN) structure demonstrate a trend of initial decrease followed by an increase, with the maximum failure probability occurring in the first cell. For the three inlet flow modes, due to the minimal disparity in the thermal stresses between the co-flow and counter-flow patterns, the difference in the failure probabilities is relatively small. However, the failure probability for the cross-flow pattern significantly exceeds that of the other two modes, and the first layer anode has the maximum probability of failure (about 0.014). This disparity is attributed to the notably higher maximum thermal stress in the cross-flow pattern compared to the co-flow and counter-flow patterns.
3.2. Effect of Operating Temperature
The operating temperature has a significant impact on the electrolysis performance, temperature distribution, and thermal stress of SOEC stack. This study primarily explores the effects of three operating temperatures (i.e., 700 °C, 800 °C and 900 °C) under the co-flow conditions on the electrochemical performance and thermal stress, by maintaining the external temperature at 800 °C. Figure 9 illustrates the relationship between the voltage, hydrogen production, and current density at different temperatures. It is evident that with an increase in the temperature, both the hydrogen production and current density notably increase. However, the effect of the operating voltage on the hydrogen production and current density is more significant than that of the operating temperature. At an operating temperature of 700 °C, the hydrogen production essentially displays a linear variation with the voltage. At an outlet region, the hydrogen molar fraction of 27% at 11 V, while it rises to 78% at 14 V, resulting in a 51% increase in the hydrogen production. At the operating temperature of 800 °C and 900 °C, the hydrogen production maintains linear variation between 11 V and 13 V. Beyond 13 V, the hydrogen production changes more gradually. Moreover, when the operating temperature surpasses 800 °C, the increment in the hydrogen production due to the increment operating temperature is not as pronounced as the increase from 700 °C to 800 °C. Figure 9b indicates that the changes in the current density closely mirror those in the hydrogen production. This signifies the interdependence of the hydrogen production from the current density. The influence of the operating temperature on the current density mainly stems from reducing the reversible voltage and other irreversible voltage losses. At 700 °C, the irreversible losses and reversible voltage are the primary factors constraining the higher current density. However, when the temperature exceeds 800 °C and operates at high voltages, the reduction in the reversible voltage and the polarization losses with increasing temperature becomes less significant. Hence, the concentration of the reactants at the TPB region becomes the predominant factor limiting the rising in the current density. Consequently, an operating temperature of 800 °C appears to be most suitable, due to a fact that further temperature increase contributes relatively minor improvements in the hydrogen production.
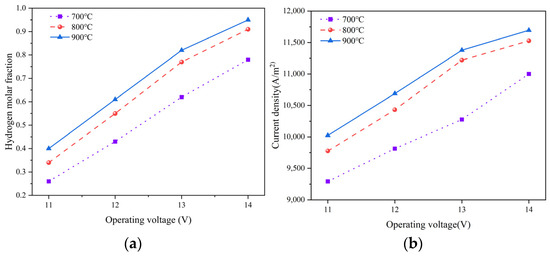
Figure 9.
Relationship between (a) hydrogen production and (b) current density at different temperatures in SOEC stack.
Figure 10 shows the thermal stress distribution predicted for different cell electrolyte layers at various operating temperature and operating voltages. It can be observed that, under three different operating temperatures, the thermal stress at various electrolytes follows the same distribution pattern, showing a trend of initially decreasing and then increasing with the cell number. The thermal stress is at its minimum in the 5th and 6th cell, while the 1st and 10th cells exhibit the greater thermal stress compared to the other ones. Under three different operating temperatures, the maximum averaged stress experienced by the electrolyte layer occurs consistently in the 1st cell. At an operating temperature of 700 °C, increasing the operating voltage results in respective increments of 9%, 31%, and 43%, respectively, in the thermal stress. For instance, raising the operating voltage from 11 V to 12 V increases the averaged thermal stress in the electrolyte layer by 9%. At an operating temperature of 800 °C, the averaged thermal stress in the electrolyte layer rises by 6%, 22%, and 35%, respectively, while at an operating temperature of 900 °C, the corresponding increments are 7%, 18%, and 25%, respectively. It is evident that the higher operating voltages lead to more pronounced increases in thermal stress.
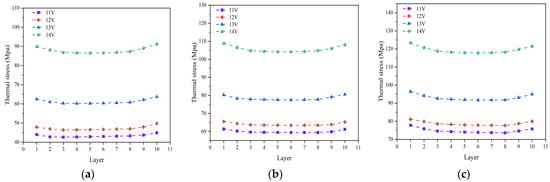
Figure 10.
Averaged thermal stress distributed in different electrolyte layers at various operating temperature of: (a) 700 °C, (b) 800 °C, and (c) 900 °C, under different operating voltages (11 V, 12 V, 13 V and 14 V).
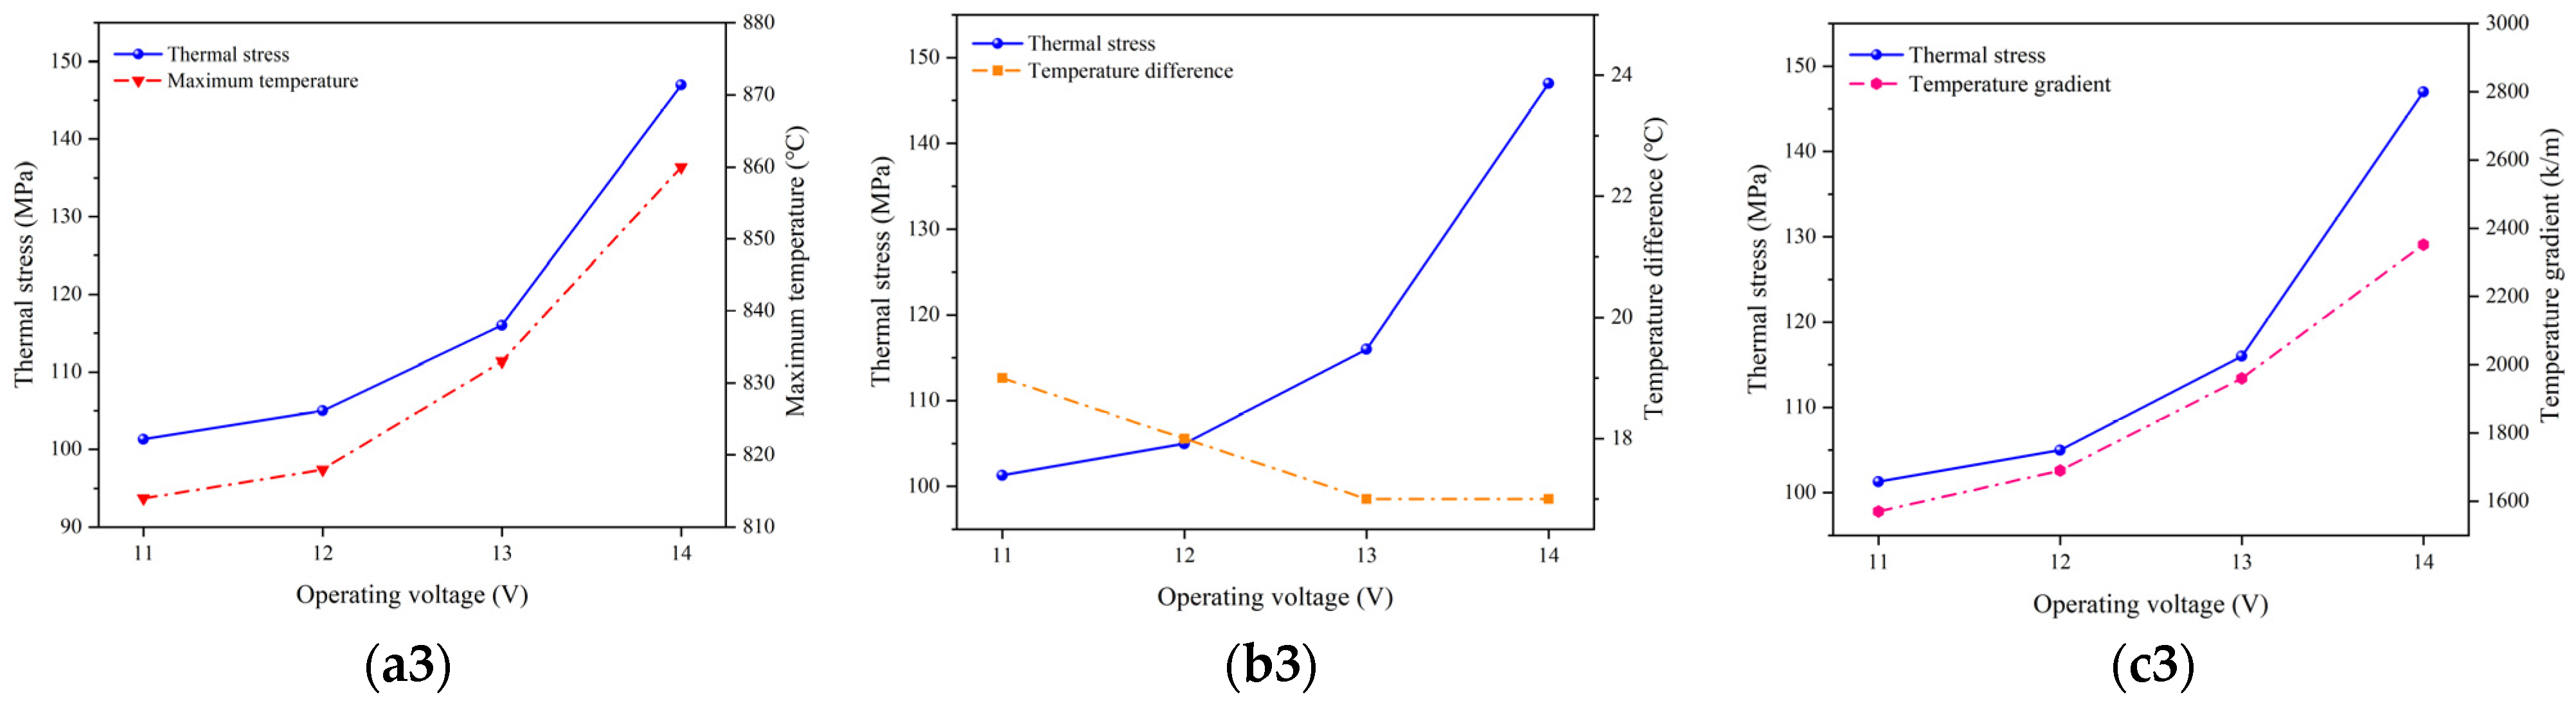
Figure 11 illustrates the relationship between the maximum thermal stress in the electrolyte layer under different operating temperatures, together with the highest temperature, temperature difference, and temperature gradient predicted. It is evident that the variation in the predicted highest temperature, temperature gradient, and thermal stress follow the same trend, i.e., increased with the higher voltage. Additionally, altering the operating temperature does not change the trends in the variation of the predicted highest temperature, temperature gradient, and thermal stress. However, there does not appear to be a significant correlation between the variation in the temperature difference and thermal stress. Consequently, the changes in the predicted thermal stress are primarily influenced by both the highest temperature and temperature gradient.
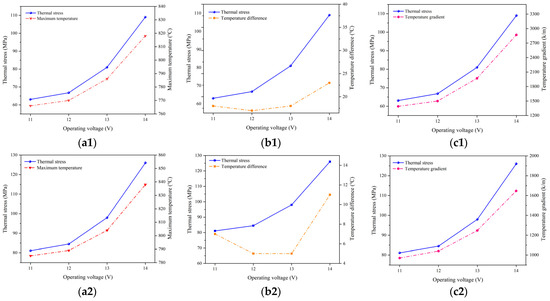
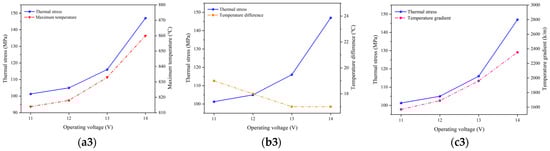
Figure 11.
Relationship between maximum temperature (a1,b1,c1), temperature difference (a2,b2,c2), temperature gradient (a3,b3,c3), and thermal stress at operating temperature of 700 °C (a1–a3), 800 °C (b1–b3), and 900 °C (c1–c3).
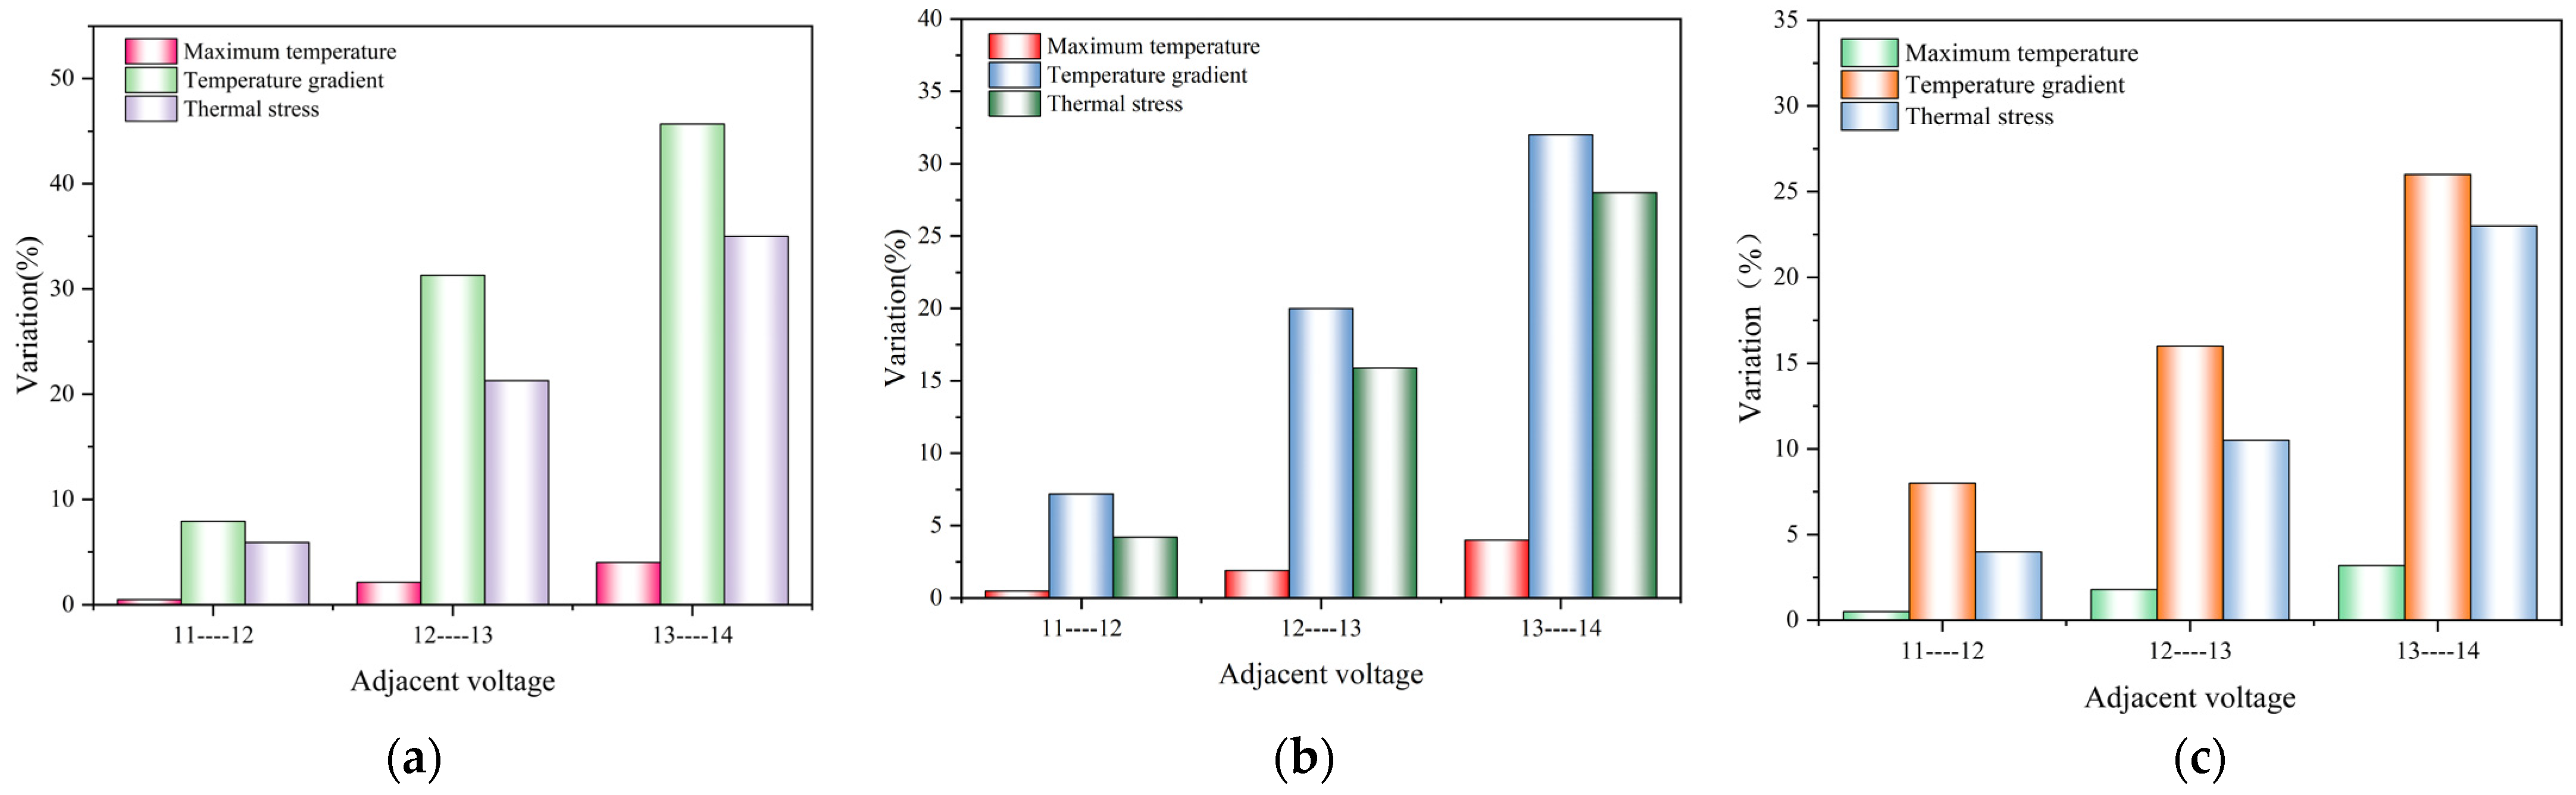
Figure 12 depicts the relationship between the variation in the highest temperature, temperature gradient, and thermal stress at the operating temperature of 700 °C, 800 °C, and 900 °C. Between the adjacent operating voltages, the variation in the highest temperature is minimal, and the change in the thermal stress is primarily driven by the alteration in the temperature gradient. Therefore, it can be concluded that the temperature gradient plays a predominant role in affecting the thermal stress distributions.
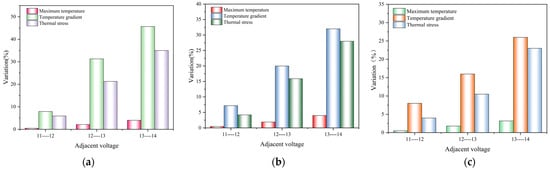
Figure 12.
Variations of maximum temperature, temperature gradient, and stress at operating temperature of (a) 700 °C, (b) 800 °C, and (c) 900 °C.
3.3. Effect of Manifold Layout
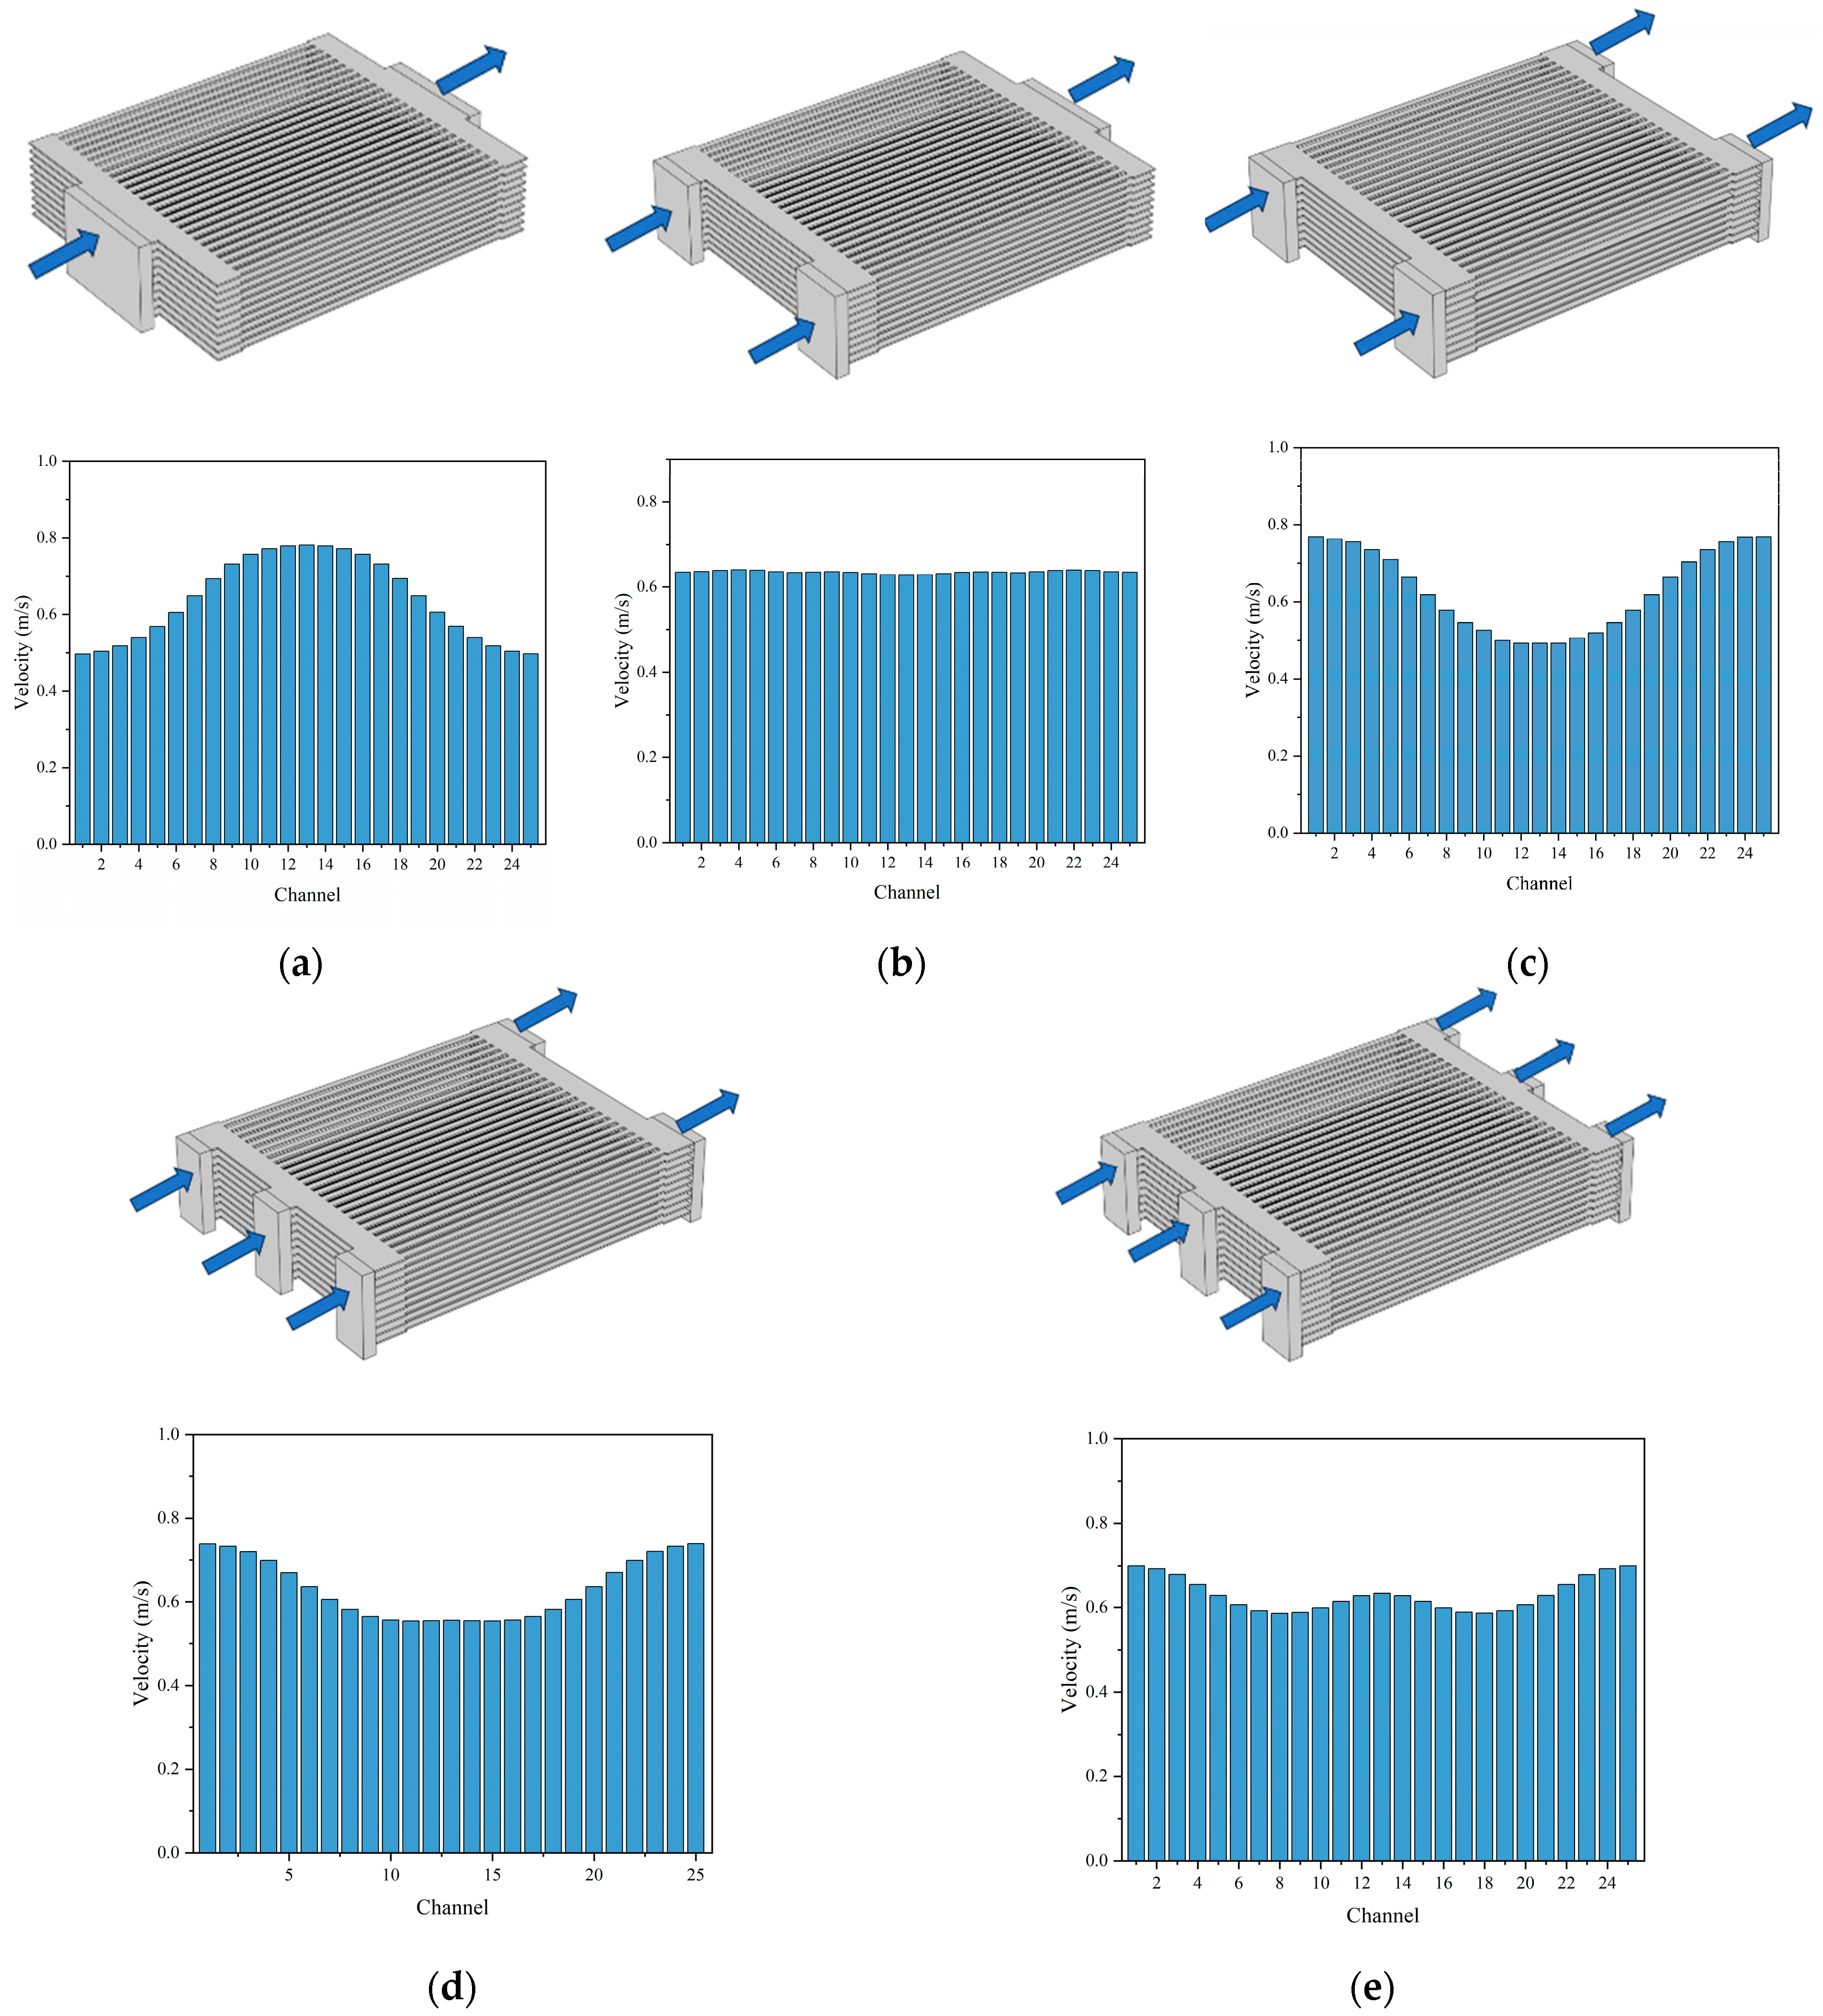
The distribution of the gas flow within the channels plays a crucial role in the performance of the SOEC stack. Non-uniform flow distribution can lead to performance disparities between the cells, resulting in decreased electrolysis performance. Therefore, five different manifold arrangements are proposed and compared, aiming to enhance the gas distribution uniformity within the stack by varying the number and configuration of the manifolds, as shown in Figure 13a–e.
Figure 13.
Averaged flow rate of reactants in each cell in 10-cell SOEC stack: (a) 1-inlet and 1-outlet, (b) 2-inlet and 1-outlet, (c) 2-inlet and 2-outlet, (d) 3-inlet and 2-outlet, (e) 3-inlet and 3-outlet.
Under an operating voltage of 12 V, the predicted average reactant flow velocities for each manifold case are examined. It becomes evident that the uniformity of the gas distribution within the cells is not solely determined by the number of the manifold inlets; the number of the manifold outlets also plays a significant role. For instance, as depicted in Figure 13b,c, when the same number of manifold inlets (i.e., 2) is considered, varying the number of manifold outlets exerts a considerable influence on the gas uniformity within the channels. Thus, the uniformity of the gas distribution within the cells is affected by both the number of manifold inlet and outlet. Among the five manifold designs, the 2-inlet and1-outlet manifold arrangement yields the most favorable gas uniformity within the channels, as shown in Figure 13b.
Based on the simulation results, it is clear that SOEC produces more hydrogen by employing the cross-flow pattern, while its thermal stress is also higher, which should be balanced in practical applications. In the PEN, the anode has the highest probability of failure, particularly in the first and last cells in the stack. When operating temperatures exceed 800 °C, further increasing in the working temperature has limited benefits for the stack performance. Among different manifold designs, the 2-inlet-1-outlet manifold design may effectively enhance the gas uniformity within the channels.
4. Conclusions
A 3-D CFD model is developed and implemented for predicting the thermal stress and transport process in a full-scale planar designed SOEC stack. The model couples thermal, mass, momentum, charge transfer, and chemical reactions to comprehensively evaluate the gas distribution, temperature, and thermal stress distribution in a 10-cell stack. The effects of different flow patterns, operating temperature, and manifold arrangements on stack performance and thermal stress distribution are considered. The main research findings are as follows:
- (1)
- Among the three flow patterns, the cross-flow mode exhibits the highest electrolysis performance with 96.6% average hydrogen molar fraction predicted for the outlet region. Due to the complexity of its structure, the cross-flow mode also generates the highest thermal stress of 151 MPa, which is about 36 MPa higher than that in other flow cases. Consequently, the failure probability of this mode is notably higher.
- (2)
- Under all three flow patterns, the high-temperature regions within the electrolyte layer are located at the downstream of the air inlet, the biggest temperature difference of 15 ℃ predicted for the cross-flow case (about 5 ℃ higher than that in other two cases). And, the failure probability of the first cell is higher than that of the others. Within the PEN structure, the anode poses the highest risk of failure.
- (3)
- Increasing the operating temperature benefits the hydrogen production; however, due to limitations imposed by the reactant concentration at the TPB, when the operating temperature exceeds 800 °C, a minimal improvement in current density and hydrogen production is achieved with further elevation of the operating temperature. Therefore, 800 °C is the most suitable operating temperature.
- (4)
- Thermal stress is significantly higher in the bottom- and top-end cells compared to the others. Under three different operating temperatures, the maximum thermal stress in different electrolyte layers consistently occurs in the 1st cell. The higher operating voltages lead to more pronounced increases in the thermal stress. Changes in the thermal stress are primarily influenced by both the highest temperature and temperature gradient, with the latter one playing the dominant role.
- (5)
- Uniformity of the gas distribution within the cells is influenced by the number of both the manifold inlet and outlet. The 2-inlet and 1-outlet manifold design effectively enhances the gas uniformity within the channels.
Author Contributions
Conceptualization, H.W., Y.L. and J.Y.; methodology, H.W., L.X. and J.Y.; validation, H.W. and X.Z.; data curation, H.W., R.Z., F.L. and L.X.; writing—original draft preparation, H.W.; funding acquisition, J.Y. All authors have read and agreed to the published version of the manuscript.
Funding
This work is supported by the National Key Research and Development Project of China (2018YFB1502204); Ningbo major special projects of the Plan “Science and Technology Innovation 2025” (2018B10048).
Data Availability Statement
Data are contained within the article.
Conflicts of Interest
The authors declare no conflict of interest.
References
- Wang, Y.; Li, W.; Ma, L.; Li, W. Degradation of solid oxide electrolysis cells: Phenomena, mechanisms, and emergingmitigation strategies—A review. J. Mater. Sci. Technol. 2020, 55, 35–55. [Google Scholar] [CrossRef]
- Graves, C.; Ebbesen, S.D.; Mogensen, M. Sustainable hydrocarbon fuels by recycling CO2 and H2O with renewable or nuclear energy. Renew. Sustain. Energy Rev. 2011, 15, 1–23. [Google Scholar] [CrossRef]
- Zhang, X.; Yu, S.; Wang, M. Thermal stress analysis at the interface of cathode and electrolyte in solid oxide fuel cells. Int. Commun. Heat Mass Transf. 2020, 118, 104831. [Google Scholar] [CrossRef]
- Xu, M.; Li, T.; Yang, M. Modeling of an anode supported solid oxide fuel cell focusing on thermal stresses. Int. J. Hydrogen Energy 2016, 41, 14927–14940. [Google Scholar] [CrossRef]
- Zhang, S.; Peters, R.; Varghese, B. Modeling of reversible solid oxide cell stacks with an open-source library. J. Electrochem. Soc. 2022, 169, 114501. [Google Scholar] [CrossRef]
- Li, J.; Lin, Z. Effects of electrode composition on the electrochemical performance and mechanical property of micro-tubular solid oxide fuel cell. Int. J. Hydrogen Energy 2012, 37, 12925–12940. [Google Scholar] [CrossRef]
- Nerat, M.; Juricic, D. Modelling of anode delamination in solid oxide electrolysis cell and analysis of its effects on electrochemical performance. Int. J. Hydrogen Energy 2018, 43, 8179–8189. [Google Scholar] [CrossRef]
- Navasa, M.; Graves, C.; Chatzichristodoulou, C. A three dimensional multi-physics model of a solid oxide electrochemical cell: A tool for understanding degradation. Int. J. Hydrogen Energy 2018, 43, 11913–11931. [Google Scholar] [CrossRef]
- Du, Y.; Qin, Y.; Zhang, G. Modelling of effect of pressure on co-electrolysis of water and carbon dioxide in solid oxide electrolysis cell. Int. J. Hydrogen Energy 2019, 44, 3456–3469. [Google Scholar] [CrossRef]
- Navasa, M.; Miao, X.; Frandsen, H.L. A fully-homogenized multi-physics model for a reversible solid oxide cell stack. Int. J. Hydrogen Energy 2019, 44, 23330–23347. [Google Scholar] [CrossRef]
- Stempien, J.P.; Ding, O.L.; Sun, Q. Energy and exergy analysis of solid oxide electrolyser cell (SOEC) working as a CO2 mitigation device. Int. J. Hydrogen Energy 2012, 37, 14518–14527. [Google Scholar] [CrossRef]
- Wang, C.; Chen, M.; Liu, M. Dynamic modeling and parameter analysis study on reversible solid oxide cells during mode switching transient processes. Appl. Energy 2020, 263, 114601. [Google Scholar] [CrossRef]
- Bernadet, L.; Gousseau, G.; Chatroux, A. Influence of pressure on solid oxide electrolysis cells investigated by experimental and modeling approach. Int. J. Hydrogen Energy 2015, 40, 12918–12928. [Google Scholar] [CrossRef]
- Udagawa, J.; Aguiar, P.; Brandon, N.P. Hydrogen production through steam electrolysis: Model-based dynamic behaviour of a cathode-supported intermediate temperature solid oxide electrolysis cell. J. Power Sources 2008, 180, 46–55. [Google Scholar] [CrossRef]
- Jin, X.; Xue, X. Mathematical modeling analysis of regenerative solid oxide fuel cells in switching mode conditions. J. Power Sources 2010, 195, 6652–6658. [Google Scholar] [CrossRef]
- Kazempoor, P.; Braun, R.J. Model validation and performance analysis of regenerative solid oxide cells: Electrolytic operation. Int. J. Hydrogen Energy 2014, 39, 2669–2684. [Google Scholar] [CrossRef]
- Xu, Z.; Zhang, X.; Li, G. Comparative performance investigation of different gas flow configurations for a planar solid oxide electrolyzer cell. Int. J. Hydrogen Energy 2017, 42, 10785–10801. [Google Scholar] [CrossRef]
- Cui, T.; Xiao, G.; Yan, H. Numerical simulation and analysis of the thermal stresses of a planar solid oxide electrolysis cell. Int. J. Green Energy 2022, 20, 432–444. [Google Scholar] [CrossRef]
- Buttler, A.; Koltun, R.; Wolf, R. A detailed techno-economic analysis of heat integration in high temperature electrolysis for efficient hydrogen production. Int. J. Hydrogen Energy 2015, 40, 38–50. [Google Scholar] [CrossRef]
- Ni, M. Modeling of a solid oxide electrolysis cell for carbon dioxide electrolysis. Chem. Eng. J. 2010, 164, 246–254. [Google Scholar] [CrossRef]
- Hernández-Pacheco, E.; Singh, D.; Hutton, P.N. A macro-level model for determining the performance characteristics of solid oxide fuel cells. J. Power Sources 2004, 138, 174–186. [Google Scholar] [CrossRef]
- Costamagna, P.; Honegger, K. Modeling of solid oxide heat exchanger integrated stacks and simulation at high fuel utilization. J. Electrochem. Soc. 1998, 145, 3995–4007. [Google Scholar] [CrossRef]
- Jiang, C.; Gu, Y.; Guan, W. 3D thermo-electro-chemo-mechanical coupled modeling of solid oxide fuel cell with double-sided cathodes. Int. J. Hydrogen Energy 2020, 45, 904–915. [Google Scholar] [CrossRef]
- Zheng, J.; Xiao, L.; Wu, M. Numerical analysis of thermal stress for a stack of planar solid oxide fuel cells. Energies 2022, 15, 343. [Google Scholar] [CrossRef]
- Zhang, Z.; Yue, D.; Yang, G. Three-dimensional CFD modeling of transport phenomena in multi-channel anode-supported planar SOFCs. Int. J. Heat Mass Transf. 2015, 84, 942–954. [Google Scholar] [CrossRef]
- Frandsen, H.L. Weibull statistics effective area and volume in the ball-on-ring testing method. Mech. Mater. 2014, 73, 28–37. [Google Scholar] [CrossRef]
- Li, Z.; Yang, G.; Cui, D. Modeling and evaluating of thermo-electro-chemo-mechanical behavior for pre-reformed methane-fueled solid oxide fuel cell. J. Power Sources 2022, 522, 230981. [Google Scholar] [CrossRef]
- Radovic, M.; Lara-Curzio, E. Mechanical properties of tape cast nickel-based anode materials for solid oxide fuel cells before and after reduction in hydrogen. Acta Mater. 2004, 52, 5747–5756. [Google Scholar] [CrossRef]
- Banerjee, A.; Wang, Y.; Diercks, J. Hierarchical modeling of solid oxide cells and stacks producing syngas via H2O/CO2 Co-electrolysis for industrial applications. Appl. Energy 2018, 230, 996–1013. [Google Scholar] [CrossRef]
- Frandsen, H.L.; Makowska, M.; Greco, F. Accelerated creep in solid oxide fuel cell anode supports during reduction. J. Power Sources 2016, 323, 78–89. [Google Scholar] [CrossRef]


Disclaimer/Publisher’s Note: The statements, opinions and data contained in all publications are solely those of the individual author(s) and contributor(s) and not of MDPI and/or the editor(s). MDPI and/or the editor(s) disclaim responsibility for any injury to people or property resulting from any ideas, methods, instructions or products referred to in the content. |
© 2023 by the authors. Licensee MDPI, Basel, Switzerland. This article is an open access article distributed under the terms and conditions of the Creative Commons Attribution (CC BY) license (https://creativecommons.org/licenses/by/4.0/).