Article

A Data-Driven Architecture for Smart Renewable Energy Microgrids in Non-Interconnected Zones: A Colombian Case Study

by
Ramón Fernando Colmenares-Quintero
1,*,
Gina Maestre-Gongora
2,
Oscar Camilo Valderrama-Riveros
3,
Marieth Baquero-Almazo
1 and
Kim E. Stansfield
4
1
Engineering Research Institute (In3), Universidad Cooperativa de Colombia, Calle 50A No. 41-34, Medellín 050001, Colombia
2
Faculty of Engineering, Universidad Cooperativa de Colombia, Calle 50A No. 41-34, Medellín 050001, Colombia
3
Engineering Research Institute (In3), Universidad Cooperativa de Colombia, Calle 10 No. 1-64, Ibagué 730001, Colombia
4
VoCATE Ltd., 2 Fountain Place, Worcester WR1 3HW, UK
*
Author to whom correspondence should be addressed.
Energies 2023, 16(23), 7900; https://doi.org/10.3390/en16237900
Submission received: 29 September 2023 / Revised: 31 October 2023 / Accepted: 8 November 2023 / Published: 4 December 2023
(This article belongs to the Section A: Sustainable Energy)

Abstract

:
Implementing smart microgrids for Non-Interconnected Zones (NIZs) has become an alternative solution to provide electrical energy by taking advantage of the resources available through the generation of renewable energy within these isolated areas. Within this context, in this study, the challenges related to microgrids and data analysis are presented, and different relevant data architectures described in the literature are compared. This paper focuses on the design of a data architecture for a smart microgrid for NIZs whose microgrid contains two 260 W solar panels, a 480 W inverter, and two 260 Ah batteries. Regarding the Colombian context, this paper describes the limitations (connectivity, isolation, appropriation of technologies) and opportunities (low demand, access to natural resources, state interest) from which the functional and non-functional requirements for the architecture are established. Finally, a data architecture is proposed and implemented in a NIZ in Colombia, and this paper also includes a description of the architecture, its characteristics, its associated opportunities and challenges, and discussions regarding its implementation.

1. Introduction

Colombia, as outlined in its National Development Plan [1] and in its transversal axis Covenant for the mineral energy resources for the sustainable growth and the expansion of opportunities in its territories, has the following objectives: (1) to take advantage of the natural, sustainable resources of the country to generate energy, diminishing contributions to global warming, (2) to ensure that the country has the necessary energy supplies for the development of its activities, and (3) to take advantage of the country’s resources and partner with territories aiming to provide sustainable and energy-efficient solutions for Non-Interconnected Zones (NIZ) [2]. NIZs cover about 53% of Colombian territory [3]. According to Law [4], NIZs are municipalities, townships, localities, and villages not connected to the National Interconnected System (SIN). The energy supplied to meet the needs of the inhabitants of these regions is generated locally in the same area. Currently, NIZs have an operational capacity to generate electricity, mainly from ‘carbon-intensive and expensive’ diesel, only 3% of which corresponds to Non-Conventional Sources and Renewable Energies (NCRES).
These areas have potentially advantageous natural resources and biodiversity, so the goal is to generate clean energy by exploiting resources such as rivers, sun, sea, wind, and biomass to reduce the environmental impacts and costs associated with current fossil fuel-based energy systems. Providing access to energy in a self-sustaining way through renewable energy projects supported by small-scale smart grids is a viable option for these communities.
Microgrids are considered a viable alternative in NIZs with high economic and sustainable potential, as they can integrate renewable energies to effectively manage and control energy consumption to satisfy the needs of communities in terms of energy transmission or transfer. The Colombian government, in a report titled ‘Smart Grid—Vision Colombia 2020′, have specified that “Through the use of microgrids the generation of electricity in NIZs is favoured, the previous allows the universalization and affordability of the energy service to stimulate the economic and social development in regions that do not have a continuous supply of the SIN” [5].
Power generation from natural resources is often highly variable due to its dependence on changing weather or environmental conditions, which are mainly affected by climate change. Through data analysis, smart microgrids play an important role because the through the integration of energy production and consumption, meteorological and environmental data can support the selection of renewable energy generation sites, thus improving energy production and efficiency [6] and establishing better policies for energy management and consumption. A smart microgrid allows for autonomous monitoring and control processes, the optimization of energy transfer, reductions in technical risks, and an increase in energy quality, efficiency, and reliability [7].
This article proposes a data-centric architecture and its implementation for small-scale renewable energy smart microgrids suitable for Colombian Non-Interconnected Zones to facilitate and support energy management decisions in terms of use, efficiency, and system maintenance in developing countries. The contribution of this work is a continuation of the work presented in [8], and a proof of concept of the architecture is proposed.
The main findings of this study are that the analysis of the data obtained by the architecture allows for predictions of energy generation and consumption for various purposes, including for the planning of future production. It also improves the sustainability and efficiency of grid operation through real-time data analysis. By evaluating electrical signal data such as current and voltage, it is possible to monitor power quality and identify sensor errors in microgrids. The predictive maintenance and assessment of degradation rates of grid components are feasible using energy technology monitoring. In addition, analysing consumption patterns can lead to the creation of sustainable business models for communities—crucial for their energy self-sufficiency. In addition, weather forecasts help to select the most appropriate energy generation technology, and the information generated supports feasibility studies of renewable energy projects in other similar regions. The novel contribution of this research study lies in the fact that there are no data-driven architectures for the control of renewable energy microgrids in NIZs that consider all the challenges of implementing smart microgrids in vulnerable and isolated areas.
In Section 2 of this paper, related works about smart grids and data management are presented, and some models and associated challenges in the stages of data management are described. Then, in Section 3, the methodology is described, identifying the functional and non-functional requirements, and proposing a reference model for the data architecture. The results of the present study for the case study of a Colombian NIZs are presented and discussed in Section 4, and Section 5 summarises the conclusions that can be drawn from this study.

2. Background

2.1. Smart Grids

The maturity of renewable energy technologies is bringing power generation closer through smart microgrids—small-scale electricity grids that operate independently or in conjunction with the electricity grid [9]—mainly to provide power to isolated communities that are difficult to access or have little interconnection with conventional national energy systems.
These have brought about the rapid transformation of the energy sector, as they allow for preventative interventions or immediate responses to outages, peak load changes, and fault management [10]. In the context of alternative energy generation technology sources, they provide options that add value since they enable the efficient management of available sources such as sun, air, biomass, or water, which is a critical factor in these types of projects.
The microgrids’ necessary components are elements related to energy generation: low voltage distribution network and energy storage systems integrated with elements related to information technologies including communication infrastructure, control, and management systems and intelligent sensors.
The literature contains several works on smart grids, such as [11], wherein the authors analyse and compare traditional smart grids (SG 1.0) and smart grids based on IoT (SG 2.0), focusing on how smart grids eliminate the disadvantages of traditional grids, as well as the opportunities and challenges associated with bringing the two together. This comparison is made to gain further insights into power transmission lines in Iran. Additionally, the authors of [12] reviewed the design and implementation of a smart metering network for energy metrics that are stored on a cloud server, also explaining that, with this technology, beyond monitoring energy generation, it is possible to predict power generation and consumption. A similar work can be found in the form of [13]; however, the difference in this study is in its incorporation of Arduino boards as an integral part of the system described in this study, as this is a cost-effective technological measure. Reference [14] extends this approach to present an Arduino IoT-based platform for non-invasive electricity measurements.
Reference [15] describes the implementation of a monitoring system for the generation of renewable energy, where the system is based on IoT using Arduino boards, Raspberry PI, and LoRa networks for an operation and maintenance analysis system. In [16], the authors focus on how to reduce energy losses in transmission lines by using the concepts of IoT and smart grid operation. Similarly [17] propose the use of a smart grid based on IoT to analyse and control energy consumption while improving efficiency in the use of electrical energy in addition to helping detect energy theft. In [18], IoT allowed for the monitoring of transmission lines in a smart grid using Arduino boards, sensors, and actuators for real-time management interventions.
Similarly, the authors of [19] highlight the collaboration between different renewable energy generators. Then, they develop an IoT-based architecture that enables the intelligent control of the demand and generation of electrical energy. In [20], the authors propose an automatic management strategy for electricity generated from renewable energy, given their dynamic behaviour. The results shown demonstrate a reduction in the cost of energy production using these strategies.

2.2. Data Management in Smart Grids

The key issues and findings of contributions relevant to the field of data analysis within the context of smart grids are summarised below:
The key benefits of big data analysis in the context of smart grids in relation to reference [21] include increased system stability and reliability, increased asset utilisation and efficiency, and improved customer experiences and satisfaction.
The authors of reference [22] focused their research on applying data management and analysis to a large-scale metric as fundamental parts of smart grids’ technological infrastructure through a framework that includes the life cycle of smart grid data, from data generation to data analysis.
Reference [23] focuses on infrastructure issues and addresses robust data analysis through high-performance computing, efficient data network management, and cloud computing techniques—critical elements for smart grid (SG) operation and optimization.
The authors of reference [24] review publications in the literature on the characteristics of big data and smart grids, discuss the potential problems for smart grids and the analysis of big data, and conclude that “the results have shown that ‘data’ is now a new feature being added as a significant component of energy systems”.
Given the importance of data for smart grids, proper management is required throughout its life cycle, ensuring added value, sustainability, and efficiency for stakeholders, and providing information and knowledge about the energy system’s operation and consumption practices. Therefore, data architecture facilitates the capture, storage, and processing of information to support data analysis models in smart microgrids.
Likewise, storage capacities are expanding due to the development of information technologies, and as a result of the above, data-oriented decision making can promote the creation of innovation in processes, products, and services and is projected to be a potential development area in the convergence of innovative technologies, but more research, discussions, and analyses regarding their applications are needed [25], particularly for those related to strategic decisions in sectors such as the energy sector, in which the trends in big data are one of the most important research challenges in relation to the 2020 horizon.
On the other hand, according to the authors of [26], there are several reference models oriented to the management of big data. Some of the most relevant models described in the literature are noted below, as are their applications in enterprise environments:
  • Microsoft: This reference architecture is a high-level diagram focused on data, representing the flow of big data and the possible transformation of data, from their collection to their use. This data transformation model includes data collection, aggregation, comparison, and mining.
  • Big Data Architecture Framework (BDAF): This framework focuses on the definition of the infrastructure and services based on Cloud/Intercloud technologies focused on the reference architecture of Big Data Security from IBM. It supports all types of data processing and management and maps out, among others, data discovery and exploration, data analysis, the management of unstructured data, real-time data analysis, analytical functions and toolsets, governance, event detection and action, security, and business continuity.
  • An important issue in the management and control of smart grids is ensuring the security and quality of the data being handled, as this, along with other technical aspects, is what the functionality of the grid is all about. Regarding data security, various methods can be implemented, such as encryption, access controls, and cybersecurity protocols to safeguard information and guarantee confidentiality, integrity, and availability at any time. Nowadays, due to the rate of digital advances, it is essential to study this aspect to create comprehensive and secure solutions. The authors of [27] carried out an exercise on image encryption, since the correct transmission of images was fundamental for their study. Additionally, the authors of [28] used neural networks to create methods for protection against cyberattacks. Moreover, the authors of [29] implemented techniques to improve image authentication. These are all examples of the great advances in data security and the importance of proper data transmission and management.
  • ORACLE: Oracle offers an integrated solution to address big data requirements in an application context driven by big data requirements for data acquisition, organisation, and analysis in support of decision making.
  • PIVOTAL: This model provides a variety of open-source platforms, EMC technology, and VMware, with the goal of making it possible to build big data analysis apps designed for the cloud.
  • SAP Big Data Architecture: This architecture includes data lifecycle management, infrastructure management, and data governance and security.
The above models are mostly presented in layers, and common to all models are three main layers that can clearly be identified: (1) Capture Data, (2) Storage and data transformation, (3) Data Analytics and Reporting.
Here are the most critical challenges found in the literature related to big data and its application to the design of smart grid architectures. Table 1 shows the challenges that must be considered for each of the data management stages in a reference model for data-driven architectures.

3. Methodology

According to the data reported by the ‘Instituto de Planificación y Promoción de Soluciones Energéticas para ZNI’ of Colombia [34], Non-Interconnected Zones (NIZs) “are those that do not receive public electricity service through the National Interconnected System -SIN. They are characterised by their natural, ethnic, and cultural wealth, many of them are protected areas due to the presence of indigenous reservations and collective lands, where most of the country’s biodiversity is found. The NIZs corresponds to 53% of the national territory, where 79% of the country’s rural population is located”.
Columbia’s NIZs are made up of 1758 localities, spread over 17 departments, specifically in 77 municipalities and 16 non-municipalised areas, including 5 NIZs that are departmental capitals and 39 municipal capitals. All these localities are characterised by their high potential for renewable energy projects. These areas are home to more than 403 k families or more than 2 million Colombians [35].
According to [34], a Non-Interconnected Zone in Colombia is recognized by the following characteristics:
  • A total of 77% of the population’s basic needs are unsatisfied.
  • Scattered and remote areas with a low population density.
  • Low average consumption.
  • Low payment capacity.
  • Lack of adequate monitoring and control mechanisms.
  • Little or no internet connectivity.
  • Low appropriation of ICT and energy technologies.
  • Geographical, environmental, and social conditions such as nature reserves, jungle areas, deserts, indigenous areas, and armed conflict zones.
In this context, the aim of this study was to design an architectural reference model for smart microgrids of renewable energy for Non-Interconnected Zones in Colombia. The following summarises the functional requirements (FR) and non-functional requirements (NFR) for the smart microgrid architecture.

3.1. Functional Requirements (FR)

3.1.1. FR—Data Capture

  • Capture data in real-time and asynchronously (mainly sensor or open data).
  • Transmit through at least two flexible communication protocols (wired and wireless), guaranteeing QoS depending on the area’s connectivity conditions.
  • Scale capture to unstructured data (video, images, voice) for future versions.

3.1.2. FR—Integration and Storage

  • Sample processing and transformation of captured data into a defined format.
  • Define a data mart to facilitate the data analysis.
  • Support batch and real-time analytical processing (locally and in the cloud).
  • Support big data processing for analysis and modelling.
  • Ensure data quality.
  • Define a backup policy for stored data.

3.1.3. FR—Data Analysis and Information Visualisation and Reporting

  • Enable searches of processed data with relevance, accuracy, and retrieval.
  • Support diversified output file formats for viewing and reporting both on the web.
  • Generate a simple user interface for viewing results in real-time via web and mobile devices that support these zones’ connectivity limitations.
  • Support data analysis and visualisation for business intelligence, data mining, and artificial intelligence through web and mobile devices that support these zones’ connectivity limitations.
  • Facilitate the interpretation of results for potential users with few technological skills.
  • Dynamic updating of generated and processed data.

3.2. Non-Functional Requirements (NFR)

  • Data Security: In the current framework for the case study and in the tests performed, no attack prevention mechanisms have been considered, given the current maturity level of the project. In addition to the challenge of improving security for low-capacity processing devices such as Arduinos, the main objective at this stage is to validate the functionality of the framework. However, it is possible to incorporate security measures when transmitting data to the server, which may involve data encryption or some methodologies to counter cyberattacks, as studied by [36,37]. However, the selection of the most appropriate security method will require experimentation and validation, considering power and processing requirements, which are critical constraints on data sensing.
  • Privacy policy for sensitive data.
  • The ability of the system to be scaled up according to the conditions in the area.
  • The standardisation, aggregation, and normalisation of data.

3.3. Reference Model

In accordance with the above requirements, we constructed a reference model for implementation in Colombian NIZs, and in this section, it is proposed. This architecture is flexible, and the smart micro-network could be adapted. In this sense, Figure 1 includes the requirements about data sources and transformation, which includes data normalisation, data cleaning, and data storage, all of which will be required to store data in a format that meets the requirements and restrictions of the target application to extract data via analysis and visualisation.
Figure 1 presents the data acquisition and management architecture for the microgrid; the “Capture” part is the beginning of the architecture, and for this, there is a physical stage consisting of sensors to measure the environmental and electrical variables of the microgrid or, more specifically, the solar panels in this case study. In the “Storage/Integration” part, the process of receiving data, storing data in the cloud, and integrating all the data of the different variables studied is carried out to have two direct final propositions: (1) the “Reporting”, which is where the actual monitoring and analysis is carried out by means of business intelligence, and (2) the “Analytic”, which is where artificial intelligence and data mining techniques are applied to find patterns and hidden information pertaining to the microgrid to allow for proper management and control.
The intelligent sensing system is made up of two blocks. The first block consists of the electronic components and the communication network that will collect the information of the variables on site throughout the system, and the second block is the software which will manage the collected information and control the entire system.
This system will be based on IoT technology [38]; it not only allows for the collection of data from the sensors but also for intervention in the system using actuators. For the system, the Arduino [39] and Raspberry [40] development boards will be used. The development boards enable the connection of multiple sensors in addition to facilitating the connection to the communication systems.
The proposed system is shown in Figure 2. The sensors and Arduino board will read all the electrical and environmental variable information and send it to the server. The server and the sink will be a Raspberry Pi. This device will gather all the information from the nodes and storage in the database.
There will be some processing of the sensor data at the Arduino, but this is limited due to the limitations in memory and those of the processor. This activity will serve to arrange the data types and carry out basic data validation. Also, according to the sample time. A limitation for the process time will be present.
Figure 3 shows a black box representation for the system with inputs regarding the data to be collected and the outputs produced by the system.
IoT supports a wide variety of communication technologies, whether wireless or wired. For wired IEEE 802.3 [41], ‘Ethernet’ is the most widely used. In wireless technologies, IEEE 802.11 [42] and IEEE 802.15.4 [43], commonly known as Wi-Fi and the and Zigbee, respectively, are the most widely used. Both offer stable and long-distance connections. They use the 2.4 GHz or 5 GHz frequency bands. The difference is that Zigbee is designed for low traffic (scalar data), while Wi-Fi supports multiple types of traffic.
There are other short-range and long-range wireless technologies currently widely used for IoT projects, such as Bluetooth, LoRa, LTE, 5G, etc. It should be noted that the choosing the appropriate technology will always depend on the context, factors, and characteristics of the project (e.g., the distance from the nearest internet point, the amount of data to be transmitted, among other factors [44]).
The second area is the nature of the software as the system requires real-time or near-real-time reporting. The microgrid monitoring system is being programmed as a web app and will operate from a server (local or in the cloud); the HTML standard [45] with CSS [46] will be used for the interface (frontend), and the PHP programming language [47] will be used for data management and software functions (backend).

4. Results and Discussion

Initially, according to the model developed, one of the challenges of the system is the selection of the correct sampling frequency for data collection. Since there are two different types of data—electrical and environmental—two approaches can be deployed.
The first one is to select one sampling frequency for all the data, and the second is to select two different sampling frequencies for each data type. The first approach is common and allows one to have all the information of the sensors in the same timestamp. For the second one, data will have more sampling points than the other. So, in some points, the data can be at different timestamps, but in terms of processing and storage, it could be the better approach.
The electrical power is a sine wave with 50/60 Hz of frequency and 120/240 V of amplitude. If the Nyquist theorem is applied [48], a sampling frequency of 100 Hz or 120 Hz must be selected. Since the system will be implemented in Colombia, 120 Hz was selected. In terms of storage size per sample, for the electrical data, 36 B was selected (Table 2). All the sizes were calculated based on the data type in MySQL [49].
In a second, for each node, with 120 samples, a storage size of 4.32 KB is needed. With the same sampling rate for the environmental data (Table 3), a sample will occupy 24 B of storage. In a second, with the same number of samples, 2.88 KB of storage is needed per node. Since both types of data must be gathered for the generator in a day of sampling, the storage size will be 622.080 MB. Nowadays, databases can handle large amounts of storage, but for a simple implementation involving one generator and two loads (only electrical data on the load) per day, 1.368 GB storage will be needed in the database. In this way, an analyses and decisions about the storage capacity can be made.
The second approach requires two different sample rates. If the Nyquist theorem is used for the electrical data, the sample rate is the same (120 Hz), and for the environmental data, a sample rate of 1 Hz can be used. This is because we can assume that the environmental variables will have more stable behaviour than the electrical ones. With both sample rates, with the same example of 1 generator and 2 loads in a day, 1.121 GB will be needed for storage.
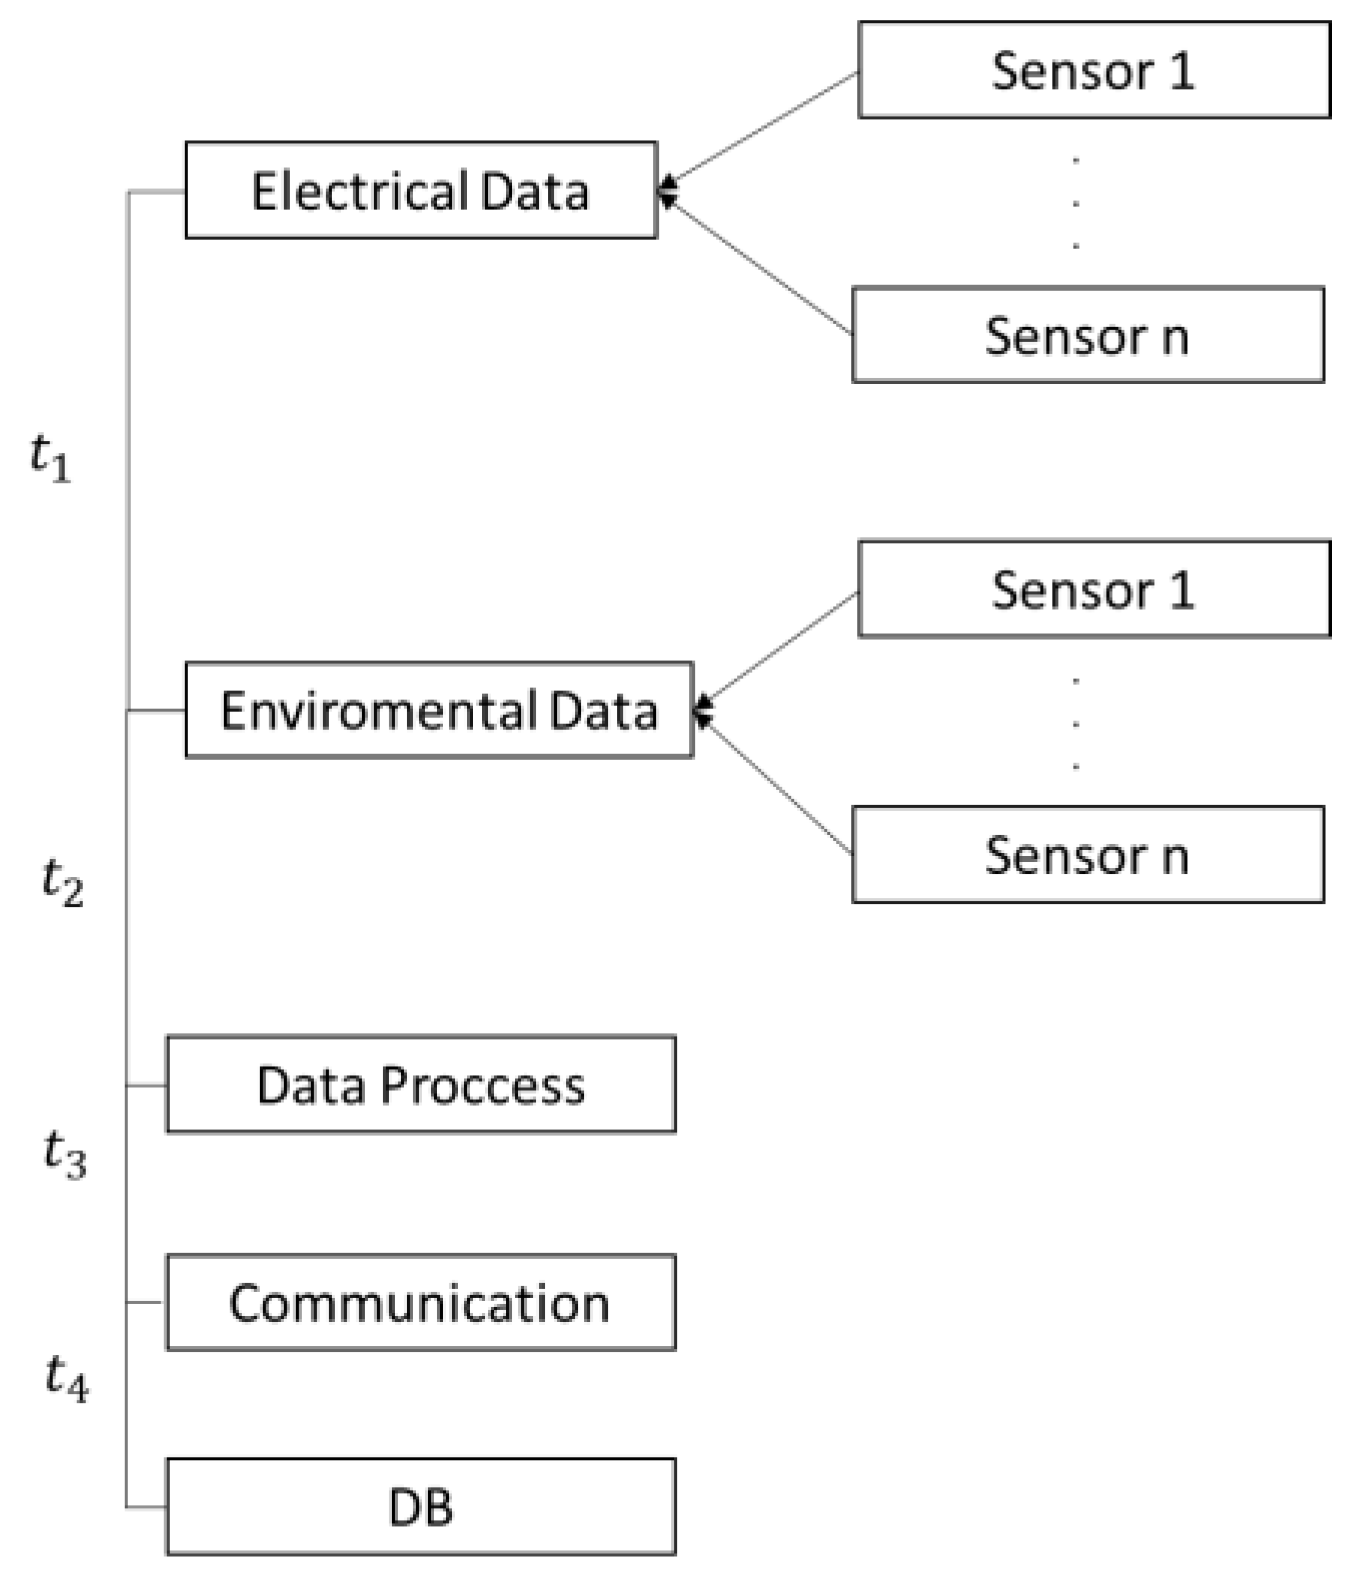
Therefore, the sampling frequency represents not only storage but also limits the time of the processing in the Arduino as a node. Figure 4 shows the process and the time that is needed to collect and store the data; the total time (1) must be less than the sample period (2).
T o t a l T i m e = 1 4 t n
T o t a l T i m e < 1 S a m p l e F r e q u e n c y
In both approaches, 120 Hz is the frequency that will set the limit. In this case, the TotalTime must be less than 8.33 mS.
On the other hand, it should be noted that the physical part of the smart monitoring and control system (IoT application shown in Figure 2 and Figure 3) is operating (all day every day) in Puerto Carreño, Vichada—a Non-Interconnected Zone in Colombia—specifically at the CINER (Centro de investigación de energías renovables), from which the photovoltaic system data set is obtained. The microgrid consists of two panels with a maximum capacity of 260 W and an inverter with a maximum capacity of 480 W connected to two 260 Ah batteries, which feed the energy laboratory of the CINER, in which the loads are variable depending on the use of the laboratory.
In this context, data analysis finds its application in different elements of the microgrid, such as green and renewable energies (wind, solar, marine), control, load management, and operation, using the data collected for better decision making and the reconfiguration of the microgrid (both physical and logical) to adjust to the needs of the microgrid [50].
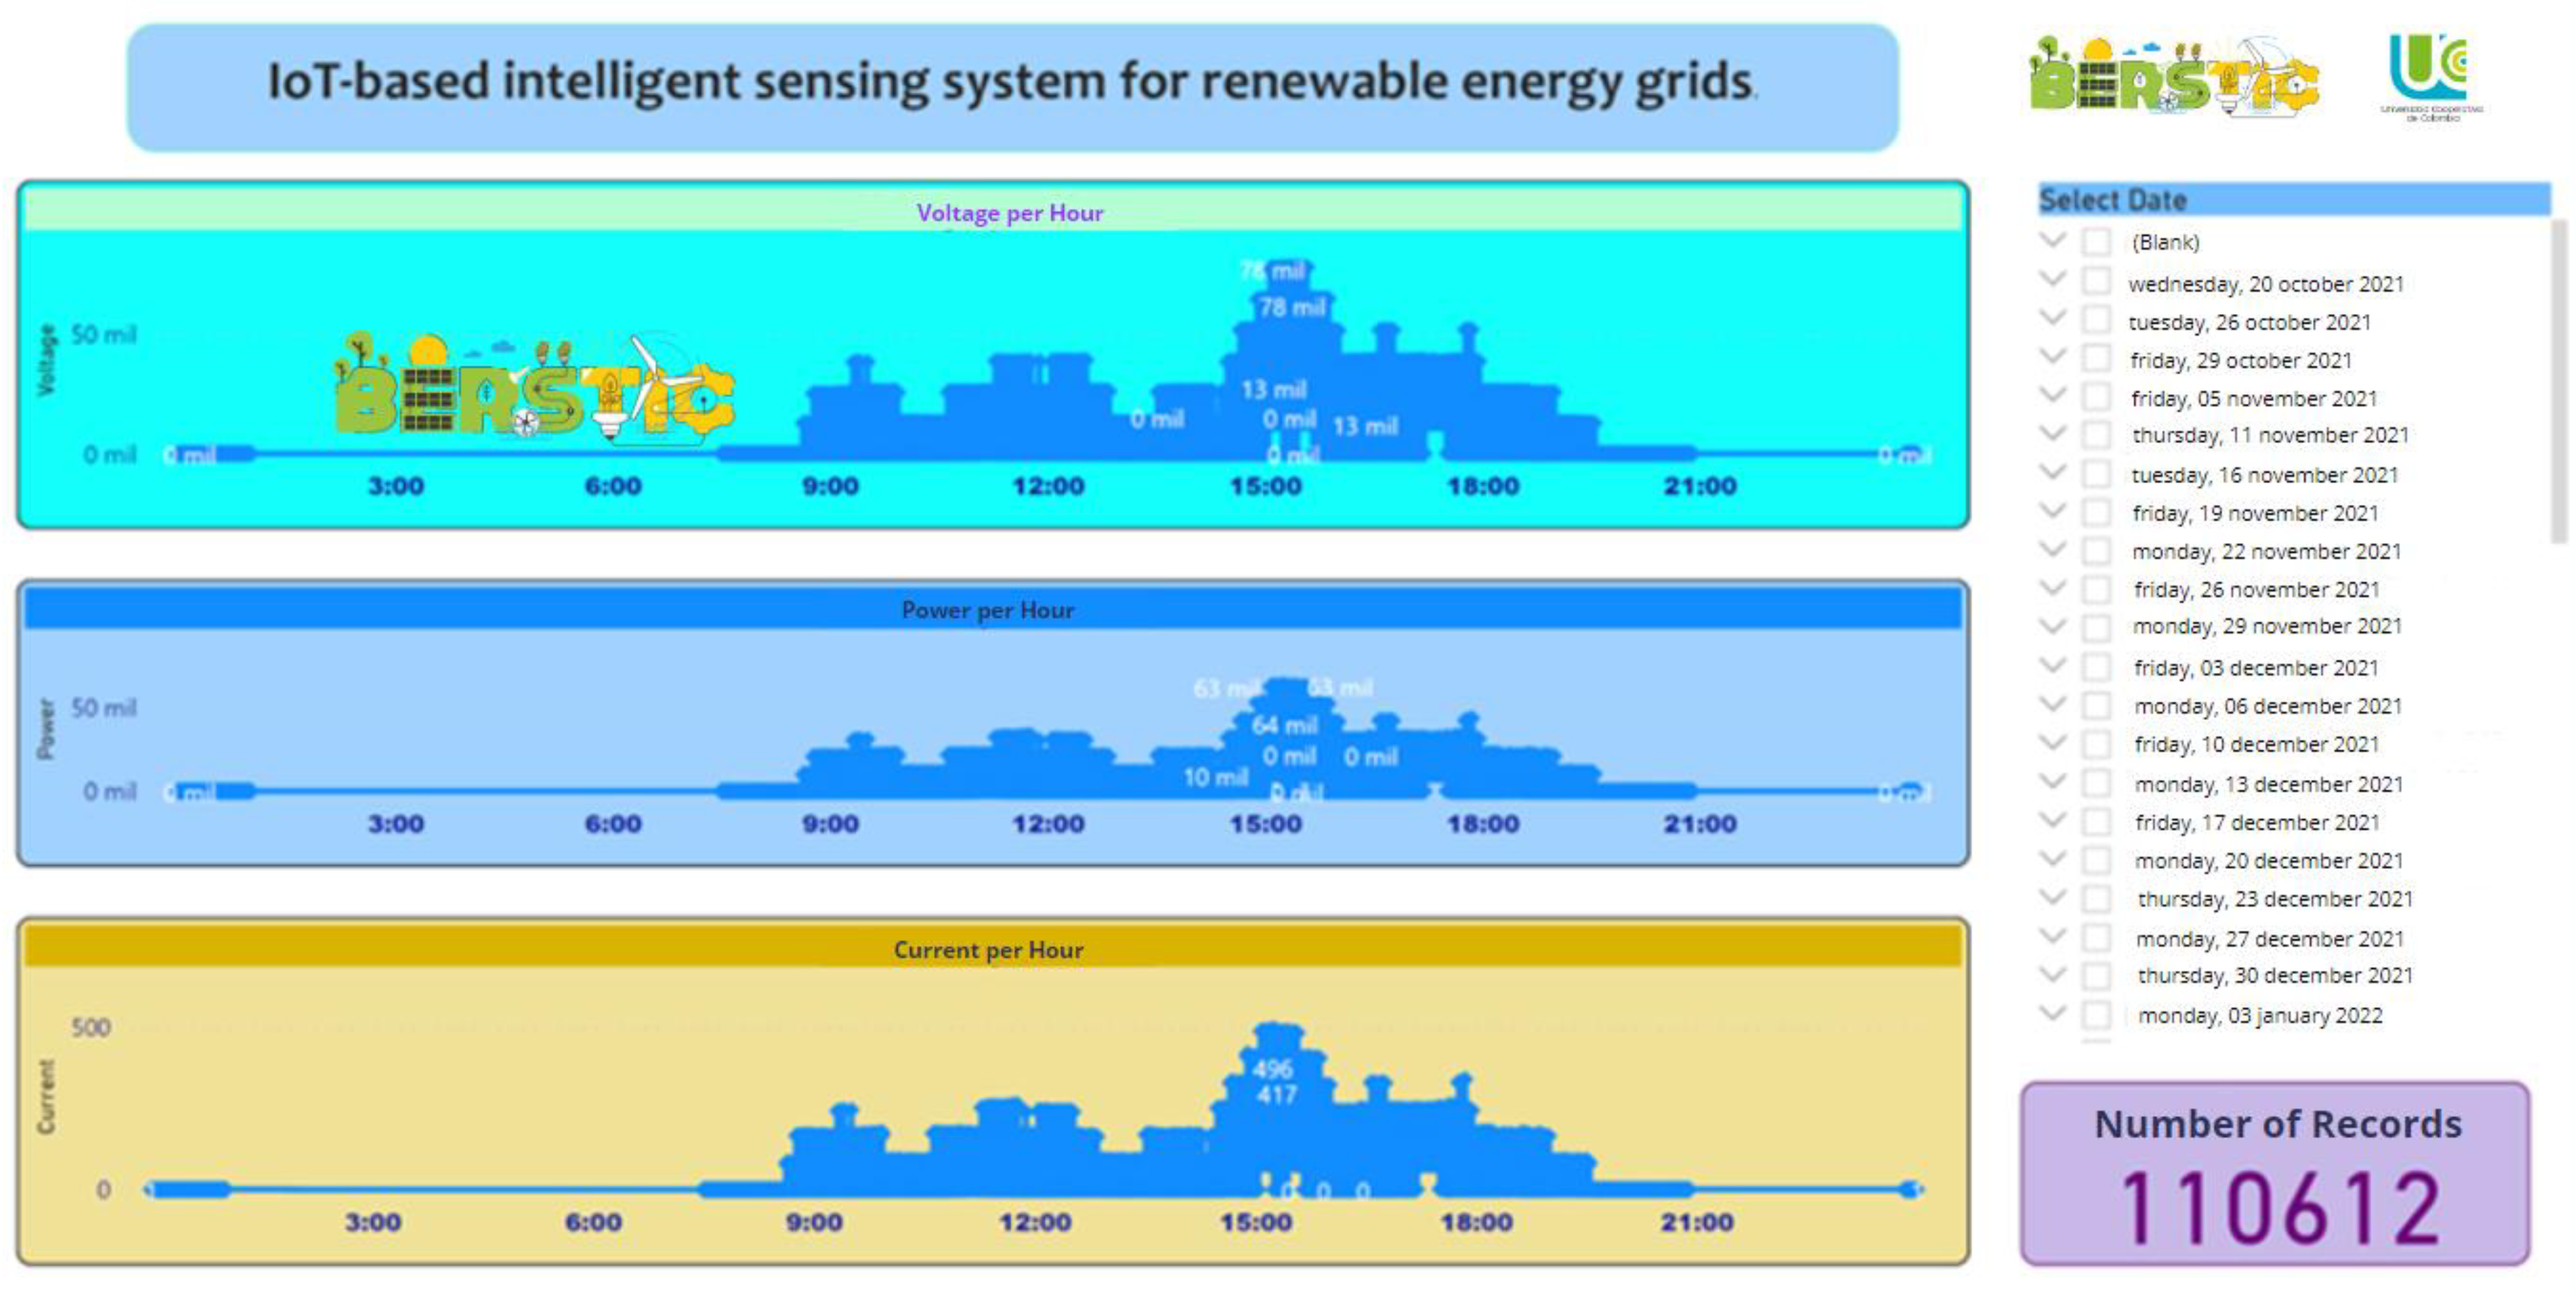
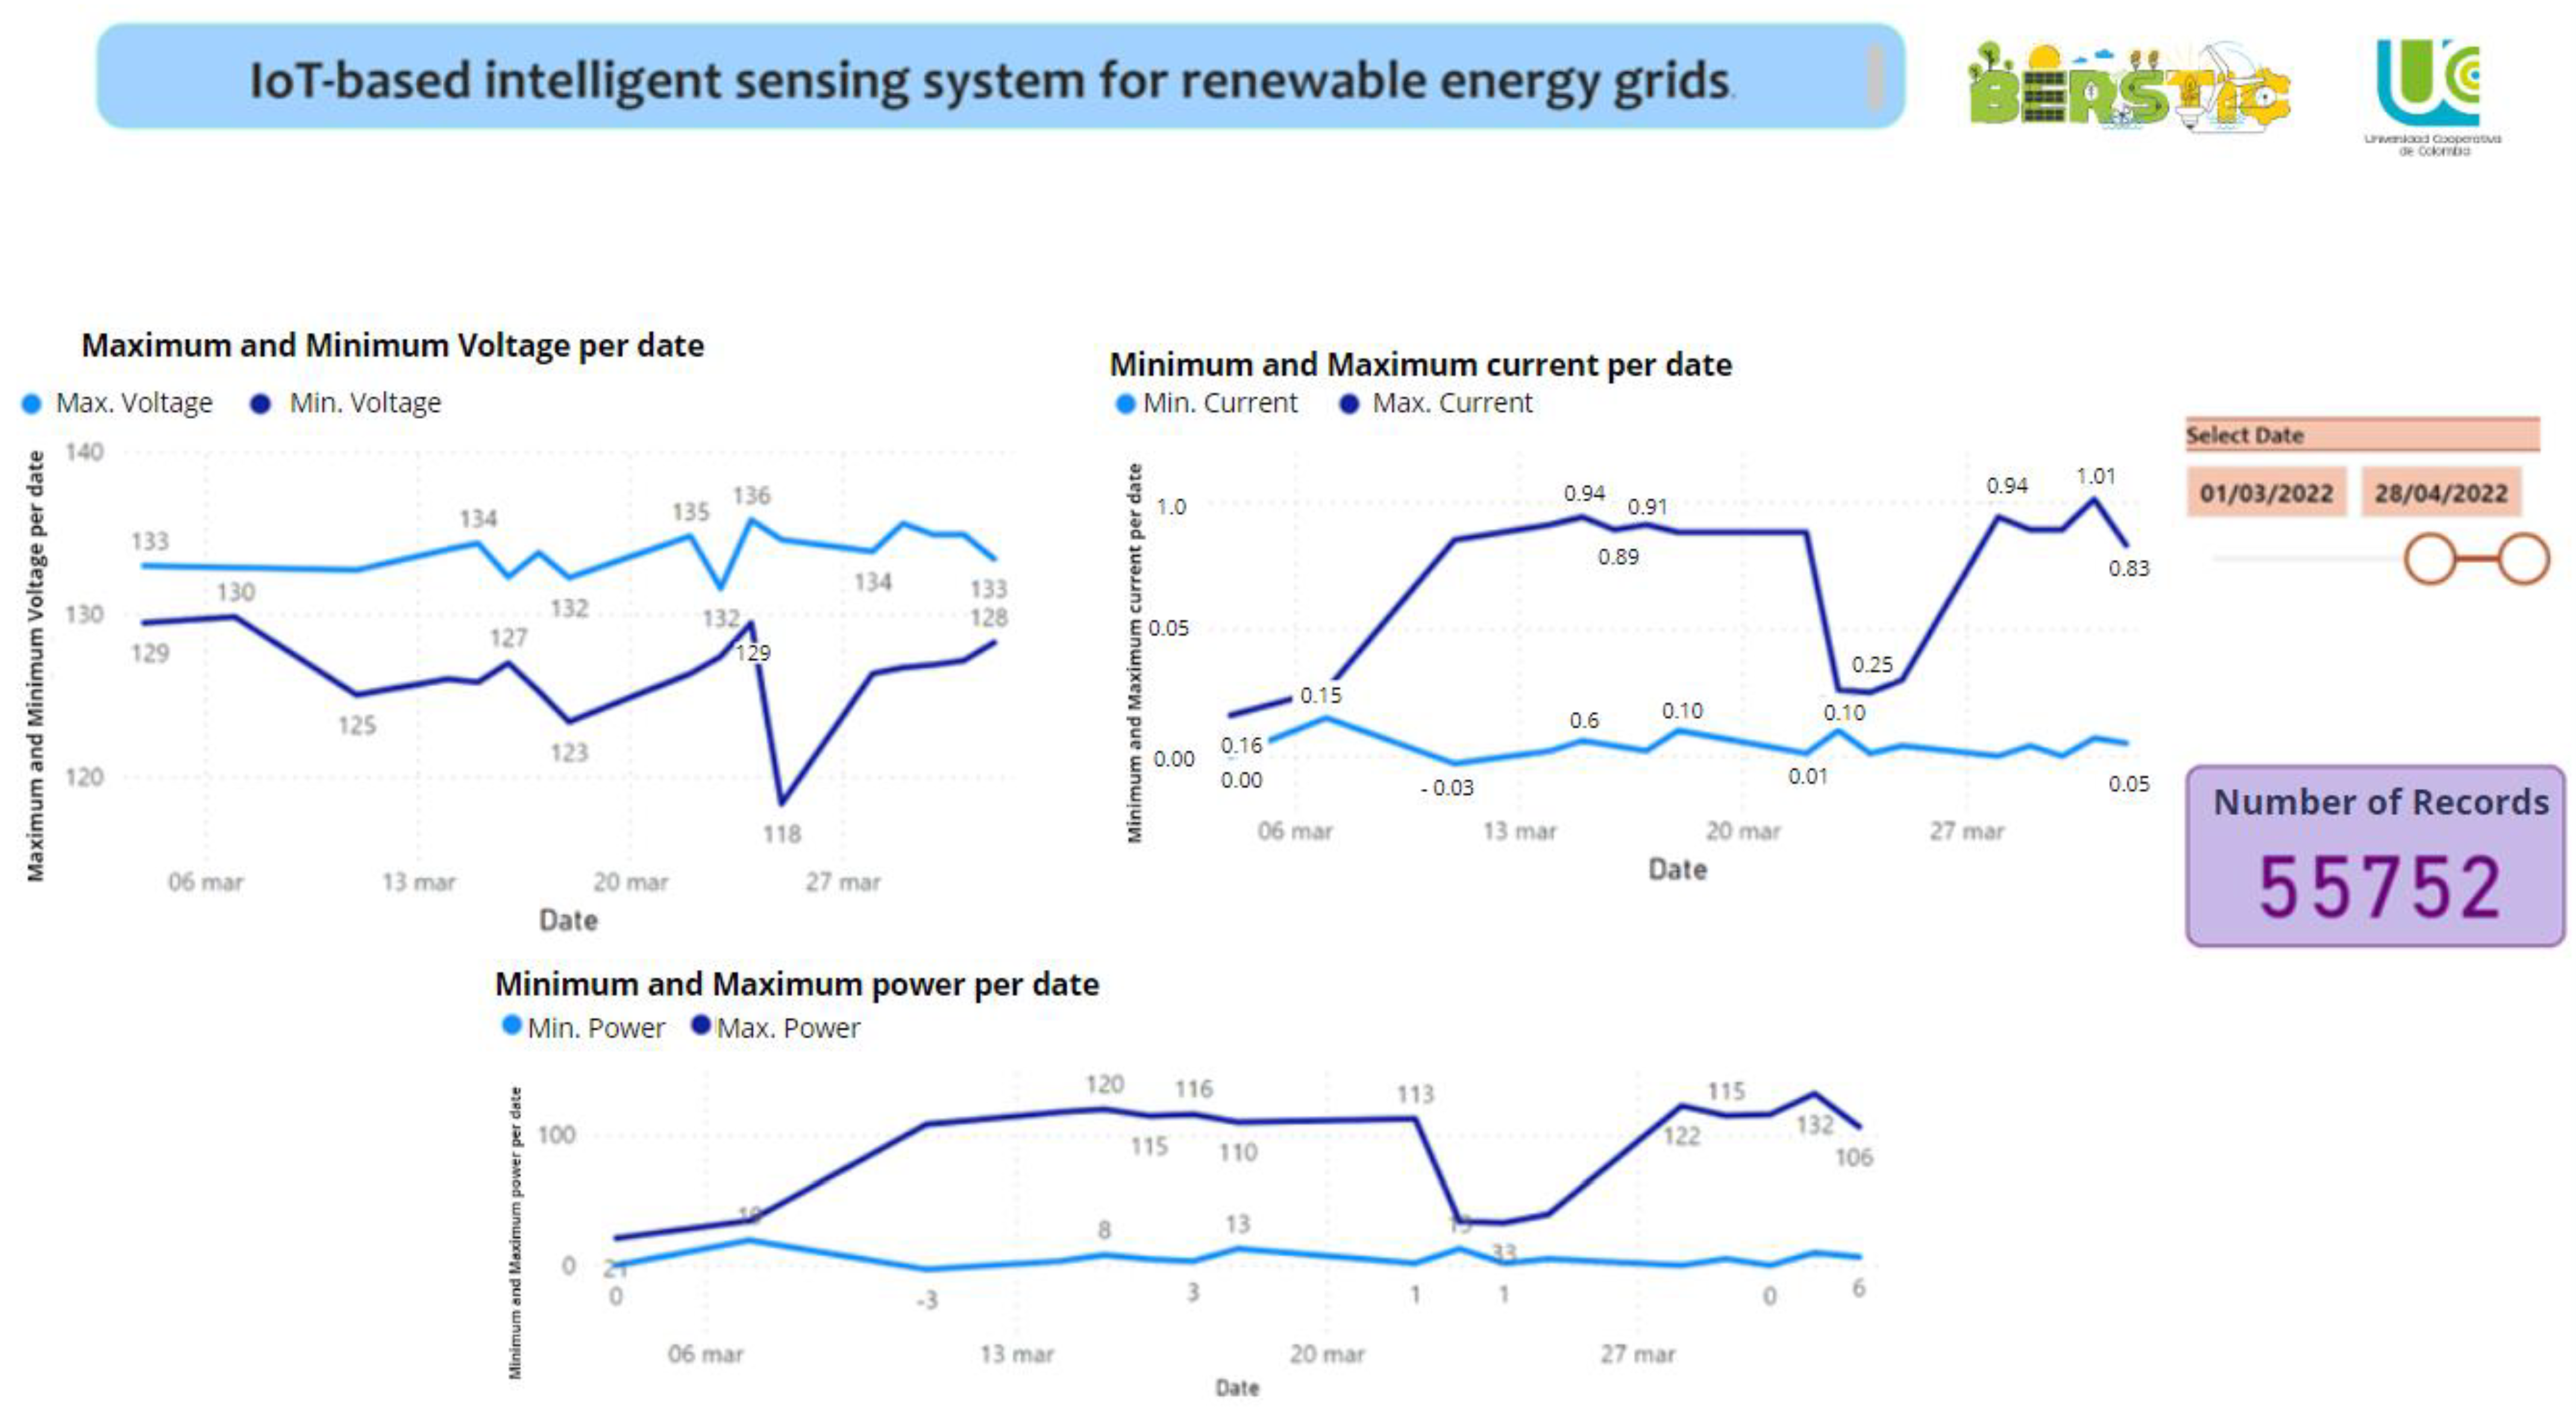
Figure 5 and Figure 6 show the results of visualising the data collected and analysed in a period of 6 months from the system in the aforementioned NIZs. All the data were imported into Power BI and organised according to the electrical value.
Therefore, for each value, it is possible to analyse the overall behaviour over the day and the minimum and maximum values. Since the measure is from the solar energy source, it is important to check if, at times, the voltage or the current drop can cause the system to malfunction. However, so far, the renewable energy generator is operating within its limits.
Some findings to note regarding this case study are as follows:
  • The prediction of energy generation and consumption from the analysis is possible and can be used for multiple purposes, including future production planning.
  • Sustainable and efficient network operation can be improved through the computational analysis of real-time data.
  • Evaluating the data flow of electrical signals, such as current, voltage, etc., allows to one monitor and analyse the power quality of the microgrid and identify errors in the sensors.
  • Energy technology monitoring and predictive failure analysis will enable predictive maintenance and make it possible to identify the actual degradation rates of the network components.
  • The analysis of consumption patterns will allow for the generation of sustainable business models for communities, which is an important factor for the self-sufficiency of these communities and their energy projects.
  • The discovery of value and knowledge about this NIZ will facilitate microgrid implementations in similar contexts.
  • Weather forecasts can be analysed to select the most appropriate energy generation technology.
  • The information generated supports feasibility studies of renewable energy projects for other NIZs.
Emphasising the remarkable merits of the proposed architecture compared to architectures described in the existing literature, the authors of [51] presented their research on the experimental validation of inverters (grid and stand-alone inverters) in laboratory-scale microgrids in the United States, which demonstrates the efficiency of inverters in microgrids disconnected from the main grid. In comparison to what is proposed in this article, our paper specifically addresses the implementation of smart microgrids in NIZs, a context particularly relevant for isolated regions of Colombia, and highlights the challenges and limitations of the proposed approach, such as the limited connectivity, geographical isolation, and technological barriers in these isolated regions, providing an in-depth understanding of the complexities of this environment. Furthermore, the proposed approach is based on a fundamental data structure to ensure the efficient and sustainable operation of microgrids in the selected NIZ. Appropriate functional and non-functional requirements, adapted to the context of Colombia, have also been established. However, one of the main limitations of this approach is the lack of extensive experimental validation in different regions of Colombia.

5. Conclusions

In this paper, we presented the relevant opportunities and challenges associated with alternative data-based smart grids for the specific case of Columbian NIZs, and in this paper, various relevant architectures in the literature and the corporate world have been analysed. The proposed model has been created and tested considering the characteristics, conditions, and limitations for the use case. The system has demonstrated good functionality on site, fulfilling the relevant requirements and considerably contributing to improving the techniques needed to apply this type of system to NIZs.
From a technical point of view, smart micro-networks pose challenges in security, data diversity, storage, and governance. These challenges offer research opportunities for developing countries. On the other hand, choosing the right sampling frequency is critical for design and cost, affecting node processing and storage requirements. In the initial phase, the system collects data from a renewable energy-based electrical grid, aiming to study and analyse all its variables. Subsequently, the system can be enhanced with actuators and autonomous decision-making algorithms. The results demonstrate uninterrupted 24/7 data collection, and the data architecture permits data exportation and analysis using tools such as Power BI.
On the other hand, it should be noted that NIZs present challenges associated with local social, cultural, and technological factors that mean that the system often must be tailored for the different contexts. This highlights the importance of working towards developing these often-forgotten areas, indigenous communities, and post-conflict zones. With an appropriate technological approach, it is possible to mitigate the social, environmental, and economic problems of these areas.
The novel contribution of this work lies in the fact that there are no data-driven architectures for the control of renewable energy microgrids in NIZs that consider the different challenges and limitations involved in the implementation of any smart system in isolated areas (connectivity, accessibility, acceptance, etc.). In this paper, a highly functional and efficient system that can be adapted for other areas with similar conditions around the world has been proposed.
Regarding future work, the introduction of stakeholder needs into the design requirements for service-oriented architecture enterprise systems, specifically a global CRM system—where there are similar issues that lead to the need for a ‘local needs-based’ framing of the microgrid tailoring process—has been planned (please refer to [52]). In addition, in terms of future work, it is thought that developing more advanced software will allow for better microgrid management for NIZs, and the development of simulations to validate the effectiveness of this architecture at different scales will be key in future work.

Author Contributions

Conceptualization, R.F.C.-Q. and K.E.S.; methodology, G.M.-G. and O.C.V.-R.; software, O.C.V.-R.; validation, R.F.C.-Q. and K.E.S.; formal analysis, M.B.-A. and G.M.-G.; investigation, R.F.C.-Q. and O.C.V.-R.; data curation, G.M.-G., O.C.V.-R. and M.B.-A.; writing—original draft preparation, G.M.-G. and O.C.V.-R.; writing—review and editing, M.B.-A. and K.E.S.; visualization, M.B.-A.; supervision, R.F.C.-Q.; project administration, R.F.C.-Q.; funding acquisition, R.F.C.-Q. All authors have read and agreed to the published version of the manuscript.

Funding

This work was supported by the project “Desarrollo de una herramienta computacional para la selección de sistemas energéticos optimizados a nivel del Costo Nivelado de Energía (LCoE) para Zonas No Interconectadas de Colombia” via grant number INV3300, funded by Universidad Cooperativa de Colombia under the call 100039 “Proyectos estratégicos con invitación externa 2022”.

Data Availability Statement

Data are contained within the article.

Conflicts of Interest

The authors declare no conflict of interest.

References

  1. DNP. Plan Nacional de Desarrollo 2018–2022; Departamento Nacional de Planeación: Bogotá, Colombia, 2018.
  2. Colmenares-Quintero, R.F.; Maestre-Gongora, G.; Baquero-Almazo, M.; Stansfield, K.E.; Colmenares-Quintero, J.C. Data Analysis of Electricity Service in Colombia’s Non-Interconnected Zones through Different Clustering Techniques. Energies 2022, 15, 7644. [Google Scholar] [CrossRef]
  3. Superintendencia de Servicios Públicos Domiciliarios Diagnóstico de la Prestación del Servicio de Energía Eléctrica.Zonas no Interconectadas-Zni 2018. Available online: https://www.superservicios.gov.co/sites/default/files/inline-files/diagnostico_de_la_prestacion_del_servicio_zni_-_07-11-2019-lo_1%20%281%29.pdf (accessed on 2 June 2023).
  4. Congreso de Colombia Ley 0855 de 2003. 2003. Available online: http://www.secretariasenado.gov.co/senado/basedoc/ley_0855_2003.html (accessed on 2 June 2023).
  5. BID Parte I Antecedentes y Marco Conceptual Del Análisis, Evaluación y Recomendaciones para la Implementación de Redes Inteligentes En Colombia. Smart Grids Colombia Vision 2016, 2030. Available online: https://www1.upme.gov.co/Paginas/Smart-Grids-Colombia-Visi%C3%B3n-2030.aspx (accessed on 2 June 2023).
  6. Zhou, K.; Fu, C.; Yang, S. Big Data Driven Smart Energy Management: From Big Data to Big Insights. Renew. Sustain. Energy Rev. 2016, 56, 215–225. [Google Scholar] [CrossRef]
  7. Mera-Paz, J.A. Gamificación una estrategia de fortalecimiento en el aprendizaje de la ingeniería de sistemas, experiencia significativa en la Universidad Cooperativa de Colombia sede Popayán. Rev. Científica 2016, 26, 3–11. [Google Scholar]
  8. Colmenares-Quintero, R.F.; Valderrama-Riveros, O.C.; Macho-Hernantes, F.; Stansfield, K.E.; Colmenares-Quintero, J.C. Renewable Energy Smart Sensing System Monitoring for Off-Grid Vulnerable Community in Colombia. Cogent Eng. 2021, 8, 1936372. [Google Scholar] [CrossRef]
  9. Khan, S.; Paul, D.; Momtahan, P.; Aloqaily, M. Artificial Intelligence Framework for Smart City Microgrids: State of the Art, Challenges, and Opportunities. In Proceedings of the 2018 Third International Conference on Fog and Mobile Edge Computing (FMEC), Barcelona, Spain, 23–26 April 2018; pp. 283–288. [Google Scholar]
  10. Pawar, P.; Vittal, K.P. Design and Development of Advanced Smart Energy Management System Integrated with IoT Framework in Smart Grid Environment. J. Energy Storage 2019, 25, 100846. [Google Scholar] [CrossRef]
  11. Babadi, A.N.; Nouri, S.; Khalaj, S. Challenges and Opportunities of the Integration of IoT and Smart Grid in Iran Transmission Power System. In Proceedings of the 2017 Smart Grid Conference (SGC), Tehran, Iran, 20–21 December 2017; pp. 1–6. [Google Scholar]
  12. Yaghmaee, M.H.; Hejazi, H. Design and Implementation of an Internet of Things Based Smart Energy Metering. In Proceedings of the 2018 IEEE International Conference on Smart Energy Grid Engineering (SEGE), Oshawa, ON, Canada, 12–15 August 2018; pp. 191–194. [Google Scholar]
  13. Saha, S.; Mondal, S.; Saha, A.; Purkait, P. Design and Implementation of IoT Based Smart Energy Meter. In Proceedings of the 2018 IEEE Applied Signal Processing Conference (ASPCON), Kolkata, India, 7–9 December 2018; pp. 19–23. [Google Scholar]
  14. Stusek, M.; Pokorny, J.; Masek, P.; Hajny, J.; Hosek, J. A Non-Invasive Electricity Measurement within the Smart Grid Landscape: Arduino-Based Visualization Platform for IoT. In Proceedings of the 2017 9th International Congress on Ultra Modern Telecommunications and Control Systems and Workshops (ICUMT), Munich, Germany, 6–8 November 2017; pp. 423–429. [Google Scholar]
  15. Choi, C.-S.; Jeong, J.-D.; Lee, I.-W.; Park, W.-K. LoRa Based Renewable Energy Monitoring System with Open IoT Platform. In Proceedings of the 2018 International Conference on Electronics, Information, and Communication (ICEIC), Honolulu, HI, USA, 24–27 January 2018; pp. 1–2. [Google Scholar]
  16. Tauqir, H.P.; Habib, A. Integration of IoT and Smart Grid to Reduce Line Losses. In Proceedings of the 2019 2nd International Conference on Computing, Mathematics and Engineering Technologies (iCoMET), Sukkur, Pakistan, 30–31 January 2019; pp. 1–5. [Google Scholar]
  17. Barman, B.K.; Yadav, S.N.; Kumar, S.; Gope, S. IOT Based Smart Energy Meter for Efficient Energy Utilization in Smart Grid. In Proceedings of the 2018 2nd International Conference on Power, Energy and Environment: Towards Smart Technology (ICEPE), Shillong, India, 1–2 June 2018; pp. 1–5. [Google Scholar]
  18. Alhebshi, F.; Alnabilsi, H.; Alzebaidi, J.; Bensenouci, A.; Brahimi, T.; Bensenouci, M.-A. Monitoring the Operation of Transmission Line in a Smart Grid System through IoT. In Proceedings of the 2018 15th Learning and Technology Conference (L&T), Jeddah, Saudi Arabia, 25–26 February 2018; pp. 139–146. [Google Scholar]
  19. Pathak, K.S.; Darbari, M.; Yagyasen, D.; Ahmed, H. Making Renewable Energy SMART Using Internet of Things (IOT). In Proceedings of the 2014 International Conference on Advances in Engineering & Technology Research (ICAETR 2014), Unnao, India, 1–2 August 2014; pp. 1–4. [Google Scholar]
  20. Nayanatara, C.; Divya, S.; Mahalakshmi, E.K. Micro-Grid Management Strategy with the Integration of Renewable Energy Using IoT. In Proceedings of the 2018 International Conference on Computation of Power, Energy, Information and Communication (ICCPEIC), Chennai, India, 28–29 March 2018; pp. 160–165. [Google Scholar]
  21. Tu, C.; He, X.; Shuai, Z.; Jiang, F. Big Data Issues in Smart Grid—A Review. Renew. Sustain. Energy Rev. 2017, 79, 1099–1107. [Google Scholar] [CrossRef]
  22. Wilcox, T.; Jin, N.; Flach, P.; Thumim, J. A Big Data Platform for Smart Meter Data Analytics. Comput. Ind. 2019, 105, 250–259. [Google Scholar] [CrossRef]
  23. Diamantoulakis, P.D.; Kapinas, V.M.; Karagiannidis, G.K. Big Data Analytics for Dynamic Energy Management in Smart Grids. Big Data Res. 2015, 2, 94–101. [Google Scholar] [CrossRef]
  24. Sagiroglu, S.; Terzi, R.; Canbay, Y.; Colak, I. Big Data Issues in Smart Grid Systems. In Proceedings of the 2016 IEEE International Conference on Renewable Energy Research and Applications (ICRERA), Birmingham, UK, 20–23 November 2016; IEEE: Piscataway, NJ, USA, 2016; pp. 1007–1012. [Google Scholar]
  25. Power, D.J. ‘Big Data’ Decision Making Use Cases. In Proceedings of the Decision Support Systems V—Big Data Analytics for Decision Making; Delibašić, B., Hernández, J.E., Papathanasiou, J., Dargam, F., Zaraté, P., Ribeiro, R., Liu, S., Linden, I., Eds.; Springer International Publishing: Cham, Switzerland, 2015; pp. 1–9. [Google Scholar]
  26. Chang, W.L.; Mishra, S.; NBD-PWG NIST Big Data Public Working Group. NIST Big Data Interoperability Framework: Volume 5, Architectures White Paper Survey; NIST: Gaithersburg, MD, USA, 2015. [Google Scholar]
  27. Kou, L.; Wu, J.; Zhang, F.; Ji, P.; Ke, W.; Wan, J.; Liu, H.; Li, Y.; Yuan, Q. Image Encryption for Offshore Wind Power Based on 2D-LCLM and Zhou Yi Eight Trigrams. Int. J. Bio-Inspired Comput. 2023, 22, 53–64. [Google Scholar] [CrossRef]
  28. Zarzycki, K.; Chaber, P.; Cabaj, K.; Ławryńczuk, M.; Marusak, P.; Nebeluk, R.; Plamowski, S.; Wojtulewicz, A. Forgery Cyber-Attack Supported by LSTM Neural Network: An Experimental Case Study. Sensors 2023, 23, 6778. [Google Scholar] [CrossRef] [PubMed]
  29. Gutub, A. Boosting Image Watermarking Authenticity Spreading Secrecy from Counting-Based Secret-Sharing. CAAI Trans. Intell. Technol. 2023, 8, 440–452. [Google Scholar] [CrossRef]
  30. Labrinidis, A.; Jagadish, H.V. Challenges and Opportunities with Big Data. Proc. VLDB Endow. 2012, 5, 2032–2033. [Google Scholar] [CrossRef]
  31. Mohammad, A.; Mcheick, H.; Grant, E. Big Data Architecture Evolution: 2014 and Beyond. In Proceedings of the Fourth ACM International Symposium on Development and Analysis of Intelligent Vehicular Networks and Applications; Association for Computing Machinery: New York, NY, USA, 2014; pp. 139–144. [Google Scholar]
  32. Bilal, M.; Oyedele, L.O.; Akinade, O.O.; Ajayi, S.O.; Alaka, H.A.; Owolabi, H.A.; Qadir, J.; Pasha, M.; Bello, S.A. Big Data Architecture for Construction Waste Analytics (CWA): A Conceptual Framework. J. Build. Eng. 2016, 6, 144–156. [Google Scholar] [CrossRef]
  33. Zhang, Y.; Huang, T.; Bompard, E.F. Big Data Analytics in Smart Grids: A Review. Energy Inform. 2018, 1, 8. [Google Scholar] [CrossRef]
  34. IPSE. FAQ—Información Institucional. Available online: https://ipse.gov.co/mapa-del-sitio/ipse-scucha-atencion-al-ciudadano/foros-faq/ (accessed on 10 April 2020).
  35. IPSE. In Caracterización Energética de Las ZNI—IPSE-CNM. Available online: https://ipse.gov.co/cnm/caracterizacion-de-las-zni/ (accessed on 13 February 2023).
  36. Naderi, E.; Asrari, A. Experimental Validation of a Remedial Action via Hardware-in-the-Loop System Against Cyberattacks Targeting a Lab-Scale PV/Wind Microgrid. IEEE Trans. Smart Grid 2023, 14, 4060–4072. [Google Scholar] [CrossRef]
  37. Naderi, E.; Asrari, A. Detection of False Data Injection Cyberattacks: Experimental Validation on a Lab-Scale Microgrid. In Proceedings of the 2022 IEEE Green Energy and Smart System Systems (IGESSC), Long Beach, CA, USA, 7–8 November 2022; pp. 1–6. [Google Scholar]
  38. International Electrotechnical Commission. IoT 2020: Smart and Secure IoT Platform; Technical Report; International Electrotechnical Commission: Geneva, Switzerland, 2020. [Google Scholar]
  39. Arduino. Arduino—Home. Available online: https://www.arduino.cc/ (accessed on 2 June 2023).
  40. Raspberry Pi Foundation Teach, Learn, and Make with Raspberry Pi–Raspberry Pi. 2021. Available online: https://www.raspberrypi.org/ (accessed on 17 February 2020).
  41. 802.3-2005; IEEE Standard for Information Technology—Local and Metropolitan Area Networks—Specific Requirements—Part 3: Carrier Sense Multiple Access with Collision Detection (CSMA/CD) Access Method and Physical Layer Specifications. IEEE: Piscataway, NJ, USA, 2008.
  42. 802.11-2016; IEEE Standard for Information Technology--Telecommunications and Information Exchange between Systems Local and Metropolitan Area Networks--Specific Requirements—Part 11: Wireless LAN Medium Access Control (MAC) and Physical Layer (PH). IEEE: Piscataway, NJ, USA, 2016.
  43. 802.15.4-2011; IEEE Standard for Local and Metropolitan Area Networks--Part 15.4: Low-Rate Wireless Personal Area Networks (LR-WPANs). IEEE: Piscataway, NJ, USA, 2011.
  44. Ding, J.; Nemati, M.; Ranaweera, C.; Choi, J. IoT Connectivity Technologies and Applications: A Survey. IEEE Access 2020, 8, 67646–67673. [Google Scholar] [CrossRef]
  45. HTML. HTML Standard. Available online: https://html.spec.whatwg.org/ (accessed on 2 June 2023).
  46. CSS. CSS: Cascading Style Sheets|MDN. Available online: https://developer.mozilla.org/en-US/docs/Web/CSS (accessed on 2 June 2023).
  47. PHP. PHP: Hypertext Preprocessor. Available online: https://www.php.net/index.php (accessed on 2 June 2023).
  48. Oppenheim, A.V.; Willsky, A.S.; Nawab, S.H.; Ding, J.-J. Signals and Systems; Prentice Hall: Upper Saddle River, NJ, USA, 1997; Volume 2. [Google Scholar]
  49. MySQL. MySQL. Available online: https://www.mysql.com/ (accessed on 2 June 2023).
  50. Moharm, K. State of the Art in Big Data Applications in Microgrid: A Review. Adv. Eng. Inform. 2019, 42, 100945. [Google Scholar] [CrossRef]
  51. Naderi, E.; Asrari, A. Experimental Validation of Grid-Tied and Standalone Inverters on a Lab-Scale Wind-PV Microgrid. In Proceedings of the 2021 IEEE International Power and Renewable Energy Conference (IPRECON), Kollam, India, 24–26 September 2021; pp. 1–6. [Google Scholar]
  52. Stansfield, K.; Cole, J.; Mazur, G.H. Complex IT Design Using Both Traditional QFD and Blitz QFD. In Proceedings of the 16th International & 22nd N. American Symposium on Quality Function Deployment; 2010. [Google Scholar]
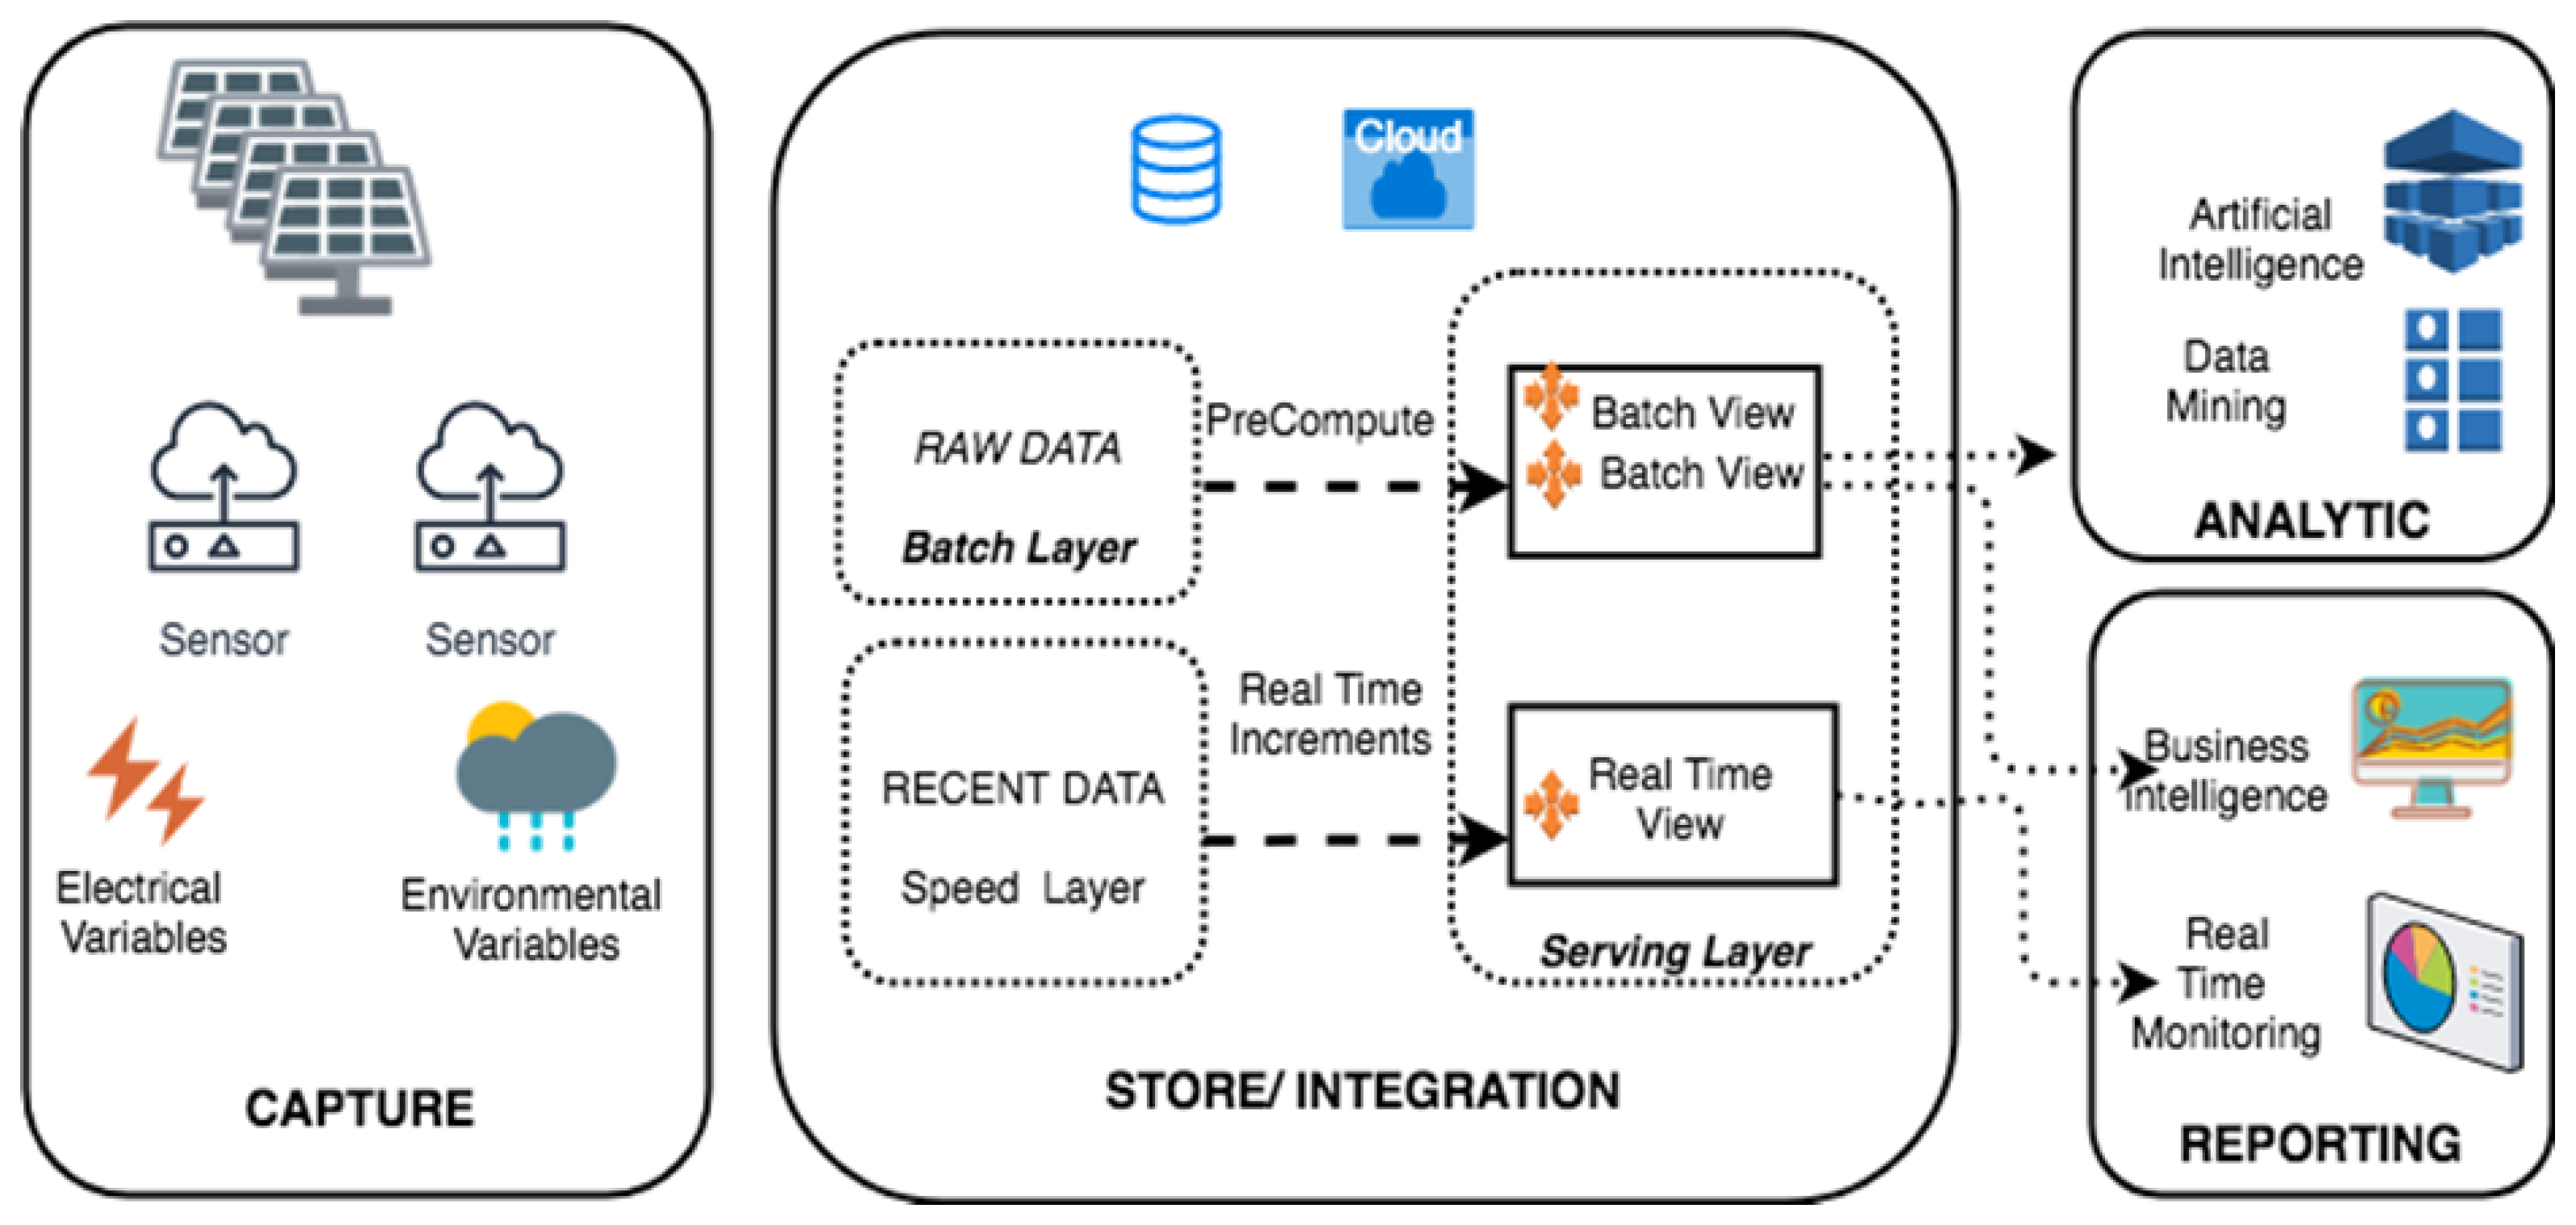
Figure 1. Reference model proposed for the case study.
Energies 16 07900 g001
Figure 2. Proposed System.
Energies 16 07900 g002
Figure 3. Black box model.
Energies 16 07900 g003
Figure 4. Sampling calculation for data collection.
Energies 16 07900 g004
Figure 5. Report on overall electrical values in a day.
Energies 16 07900 g005
Figure 6. Minimum and maximum values over time.
Energies 16 07900 g006
Table 1. Challenges in the stages of data management for smart grids.
ReferenceCapture and StorageProcessingAnalysis and Visualisation
[30]Sensor networks produce big amounts of raw data.
Often, the information collected will not be in ready for testing.
There are many ways to store the same information, but not everyone is the best.The ability to analyse big data is of limited value if users cannot understand the analysis.
[31]Various electronic devices accumulate increasing data.
Opportunities for building infrastructure with servers, storage, middleware.
High-performance computing application usability.
Large information management.
Development of data visualisation.
Traceability assessments.
[32]The data sets are very complex, voluminous, heterogeneous, and incomplete.Storing data sets using traditional technologies and subjecting the data to real-time processing for sophisticated analysis is a very challenging proposition.Using big data’s advanced technologies to manage and analyse data of unprecedented size.
[21]It is essential to find a fusion method for the multi-source data set, which has different modalities, formats, and representations.For some applications, such as fault detection and transient oscillation detection, the reaction time scale is in milliseconds.Visualisations can show explicit and granular changes in voltage and frequency. However, finding and representing correlations or trends between data from multiple sources is a major challenge.
[33]Include different types of unstructured data: messages, videos, voice recordings, images, social media data.
Measurement errors in the intelligent network due to device imperfections or errors in data transmission.
The volume of data generated is too large to be stored and analysed using traditional database technology.
Quality and accuracy are less reliable on big data.
The requirements for real-time data exchange are increasing.
The higher the amount of data, the lower the density of valuable information.
Table 2. Electrical data storage size.
VariablesTypeSize (B)
id_electricalint unsigned4
id_nodeint unsigned4
timestamp_electricalTIMESTAMP4
voltageFloat4
currentFloat4
apparental_powerFloat4
power_factorFloat4
reactive_powerFloat4
real_powerFloat4
TOTAL 36
Table 3. Environmental data storage size.
VariablesTypeSize (B)
id_environmentalint unsigned4
id_nodeint unsigned4
temperatureFloat4
ath_presuureFloat4
humidityFloat4
uvFloat4
TOTAL 24
Disclaimer/Publisher’s Note: The statements, opinions and data contained in all publications are solely those of the individual author(s) and contributor(s) and not of MDPI and/or the editor(s). MDPI and/or the editor(s) disclaim responsibility for any injury to people or property resulting from any ideas, methods, instructions or products referred to in the content.