Article

Numerical Study of the Influence of Different Bending Shapes on the Heat Transfer Characteristics of Annular Cross Wavy Primary Surface Recuperator (CW-PSR)

1
School of Energy Science and Engineering, Harbin Institute of Technology, Harbin 150006, China
2
Science and Technology on Thermal Energy and Power Laboratory, Wuhan 430205, China
3
School of Architecture, Harbin Institute of Technology, Harbin 150006, China
*
Author to whom correspondence should be addressed.
Energies 2023, 16(24), 7977; https://doi.org/10.3390/en16247977
Submission received: 26 October 2023 / Revised: 30 November 2023 / Accepted: 5 December 2023 / Published: 8 December 2023
(This article belongs to the Special Issue Heat Transfer and Advanced Combustion in Gas Turbines)

Abstract

:
The cross-wave primary surface recuperator (CW-PSR) is a dependable option as a recuperator for micro gas turbines (MGT). The micro CW-PSR studied in this paper is composed of 171 stacked curved plates, with each plate containing 33 micro heat transfer channels with equivalent diameters of less than 1 mm. In this study, the influence of bending curvature on the thermal performance of CW-PSR plates is investigated through three-dimensional numerical simulation with fluid–solid–thermal coupling. The results indicate that the variation in bending curvature studied can result in a noteworthy 8% difference in the total heat transfer coefficient of CW-PSR plates. A direct correlation between heat transfer capacity and secondary flow strength is derived mathematically, explaining the mechanism by which secondary flow enhances heat transfer. By employing this relationship, a comprehensive analysis of CW-PSR plates with diverse bending curvatures is conducted, effectively showcasing how curvature influences the secondary flow pattern and enhances the channel’s heat transfer capacity. In addition, this paper considers the comprehensive influence of the size parameters of the heat transfer unit and the bending curvature of the heat transfer plate on the heat transfer and flow characteristics of the CW-PSR, and a dominant mathematical expression is obtained, which can be used for the design of similar heat exchangers of the same type.

1. Introduction

A micro gas turbine (MGT) has a high energy density, about 12 kW·h/kg, which can be used as one of the reliable choices of micro mobile power [1,2,3]. However, the thermal efficiency of the MGT using the basic cycle is low, usually less than 20%. By introducing the recuperator, the high-temperature exhaust gas at the turbine outlet can be effectively used to improve the inlet temperature of the combustion chamber, so as to greatly reduce the fuel consumption rate and improve the thermal efficiency to more than 30% on the premise of ensuring compactness and lightweight [4]. Figure 1 shows the thermal cycle diagram of MGT with the regenerative cycle studied in this paper.
In order to realize the recuperator with a more compact structure, a larger heat transfer area and higher heat transfer efficiency, Utriainen and Sundén et al. [5] first proposed the trapezoidal cross wavy (TCW) duct concept and studied its heat transfer characteristics and pressure drop characteristics. Compared with the straight tube recuperator, it was found that the Nusselt number (Nu) of the TCW recuperator increases by about 400%, and the fanning friction coefficient (f) increases with the increase of Reynolds number (Re). In order to further study the application of different primary surface recuperators (PSRs) in MGTs, the thermal and hydraulic performance of cross-corrugated (CC), cross-wavy (CW), cross-undulated (CU), and plate-fin recuperators are studied. The CW-PSR and the CC-PSR show superior performance over the others, giving a small volume and weight of the heat transfer matrix, but they finally thought that the CC-PSR should be the first choice because it is easier to manufacture with small passage dimensions. Nevertheless, the manufacturing and operating experience of the engineers of Capstone shows that there are no problems in the manufacturing of CW-PSR [4].
Wang et al. [6] believe that CW-PSR is the best compromise scheme after considering heat transfer and pressure drop characteristics for different types of MGT recuperators. Many scholars have done a lot of work on its thermal and hydraulic performance through numerical simulation. Du et al. [7,8] applied the multi-period boundary condition and the linear decreasing boundary of wall temperature to the numerical simulation of single channels of CW-PSR. By comparing the simulation results of different structural channels, they pointed out the relationship between comprehensive performance and geometric parameters. Ma et al. [9,10] presented a numerical model for heat transfer with anisotropic characteristics, aiming to investigate how the local heat field of the individual channel in CW-PSR is affected by small-scale longitudinal heat conduction. Xi et al. [11] established a three-dimensional fluid–solid coupling heat transfer model considering the interaction of high-temperature hot gas and compressed cold air based on the half wall thickness multi-periodic boundary conditions to predict the flow and heat transfer in a single channel of CW-PSR. The correlation between Re, Prandtl number (Pr), geometric parameters and Nu was established by using the least square method, which provided a basis for the design of CW-PSR. Based on a genetic algorithm, Giugno et al. [12] analyzed the uncertainty of design parameters of plate-fin recuperator and CW-PSR through different probability methods. Cai et al. [13] solved the optimization problem of CW-PSR of MGT with an involute cross-section shape by genetic algorithm and applied the developed method to the optimization design of a CW-PSR of 300 kW power stage MGT. In the MGT, in order to make the CW-PSR surround the rotor system and the outer side of the combustion chamber in an annular shape, it is necessary to bend each CW-PSR plate into a curved shape. Involute is one of the most widely used bending forms at present. After the CW-PSR plate is bent, there will be a great divergence between the heat transfer characteristics calculated by the traditional single channel and the actual heat transfer characteristics of the whole bent plate. Yang et al. [14] demonstrated the above problems in a recent study.
In CW-PSR, the flow direction is constantly changed by the cross-ripple change of the geometry to form a large-scale secondary flow structure in the heat exchange channel, which can be used to enhance the flow heat exchange. In fact, inducing secondary fluid flow to enhance heat transfer is currently a very common method of heat transfer intensification. Johnson and Joubert [15] conducted research on cyclic heat exchangers incorporating vortex generators, providing groundbreaking insights into the practical implementation of augmenting secondary heat transfer. Fiebig et al. [16] discovered that the longitudinal vortex, positioned perpendicular to the main flow direction, surpasses other secondary flow structures in enhancing heat transfer efficiency while concurrently achieving a more substantial reduction in pressure loss. Tiggelbeck [17], Biswas [18], Tori [19] investigated the configuration of vortices induced by delta vortex generators and quantified the wake vortices produced by an individual delta vortex generator on the plate through the application of the rotary probe technique. Emphasized that the longitudinal vortex generated by the delta-wing vortex generator predominantly comprises the primary vortex, angular vortex, and induced vortex, serving a crucial function in amplifying fluid disturbance and facilitating heat transfer. Fiebig [20,21] and Biswas [22] researched the implementation of a vortex generator to improve heat transfer efficiency between staggered circular tube fin heat exchangers and tube fin heat exchangers, subsequently contrasting the impact on secondary heat transfer performance. Beyond the aforementioned investigations, contemporary research indicates that methods augmenting heat transfer through longitudinal vortices exhibit dependable applicability in fin tube [23], heat transfer [24], vortex tube [25], liquid metal [26], and twisted tube [27,28,29].
In this paper, the heat transfer mechanism of a CW-PSR plate composed of 33 CW channels with an equivalent diameter of less than 1 mm is studied. CW-PSR plates with different bending shapes are used for research, including circular arc shapes with curvatures of 0.167, 0.2, and 0.25, as well as involute and cycloidal shapes. The difference in heat transfer coefficient of different bending shapes is compared, and the mechanism of bending curvature affecting the heat transfer performance by affecting the secondary flow mode of the channel is further clarified. Moreover, a rigorous mathematical derivation is employed to establish the relationship between heat transfer efficiency and the secondary flow pattern. Findings revealed that the angle between the temperature gradient vector and the vorticity vector directly impacts heat transfer efficiency. This assertion is substantiated through a comprehensive analysis of the fluid dynamics and thermal characteristics within an individual heat transfer channel, as well as across the entirety of the CW-PSR plate’s channels. Finally, by combining the experimental design method and machine learning method, the influence of the heat transfer unit size and the bending curvature on the heat transfer and flow characteristics are considered, and the explicit logical relation is given. The results can be used for the design of the same type of heat exchanger.

2. The Physical Model of CW-PSR

The physical model of the CW-PSR is illustrated in Figure 2. This recuperator is applied to a previously designed and developed micro gas turbine with an output power of 7 kW, and relevant information about this micro gas turbine can be found in the reference [30]. This CW-PSR consists of 171 plates arranged in involute or other forms of stacking to form a circular ring, as depicted in Figure 2b. Figure 2a presents the configuration of a single CW-PSR plate, wherein each plate encompasses a set of air passages. The flow direction within these air passages is indicated by blue arrows in the diagram, while the red arrows represent the gas passages. The gas flows over the upper and lower surfaces of the CW-PSR plates, where the channels are exposed. Complete gas passages are formed only when adjacent CW-PSR plates are welded together. It can be approximately understood that each of the upper and lower surfaces of the CW-PSR plates contains half of a set of gas passages, while the middle contains a set of air passages. As observed in Figure 2a, the inlet and outlet of the air passages are both on the inner diameter of the recuperator, whereas the inlet and outlet of the gas passages are located at the forward and backward sections of the recuperator, respectively.
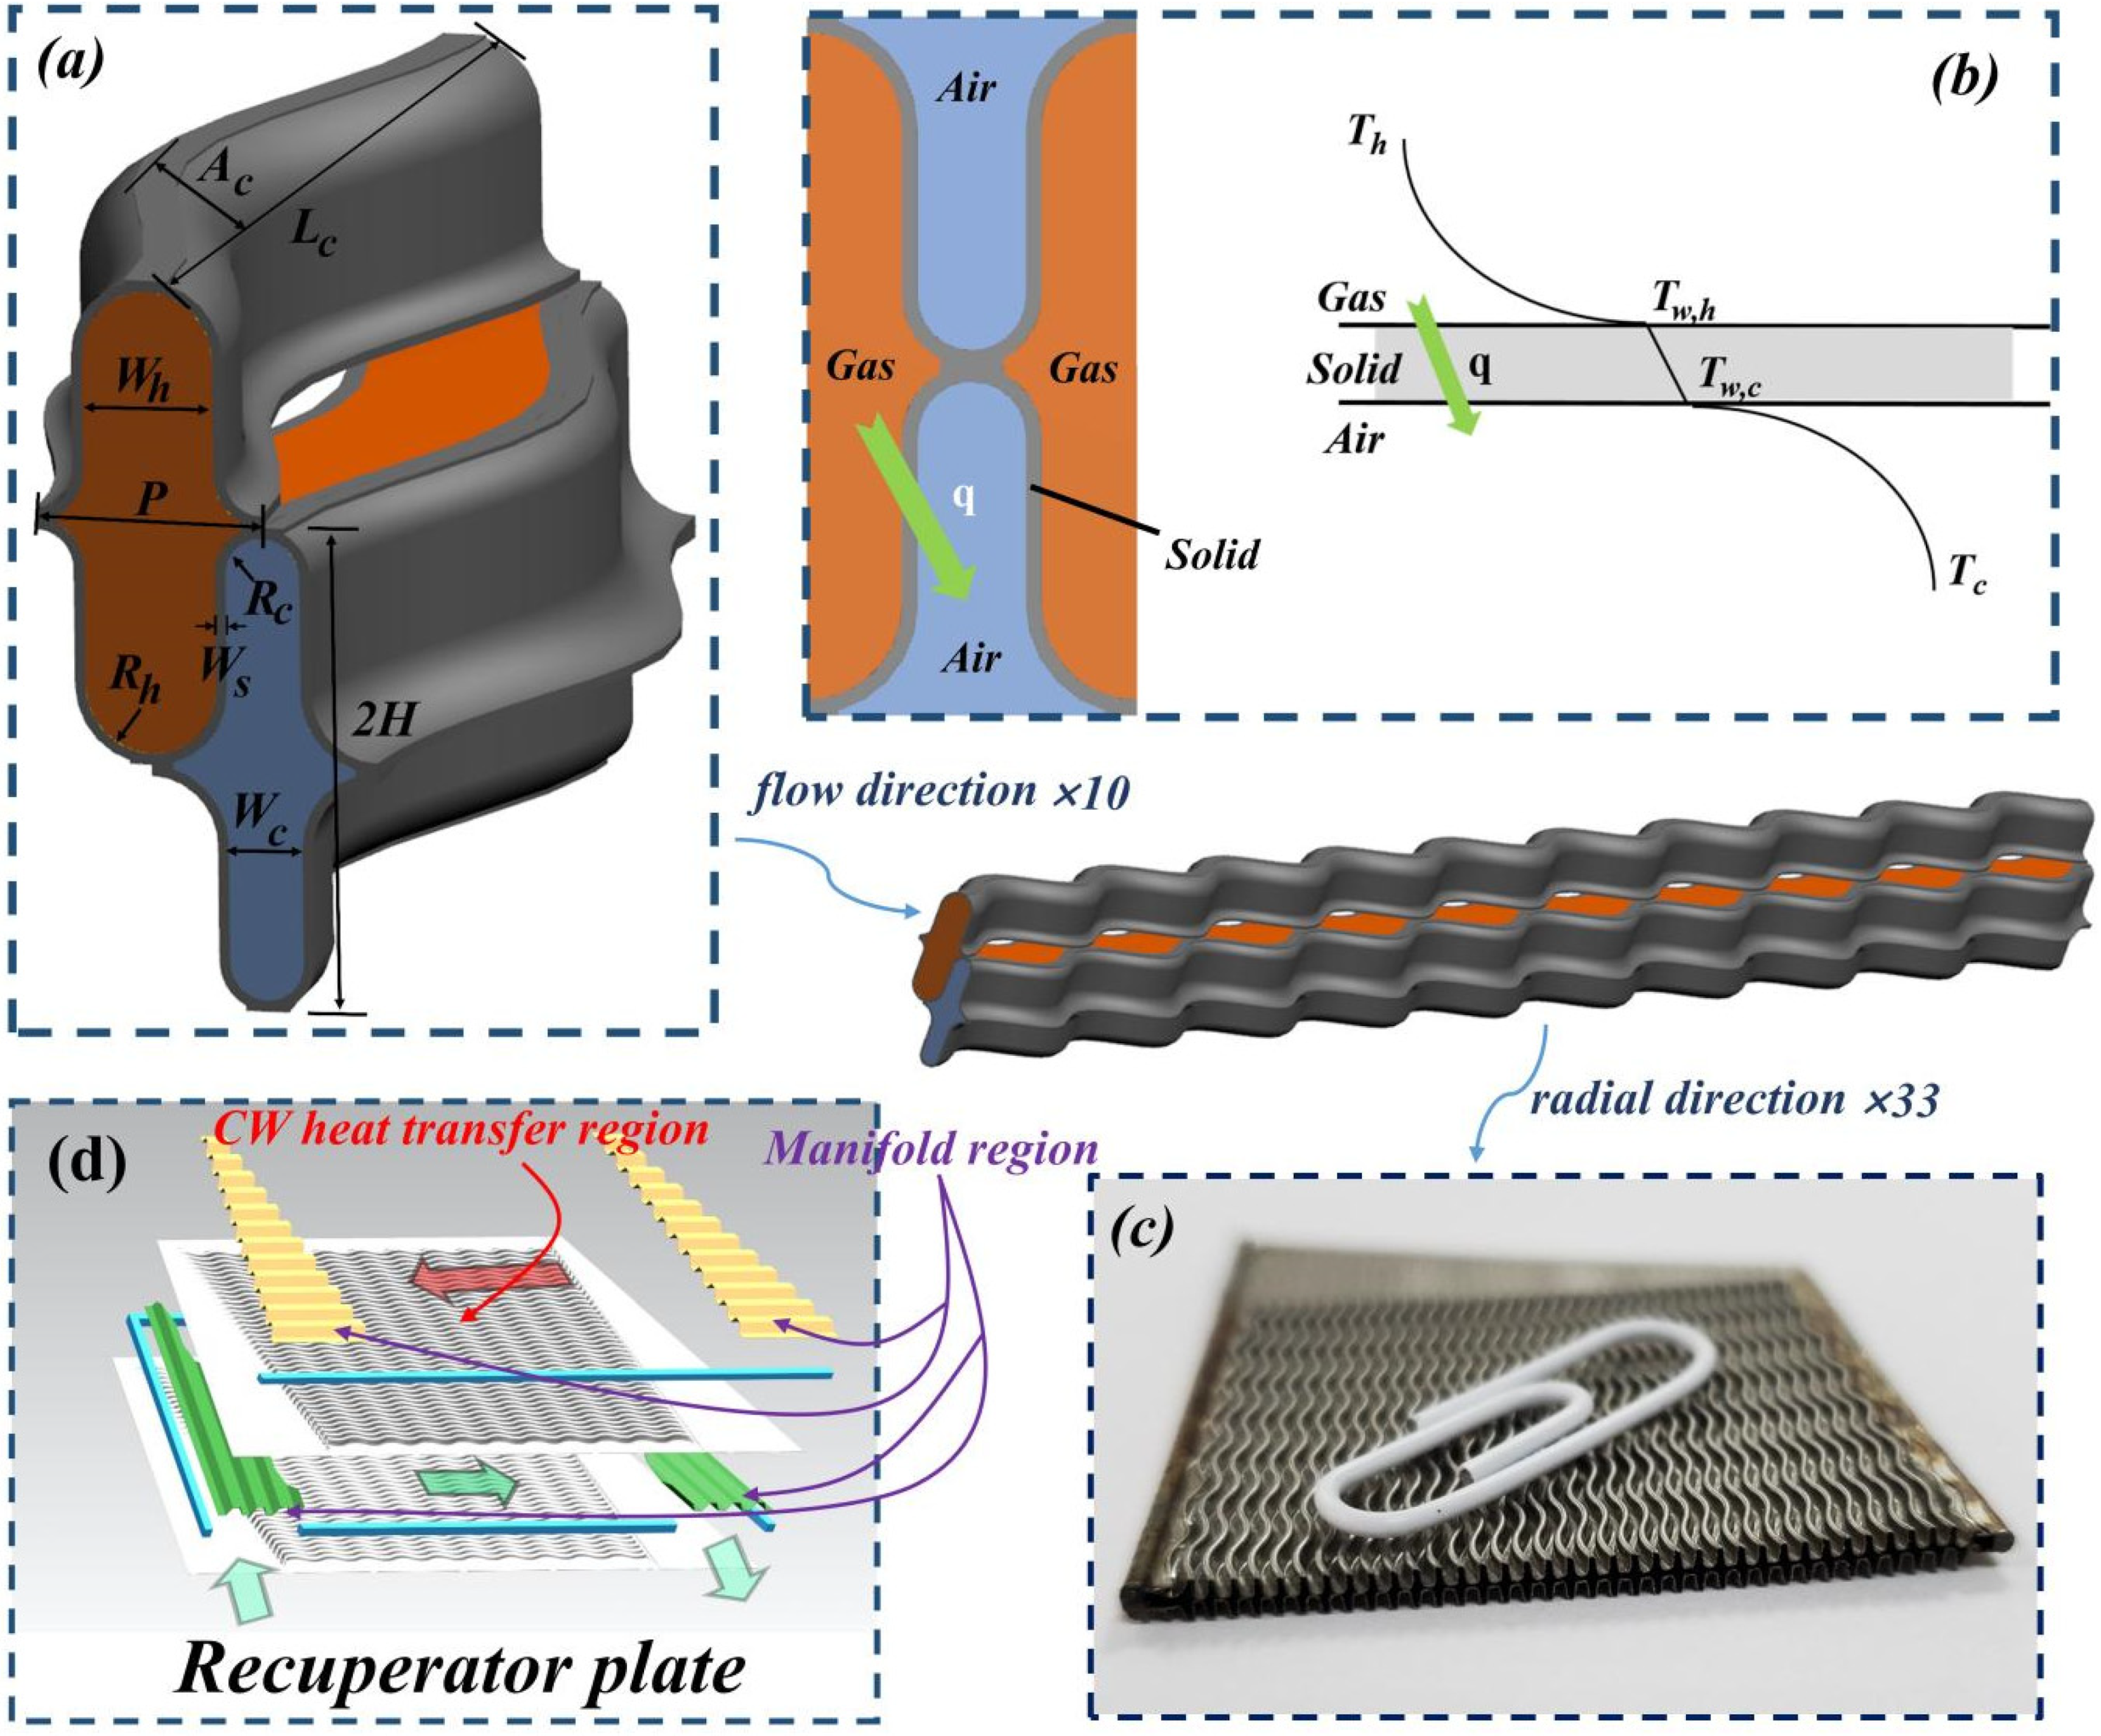
It can be seen from Figure 3, for the CW-PSR to be studied in this paper, that the unbent CW-PSR plate can be regarded as consisting of 10 and 33 arrays of the same CW channels in the flow direction and radial direction, respectively. The key geometrical parameters to determine the structure of the heat transfer unit are the amplitude of the longitudinal wave Ac, the wavelength of the longitudinal wave Lc, the channel pitch P, and the height of the transverse wave H. Wc and Wh in Figure 3a equal the diameters of the air and gas channels (dc and dh), respectively. In addition, Ws represents the thickness of the solid structure. The correlation of the CW-PSR design parameters studied in this paper is shown in Table 1.

3. Numerical Method

3.1. Governing Equations

The flow within the CW-PSR is considered to be a compressible steady-state flow. The model simplifications include the neglect of thermal radiation and natural convection. In exploring the flow and heat transfer characteristics within the context of low Reynolds numbers in this study, Zhang and Che et al. [31] employed some turbulence models to simulate CC heat transfer channels in the conducted tests. Their comprehensive analysis compared these models against established experimental data, revealing that the low Reynolds number k-ε model and SST k-ω model exhibited superior predictive capabilities for flow and heat transfer performance in low Reynolds number CC channels. Building upon this valuable research, we opted for SST k-ω model within the Ansys CFX for numerical simulations, prioritizing its proven accuracy over other turbulence models. The governing equations in the three-dimensional model are articulated as follows.
Continuity governing equation:
ρ u = 0
Momentum governing equation:
ρ u i u = μ + μ t u i p x i + S
Energy equation:
ρ T u = μ P r T + S T

3.2. Boundary Conditions

The computational model’s boundary parameters are calibrated to conform with the genuine operational specifications of MGT. Prescribed boundary attributes, including mass flow and overall temperature, are assigned to the inflows on both the air and gas aspects. To be precise, the total temperature at the air inlet is set at 455.6 K, while the gas inlet is adjusted to a temperature of 819 K. The Re is changed by changing the inlet mass flow. Five Re conditions are applied to CW-PSR plates with different bending shapes. The Re on the air side are 315, 480, 645, 810, and 980 respectively, and the corresponding Re on the gas side are 265, 400, 530, 655, and 785 respectively. This has covered the basic operating conditions of CW-PSR applied to MGT [15]. The static pressure boundary conditions are applied to the outlets on both the air and gas sides, and the static pressure is set at 319,000 Pa for the air outlet and 101,325 Pa for the gas outlet. In addition, periodic boundary conditions are also set in the numerical simulation to assume that 171 CW-PSR plates are identical in the circumferential direction in the annular recuperator.

3.3. Solver Setup

Throughout the computational examination, a spectrum of thermophysical traits is accounted for in both air and gas. The numerical findings elucidate that the temperature ranges explored in this investigation encompass 550 K to 820 K for gas and 455 K to 760 K for air. According to the temperature range, polynomials of different thermophysical properties and temperatures are established, as shown in Table 2. The finite difference scheme employs a second-order central differencing approach. The solid wall is made of 347 stainless steel with a thermal conductivity of 20.5 W·m−1·K−1.
To evaluate the performance of CW-PSR with different bending shapes, the relevant flow and heat transfer parameters are defined for the CW-PSR plate. The definition of Reynolds number (Re) is:
R e = ρ u d e μ
where de is the equivalent diameter of the CW-PSR plate, which is defined as:
d e = 4 A c S
where Ac and S are the cross-sectional area and wetted perimeter of the CW-PSR plate, respectively. The average Nusselt number (Nu) is determined by:
N u = h d e λ
where λ is the thermal conductivity of the fluid. The heat transfer coefficient (h) is calculated via wall mean temperature (Ts), bulk temperature (Tb), and wall heat flux (qw), as follows [32]:
h = q w T s T b
and Tb is computed from:
T b = u T d A g u d A g
The overall thermal conductance UA of CW-PSR is
U A = Q m T L M T D = ( 1 h g A g + δ λ s A s + 1 h a A a ) 1
where U is the overall heat transfer coefficient, A is the CW-PSR heat transfer area, Qm is the overall heat flux, TLMTD is the logarithmic average temperature difference between gas and air and is expressed as follows:
T L M T D = Δ T max Δ T min ln Δ T max Δ T min
Δ T max and Δ T min are the minimum and maximum values of the temperature difference between the low-temperature side gas and air, and the temperature difference between the high-temperature side gas and air, respectively.

3.4. Principle of Vorticity Field Synergy

For a flow heat transfer process that conforms to the first law of thermodynamics, the energy equation can be expressed as:
V ρ c T τ d V + A ρ u c T d A = q q ¯ d A + V ρ ϕ d V
The four terms from left to right in the above equation are system heat storage term, thermal changes caused by fluid entering and exiting the system, surface heat dissipation of the thermal system, and generalized internal heat source term.
Move the above equation to change:
q q ¯ d A = V ρ c T τ d V + A ρ u c T d A V ρ ϕ d V = V ρ c T τ d V + V ( ρ u c T ) d V V ρ ϕ d V = V ρ c T τ + ρ c u T ρ ϕ d V
The three terms on the right-hand side of the equation can be considered as three source terms: system heat storage term, convective source term, and generalized internal heat source term. When the system does not consider the storage and internal heat sources, the surface heat dissipation of the system can be expressed as:
q q ¯ d A = ρ c V u T d V
This is also the principle of field synergy [33], which u T is called the field synergy number (Fs). The closer the angle between the velocity vector and the temperature gradient vector is to zero degree, the greater the field synergy number, and the greater the heat transfer of the system.
However, for the convective heat transfer with obvious secondary flow, such as inner fin tube, spirally fluted tube, cross wave tube, turbine end wall film cooling, etc., there is obvious vorticity in the flow channels, resulting in a large field synergy angle (more than 80°), but secondary flow plays an enhanced role in heat transfer. This study explains this phenomenon as follows:
V F s   d V = V i i = 1 ~ n F s   d V = F s V 1 + V i i = 2 ~ n ( F s V i 1 + f l F s V i 1 l V i 1 , V i ) d V = F s V 1 + V i i = 2 ~ n ( F s V i 1 + F s V i 1 n e , V i 1 d V
The above formula is the integral discretization process, which divides the thermodynamic system V into n discrete units with equal volume. The distance between Vi−1 and Vi is small enough. f l F s V i 1 is the directional derivative of Fs at Vi−1, l V i 1 , V i is the distance between Vi−1 and Vi, and n e , V i 1 is the direction cosine of Fs at Vi−1.
In this category, the Fs values dwindle as a consequence of the wall’s velocity being restricted to zero. By stipulating V1 as the smallest volume unit at the wall, the intrinsic influence of Fs in the aforementioned equation is effectively nullified. The subsequent derivation can be explicated as follows.
V F s d V = i = 1 n 1 n i F s v i n e , v i d V
To date, the manifestation predominantly resides within the confines of the gradient term and direction cosine. When delving into the specifics of the gradient terms, their articulation unfolds as follows:
F s = u T = u T + T u + u × u × T + T × × u
This equation’s third term on the rhs registers as zero, paving the way for a more elaborate expression of the equation as follows:
F s = u , T T u + T × ω
Delving deeper into the intricacies of this equation, the leading term on the right-hand side encapsulates the cumulative impact of temperature gradient and velocity flux intensity. This is further compounded by the product of temperature gradient and velocity. Conversely, the subsequent term on the right-hand side materializes through the intricate cross product mechanism involving temperature gradient and vorticity.
Consequently, a nuanced deduction can be drawn—beyond the inherent attributes of velocity and temperature gradient fields and their dynamic fluctuations, the gradient of Fs exhibits a profound correlation with the angular disposition between the temperature gradient and vorticity. As this alignment converges toward the perpendicular angle of 90°, it substantially catalyzes the elevation of the field synergy number gradient. This, in turn, fosters a heightened state of heat transfer, exemplifying the intricate interplay between these fundamental variables in the underlying physical phenomena.
Therefore, in this study, the included angle between vorticity and temperature gradient is defined as the vorticity synergy angle (VFSA). In the traditional principle of field synergy, the Fs is not only related to the angle between velocity and temperature gradient, but also to the mode of the two vectors of velocity and temperature gradient. Therefore, it can only be expressed as the smaller the field synergy angle (FSA), the more conducive it is to heat transfer, rather than an absolute increase. Similarly, the VFSA derived further only plays a facilitating role, but in the convective heat transfer with strong secondary flow, the VFSA will have better evaluation significance than the FSA, which will be fully demonstrated in the following practical applications.

3.5. Grid Independence and Numerical Verification

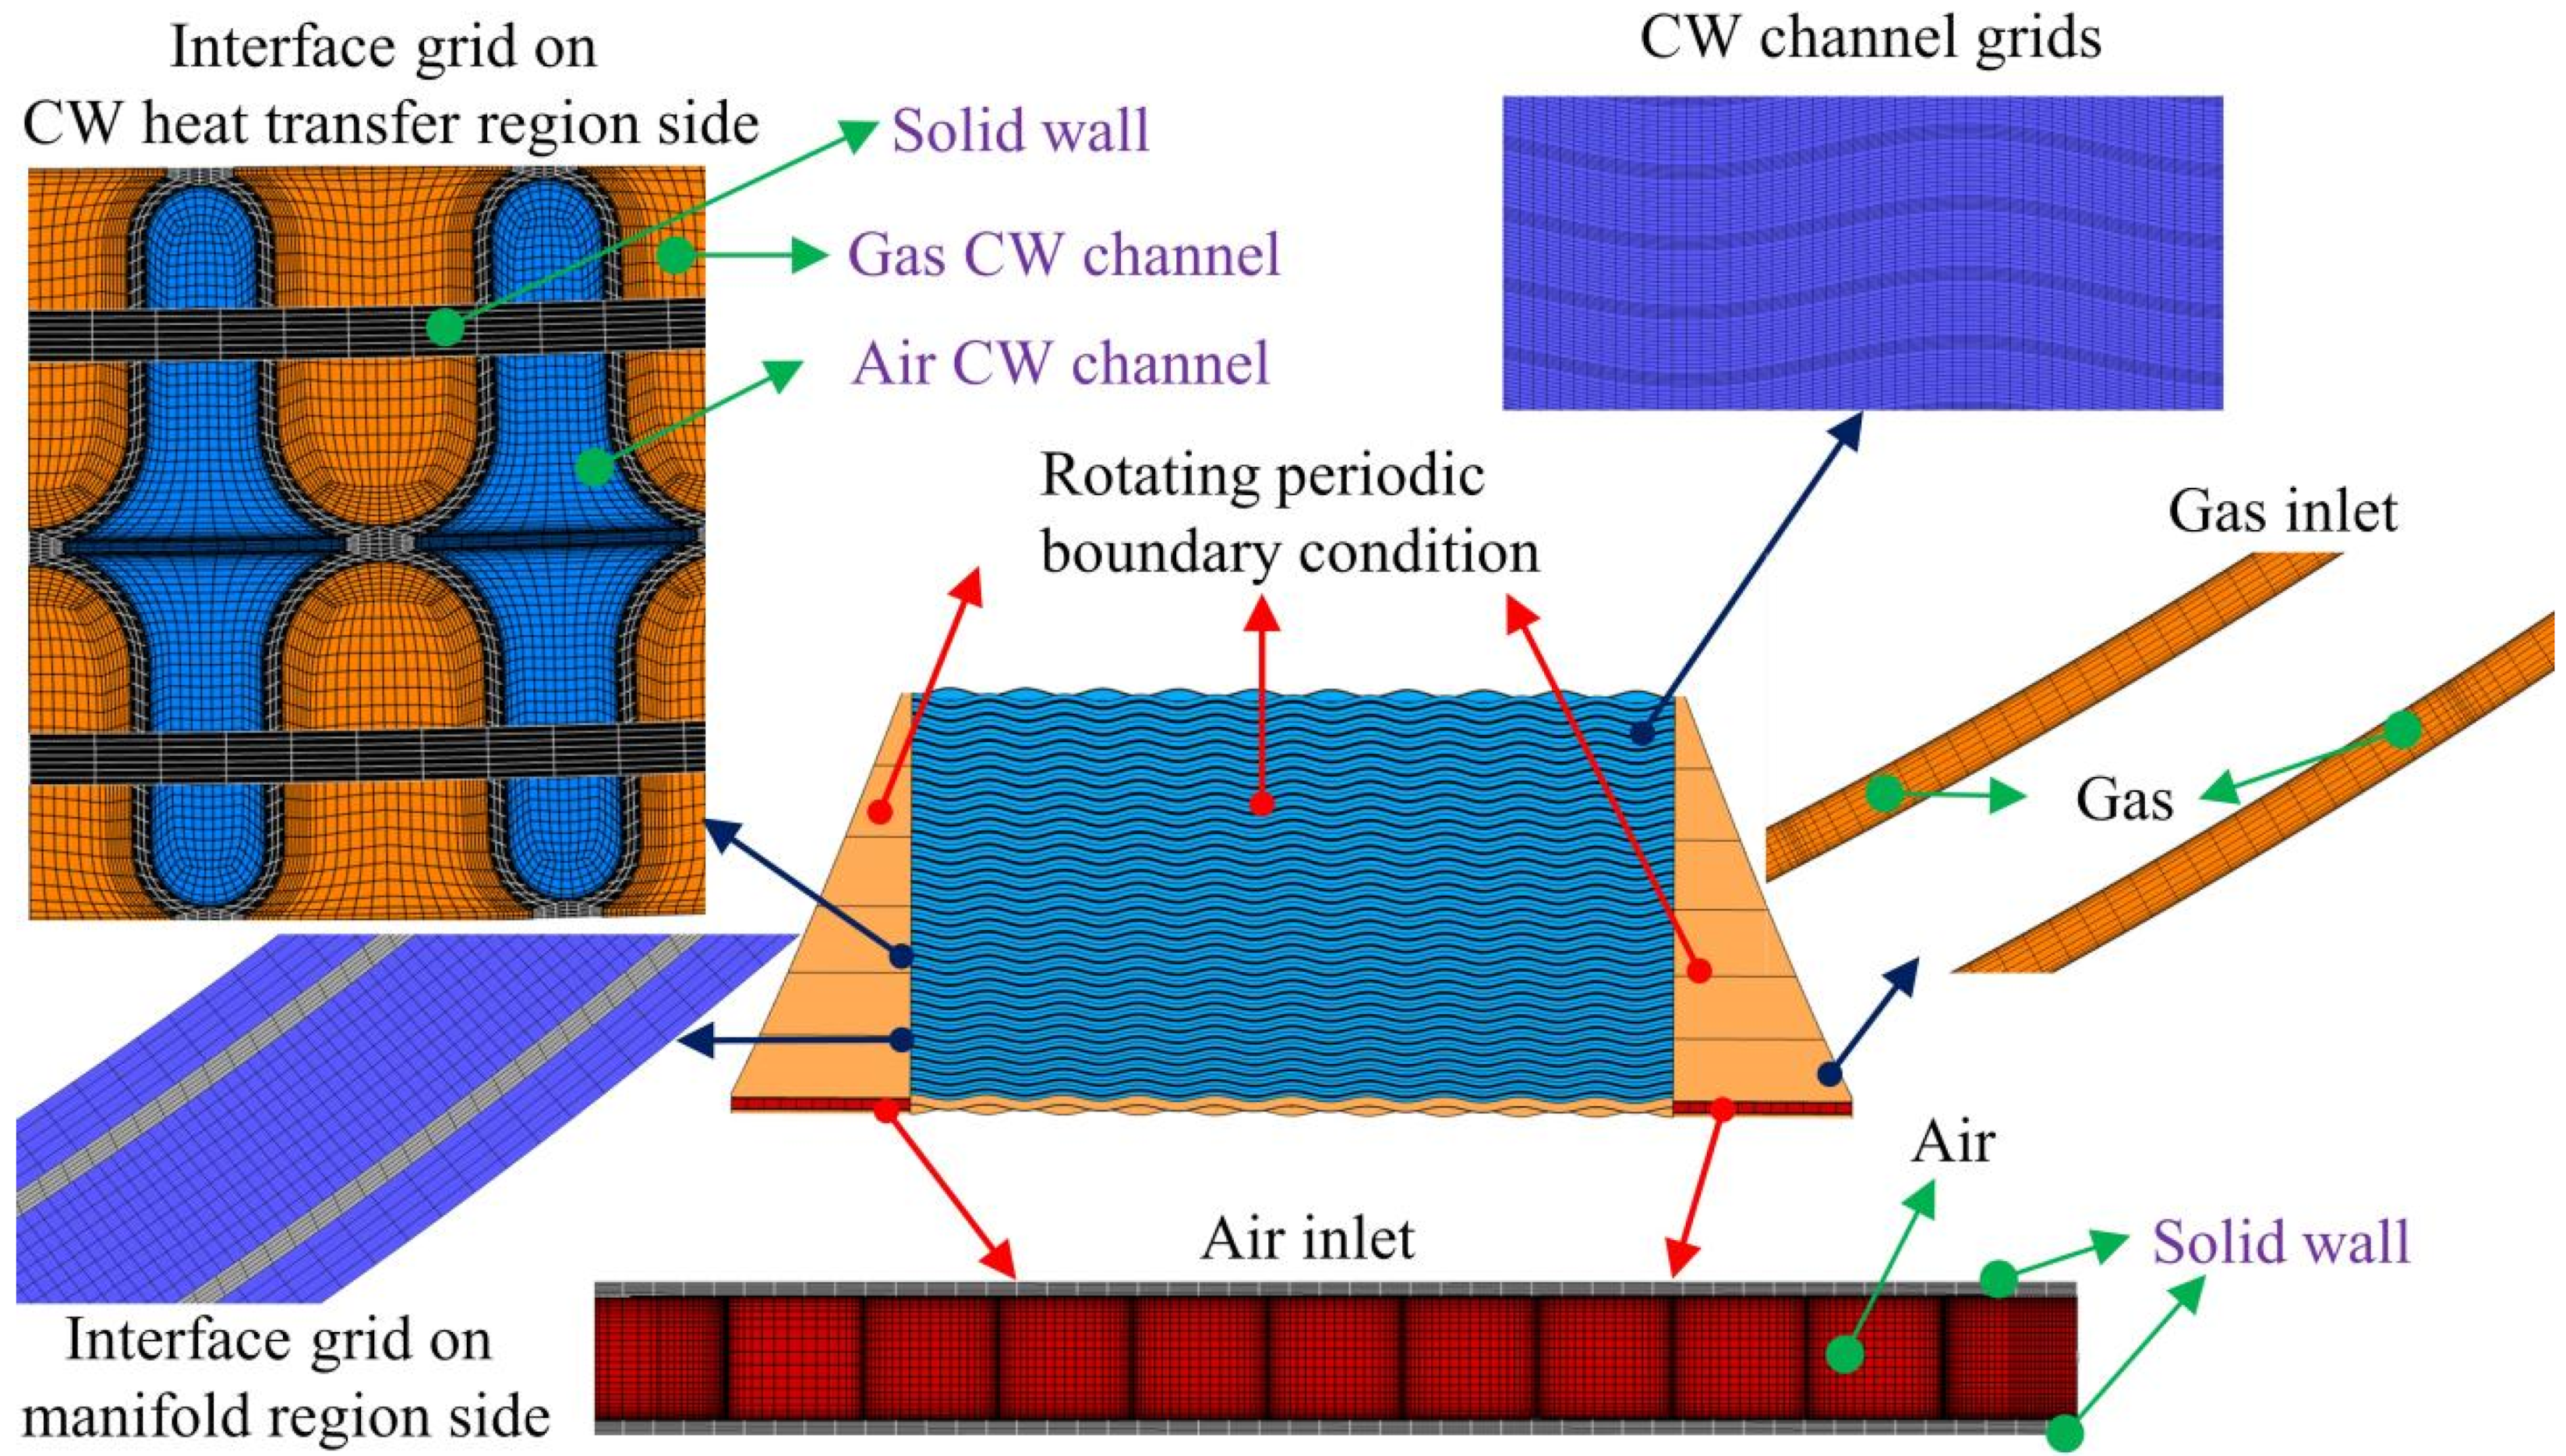
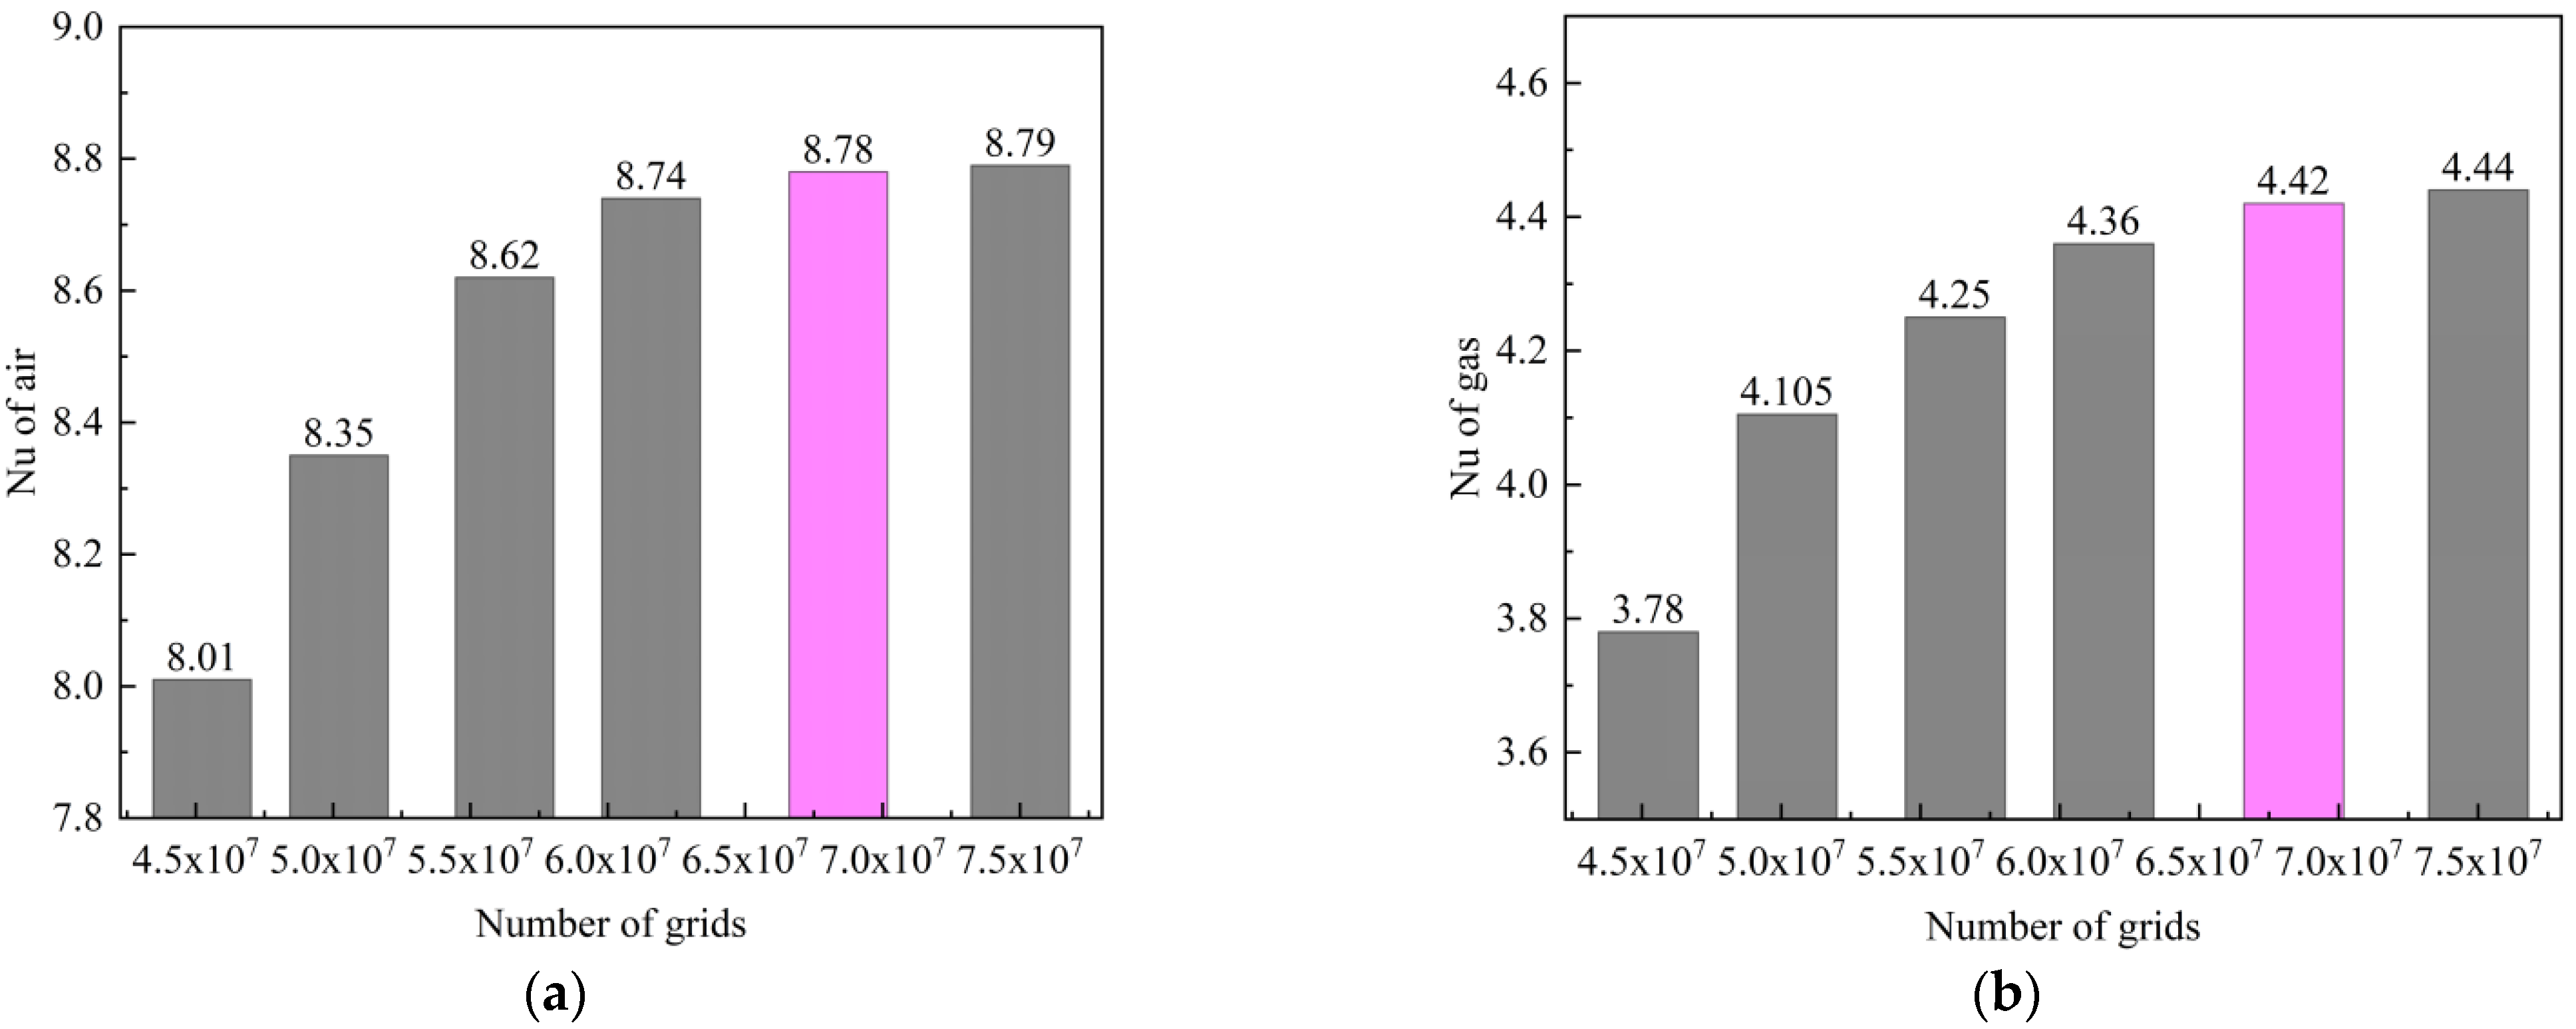
The established numerical model is shown in Figure 4. To obtain reliable numerical simulation results with a reasonable number of grids, it is necessary to verify the grid independence of the CW-PSR plate. In this study, the Nusselt number (Nu) of the air-side and gas-side channels is analyzed under operating conditions with a Reynolds number of 680 using numerical models based on five different grid resolutions. In Figure 5, the Nu of the air channel and gas channel gradually increase with the increase in the grid number. When the number of grids is 68,391,711, the Nu of air channel and gas channel tends to be constant. Therefore, this numerical simulation uses this grid system.
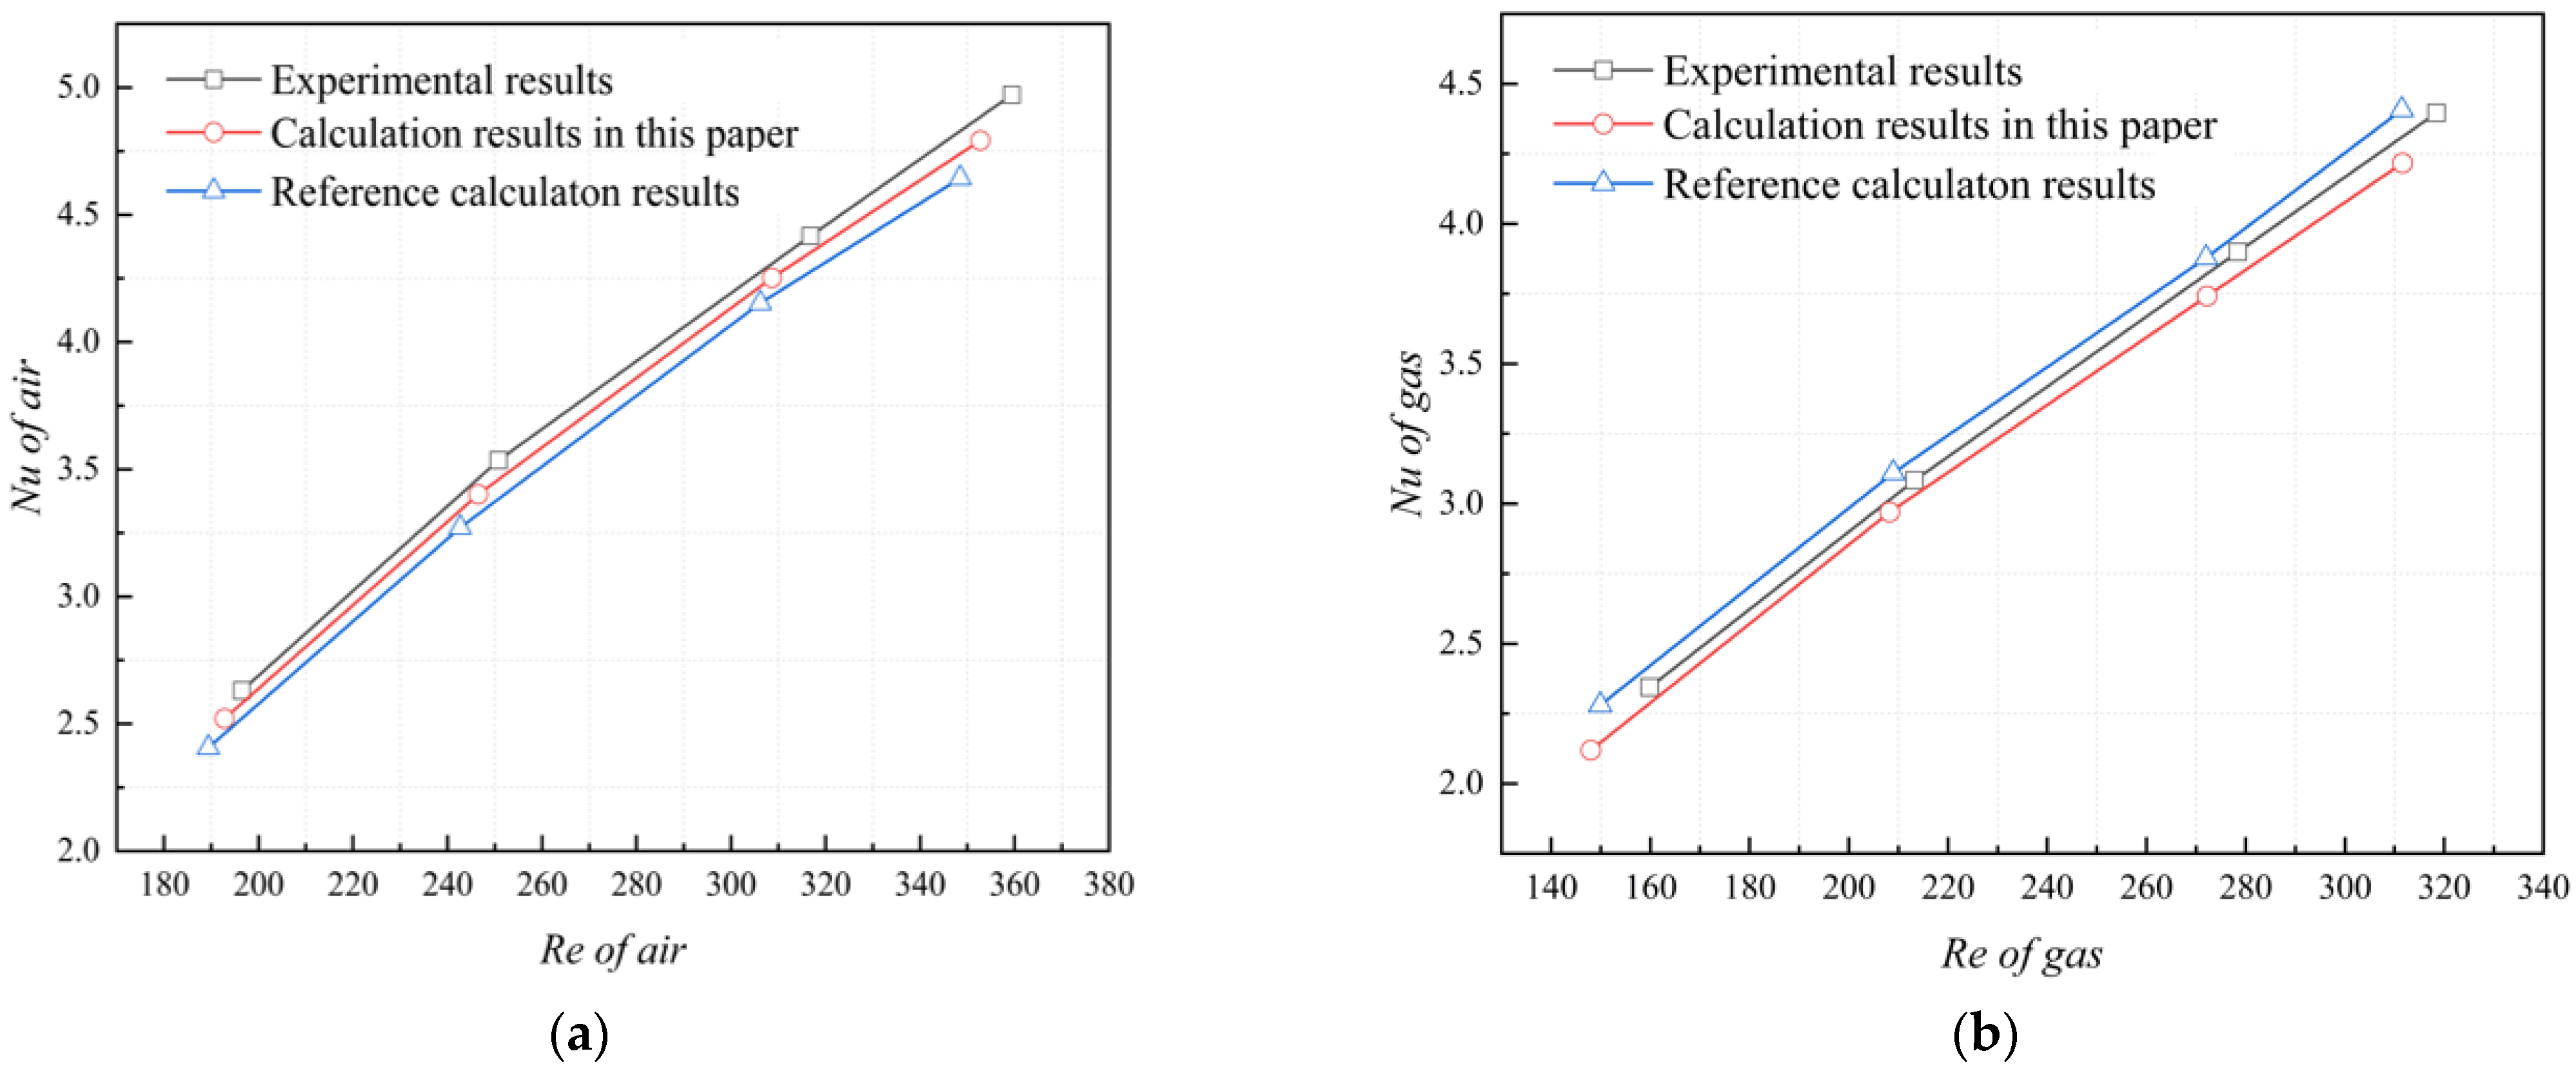
In the pursuit of confirming the credibility of our numerical simulations, we turn to the CW-PSR embedded in the Capston C30 MGT as a benchmark for verification. Serendipitously, Xu et al. [33] undertook a comprehensive series of experiments delving into the intricacies of flow dynamics and heat transfer features within analogous annular recuperator prototypes. Concurrently, Xi et al. [11] delved into the realm of numerical simulations, focusing their research on the heat exchange unit and furnishing meticulous geometric parameters.
To maintain consistency with experimental parameters, the working fluid is exclusively limited to air on both the hot and cold facets. The visual representation in Figure 6 distinctly showcases the calculated Nu values on the air and gas sides, exhibiting a remarkable concurrence with experimental data. This congruence lends strong credence to the accuracy of the numerical calculation methodology embraced in this study, attesting to its efficacy in precisely predicting the nuances of flow patterns and heat transfer dynamics within the confines of the CW-PSR.

4. Results and Discussion

4.1. Comparison of Heat Transfer Performance

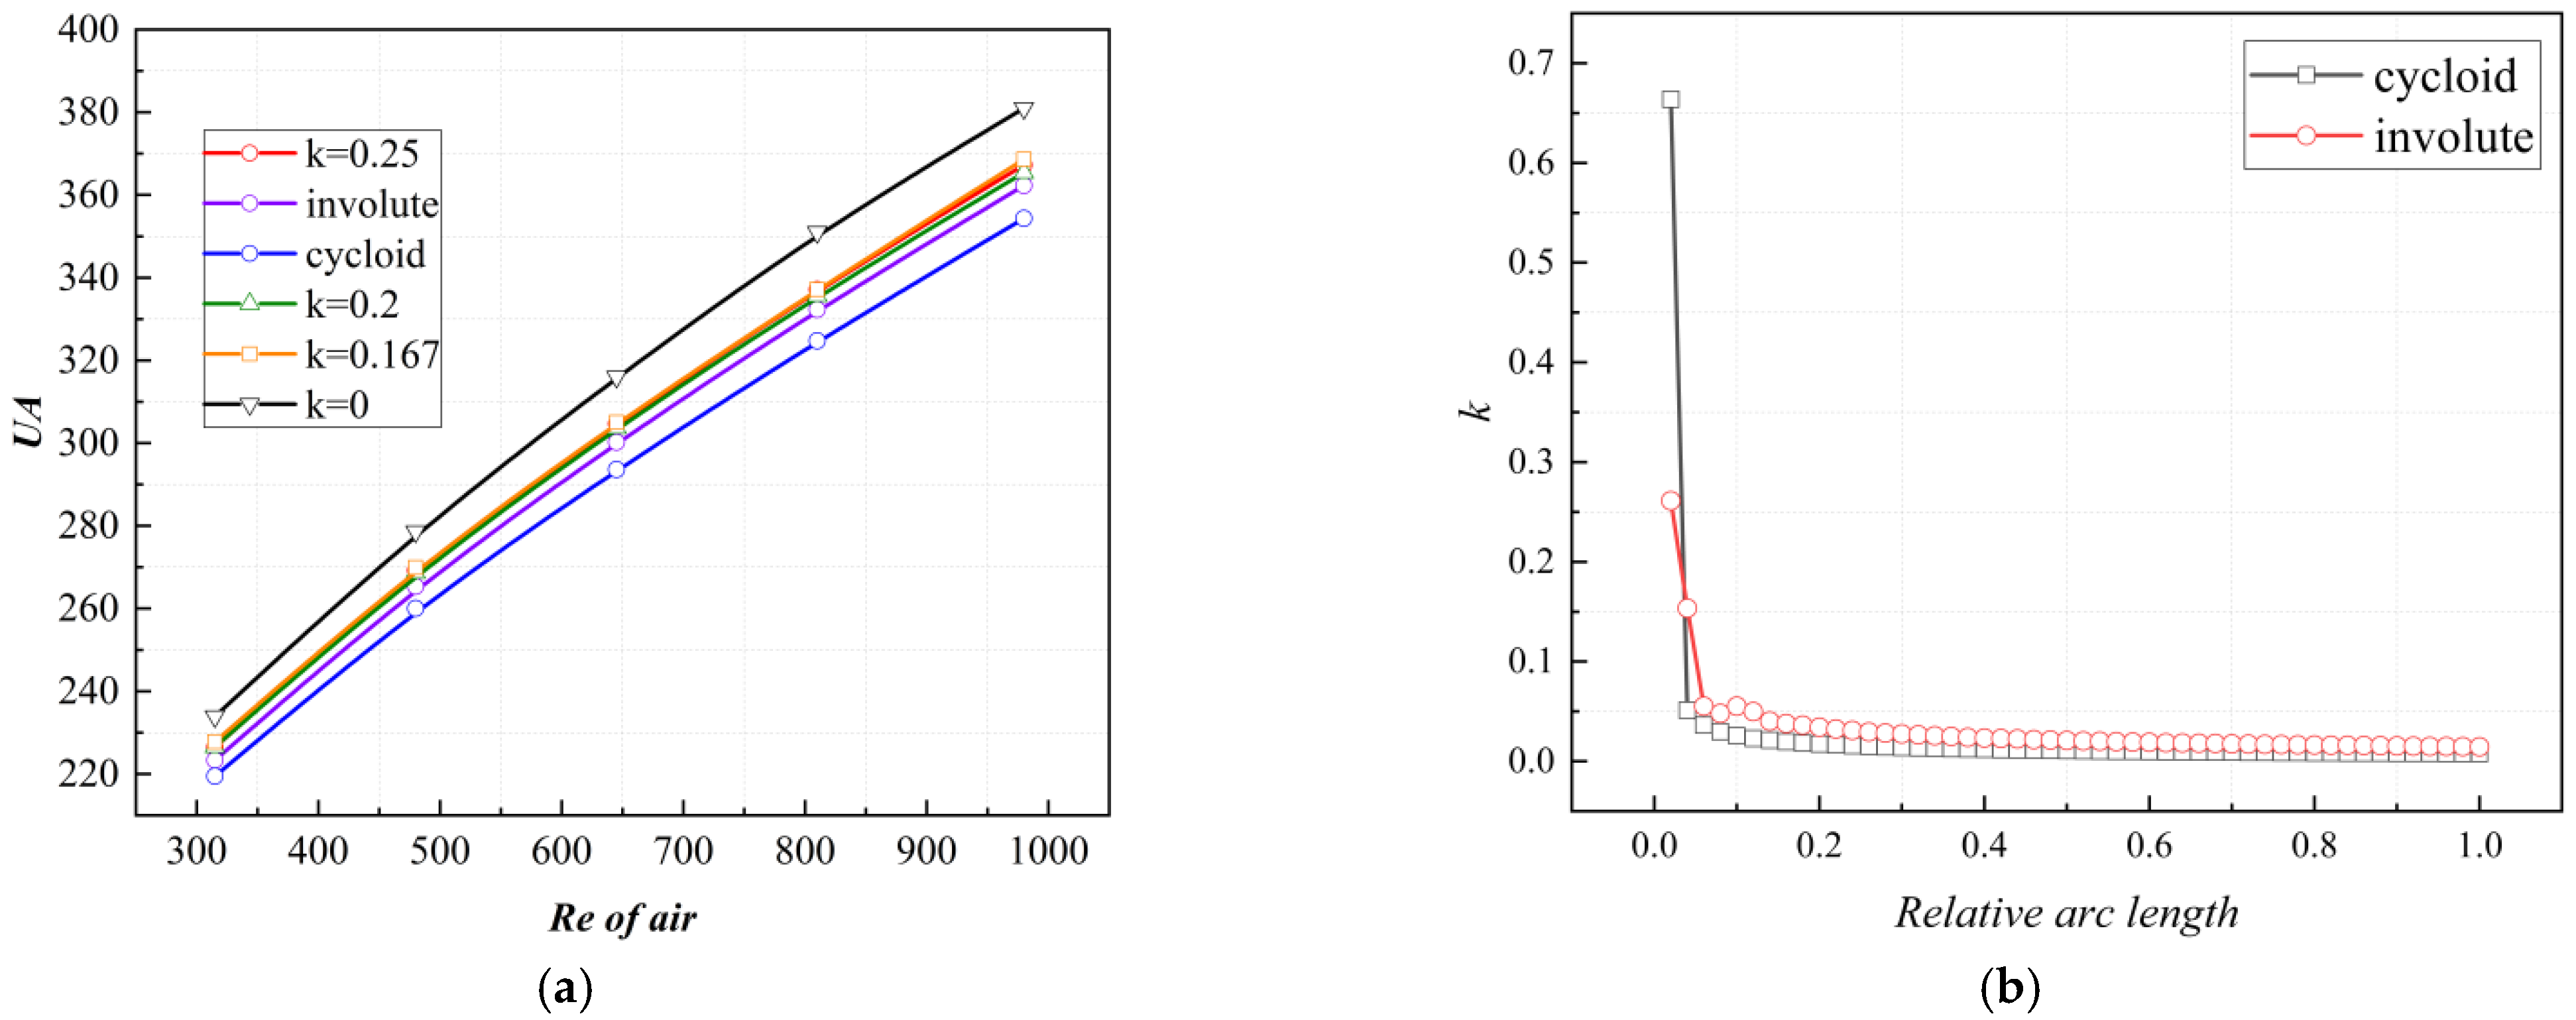
In this paper, six different bending forms of CW-PSR plates are set, which include a non-bending heat transfer plate (k = 0), three circular arc heat transfer plates (k = 0.167, 0.2, 0.25), and two variable curvature form heat transfer plates (involute, cycloid). The CW-PSRs of different bending shapes are obtained by the overall deformation of the same straight plate, without altering the original geometric surface area. Therefore, the CW-PSRs of different bending shapes have the same heat transfer area. The cycloid shape and involute shape have different curvatures at different relative arc lengths, with 0 and 1 representing the inner and outer diameter positions of the CW-PSR, respectively. Figure 7a shows the change of overall thermal conductance (UA) across different bending shapes with Reynolds number. From the results, it can be seen that the UA of the CW-PSR plates with different bending shapes has a similar trend with Re and increases with the increase of Re. In addition, the CW-PSR plate with bending shapes showed a significant decrease in UA, and compared to the arc form, the variable curvature bending shape showed a greater degree of reduction, with the cycloid form being the most severe. Compared to the CW-PSR plate without bending, the UA decreased by a maximum of 8%. As shown in Figure 8b, the CW-PSR plates with involute and cycloidal shapes exhibit significant curvature near the inner diameter.
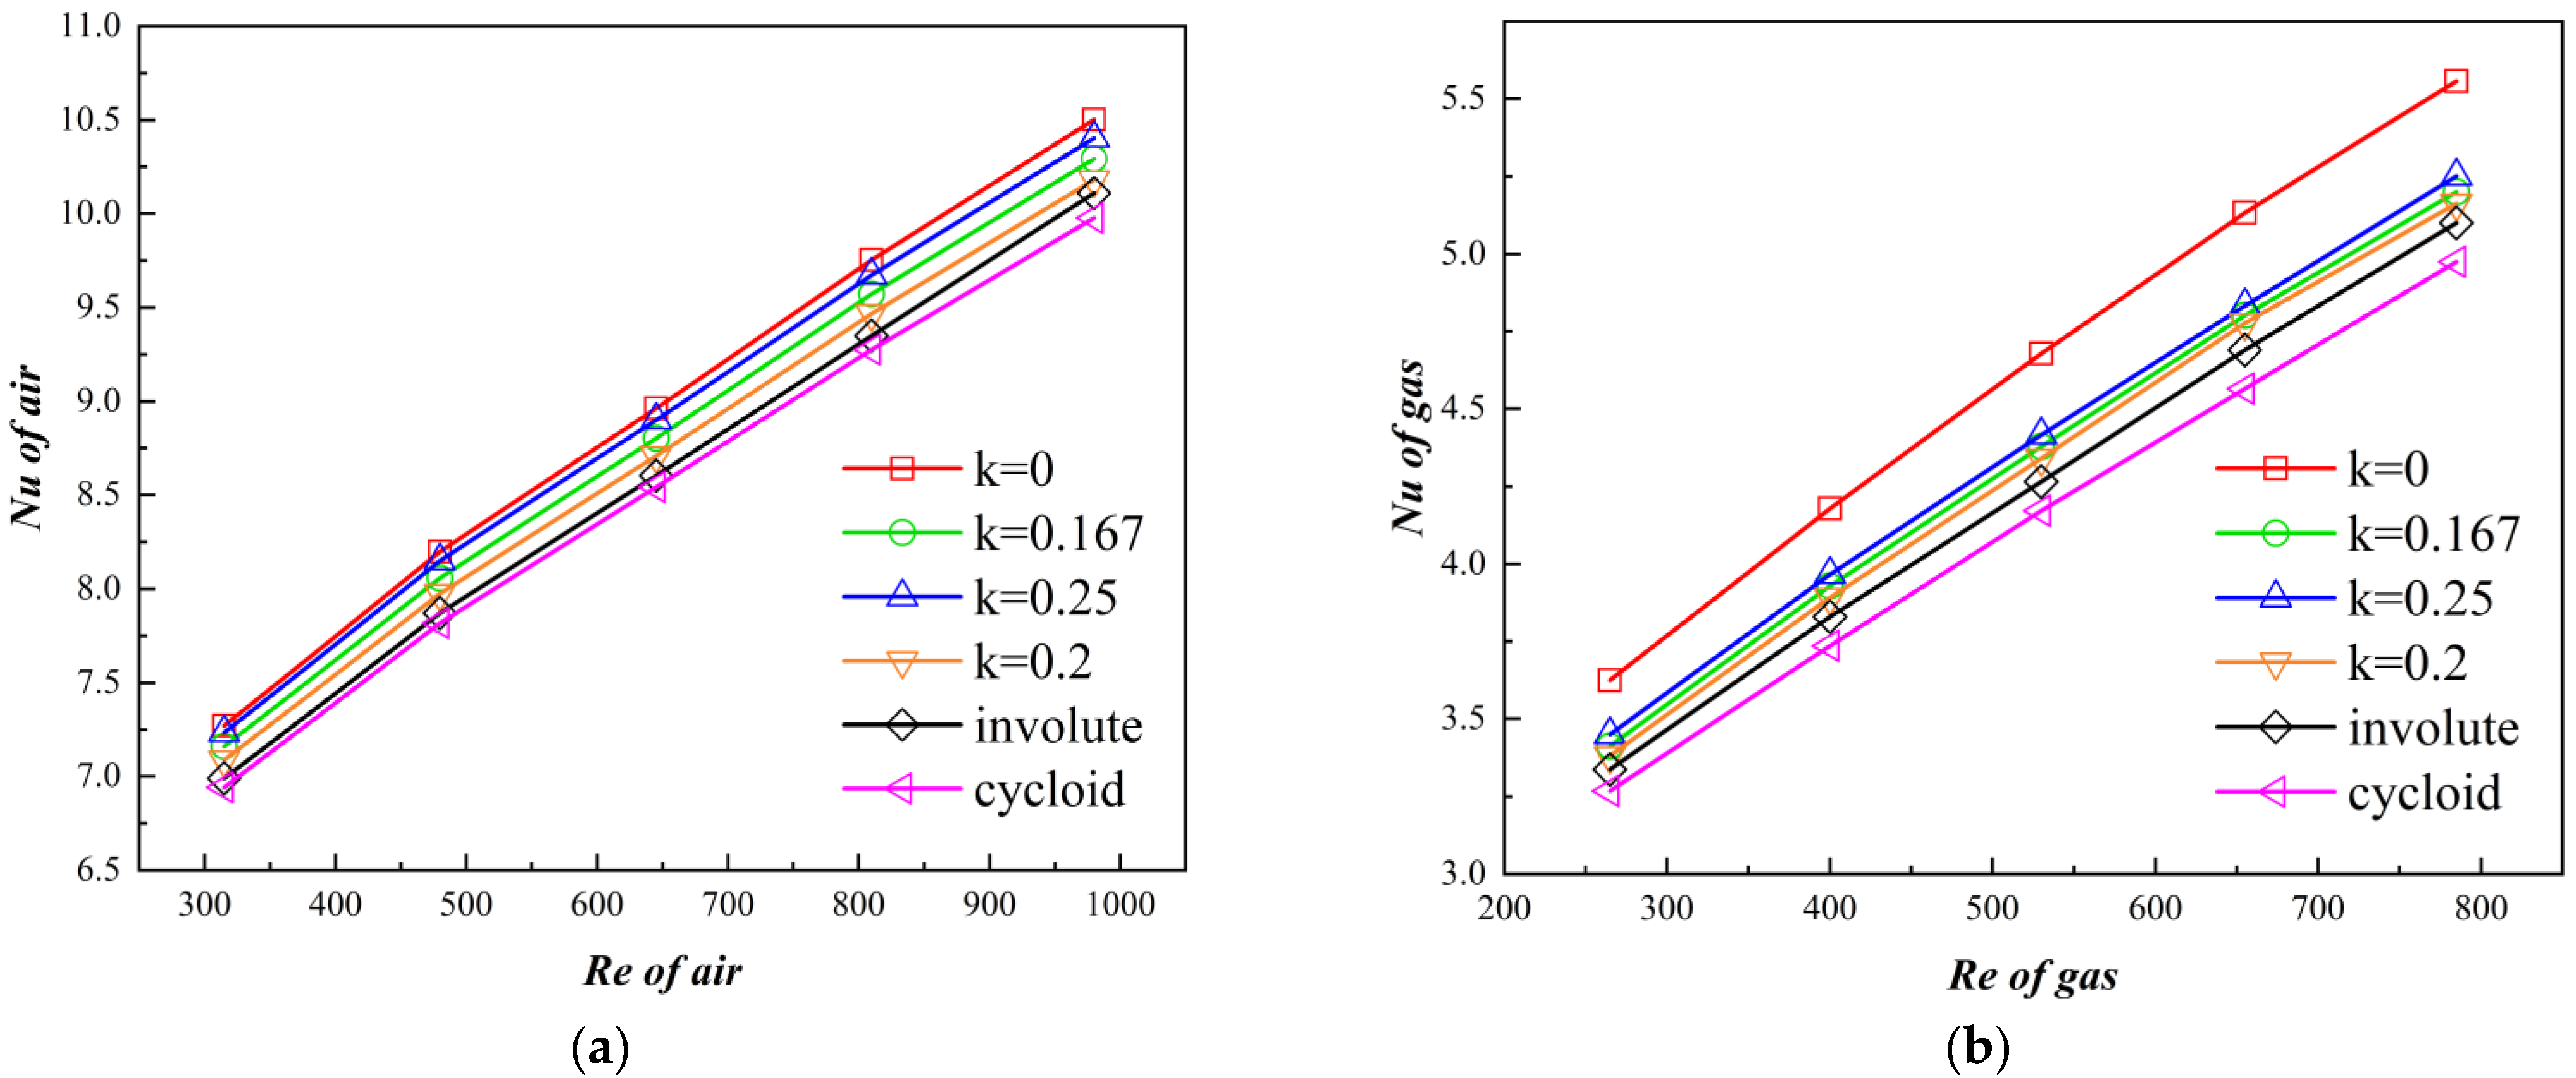
The correlation between Nu (Nusselt number) and Re (Reynolds number) for the air and gas sides is illustrated in Figure 8, where the Nu number increases with the augmentation of the Re. As the Reynolds number increases, the secondary flow becomes more pronounced. Different curved profiles of the CW-PSR exhibit varying Nu values, with the cycloid CW-PSR demonstrating the weakest heat transfer performance on both the air and gas sides. On the gas side, compared to the uncurved CW-PSR, the epitrochoid-shaped CW-PSR experiences a maximum reduction of 8% in Nusselt number, while on the air side, the reduction is 5%.
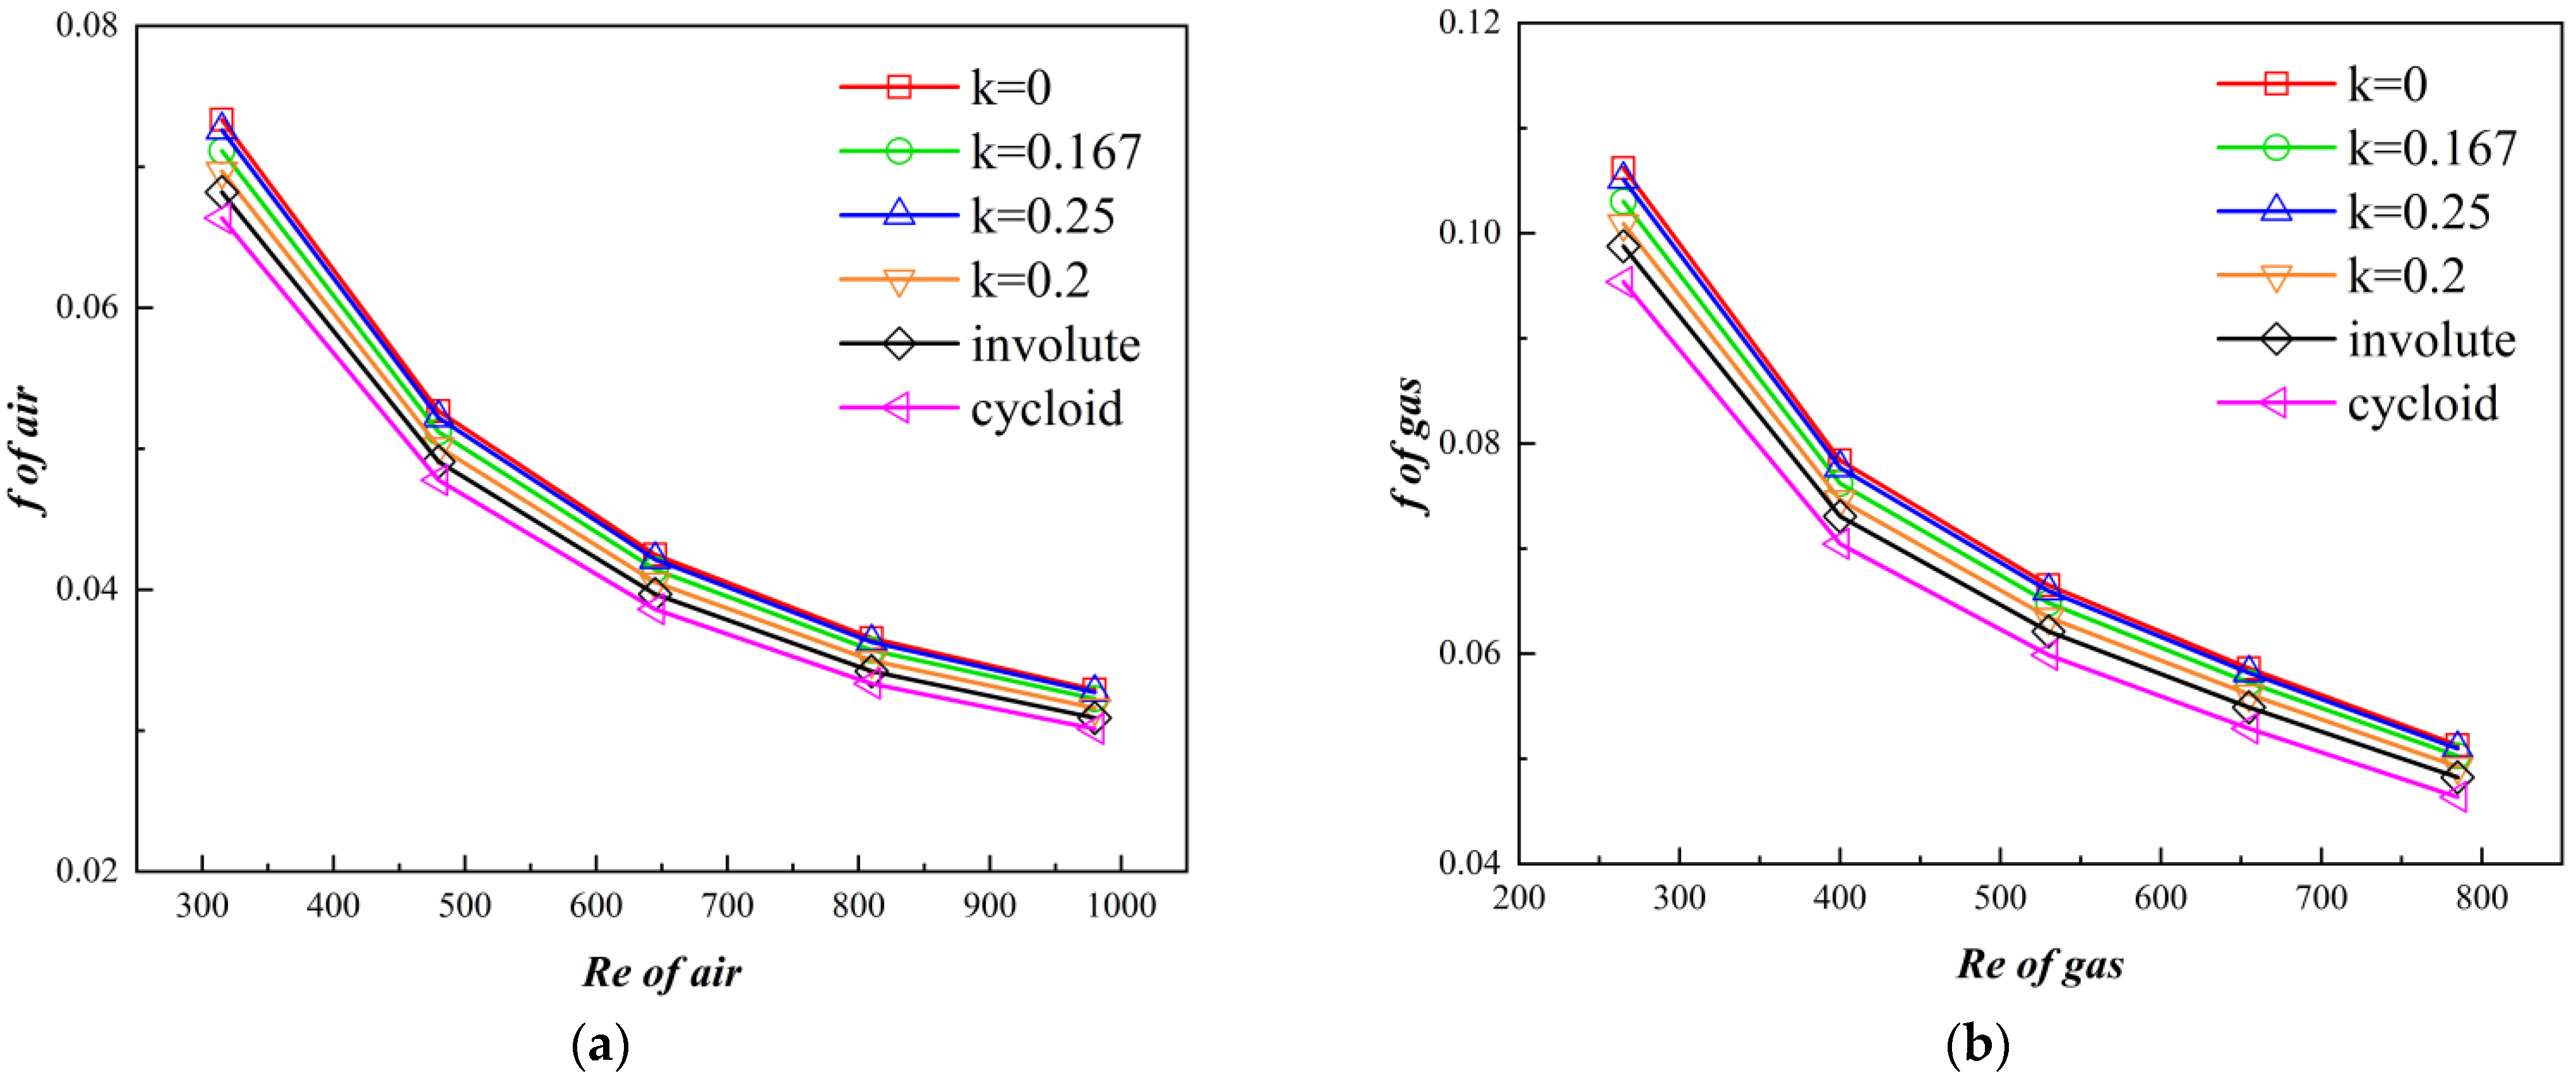
In Figure 9, curves depicting the variation in friction factor (f) with Reynolds number (Re) for different models are presented. The results indicate that when (Re) is less than 500, the friction factor (f) rapidly decreases and then experiences a slight reduction with the increase in (Re). Combining these findings with the Nusselt number results from Figure 8, it is evident that altering the curved profile of the CW-PSR leads to a deterioration in its heat transfer performance. However, correspondingly, there is an improvement in its flow performance. In comparison to the uncurved CW-PSR at the same Reynolds number, the friction factor (f) on the gas side is reduced by a maximum of 4.5%, while on the air side, this reduction reaches 10%.
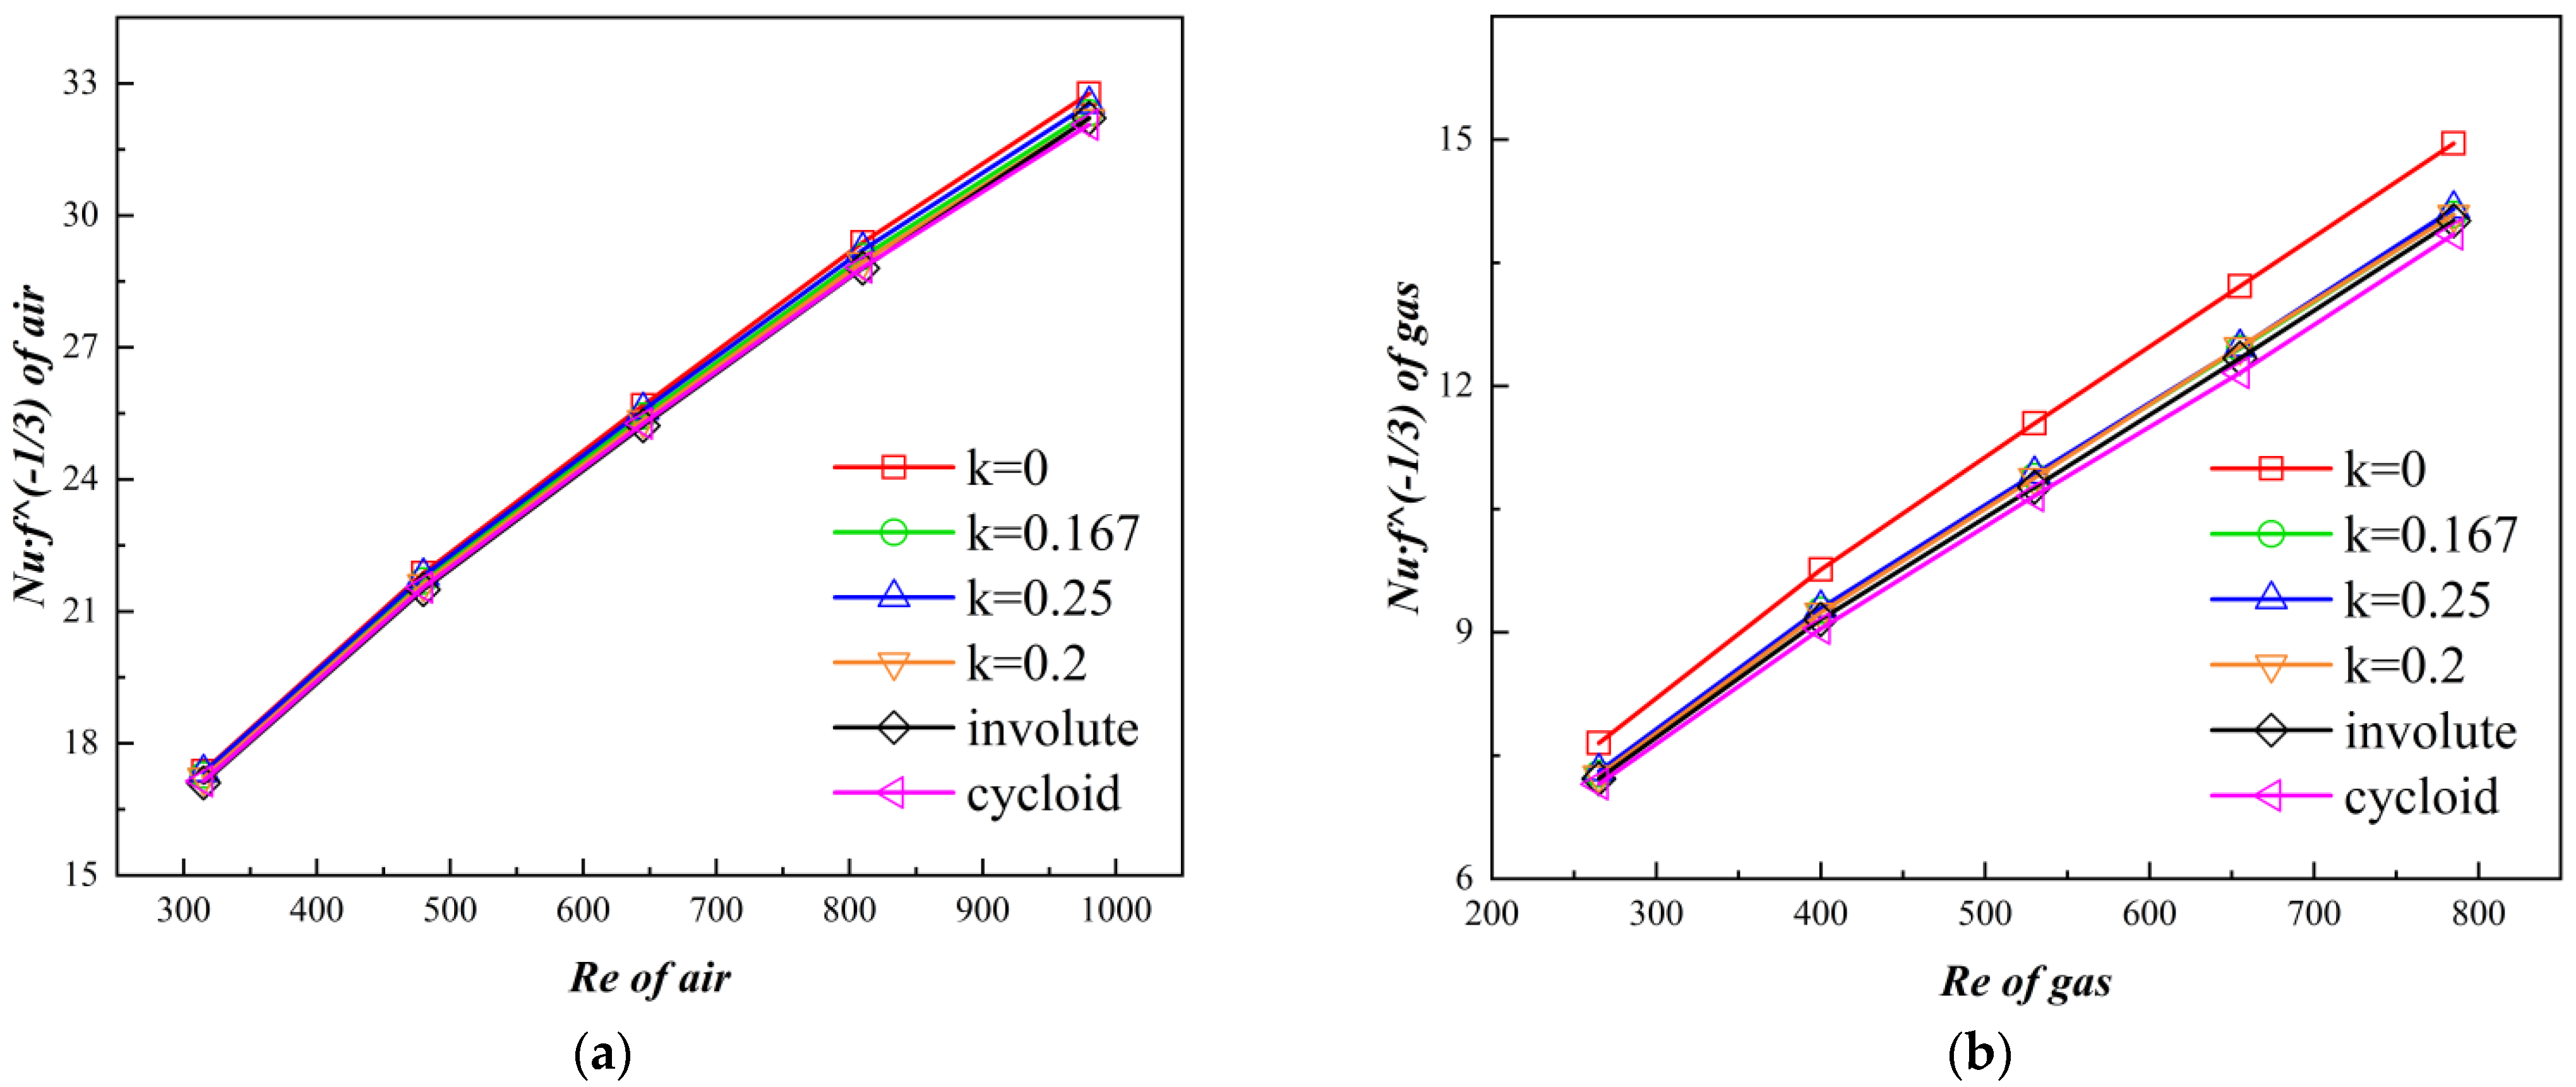
Figure 10 illustrates the comprehensive performance of the CW channel, where the comprehensive performance is defined using Nu/f1/3 It is evident from the results that CW-PSR models with different curved profiles exhibit certain differences in comprehensive performance. This difference is relatively small on the air side, reaching a maximum of only 2.15% (occurring at (Re = 985), where the uncurved CW-PSR has Nu/f1/3 = 32.768, and the epitrochoid-shaped has Nu/f1/3 = 32.06337). On the gas side, the maximum difference is 7.4% (occurring at (Re = 785), where the uncurved CW-PSR has Nu/f1/3 = 14.9525, and the epitrochoid-shaped has Nu/f1/3 = 13.84779).
In light of the above analysis, it is apparent that the curved profile of the CW-PSR has an impact on both the heat transfer performance and resistance performance on the air and gas sides of the channel. The application of different curved contour CW-PSRs in MGT will lead to varied impacts on overall performance, and these effects are complex and challenging to characterize qualitatively. Figure 11 illustrates the variation in overall performance (output power and thermal efficiency) of the design points in MGT concerning the curved profile lines of CW-PSRs. The overall performance calculation references characteristic maps of individual components. In micro gas turbines, the CW-PSR serves the purpose of transferring thermal energy from the turbine exhaust gases to the air at the compressor outlet. Subsequently, the air enters the combustion chamber, undergoes the combustion process, and generates high-temperature, high-pressure gases. Therefore, (1) The excellent air-side and gas-side heat transfer performance of CW-PSR will increase the air temperature at the inlet of the combustion chamber. This, in turn, reduces the consumption of fuel, achieving energy savings and emission reduction. (2) The excellent air-side resistance performance of CW-PSR can enhance the air pressure at the inlet of the combustion chamber. In the case of constant pressure loss in the combustion chamber, this increase in pressure at the combustion outlet directly leads to a higher turbine pressure, allowing the gas to generate more mechanical energy in the turbine. Consequently, it enhances the overall power output of the micro gas turbine. (3) In a micro gas turbine, the exhaust gases from the turbine typically pass through the CW-PSR and are then directed into the exhaust pipe, venting directly into the atmosphere. This configuration ensures that the gas-side outlet pressure of the CW-PSR remains at atmospheric pressure. Consequently, the excellent gas-side resistance performance of the CW-PSR corresponds to lower pressure losses on the gas side. This, in turn, results in a reduction in backpressure on the turbine and an increase in the working capability of the gas within the turbine.
In summary, both the resistance and heat transfer performance on the gas and air sides are of significance in a micro gas turbine. The variation in the curvature of the CW-PSR has different effects on these performances. Through the preceding analysis, it is evident that finding a curved profile that optimizes both resistance and heat transfer performance on both sides is practically challenging. Therefore, in practical applications, the choice of curvature for the CW-PSR needs to be based on the performance characteristics and requirements of the micro gas turbine. Additionally, the dimensional parameters (Rc, Rh, H, A, L) of the CW-PSR heat transfer unit also influence the aforementioned performances. In light of this, the present study, in Section 4.4, employs experimental design and numerical simulation methods, along with the DD algorithm, to establish the relationship between the flow-heat transfer performance of the CW-PSR and the curvature and unit parameters. This information serves as a valuable database for the design of the CW-PSR.

4.2. Analysis of the Effect of VSFA on Heat Transfer Performance

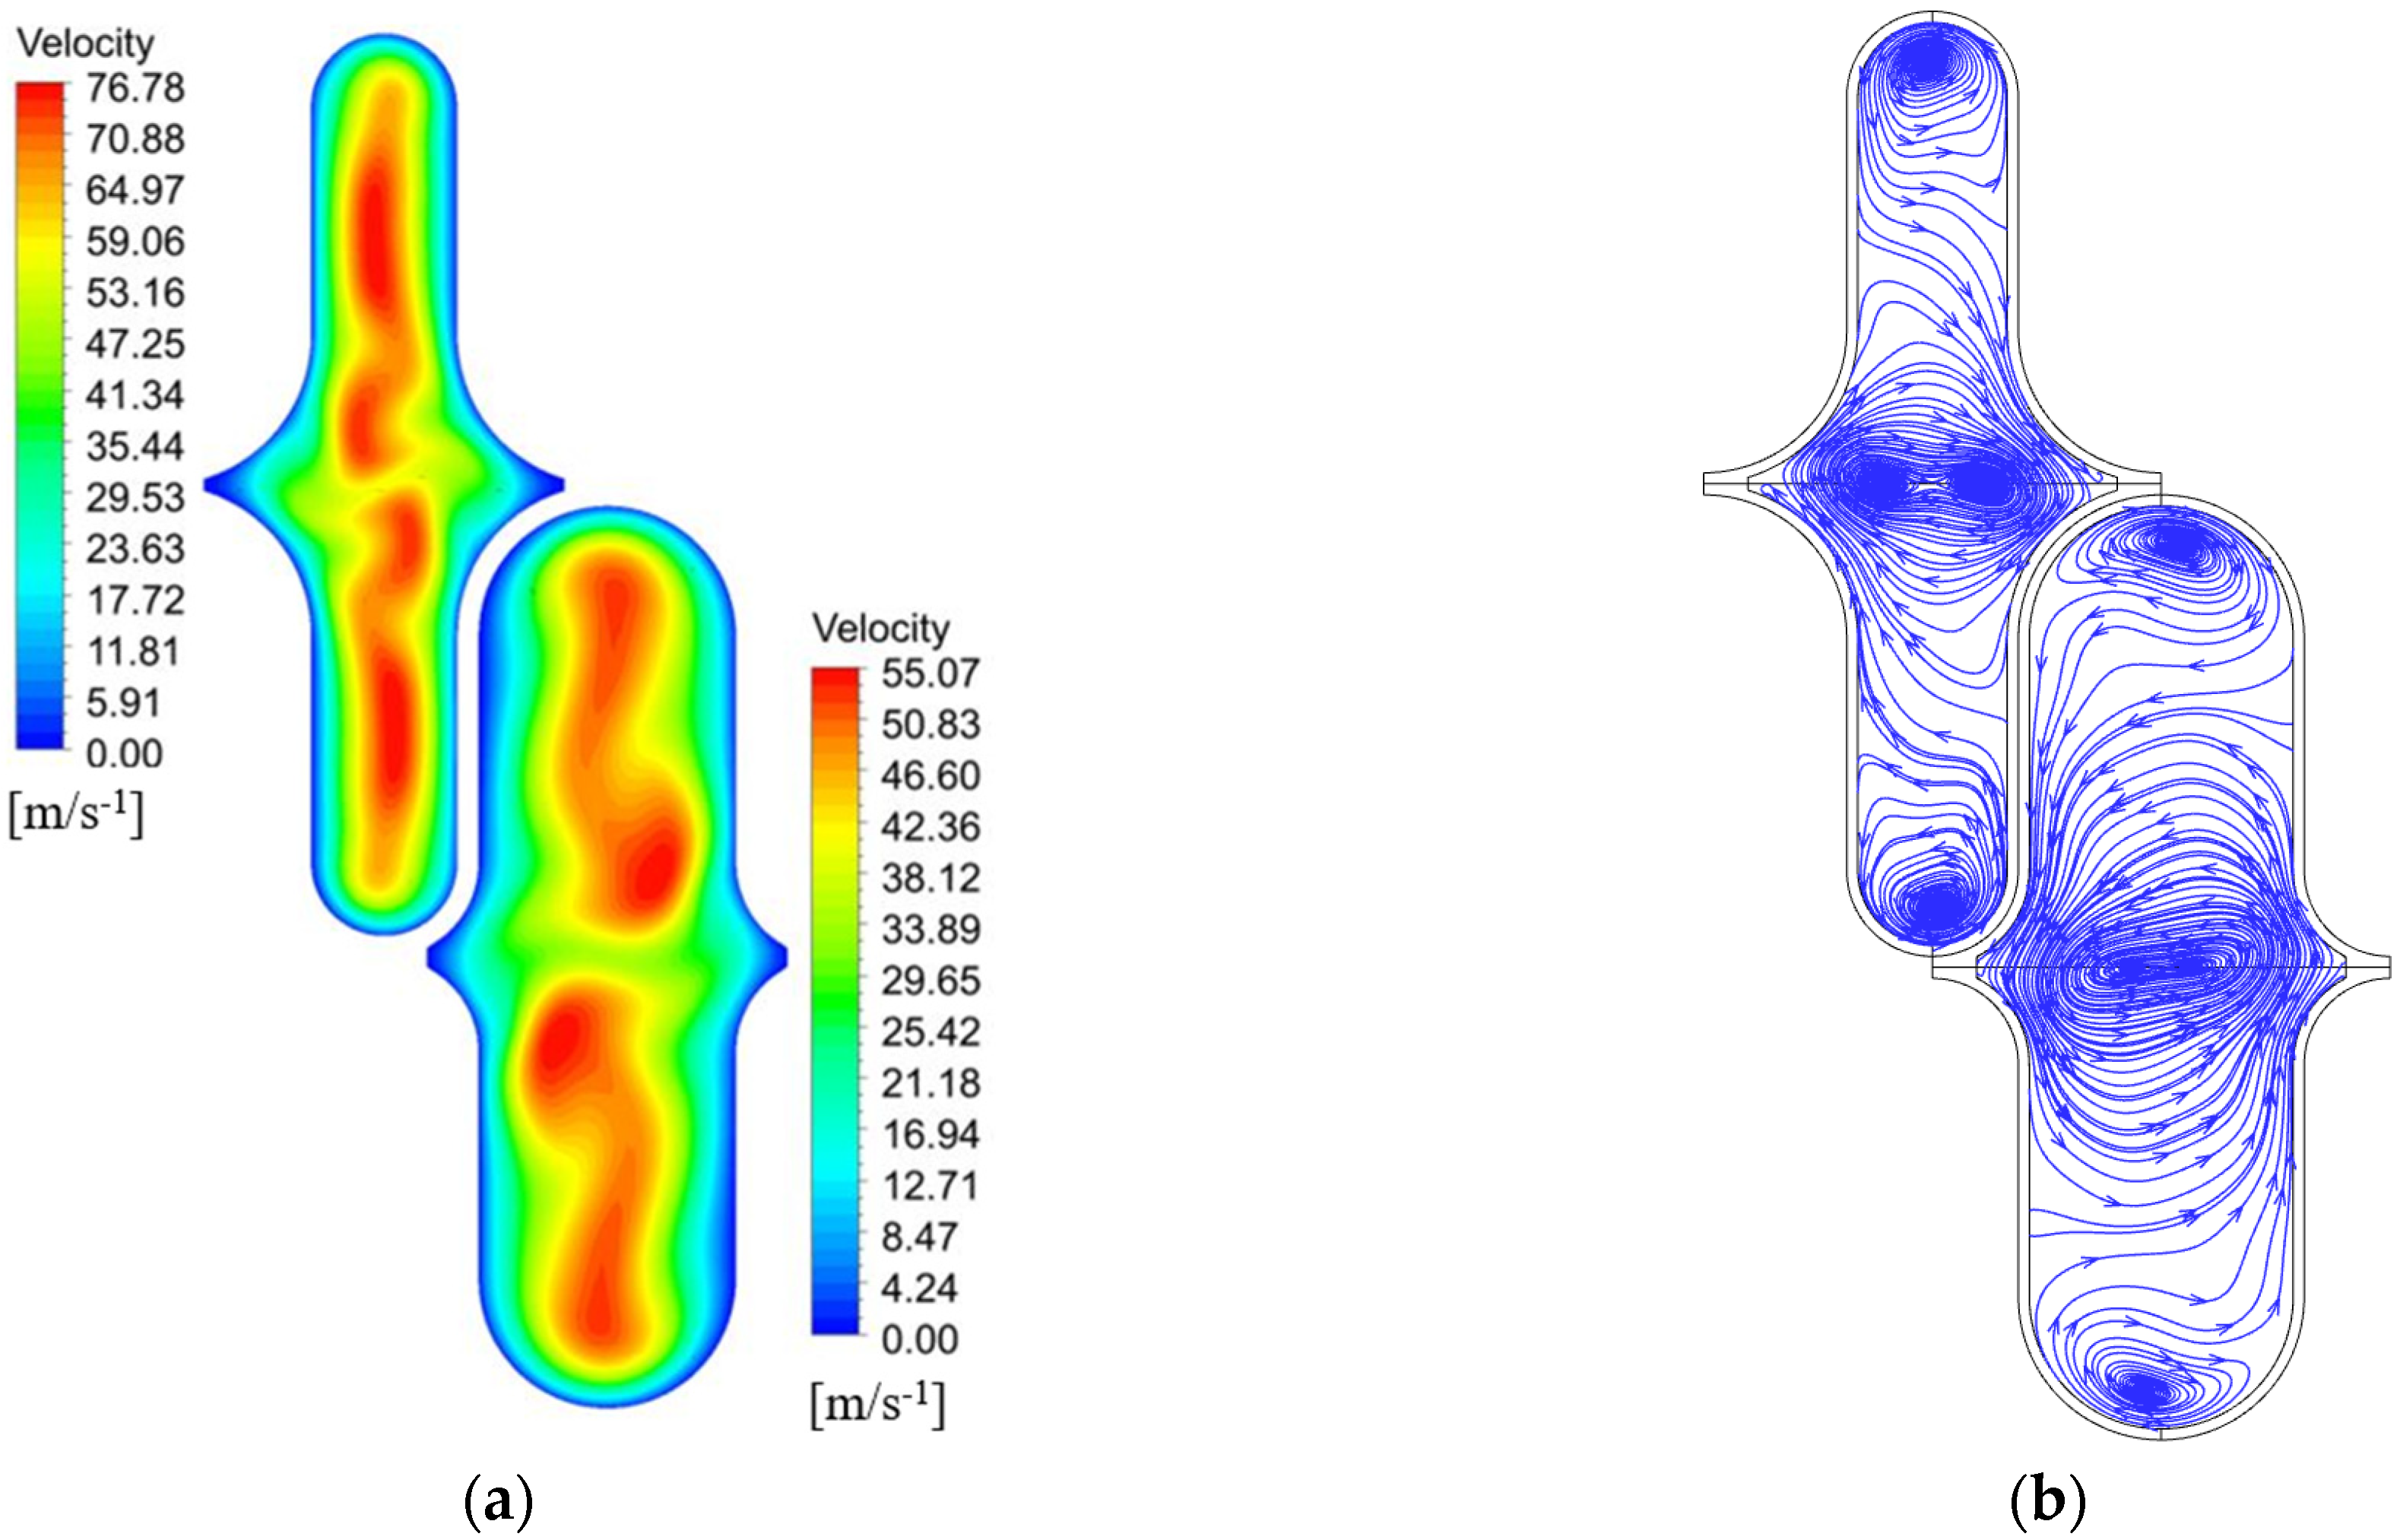
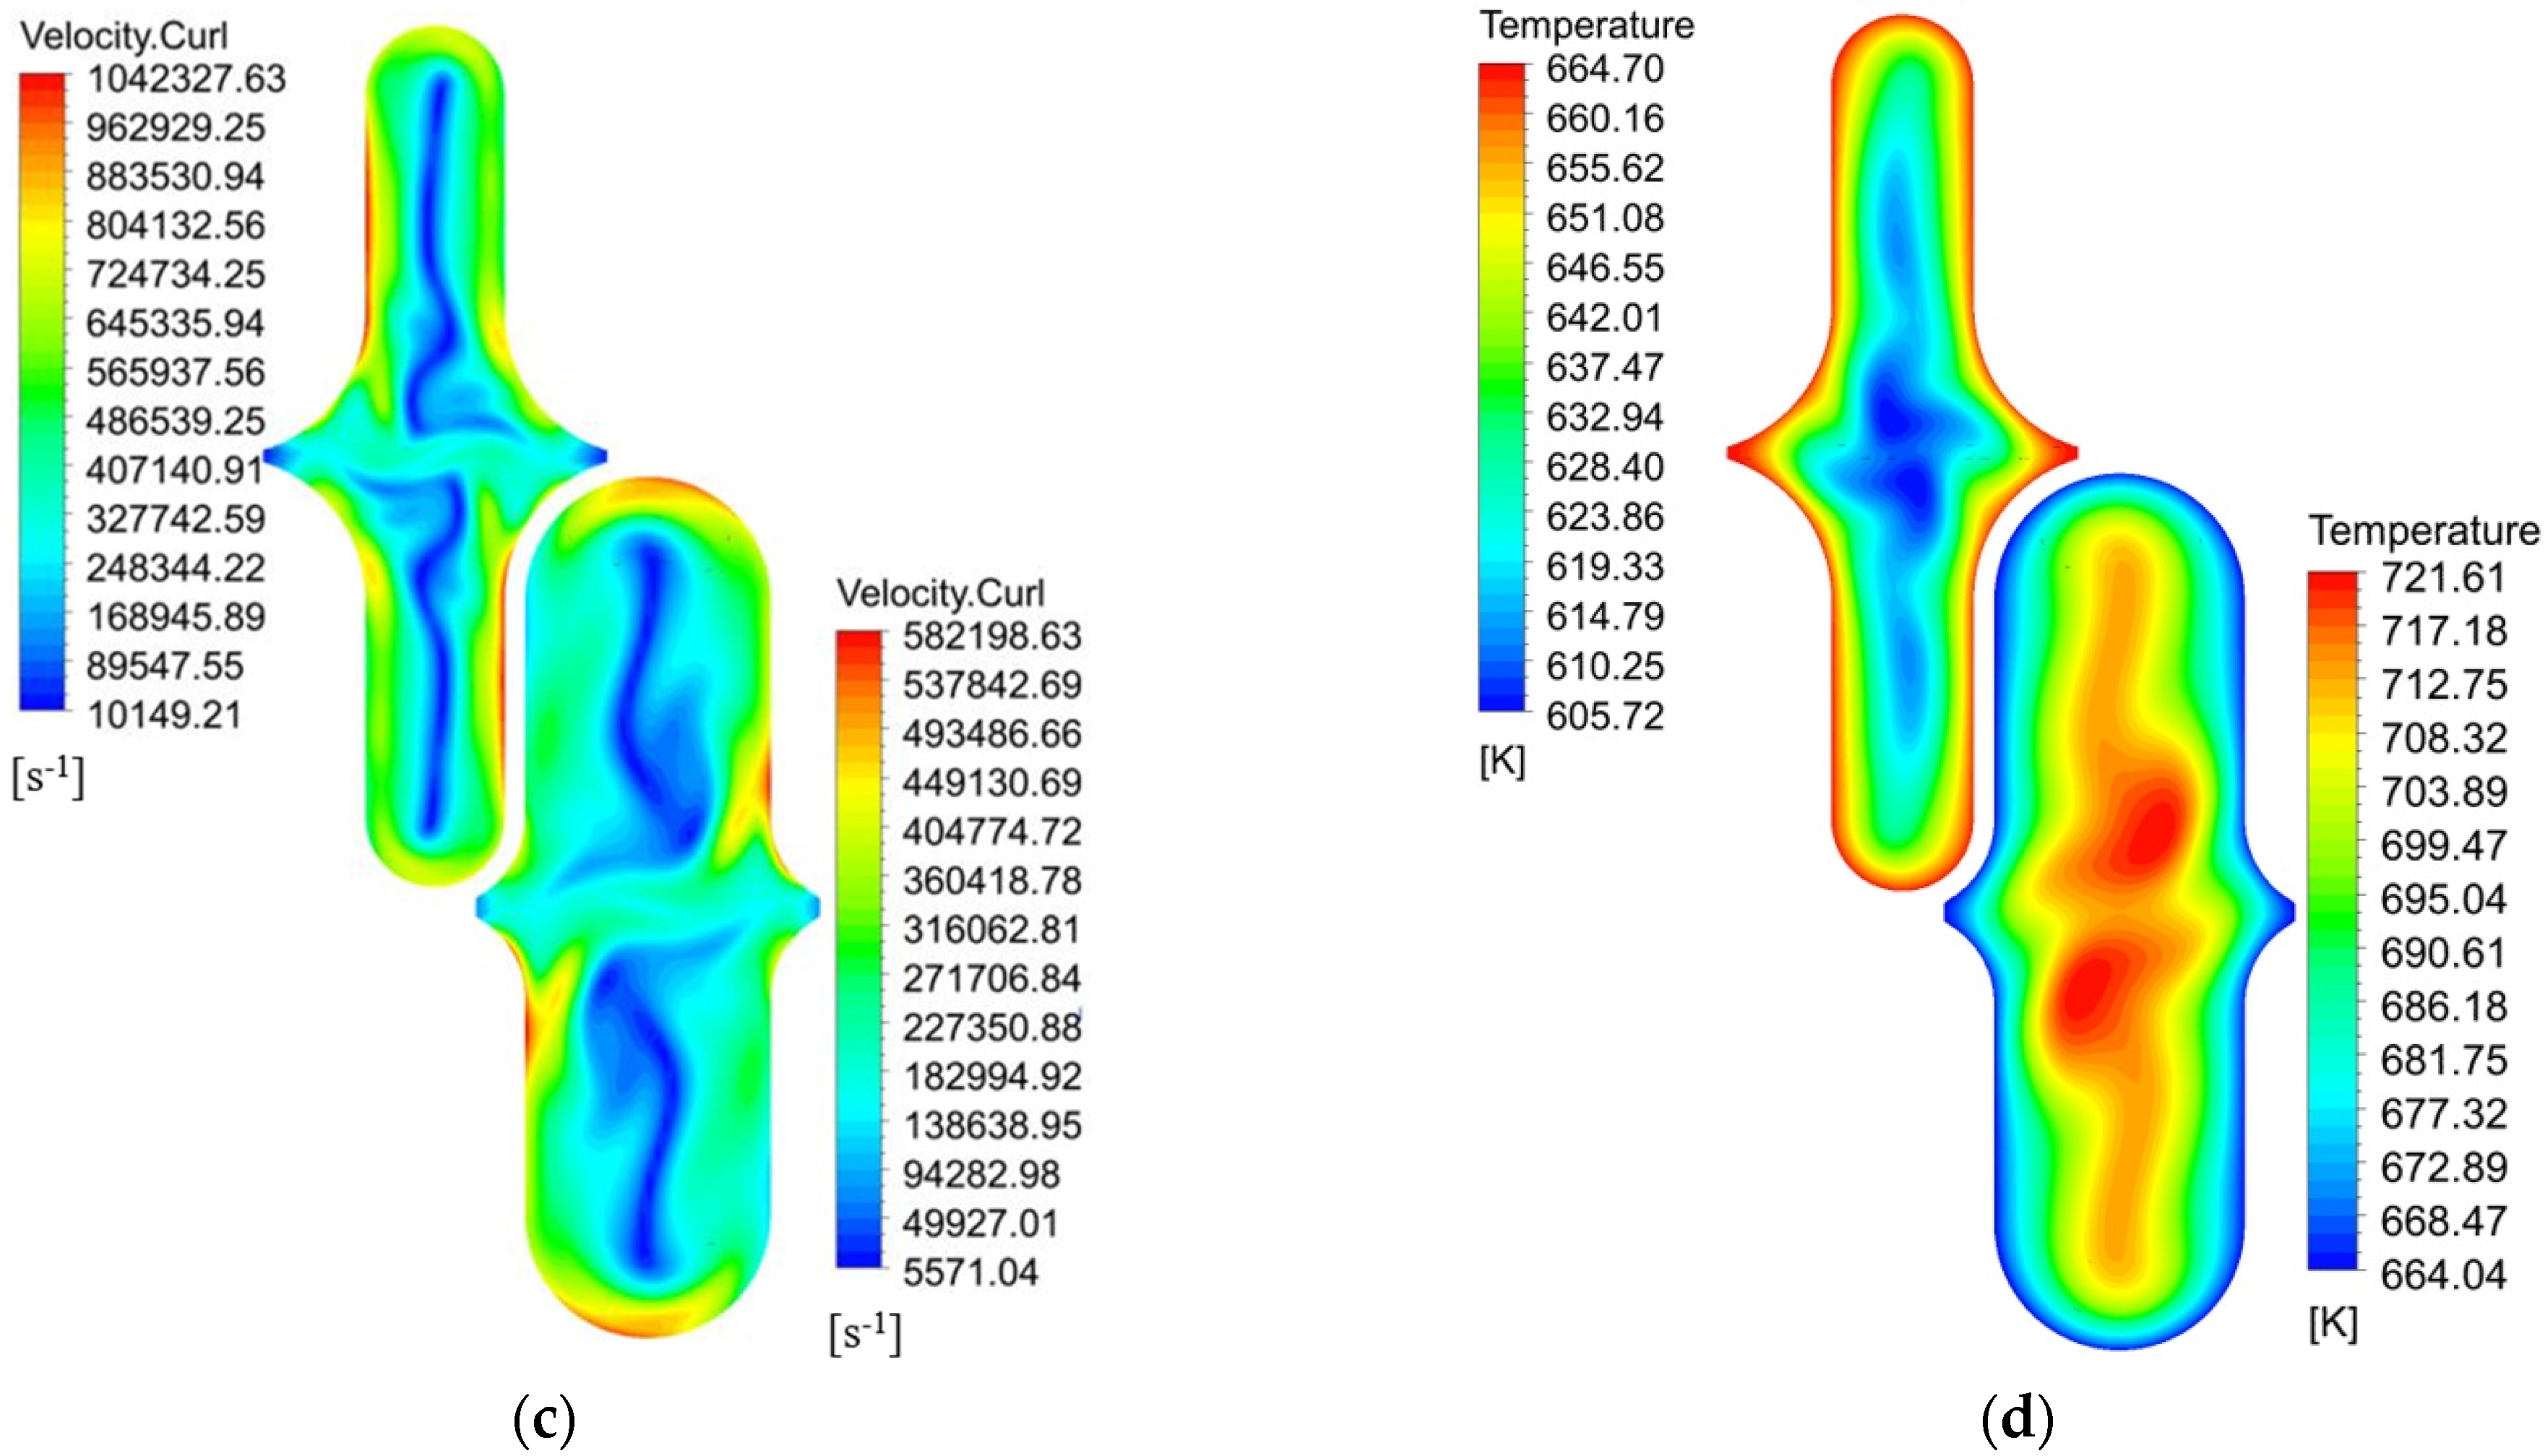
In unveiling the flow attributes of the CW-PSR plate and conducting a qualitative examination of the intricate connections among heat transfer capability, velocity, and vorticity, we commence by revealing the computational results derived from a singular CW channel. Figure 12 presents variables related to flow and heat transfer, along with the vector distribution within a solitary CW channel positioned at Z = Lc. To enhance visual clarity, distinct legends are employed for the gas and air channels. The visual examination reveals minor vortices near the extremities and the center of the flow cross-sections, as depicted in Figure 12a,b. The secondary flow under scrutiny in this exploration predominantly refers to the vortical secondary flow perpendicular to the mainstream direction. Simultaneously, the velocity field highlights a thinner velocity boundary layer near the wall where the fluid alters its flow direction. Figure 12c underscores the evident existence of secondary flow phenomena within the CW-PSR channel. Moreover, due to the inclusion of rotation and shear in the velocity curl, a substantial vorticity is observed in the thinner boundary layer. This secondary flow possesses the capability to perturb both thermal and flow boundary layers, thereby augmenting heat transfer between the working fluids and the solid wall. Furthermore, through a comparative analysis of Figure 12, a conspicuous correlation emerges among the distribution of velocity field, vorticity field, and temperature field, signifying a discernible connection between heat transfer and velocity and vorticity.
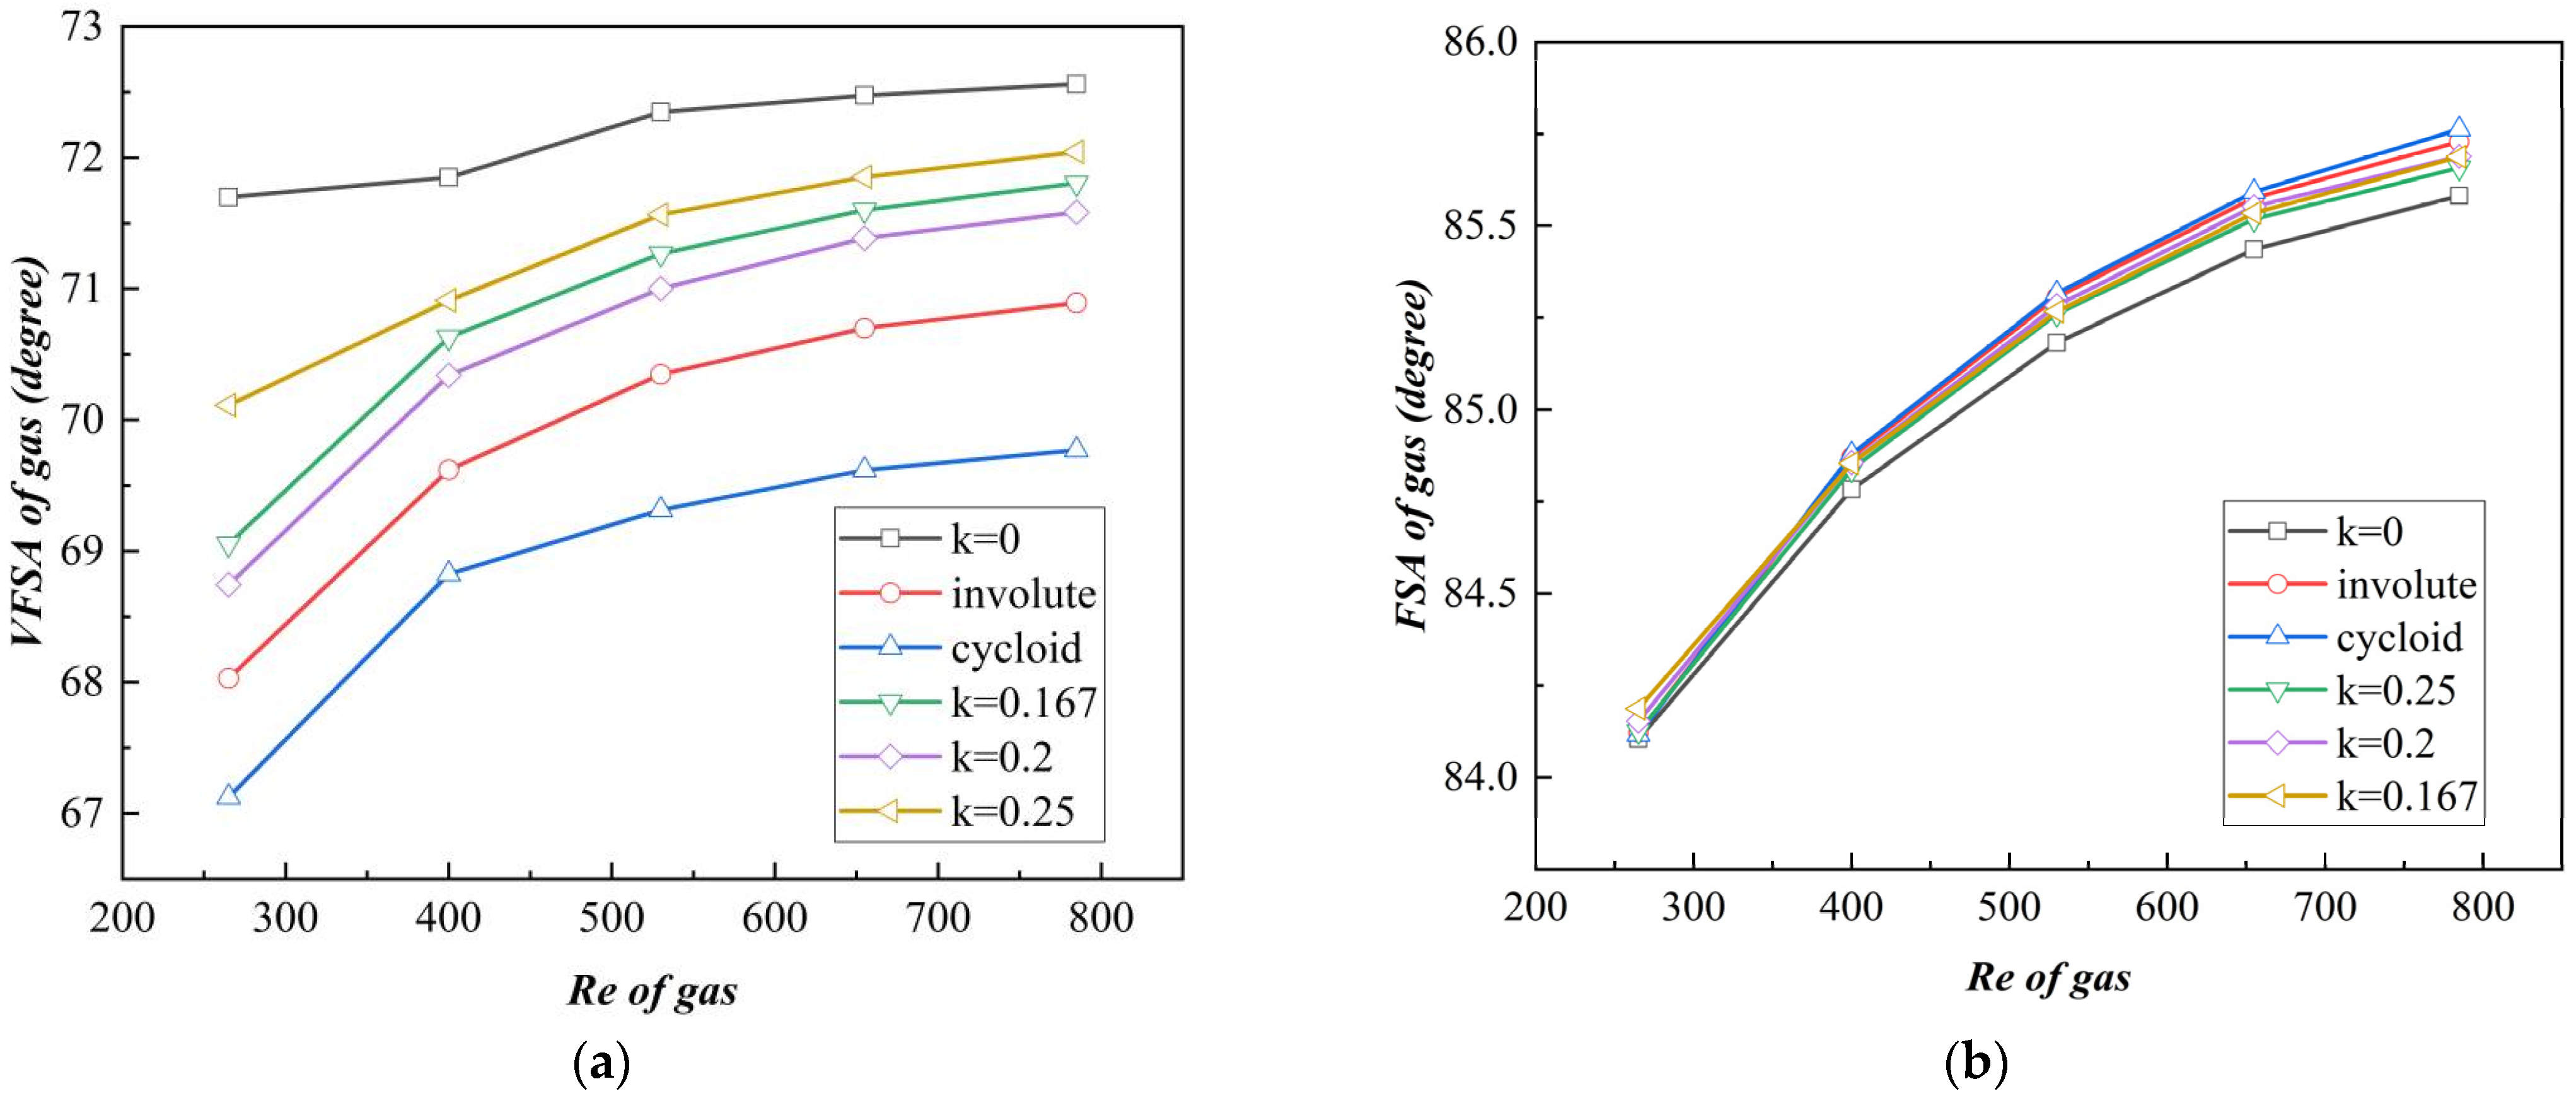
Figure 13a,b present the variations of VFSA and FSA with Re for diverse curved gas channels. According to the established principle of promoting heat transfer with larger VFSA and smaller FSA, their heat transfer capabilities from large to small are k = 0, k = 0.25, k = 0.167, k = 0.2, involute and cycloid, respectively. Upon comparison with Figure 8b, it can be inferred that this outcome is entirely consistent with the gas-side Nu depicted in Figure 8b. Additionally, Figure 8b reveals a significant differentiation in heat transfer capability between the two variants’ CW-PSR plate with k = 0 and cycloid shape, relative to other forms. This phenomenon is solely replicated in VFSA, whereas no marked difference existed between the FSA of cycloid and other examples. The discrepancies between various bending curvatures are more distinct in terms of VFSA than FSA. Within the confines of the study, the maximum variation in VFSA at a given Reynolds number equals 4.575 degrees, while that of FSA is only 0.0114 degrees. These findings indicate that, in the CW-PSR plate, the heat transfer capacity is more responsive to VFSA than to FSA.
The results of this study demonstrate that within the context of the CW-PSR plate, the VFSA exhibits a greater sensitivity to fluctuations in heat transfer capacity as compared to the FSA. Furthermore, the FSA consistently maintains elevated levels when subjected to robust secondary flow within the channel. A discrepancy of 8% is found in the total heat transfer coefficients among distinct heat exchangers, and the difference in VFSA is more than 6% for VFSA, whereas the variance for FSA remains negligible at a mere 0.0133%. In real-world engineering scenarios involving intricate heat exchanger models, the potential modeling and computational inaccuracies may surpass the innate disparities present in FSA. Employing VFSA can effectively mitigate such issues to a considerable extent.
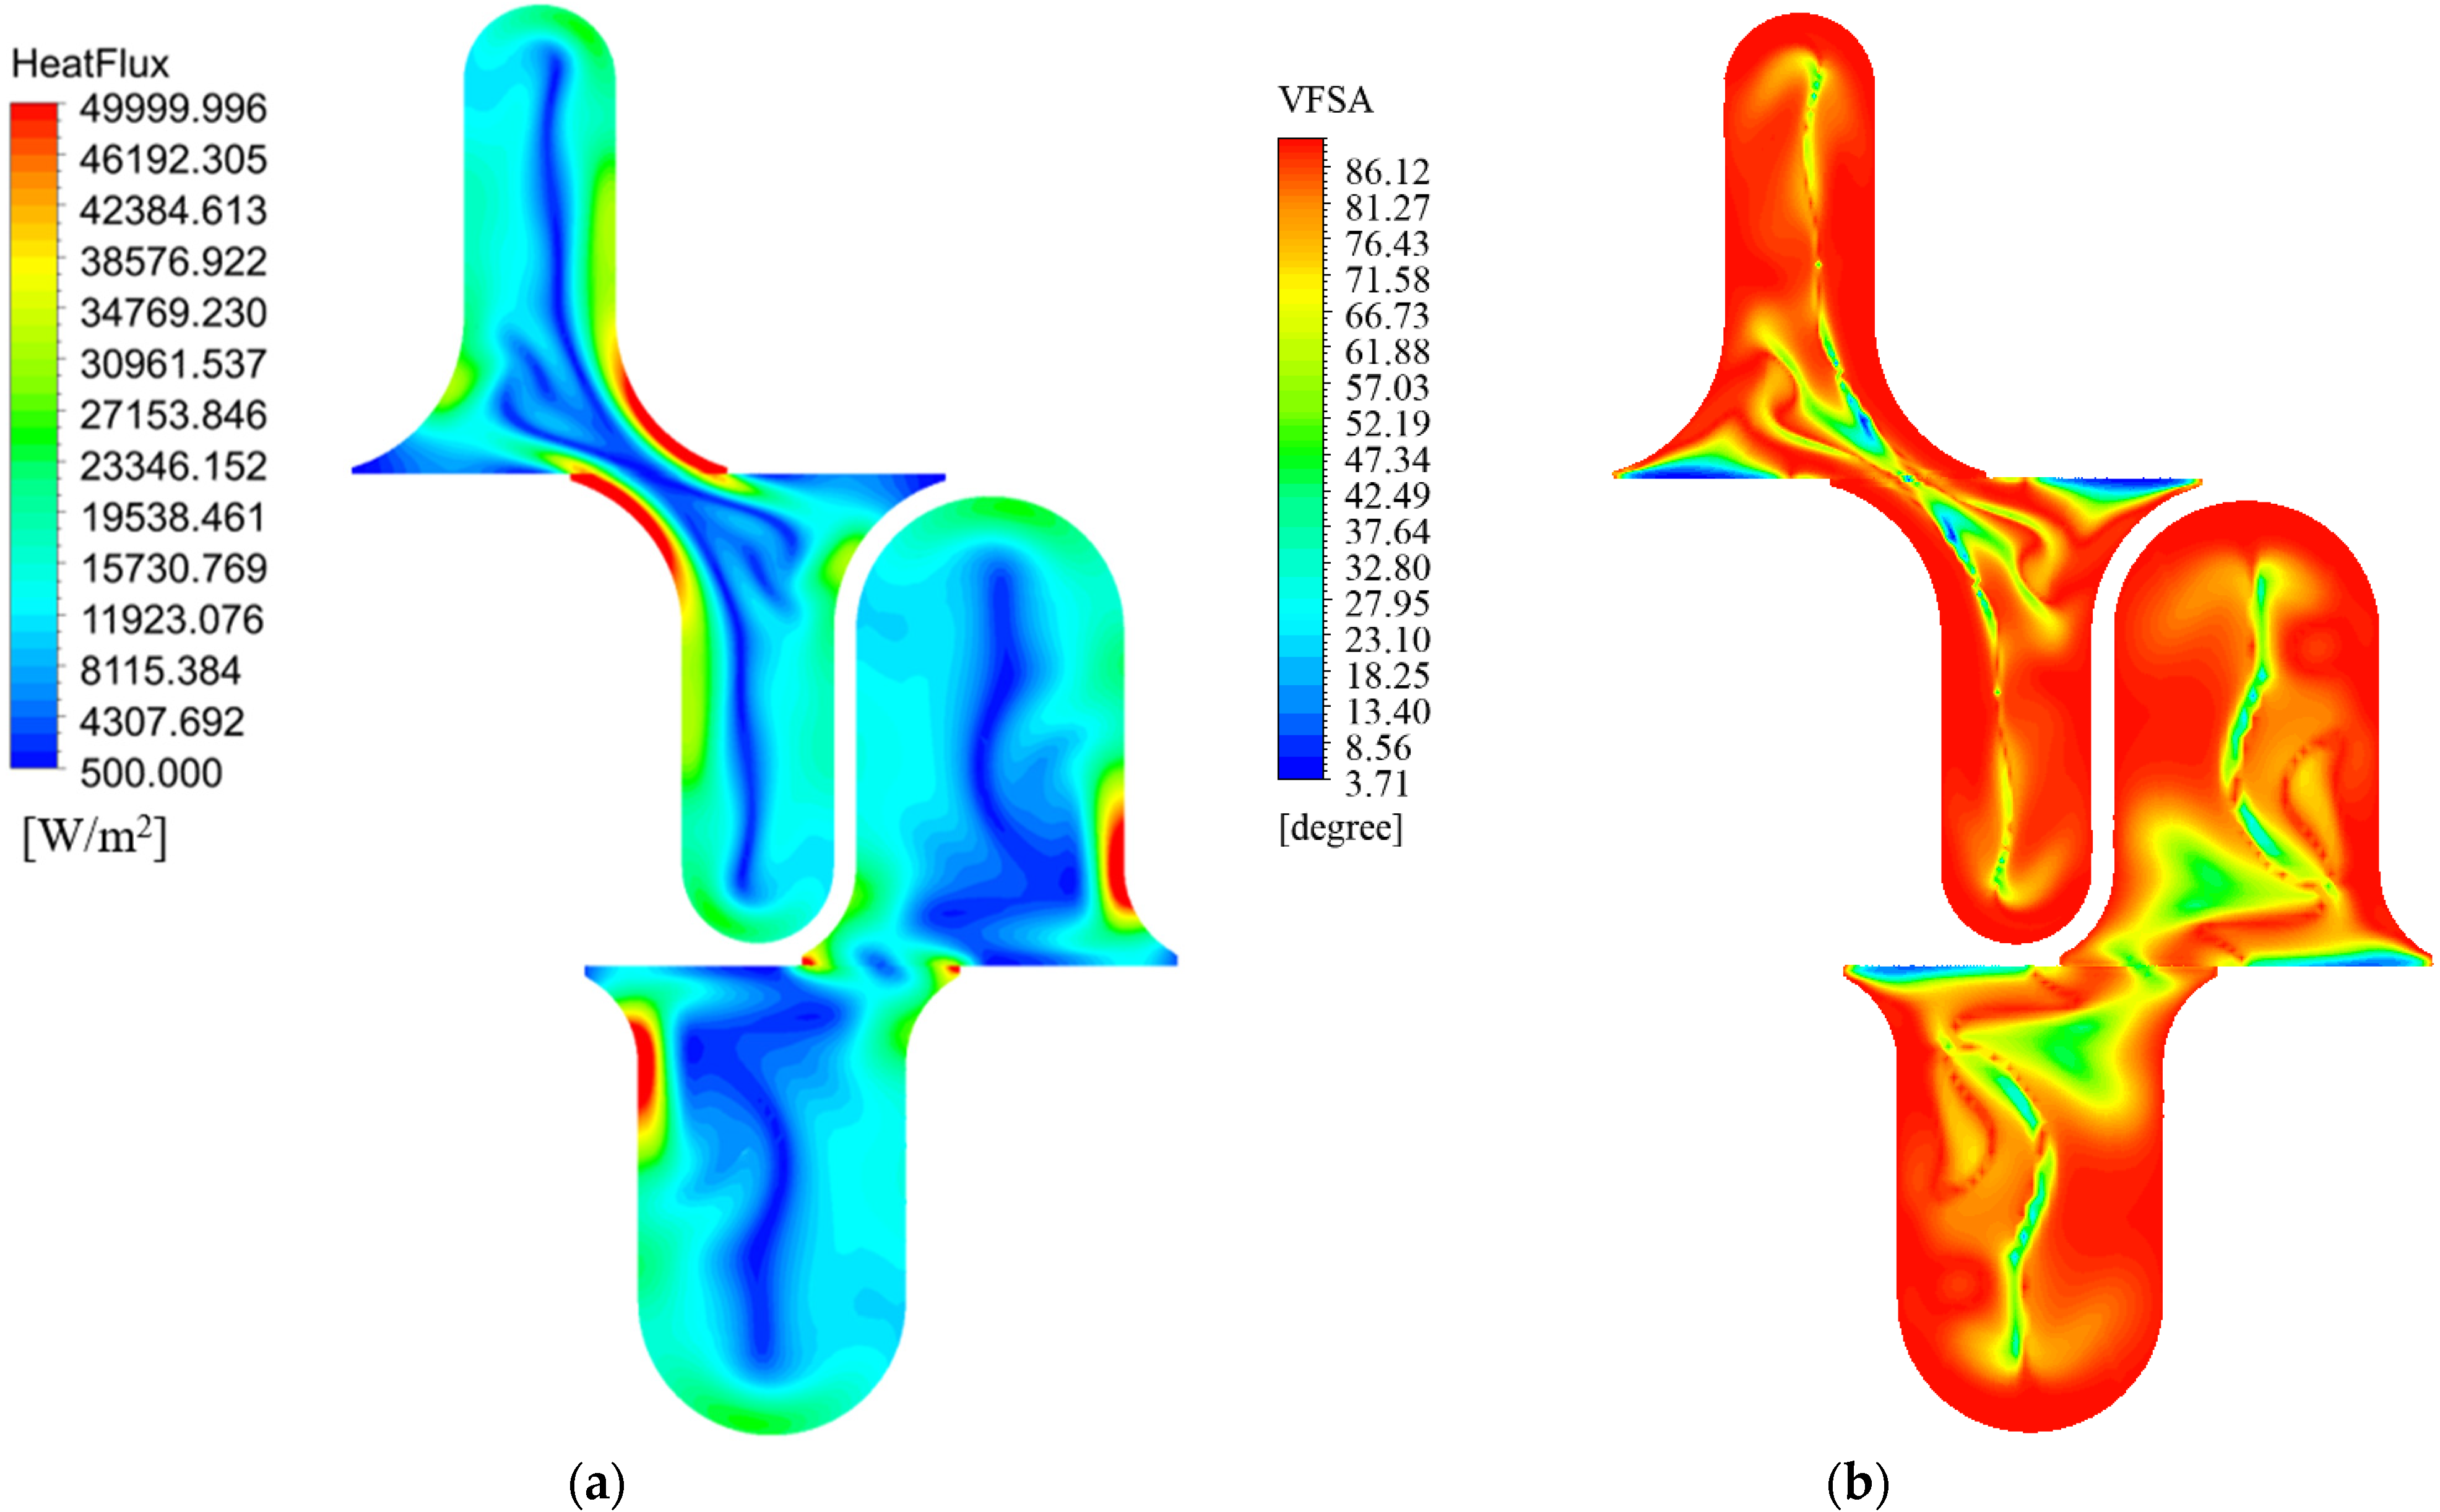
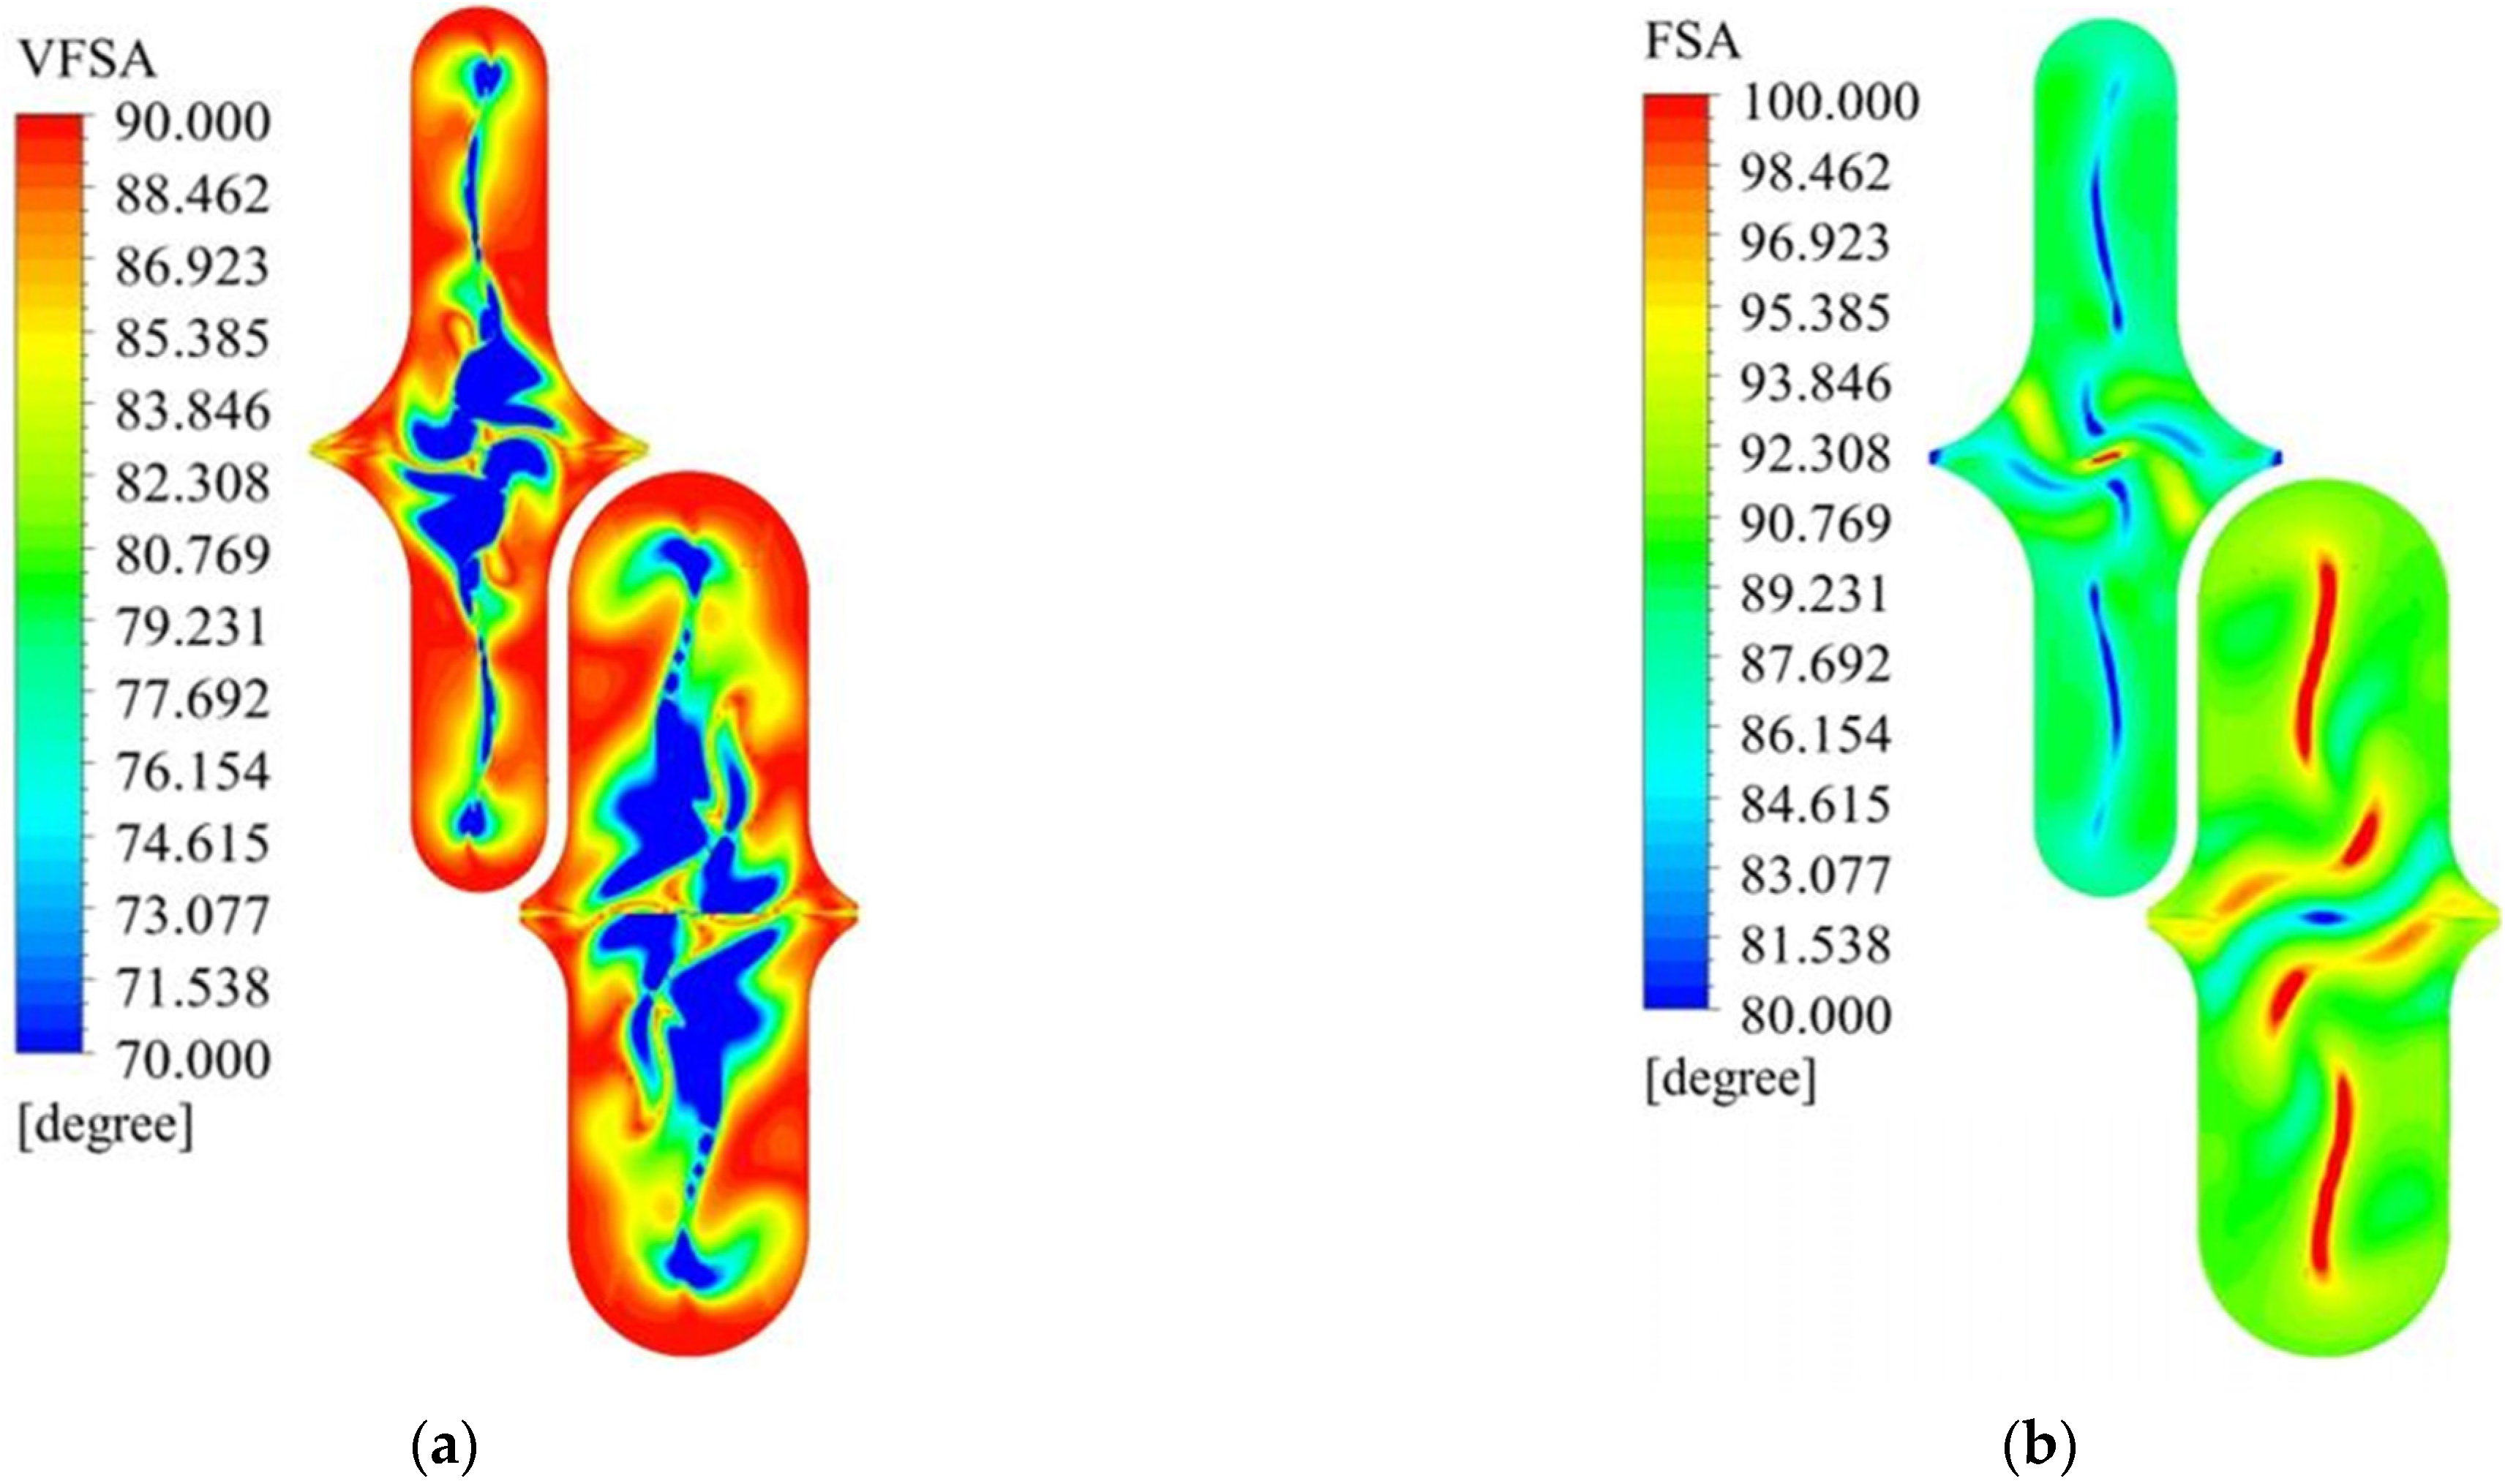
The present study investigates the distribution of VFSA and heat transfer in a single CW channel at Z = 0.3Lc, as illustrated in Figure 14. The heat transfer is evaluated based on the absolute values derived from Fourier’s law. The figure exhibits a remarkable level of coherence between the distributional trends of VFSA and heat transfer, signifying that the magnitude of the angle between velocity gradient and vorticity has an impact on the heat transfer intensity. Specifically, when the angle between the two vectors approaches 90 degrees, it results in a more conducive environment for heat transfer.
Figure 15 depicts the distribution of FSA and VFSA at the same cross-sectional location. By comparing Figure 8a,b, this divergence in the distribution of FSA and VFSA becomes particularly conspicuous along the boundary of the air channel, where FSA attains larger values. Correspondingly, VFSA also registers substantial values in this region, triggering a rapid decline in the distribution of FSA towards the channel’s central zone. The seeming paradox is reconciled by recognizing the distinct roles these angles play in characterizing heat transfer dynamics. FSA encapsulates the convective term, offering insights into the overall convective heat transfer scenario. In contrast, VFSA delves into the gradient of this convective term, unveiling the nuanced changes in FSA distribution. The intricate interplay unfolds when considering the velocity boundary layer near the wall during convective heat transfer. At this critical juncture, VFSA and FSA both converge towards 90°, indicative of optimal conditions for heat transfer. A larger FSA in this context suggests less favorable heat transfer, while a higher VFSA signals a dynamic shift in FSA distribution, favoring improved heat transfer potential. In essence, VFSA serves as a nuanced indicator, shedding light on the transformative potential within FSA along the channel. Its role extends beyond a direct correlation with heat transfer capability, offering a more profound understanding of the dynamic interrelationships influencing convective heat transfer. This intricate dance between VFSA and FSA, as depicted in Figure 8, highlights the sophisticated nature of heat transfer processes within the channel, guiding us toward a more comprehensive comprehension of the underlying physics at play.

4.3. The Effect of Different Curvature on the Distribution of VFSA

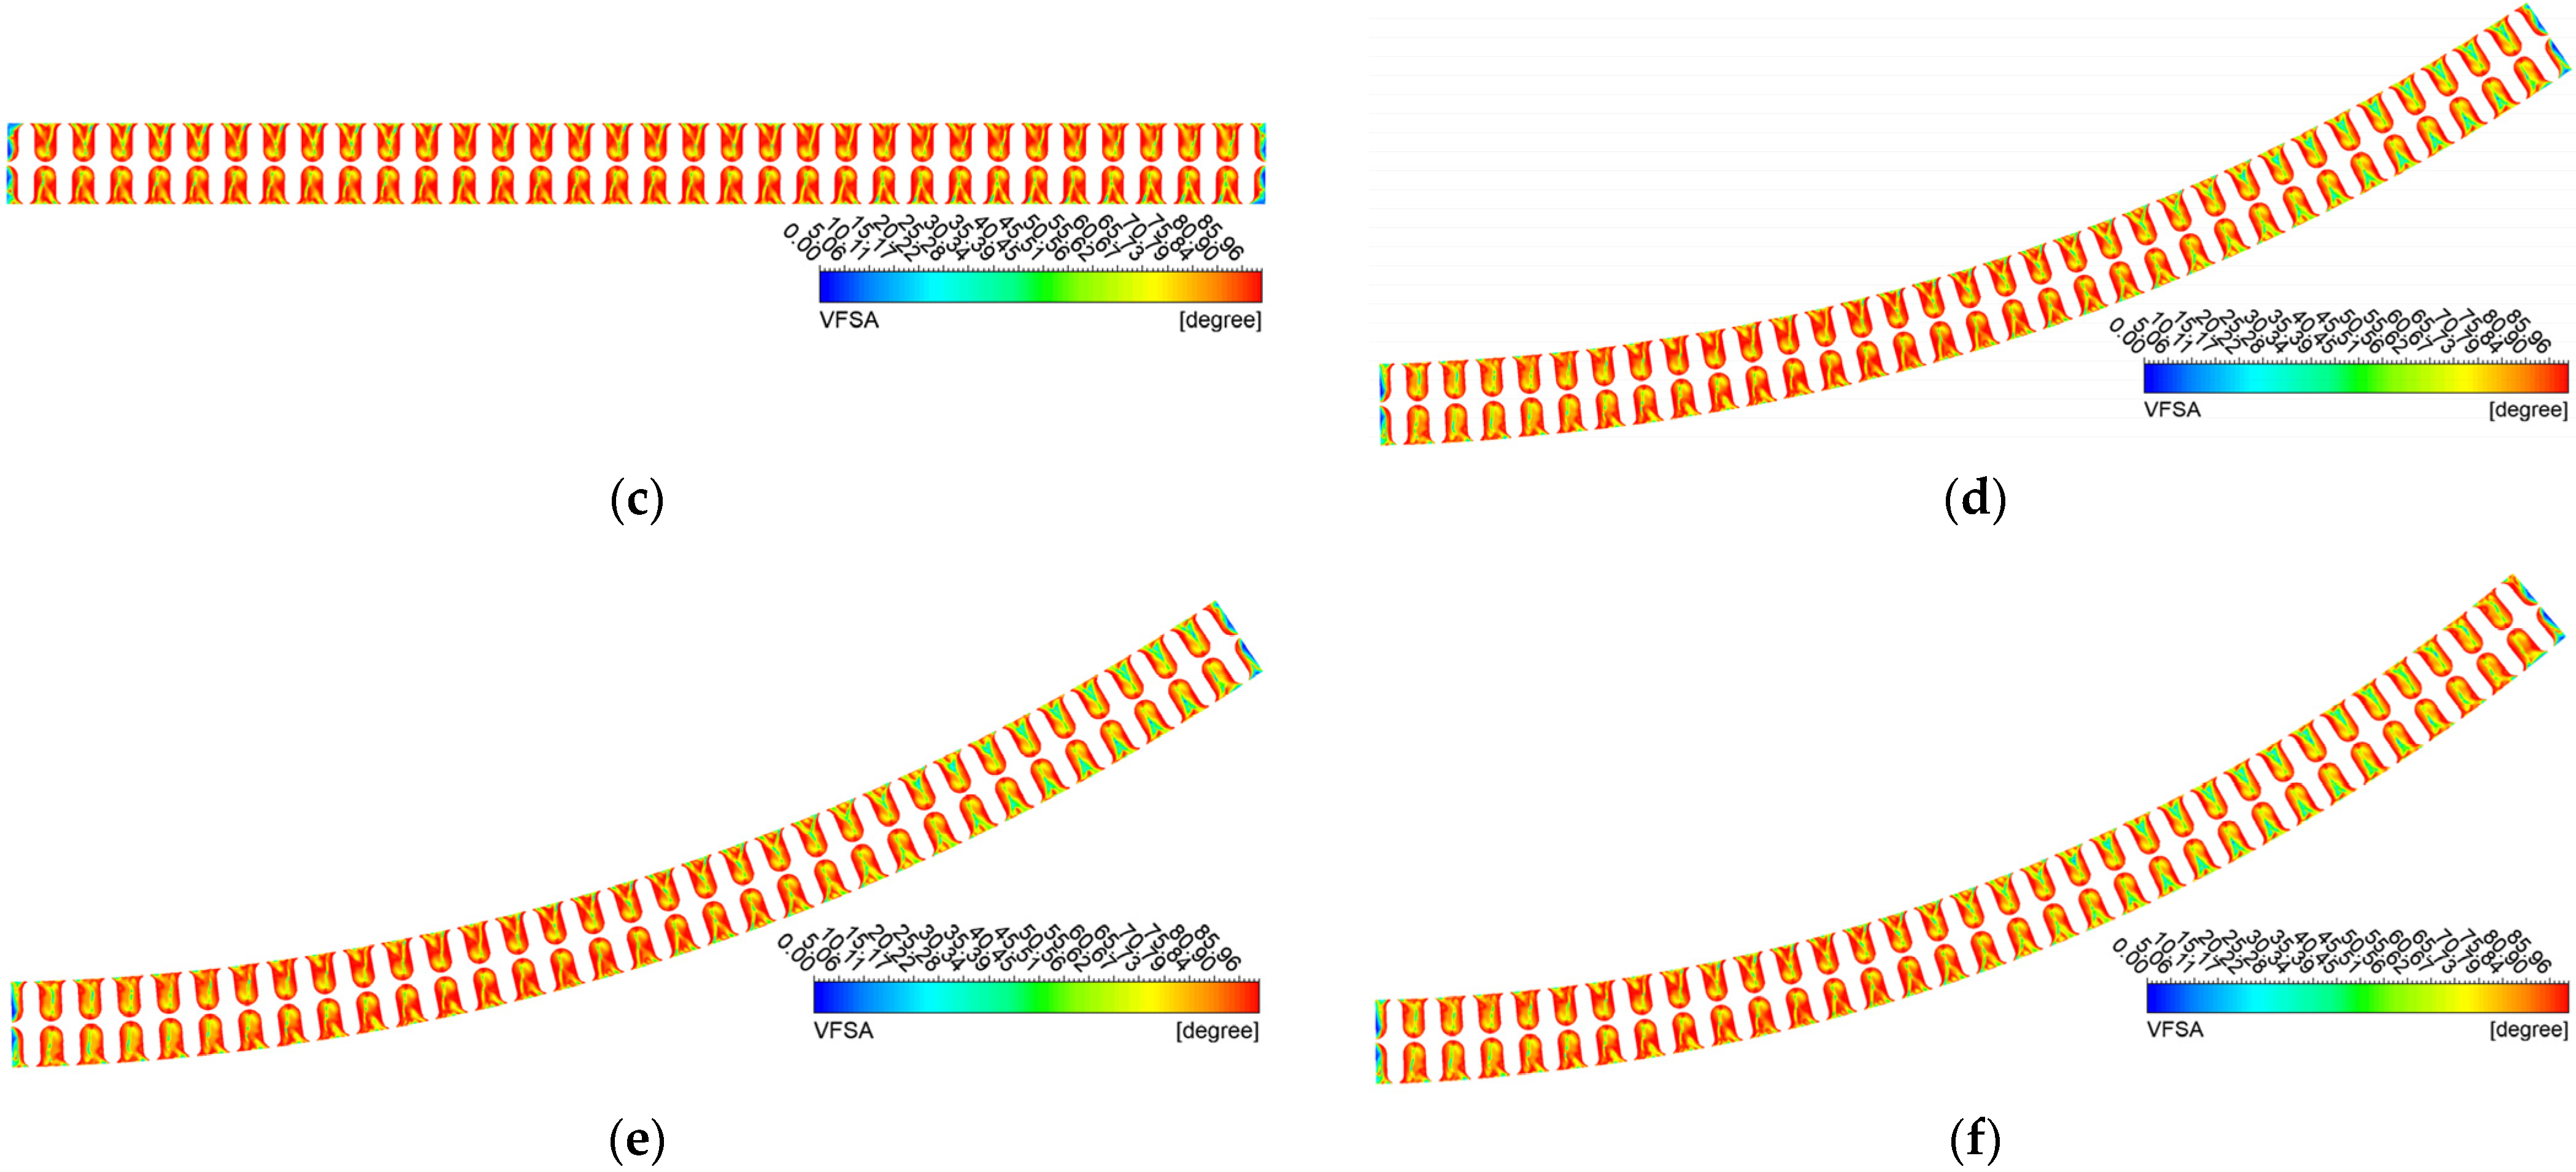
Figure 16 depicts the VFSA distribution contours of the gas side channel cross-section of CW-PSR plates with diverse bending shapes, situated at the middle position flow channel. To facilitate a deeper understanding of the geometric structure, Figure 16a presents a schematic illustration of the CW-PSR plate and the analyzed cross-section. The results disclosed in Figure 14 indicate that the heat transfer channels in other curved CW-PSR plates have lower VFSA compared to the k = 0 situation shown in Figure 16c. Notably, cycloid and involute exhibiting locally higher curvature manifest the most severe reduction in VFSA. Specifically, in Figure 16a, the cycloid shape exhibits a substantial decrease in the majority of channels’ VFSA values. This finding underscores that profiles featuring localized high curvature levels have a more pronounced impact on the secondary flow phenomenon of a CW-PSR, thereby affecting the synergy degree of vorticity and temperature gradient, reducing the synergy angle between them, and consequently diminishing the heat transfer capacity.
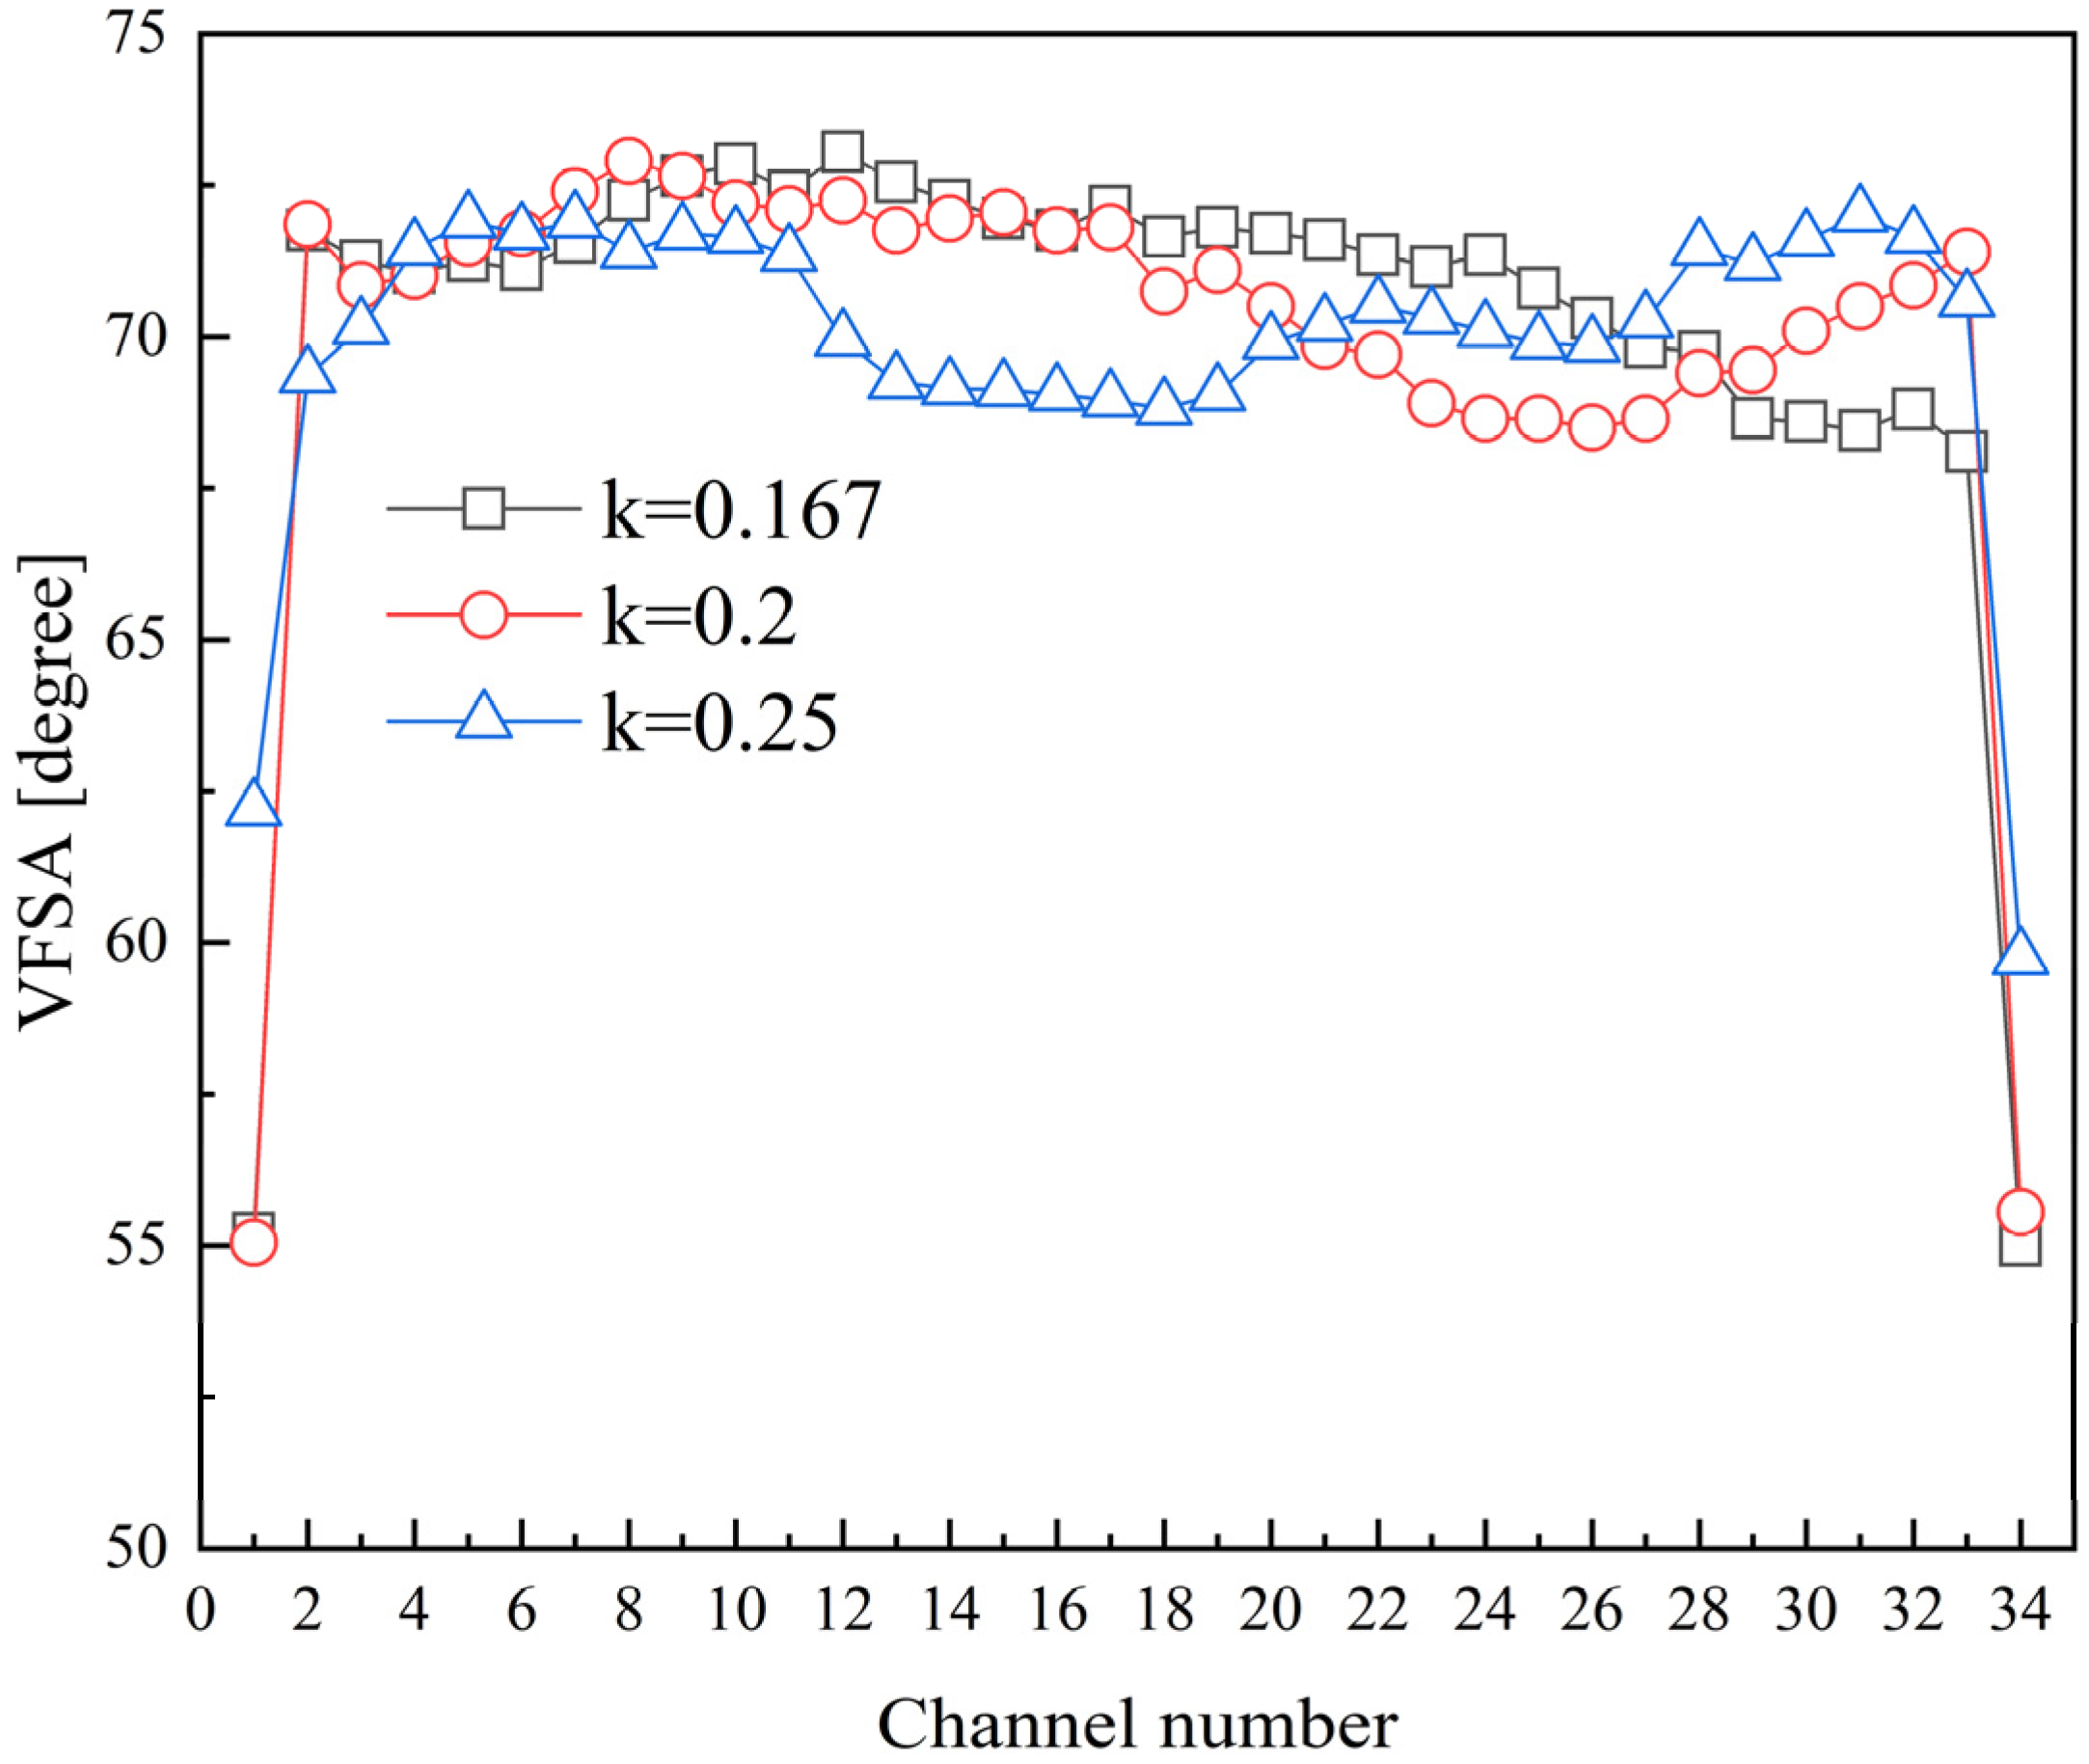
When considering CW-PSR plates with a constant curvature arc curve shape, an analysis of Figure 16d–f indicates that a reduction in VFSA values is observed only in portion channels as one moves from the inner diameter position to the outer diameter position. Furthermore, as the degree of curvature increases, the location of these channels progressively shifts toward the inner diameter position. Figure 17 illustrates the distribution of VFSA values for channels at different positions in the CW-PSR plate, where channels closest to the inner diameter are labeled as 1, and the numbering increases sequentially towards the outer diameter, with the channels closest to the outer diameter labeled as 34. The graph reveals that there are several channels with a lower VFSA in the CW-PSR plate, and these channels are closely packed together. Different curved profiles result in a variation in the distribution of these channels, indicating that a curved CW-PSR exhibits noticeable heat transfer non-uniformity. The heat transfer performance of some channels deteriorates, and different curved profiles lead to heat deterioration occurring at different locations.
As the curvature increases, the locations of the heat deterioration gradually shift towards the inner diameter, and the heat transfer capability of the heat exchange channels near the outer diameter gradually increases. Particularly, when the curvature (k) increases to 0.25, a significant increase in VFSA is observed in the outer diameter region. Therefore, the relationship between the heat transfer capability of different channels and the curvature is nonlinear. This observation explains the nonlinearity in the heat transfer capacity of the CW-PSR concerning curvature, as depicted in Figure 8.

4.4. The Combined Influence of Unit Size and Structural Curvature on the Heat-Transfer and Flow Performance of CW-PSR

This study comprehensively considers the influence of six design variables, namely the dimensions of the CW-PSR heat transfer unit (Rc, Rh, H, A, L) and the curvature (k), on the Nusselt numbers and friction coefficients on the cold and hot sides. To eliminate the influence of heat conduction, the thickness of the solid (Ws) is fixed at 50 μm. The ranges of variation for the considered design variables (Rc, Rh, H, A, L, k) are 0.12~0.22 mm, 0.25~0.35 mm, 0.4~0.7 mm, 4.5~6.5 mm, 0.2~1.0 mm, and 0.1~0.3, respectively.
The Latin Hypercube Design (LHD) method was employed for numerical experimental design, conducting a total of 40 experiments. The design dimensions of different experimental samples and their respective numerical results are listed in Table 3 and Table 4, respectively.
The relationship between optimization objectives and the design factors required during the optimization process is obtained through a dendrite net [35] (DD), which is a novel machine learning algorithm [35]. Unlike traditional neural networks with a multi-layer perceptron (MLP) architecture that simulates cell body functions in simulated biological neural systems, DD simulates information processing in dendrites by implementing multiple logical operations. All information from the hidden layers used in the simulation process is interpretable.
DD employs matrix multiplication and element-wise product (Hadamard product) as the neuron operation functions to construct a function expression that includes logical relationships among inputs, as shown in the equation.
A l = W l , l 1 A l 1 X
In this context, Al−1 and Al respectively represent the input and output of the l-th layer module, X is the initial input of the network, and Wl,l−1 denotes the weight matrix between the (l − 1)-th and l-th layers. The symbol ◦ represents the Hadamard product. The function expression, containing information about logical relationships among inputs, can be illustrated through a two-layer DD calculation process with three inputs and one output, as shown in the following formula:
f X = W 21 W 10 X X = W 11 21 W 12 21 W 13 21 × W 11 10 W 12 10 W 13 10 W 21 10 W 22 10 W 23 10 W 31 10 W 32 10 W 33 10 x 0 x 1 x 2 x 0 x 1 x 2 = W 11 21 W 11 10 x 0 2 + W 12 21 W 22 10 x 1 2 + W 13 21 W 13 10 x 2 2 + W 11 21 W 12 10 + W 12 21 W 21 10 x 0 x 1 + W 11 21 W 13 10 + W 13 21 W 31 10 x 0 x 2 + W 12 21 W 23 10 + W 13 21 W 32 10 x 1 x 2
In this context, x0 is set to 1. The coefficient matrix W expresses the degree of influence of corresponding design factors on the objective function. For instance, if the coefficient W 11 21 W 11 10 in Equation (19) is a positive number with the largest absolute value, it represents the x 0 2 that maximally amplifies the impact on the objective function. Conversely, if it is a negative number with the largest absolute value, it signifies the x 0 2 that diminishes the impact on the objective function to the greatest extent.
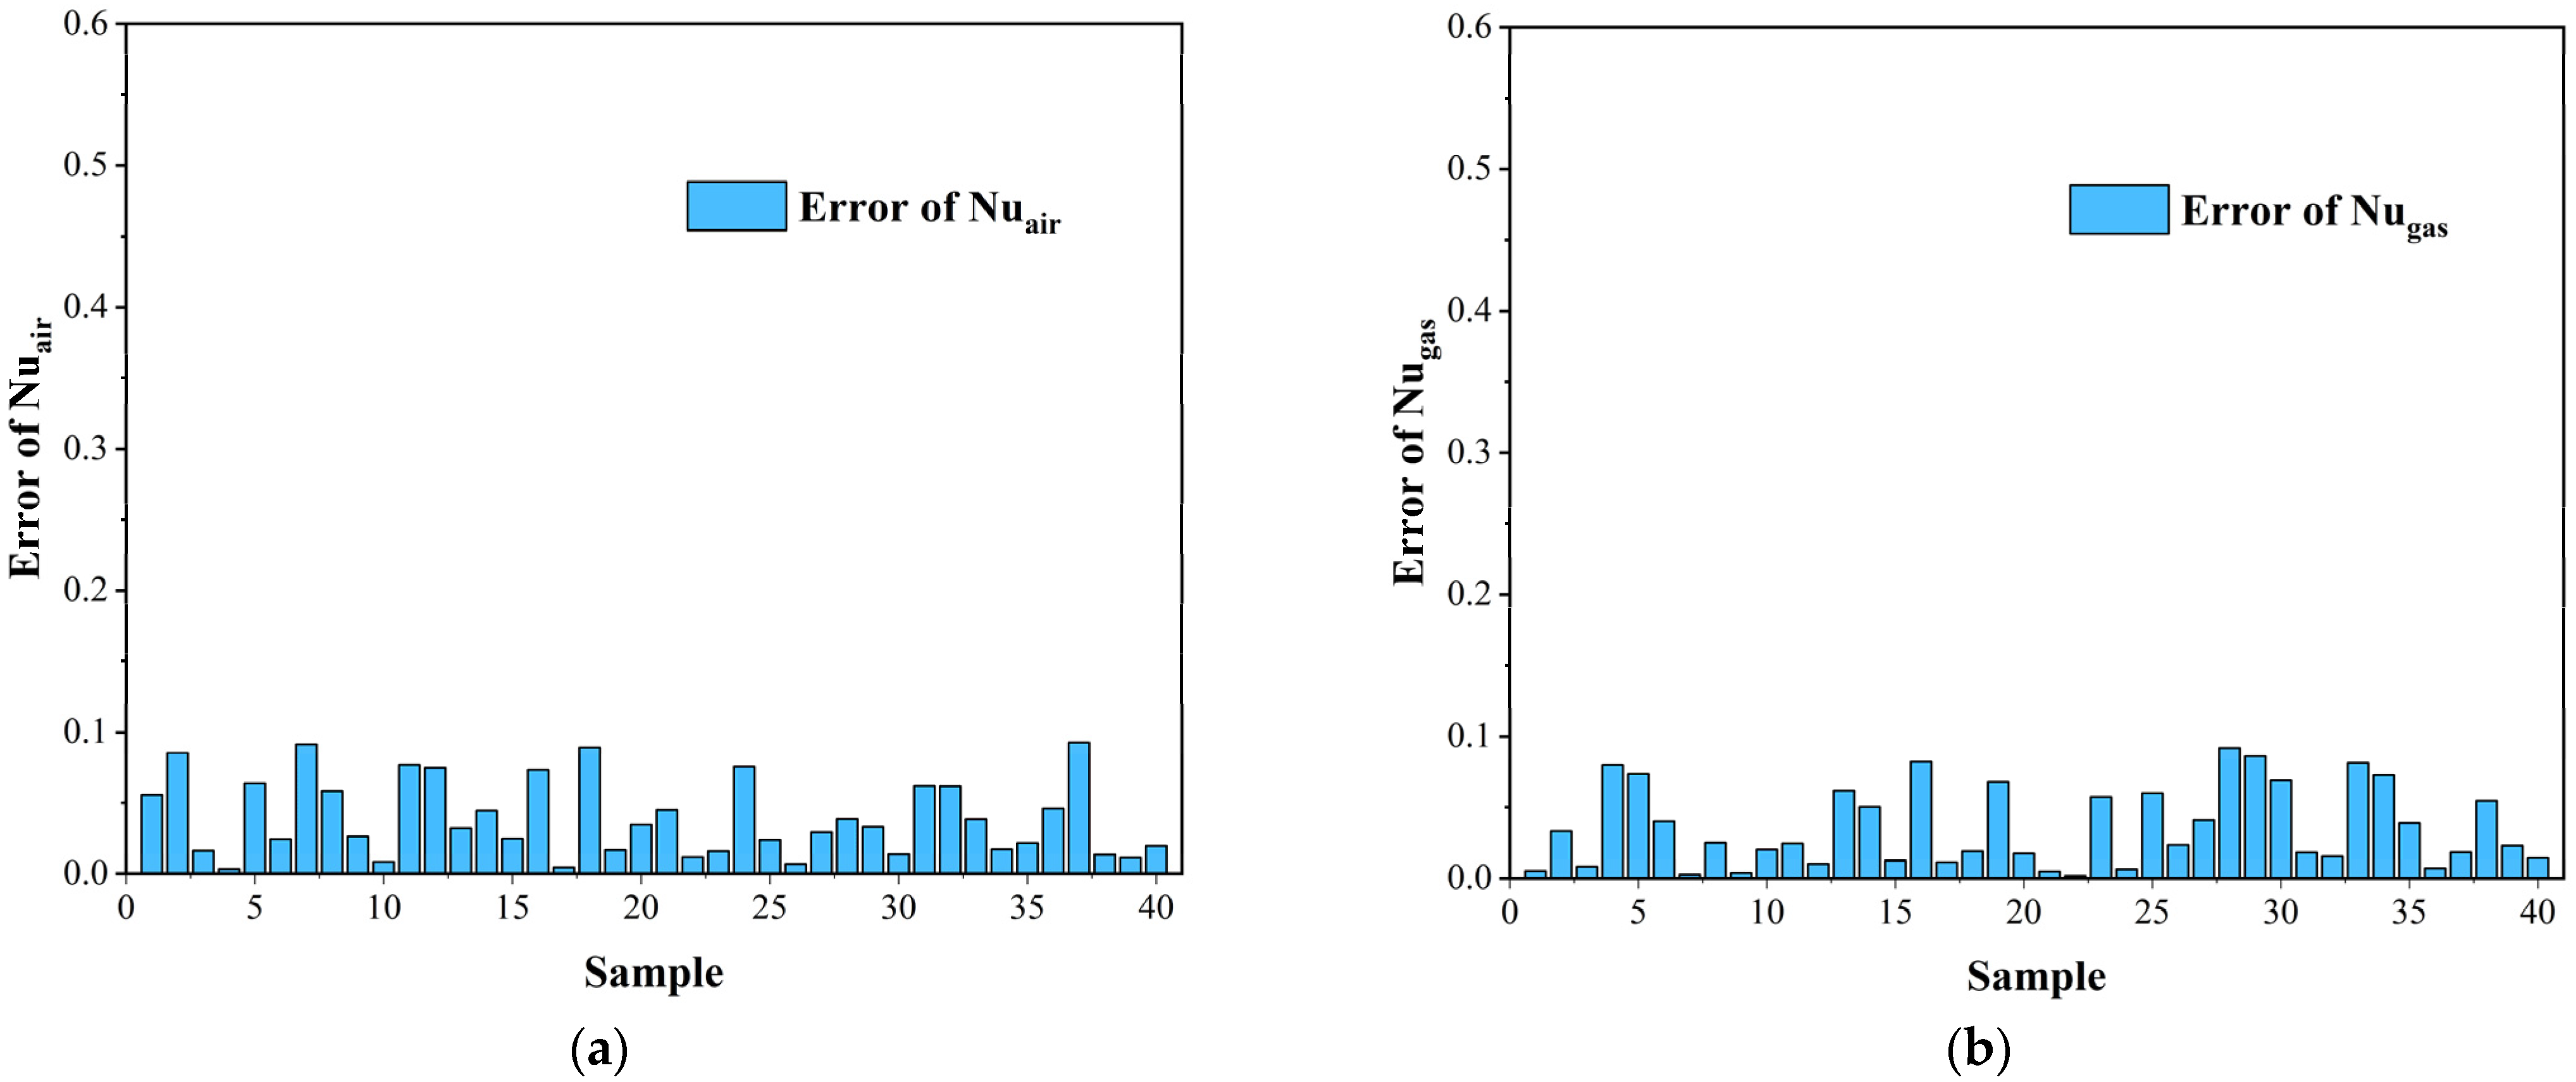
This study employed a 10-layer DD for fitting and validated the learning accuracy of the DD model using cross-validation. For a dataset comprising 40 samples, one sample was used as the test set, while the remaining 39 samples were utilized as the training set. This process was repeated 40 times, establishing 40 DD models to test each sample once. The accuracy of the models was assessed using the root mean square error (RMSE) as the evaluation criterion. The precision assessment was conducted simultaneously on both the training and test sets, as illustrated in Equation (20).
R S M E = 1 n i = 1 n y i y i ¯ 2
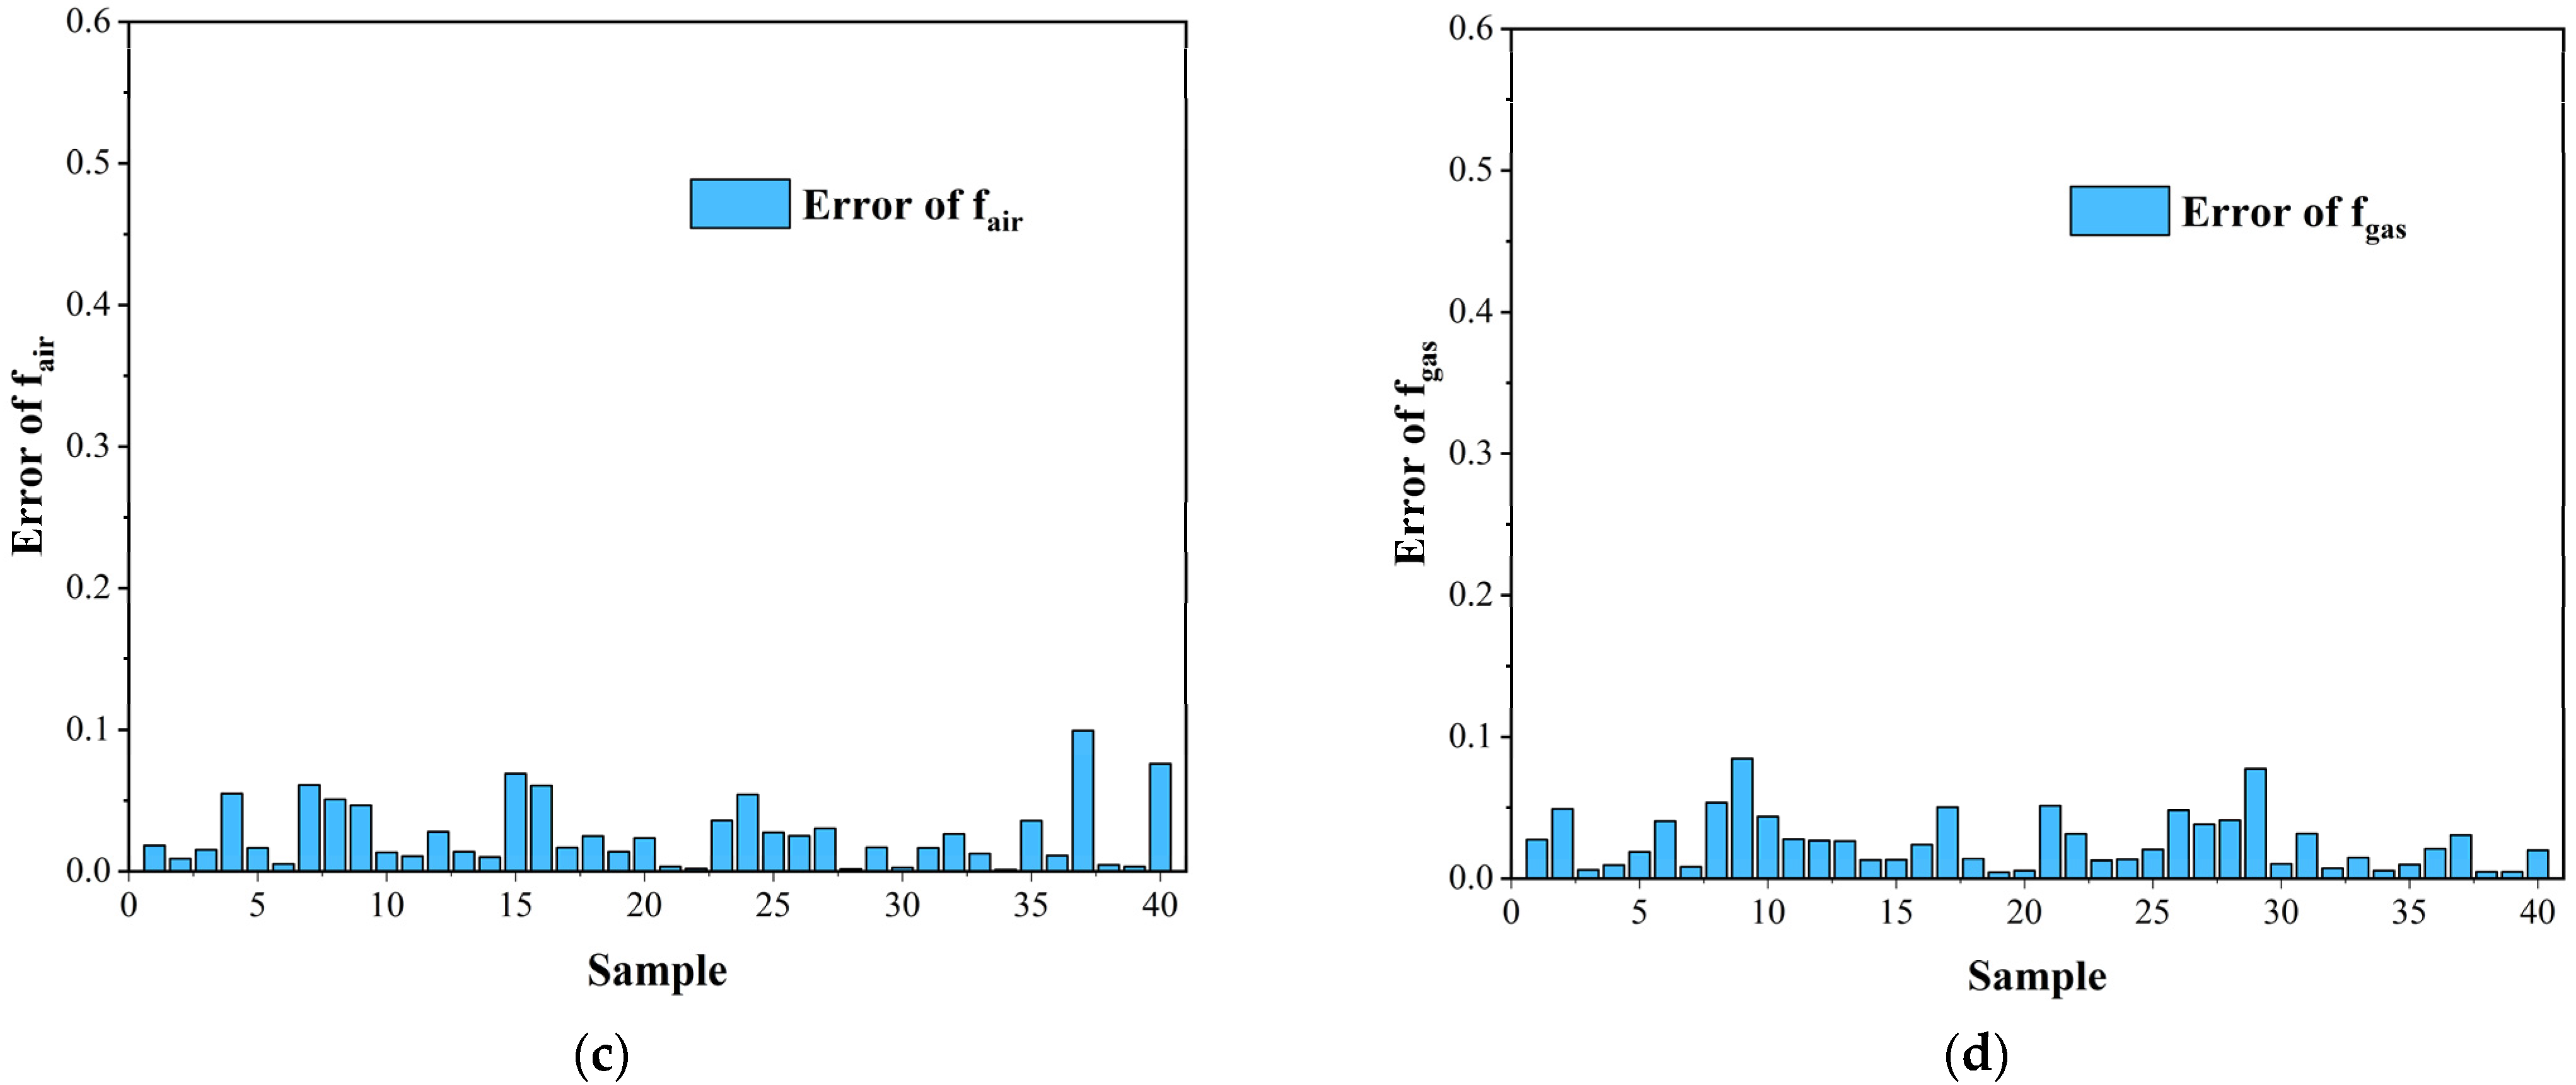
In Equation (20), n represents the total number of samples in the test and training sets, which is equal to 40 in this study. yi represents the true response values of the samples, and y i ¯ represents the output values of the DD model. Separate DD models were created for the air and gas sides, considering Nu and f. After cross-validation, the error results are depicted in Figure 18.
The four trained DD models utilized the results with the minimum error obtained from cross-validation. The variables Nuair, Nugas, fair, and fgas in the DD models were normalized within the range specified in Table 3. Through the DD models, explicit expressions between design variables and CW-PSR performance were derived. The absolute values of the coefficients of the variables in the expressions indicate the degree of influence on the dependent variable. The specific expressions obtained in this study are presented below. Each expression displays the top ten factors with the greatest impact, and these expressions can serve as design references for similar heat exchangers.
N a i r = 0 . 80389 H 2 + 0 . 71465 + 0 . 56487 H 3 + 0 . 52681 R h 0 . 51214 R c R h + 0 . 41229 R h A 0 . 40369 H 0 . 36759 R c H 0 . 25696 k A + 0 . 22937 H L
N u g a s = 0.46321 H 2 + 0.39407 H + 0.21847 H 3 0.20112 R c 5 0.19089 R h H   0.18223 H 4 0.15644 k 4 L 3 + 0.1515 + 0.14756 H L 3 + 0.14546 H 2 A
f a i r = 1 . 6102 R c + 1 . 1833 0 . 74642 H + 0 . 51252 R c 2 + 0 . 48589 R c H 0 . 20242 L + 0 . 19472 R c 3 + 0 . 15032 H 2 + 0 . 12078 k L 0 . 084344 R h
f g a s = 1 . 2888 1 . 1277 H 0 . 89897 R h 0 . 44976 L + 0 . 35125 R h H + 0 . 21069 H 3 + 0 . 18855 L 2 + 0 . 15916 R c 2 + 0 . 1582 H k 5 + 0 . 13029 R h L

5. Conclusions

The CW-PSR device, which comprises 171 identical plates welded together, with each plate possessing 33 CW heat transfer channels, is studied in this article. A comprehensive three-dimensional fluid–solid coupling heat transfer model has been developed for the CW-PSR plate, taking into account the variable attributes and interdependent effects between the hot gas and cold air. Based on the validity of the proposed model, an array of numerical simulations is executed to anticipate the flow and heat transfer within a CW-PSR plate, varying solely the bending profiles while maintaining constant boundary conditions and heat transfer area. The conclusions obtained are as follows:
When the angle between the vorticity field-coherent vorticity and the velocity gradient (VFSA) approaches 90 degrees, it becomes increasingly advantageous for the heat transfer process. This conclusion has been substantiated through numerical computations conducted on the CW-PSR single channel;
Among the various curved profiles studied, the circular arc with a curvature of 0.25 exhibits optimal heat transfer performance and overall efficiency. Conversely, the cycloidal shape of CW-PSR demonstrates the poorest heat transfer performance and overall efficiency. On the air side, compared to the non-curved CW-PSR, the Nu decreases by a maximum of 5%, the f decreases by a maximum of 10%, and Nu/f(1/3) decreases by a maximum of 2.15%. On the gas side, these metrics decreased by 8%, 4.5%, and 7.4%, respectively;
The distribution of VFSA in various channels of the CW-PSR is characterized by distinct bending curvatures. The relationship between curvature variation and heat transfer capability has been identified, characterized by a continuous reduction in heat transfer capability in the heat exchange channels nearer to the inner diameter region with increasing curvature. Conversely, in the channels closer to the outer diameter region, there is a continual increase in heat transfer capability as curvature enlarges;
Considering the combined influence of the bending curvature and dimensions of the heat transfer unit on the heat-transfer-flow performance of the CW-PSR, an explicit expression for the structural parameters–performance parameters relationship has been proposed. This was achieved through a synthesis of experimental design methods and surrogate modeling techniques. The resulting expression can be utilized as a design reference for similar heat exchangers of its kind.

Author Contributions

Methodology, H.J. and C.H.; Software, H.J.; Validation, F.C.; Formal analysis, J.Y.; Investigation, C.H. and Y.S.; Data curation, C.H.; Writing—review & editing, C.H. and J.Z. All authors have read and agreed to the published version of the manuscript.

Funding

This research was supported by the National Natural Science Foundation of China (Grant No. 52006045), the Natural Science Foundation of Heilongjiang Province (Grant No. LH2021E062) and the 2022 Heilongjiang Province’s “Emission and carbon neutrality” open competition mechanism to select the best candidate’s project (Adsorption-type compression of carbon dioxide energy storage key technology research and demonstration: 2022ZXJ09C01).

Data Availability Statement

The data presented in this study are available on request from the corresponding author. The data are not publicly available due to privacy.

Acknowledgments

We would like to thank all those who reviewed and contributed to this paper for their valuable assistance.

Conflicts of Interest

The authors declare no conflict of interest.

Nomenclature

Symbols
NuNusselt number
fFanning friction coefficient
ϕ Dissipation function
FsConvective term
ωVorticity
ReReynolds number
PrPrandtl number
kCurvature
AAmplitude of the longitudinal wave
LWavelength of the longitudinal wave
PChannel pitch
RRadius of CW channel section
WWidth of CW channel section
HHeight of CW channel section
deEquivalent diameter
SuSource term for velocity
νKinematic viscosity
ρDensity
qwwall heat flux
λThermal conductivity
CpSpecific heat at constant pressure
uVelocity
AcCross-sectional area
SWetted perimeter
TTemperature
qHeat transfer quantity
μdynamic viscosity of fluid
μtturbulent dynamic viscosity
cSpecific heat capacity
mMass flow rate
TLMTDLogarithm mean temperature difference
dAMicroelement area
dVMicroelement volumn
Subscript
cCold side
hHot side
sSolid
aAir
gGas
wWall
nNormal direction of section
iNumber of CW channel section
bBulk
iIndicator of tensor
Acronyms
CWCross wavy
PSRPrimary surface recuperator
MGTMicro gas turbine
TCWTracezoidal cross wavy
CCCross corrugated
CUCross undulated
FSAField synergy angle
VFSAVorticity field synergy angle

References

  1. Dessornes, O.; Landais, S.; Valle, R.; Fourmaux, A.; Burguburu, S.; Zwyssig, C.; Kozanecki, Z. Advances in the Development of a Microturbine Engine. J. Eng. Gas Turbines Power 2014, 136, 071201. [Google Scholar] [CrossRef]
  2. Gang, X.; Yang, T.; Liu, H.; Dong, N.; Ni, M. Recuperators for micro gas turbines: A review. Appl. Energy 2017, 197, 83–99. [Google Scholar]
  3. Xu, Z.; Lu, Y.; Wang, B.; Zhao, L.; Xiao, Y. Experimental study on the off-design performances of a micro humid air turbine cycle: Thermodynamics, emissions and heat exchange. Energy 2021, 219, 119660. [Google Scholar] [CrossRef]
  4. Mcdonald, C.F. Low-cost compact primary surface recuperator concept for microturbines. Appl. Therm. Eng. 2000, 20, 471–497. [Google Scholar] [CrossRef]
  5. Utriainen, E.; Sunden, B. Numerical analysis of a primary surface trapezoidal cross wavy duct. Int. J. Numer. Methods Heat. Fluid. Flow. 2000, 10, 634–648. [Google Scholar] [CrossRef]
  6. Wang, Q.W.; Liang, H.X.; Luo, L.Q.; Wang, J.W.; Chen, Z.Q. Experimental Investigation on Heat Transfer and Pressure Drop in a Microtubine Recuperator with Cross-Wavy Primary Surface Channels. In Proceedings of the ASME Turbo Expo 2005: Power for Land, Sea, & Air, Reno, NV, USA, 6–9 June 2005. [Google Scholar]
  7. Du, L.X.; Zeng, M.; Wang, Q.W. A Simplified CFD Model with Multi-Periodic Boundary Conditions for Cross Wavy Channels. In Proceedings of the ASME 2011 Turbo Expo: Turbine Technical Conference & Exposition, Vancouver, BC, Canada, 6–10 June 2011. [Google Scholar]
  8. Du, L.X.; Ma, T.; Zeng, M.; Guo, Z.X.; Wang, Q.W. Numerical Investigations on the Thermohydraulic Performance of Cross-Wavy Channels with Multi-Periodic Boundary Conditions. Numer. Heat Transf. Part A Appl. 2014, 65, 732–749. [Google Scholar] [CrossRef]
  9. Ma, T.; Du, L.X.; Sun, N.; Zeng, M.; Sunden, B.; Wang, Q.W. Experimental and numerical study on heat transfer and pressure drop performance of Cross-Wavy primary surface channel. Energy Convers. Manag. 2016, 125, 80–90. [Google Scholar] [CrossRef]
  10. Ma, T.; Zhang, J.; Saranmanduh, B.; Chen, Y.-T.; Wang, Q.-W.; Zeng, M. Numerical study on small-scale longitudinal heat conduction in cross-wavy primary surface heat exchanger. Appl. Therm. Eng. Des. Process. Equip. Econ. 2015, 76, 272–282. [Google Scholar] [CrossRef]
  11. Xi, W.; Cai, J.; Huai, X. Numerical investigation on fluid-solid coupled heat transfer with variable properties in cross-wavy channels using half-wall thickness multi-periodic boundary conditions. Int. J. Heat Mass Transf. 2018, 122, 1040–1052. [Google Scholar] [CrossRef]
  12. Giugno, A. Analysis of uncertainties in compact plate-fin recuperators for microturbines. Appl. Therm. Eng. Des. Process. Equip. Econ. 2019, 150, 1243–1251. [Google Scholar] [CrossRef]
  13. Cai, J.; Huai, X.; Xi, W. An optimal design approach for the annular involute-profile cross wavy primary surface recuperator in microturbine and an application case study. Energy 2018, 153, 80–89. [Google Scholar] [CrossRef]
  14. Yang, Y.Z.; Chen, F.; Yu, J.Y.; Song, Y.P.; Hu, H.D.; Xu, D.Q.; Jiang, H.D. Numerical study on heat transfer characteristics of heat exchange cell in an annular cross-wavy primary surface recuperator (annular CWPSR). Appl. Therm. Eng. 2022, 216, 119062. [Google Scholar] [CrossRef]
  15. Johnson, T.R.; Joubert, P.N. The Influence of Vortex Generators on the Drag and Heat Transfer from a Circular Cylinder Normal to an Airstream. J. Heat Transf. Trans. ASME 1969, 91, 91–99. [Google Scholar] [CrossRef]
  16. Fiebig, D. Vortices and Heat Transfer. Chem. Eng. Res. Des. 1998, 76, 108–123. [Google Scholar] [CrossRef]
  17. Tiggelbeck, S.; Mitra, N.; Fiebig, M. Flow structure and heat transfer in a channel with multiple longitudinal vortex generators. Exp. Therm. Fluid Sci. 1992, 5, 425–436. [Google Scholar] [CrossRef]
  18. Biswas, G.; Deb, P.; Biswas, S. Generation of Longitudinal Streamwise Vortices—A Device for Improving Heat Exchanger Design. J. Heat Transf. 1994, 116, 588–597. [Google Scholar] [CrossRef]
  19. Torii, K.; Nishino, K.; Nakayama, K. Mechanism of Heat Transfer Augmentation by Longitudinal Vortices in a Flat Plate Boundary Layer. In Proceedings of the International Heat Transfer Conference 10, Brighton, UK, 14–18 August 1994. [Google Scholar]
  20. Fiebig, M.; Valencia, A.; Mitra, N.K. Wing-type vortex generators for fin-and-tube heat exchangers. Exp. Therm. Fluid Sci. 1993, 7, 287–295. [Google Scholar] [CrossRef]
  21. Fiebig, M.; Valencia, A.; Mitra, N.K. Local heat transfer and flow losses in Fin-and -Tube heat exchangers with vortex generators: A comparison of round and flat tubes. Exp. Therm. Fluid Sci. 1994, 8, 35–45. [Google Scholar] [CrossRef]
  22. Biswas, G.; Mitra, N.K.; Fiebig, M. Heat transfer enhancement in fin-tube heat exchangers by winglet type vortex generators. Int. J. Heat Mass Transf. 1994, 37, 283–291. [Google Scholar] [CrossRef]
  23. Zeng, M.; Tang, L.H.; Lin, M.; Wang, Q.W. Optimization of heat exchangers with vortex-generator fin by Taguchi method. Appl. Therm. Eng. 2010, 30, 1775–1783. [Google Scholar] [CrossRef]
  24. Lu, J.; Zhuang, D.; Wang, Y.; Ding, G. Effects of vortex generator on subcooled flow boiling characteristics in micro-channel. Int. J. Heat Mass Transf. 2023, 216, 124572. [Google Scholar] [CrossRef]
  25. Bagre, N.; Parekh, A.D.; Patel, V.K. “Exergy analysis and Experimental investigation of various vortex tube material with different combination of vortex generators”: Analyse exergétique et étude expérimentale de divers matériaux de tubes vortex avec combinaison différente de générateurs de vortex. Int. J. Refrig. 2023, 150, 113–124. [Google Scholar]
  26. Shi, X.; Chen, W.; Li, Z.; Chai, X.; Chyu, M.K. Investigation of the heat transfer enhancement and deterioration induced by vortex generators in low Prandtl number sodium-potassium alloy liquid. Int. J. Therm. Sci. 2023, 193, 108456. [Google Scholar] [CrossRef]
  27. Feng, Z.; Jiang, P.; Zheng, S.; Zhang, Q.; Chen, Z.; Guo, F.; Zhang, J. Experimental and numerical investigations on the effects of insertion-type longitudinal vortex generators on flow and heat transfer characteristics in square minichannels. Energy 2023, 278, 127855. [Google Scholar] [CrossRef]
  28. Gu, H.; Chen, Y.; Wu, J.; Sunden, B. Performance investigation on twisted elliptical tube heat exchangers with coupling-vortex square tube layout. Int. J. Heat Mass Transf. 2020, 151, 119473. [Google Scholar] [CrossRef]
  29. Li, X.; Chen, S.; Tan, Y.; Sun, Z.; Tian, G.; Wang, L. Convective thermal-hydraulic performance in twisted tubes: From the perspective of symmetrical cross-sectional shapes. Int. Commun. Heat Mass Transf. 2023, 147, 106974. [Google Scholar] [CrossRef]
  30. Yang, Y.; Chen, F.; Yu, J.; Song, Y.; Guo, Z. Design and experiment study of a micro radial-flow turbine for a SOFC-MGT turbine hybrid system. Energy Convers. Manag. 2022, 266, 115861. [Google Scholar] [CrossRef]
  31. Zhang, L.; Che, D. Turbulence Models for Fluid Flow and Heat Transfer Between Cross-Corrugated Plates. Numer. Heat Transf. Part A Appl. 2011, 60, 410–440. [Google Scholar] [CrossRef]
  32. Guo, Z.Y.; Li, D.Y.; Wang, B.X. A novel concept for convective heat transfer enhancement. Int. J. Heat Mass Transf. 1998, 41, 2221–2225. [Google Scholar] [CrossRef]
  33. Xu, Z.P.; Zhang, L.; Liu, C.Y.; Wang, Z.L. Experimental Investigation on Performance for Annular Primary Surface Recuperator of Micro Gas-turbine. J. Power Eng. 2009, 29, 540–543+548. [Google Scholar]
  34. Jiang, H.; Chen, F.; Yu, J.; Song, Y. Theoretical and numerical study on new evaluation criteria for longitudinal vortex enhanced heat transfer. Int. J. Heat Mass Transf. 2024, 220, 124977. [Google Scholar] [CrossRef]
  35. Liu, G.; Wang, J. Dendrite net: A white-box module for classification, regression, and system identification. IEEE Trans. Cybern. 2021, 52, 13774–13787. [Google Scholar] [CrossRef] [PubMed]
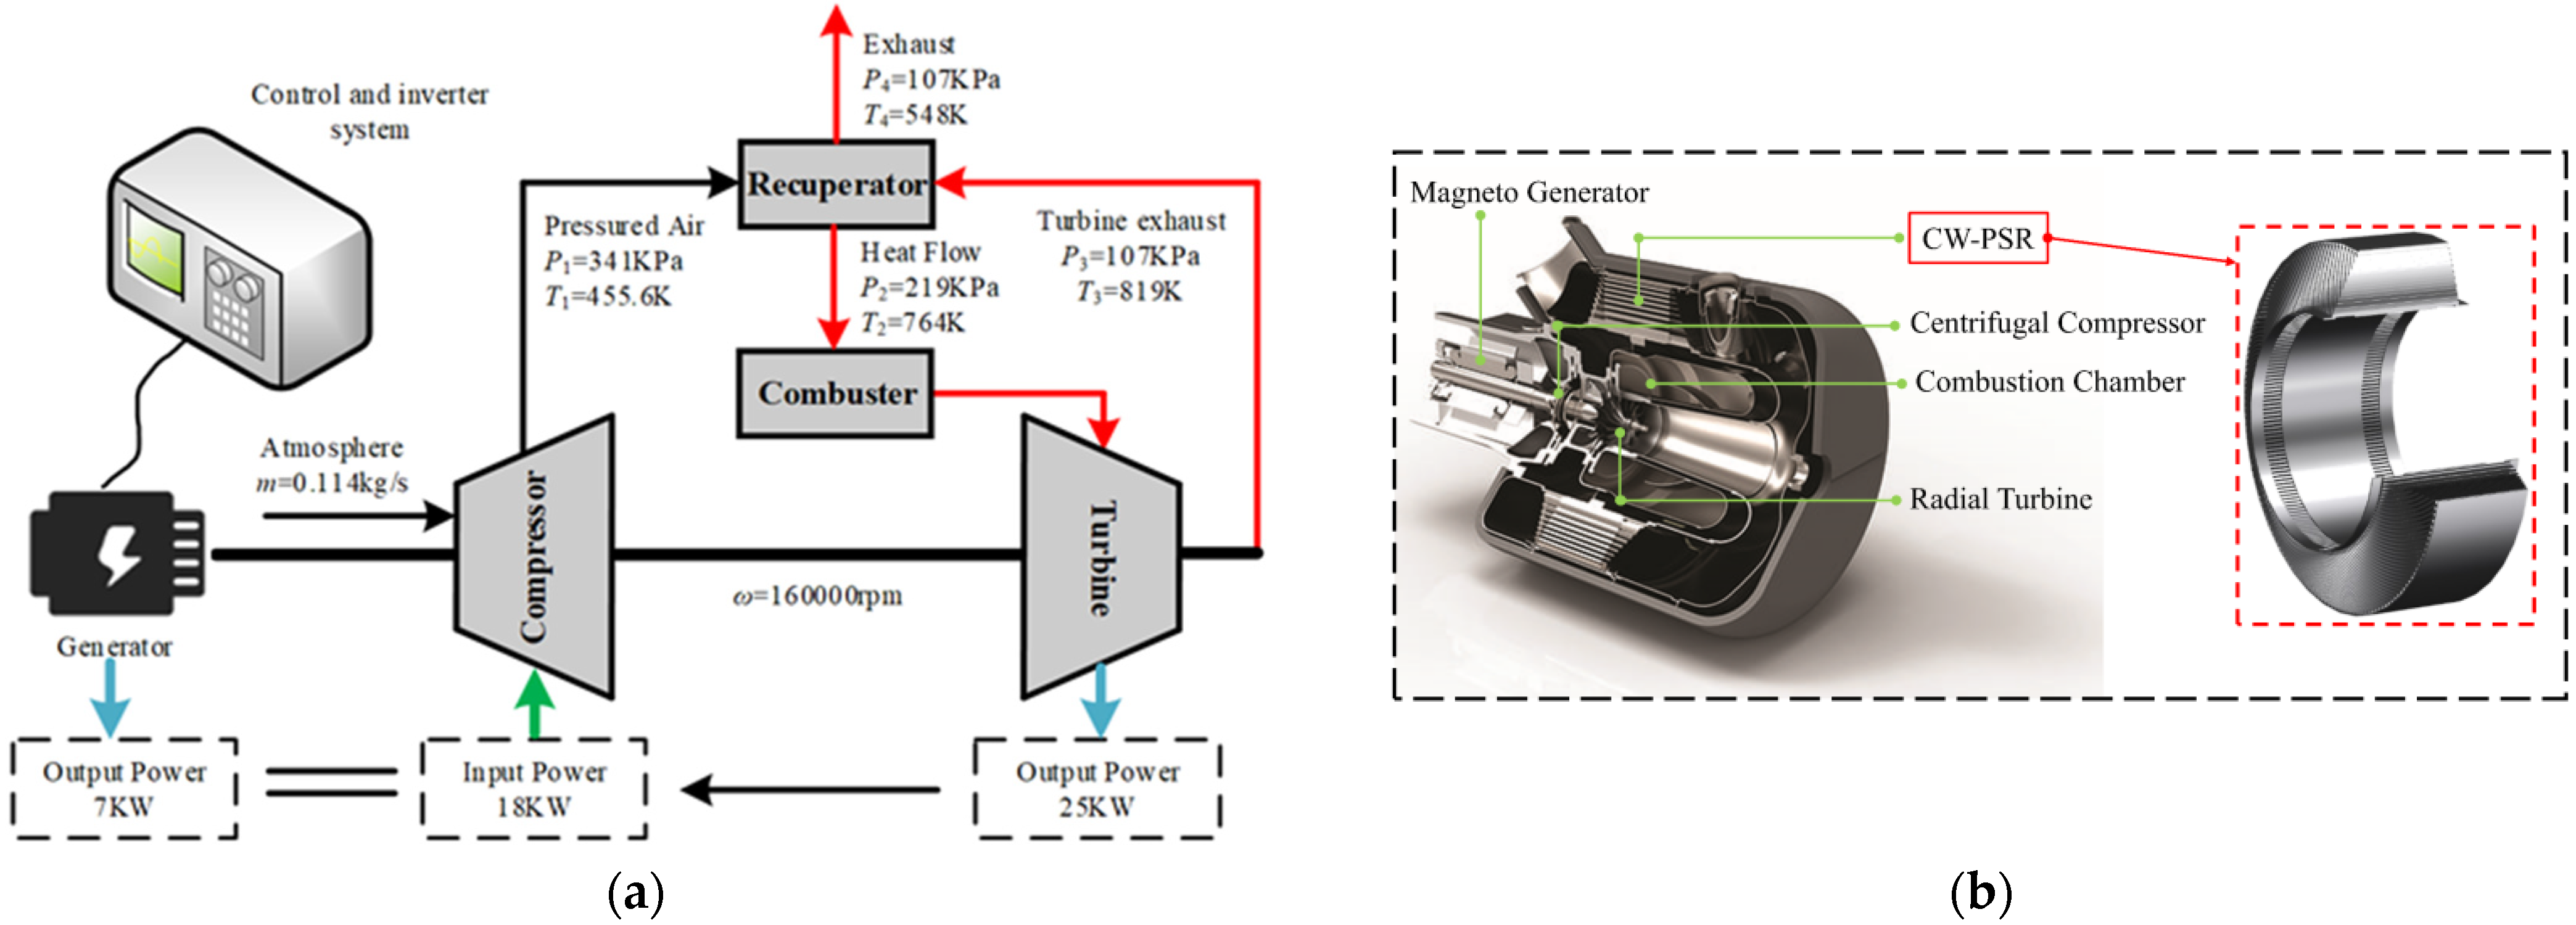
Figure 1. Thermal cycle parameters and composition structure of MGT. (a) Thermal cycle parameters of MGT. (b) The composition and structure of MGT.
Energies 16 07977 g001
Figure 2. Manufacturing path of CW-PSR. (a) CW-PSR plate. (b) CW-PSR module. (c) Angular CW-PSR.
Energies 16 07977 g002
Figure 3. Composition and heat transfer principle of CW-PSR plate. (a) Heat transfer unit; (b) 1D heat transfer principle; (c) one layer microchannel; (d) CW-PSR plate [15].
Energies 16 07977 g003
Figure 4. Numerical model of CW-PSR.
Energies 16 07977 g004
Figure 5. Verification of Grid Independence for CW-PSR Plate. (a) Nu of Air Side; (b) Nu of Gas Side.
Energies 16 07977 g005
Figure 6. Comparison of Nu between simulation results and test results. (a) Nu of Air Side; (b) Nu of Gas Side. Reprinted from [34], with permission from Elsevier.
Energies 16 07977 g006
Figure 7. Total thermal conductivity and curvature distribution. (a) UA of CW-PSR plates with different bending shapes; (b) Curvature distribution of variable curvature curves.
Energies 16 07977 g007
Figure 8. The Nusselt coefficient and curvature distribution. (a) Nu of air with different bending shapes; (b) Nu of gas with different bending shapes.
Energies 16 07977 g008
Figure 9. The Fanning friction coefficient and curvature distribution. (a) Nu of air with different bending shapes; (b) Nu of gas with different bending shapes.
Energies 16 07977 g009
Figure 10. Comprehensive performance coefficient and curvature distribution. (a) Nu of air with different bending shapes; (b) Nu of gas with different bending shapes.
Energies 16 07977 g010
Figure 11. The influence of different bending profiles of CW-PSR on the overall performance of MGT. (a) Output Power. (b) Thermal Efficiency.
Energies 16 07977 g011
Figure 12. Velocity, velocity vector, vorticity, and temperature contours at position Z = Lc. (a) Velocity contours; (b) Velocity vector; (c) Vorticity contours; (d) Temperature contours. Reprinted from [34], with permission from Elsevier.
Energies 16 07977 g012aEnergies 16 07977 g012b
Figure 13. Total thermal conductivity and curvature distribution. (a) VFSA of gas; (b) FSA of gas.
Energies 16 07977 g013
Figure 14. Correspondence between VFSA and heat flux. (a) Heat Flux contours; (b) VFSA contours.
Energies 16 07977 g014
Figure 15. Comparison of FSA and VFSA at the same cross-sectional position. (a) VFSA; (b) FSA.
Energies 16 07977 g015
Figure 16. VFSA on the gas side of CW-PSR plates with different bending shapes. (a) Cycloid bending shape; (b) Involute bending shape; (c) No bending shape, k = 0; (d) Circular arc bending shape, k = 0.167; (e) Circular arc bending shape, k = 0.2. (f) Circular arc bending shape, k = 0.25.
Energies 16 07977 g016aEnergies 16 07977 g016b
Figure 17. VFSA distribution of CW-PSR with different bending curvatures.
Energies 16 07977 g017
Figure 18. Samples error for cross-validation. (a) Nu of air. (b) Nu of gas. (c) f of gas. (d) f of gas.
Energies 16 07977 g018aEnergies 16 07977 g018b
Table 1. The pivotal geometric characteristics of the heat exchange unit of CW-PSR.
Geometric CharacteristicsSizes
Lc/Ac2.1
Wh/Wc1.8
2H2200 μm
2H/P2.5
de of air channel600 μm
de of gas channel800 μm
Table 2. Thermal characteristics of gas and air in relation to varying temperatures (T:K) [11].
PropertyGasAir
Density (kg·m−3)ρg = 1.425 − 1.97 × 10⁻³T + 9.21 × 10⁻⁷T2ρa = 1.193 + 10.321exp(−T/335.28)
Heat capacity (J kg−1 K−1)cpg = 1005.3 + 0.03423T + 4.617 × 10⁻⁴T2 − 3.205 × 10⁻⁷T3 + 6.45 × 10⁻¹¹T4cpa = 921.22 + 0.2359T − 1.922 × 10⁻⁵T2 − 2.2396 × 10⁻²²T3
Thermal conductivity (W m−1 K−1)λg = −1.337 × 10⁻³ + 9.217 × 10⁻⁵T − 1.432 × 10⁻⁸T2 + 1.221 × 10⁻⁸ T3 − 3.39 × 10⁻¹⁵T4λa = 7.028 × 10⁻³ + 7.862 × 10⁻⁵T − 4.15 × 10⁻⁸T2 + 1.926 × 10⁻¹¹T3 + 3.61 × 10⁻¹⁴T4
Kinematic viscosity (m2 s−1)νg = −5.226 × 10⁻⁶ + 3.47 × 10⁻⁸T + 1.043 × 10⁻¹⁰T2 − 1.651 × 10⁻¹⁴T3 − 7.89 × 10⁻³⁰T4νa = −2.184 × 10⁻⁶ + 1.468 × 10⁻⁸T + 1.861 × 10⁻¹¹T2 + 8.372 × 10⁻²⁹T3 − 1.31 × 10⁻³²T4
Prandtl numberPrg = 0.766 − 2.186 × 10⁻⁴T + 5.59 × 10⁻⁸T2Pra = 0.729 − 8.902 × 10⁻⁵T + 1.17 × 10⁻⁷T2
Table 3. The design dimensions of 40 experimental samples.
NumberRcRhHLAk
10.17400.26891.09135.30570.96940.1398
20.14960.28741.16615.12960.83900.1772
30.21010.30241.05036.09820.90490.2656
40.20650.25480.99785.06270.72800.2617
50.16290.28851.04545.54230.48290.1140
60.12350.31191.09395.79280.88020.1832
70.19160.26291.25416.21970.56140.2127
80.20280.33041.25304.98730.35180.1851
90.21550.34511.17335.73380.48000.2342
100.12630.33381.07056.37990.74920.2257
110.17050.29191.23144.62970.67580.1568
120.18030.27691.23705.63070.79560.2031
130.19390.32121.21085.16950.99350.1040
140.19670.27061.05274.94170.93810.2929
150.18850.34411.05594.89060.60500.1276
160.19770.30881.26765.94530.94500.1194
170.15570.30591.15106.48380.24910.1721
180.17910.26021.22924.71150.23320.1489
190.13320.25960.91216.03830.40340.2081
200.12760.27321.08724.81300.68890.1671
210.21860.33611.15366.41540.58080.2837
220.15110.34141.24296.10880.86210.2735
230.18420.31281.06655.20860.63290.1069
240.21480.31651.16785.83530.50910.2587
250.14200.26711.04365.43450.65310.1509
260.14480.30341.18866.17380.76750.1951
270.15380.32591.19355.03370.20410.2213
280.21000.28421.07104.55840.80510.2783
290.16020.34801.13015.65950.27750.1921
300.14590.25500.94726.27220.54360.2895
310.14000.28001.12894.78690.37950.1605
320.16740.29471.13875.26600.45170.2506
330.15950.25190.97435.88830.70540.2359
340.13640.31991.00934.52720.28440.2187
350.16970.29851.11946.33080.39270.2470
360.13250.29721.20055.97310.32510.2449
370.18570.32901.18285.55040.30220.1429
380.12160.33780.96254.66220.43510.1234
390.17550.32361.00785.35100.85740.2992
400.20140.27911.22025.48830.53550.1341
Table 4. The computational results of 40 experimental samples.
NumberNu of AirNu of Gasf of Airf of Gas
17.86664.95540.03710.0740
27.77355.20670.04380.0601
38.82374.12920.02750.0652
49.13413.69500.03260.1015
59.02064.11180.04170.0723
69.51014.29360.06220.0576
76.61435.80250.02500.0598
87.09845.20920.02350.0459
97.78084.73520.02220.0445
1010.31013.90020.05930.0527
117.49894.72870.03360.0601
126.97535.49910.02820.0583
137.45585.12850.02600.0494
148.94433.83840.03260.0854
158.95793.62400.03290.0586
166.95065.67910.02300.0461
178.48204.92340.03840.0529
187.18225.13220.03140.0727
199.22733.67370.07410.1100
208.44544.44570.06590.0790
217.95094.55390.02200.0467
228.43045.22760.03580.0447
238.81713.99140.03330.0636
247.73095.00960.02270.0509
258.30554.18770.05480.0838
268.04535.59490.04310.0474
278.13444.61240.03830.0503
288.63973.70390.03010.0807
298.93974.34260.03620.0465
308.81483.77200.06940.1042
318.18384.49850.05200.0717
327.96694.64730.03580.0616
338.50963.72010.04950.1022
3410.12693.44230.06320.0755
358.28864.75090.03450.0583
368.07385.38390.04960.0523
377.86014.85400.02770.0478
3810.52133.05210.07800.0739
399.51363.40400.03810.0666
407.05825.29820.02420.0597
Disclaimer/Publisher’s Note: The statements, opinions and data contained in all publications are solely those of the individual author(s) and contributor(s) and not of MDPI and/or the editor(s). MDPI and/or the editor(s) disclaim responsibility for any injury to people or property resulting from any ideas, methods, instructions or products referred to in the content.