Abstract
The design and operational conditions of high-temperature proton exchange membrane fuel cells (HT-PEMFCs) substantially impact their performance. This model aims to investigate the influence of various parameters on the performance of HT-PEMFC. A comprehensive examination revealed that the performance of HT-PEMFC experienced a significant enhancement through modifications to the operating temperature, doping levels, and membrane thickness. Significantly, it can be observed that operating pressure showed a limited influence on performance. The HT-PEMFC was optimized using the non-dominated sorting genetic algorithm II (NSGA-II), specifically emphasizing three primary performance indicators: equivalent power density, energy efficiency, and exergy efficiency. The findings demonstrate promising outcomes, as they reveal a noteworthy enhancement in power density by 17.72% and improvements in energy efficiency and exergy efficiency by 21.11% and 10.37%, respectively, compared to the baseline case.
1. Introduction
Due to their enhanced capacity to withstand impurities [1], simplified water management [2], and more convenient heat rejection [3] relative to low-temperature proton exchange membrane fuel cells (LT-PEMFCs), HT-PEMFCs present substantial advantages for future commercialization. LT-PEMFCs typically operate from 60 to 80 °C [4], and HT-PEMFCs generally operate within 120 to 200 °C [5]. Numerous studies have been undertaken to enhance their performance through various properties, including durability [6,7,8], corrosion [9,10], degradation [11,12,13], and lifetime [14]. Furthermore, in conjunction with the factors above, a crucial area of research is the optimization of design and operational parameters for HT-PEMFC performance, especially considering the heightened global attention directed towards HT-PEMFC applications in stationary micro combined heat and power systems [15], the automotive industry [16], backup power applications [17], and auxiliary power units [18]. Therefore, to realize the commercialization of HT-PEMFC technology, it is imperative to ascertain and optimize relevant parameters.
To date, many studies have been carried out to examine the environmental, economic, and thermodynamic evaluation of HT-PEMFCs. Unlike single-objective optimization, the multi-objective optimization methodology has garnered increasing interest in recent years due to its enhanced practicality and relevance [19,20,21]. However, there is currently only a limited amount of research being conducted on improving the performance of a single HT-PEMFC by using the multi-objective optimization methodology. Li et al. [19] introduced a novel power system in their study, which utilizes an HT-PEMFC system that combines methanol steam reforming and the organic Rankine cycle. The NSGA-II method was employed to optimize the system, and the findings demonstrate that the optimized system attains a net output power of 36.98 kW and a levelized energy cost of 0.2138 $/kWh. In their research, Mamaghani et al. [21] undertook a multi-objective optimization investigation on a micro combined heat and power system that relies on a steady-state HT-PEMFC system. The study examined two distinct sets of objective functions, including thermal efficiency, net electrical output, thermal power generation, and net electrical efficiency. Consequently, by employing the primary energy-saving index, the researchers could identify the optimal operating conditions with electrical and thermal efficiency. The combined system concept described by Guo et al. [20] comprises an HT-PEMFC system, a regenerator, and a thermoelectric generator. The integrated system exhibits a significant improvement in maximum power density of 19.1% compared to a standalone HT-PEMFC. This improvement is accompanied by similar energy and exergy efficiency advances, which increase by 12.4% and 12.6%, respectively. It is worth mentioning that the observed rise in exergy destruction rate density amounts to a mere 8.6%. In their study, Sarabchi et al. [22] introduced a novel cogeneration system that combines an HT-PEMFC system with a Kalina cycle and a solar methanol steam reformer. This integrated system aims to generate both electricity and heat. The findings of the optimization study revealed that the average daily exergy efficiency has the potential to improve by a maximum of 29.3%. Nevertheless, it is essential to note that the performance of the system can be greatly influenced by the attributes of the individual HT-PEMFC [23,24,25].
The predominant optimization approach for the single HT-PEMFC involves analyzing the design and operating parameters through single-objective analysis. Factors like material selection, operating parameters, and component geometry [26] play a significant role in determining the performance of the HT-PEMFC. Consequently, the ultimate determination of diverse parameters is inherently complex. The main research factors currently include operating temperature [27], operating pressure [28], relative humidity [29], doping level [30], thickness of membrane [31], and Pt loading [32]. Thus, a significant obstacle arises in the optimization process of the HT-PEMFC: conducting a comprehensive assessment encompassing various factor groups is unrealistic. Most related studies within our review have primarily focused on independently clarifying the impact of select factors. For example, Bayat et al. [29] obtained valuable results on the impact of membrane thickness, operating temperature, and relative humidity on exergy and energy performance. In their study, Guo et al. [30] employed a single-factor analysis to demonstrate the significance of elevated operating temperatures and increased doping levels in enhancing the performance of HT-PEMFC. Haghighi et al. [33] analyzed the exergy of a HT-PEMFC. They employed a genetic algorithm to compute and optimize various performance parameters. However, it is worth noting that the study did not specifically address the individual impact of a single factor on a single HT-PEMFC. Furthermore, the genetic algorithm employed in the analysis only considered three factors. Although numerous investigations have examined the impacts of various parameters on the energy and exergy performance of the HT-PEMFC, there is a lack of multi-objective analysis integrating evaluations, particularly those that focus on the trade-off of the parameters on a single HT-PEMFC energy efficiency, power, and exergy efficiency.
Hence, to address the research gap, an effective method was proposed to investigate the parameter–performance relationship and optimize the parameters utilizing a multi-objective optimization for a single HT-PEMFC. Firstly, a steady-state model developed in MATLAB R2021b is demonstrated as the base model. Secondly, mathematical statistics methods are used to compare and verify the model with experimental data in the literature. The initial results were compared with two experimental investigations at different operating temperatures and validated with two statistical techniques. Thirdly, assessments are carried out to determine how parameters affect performance. Lastly, optimizing three objective functions for the HT-PEMFC was conducted utilizing the NSGA-II [34] to obtain improved performance compared with the base case.
2. Principle and Methodology
2.1. Principle of the HT-PEMFC
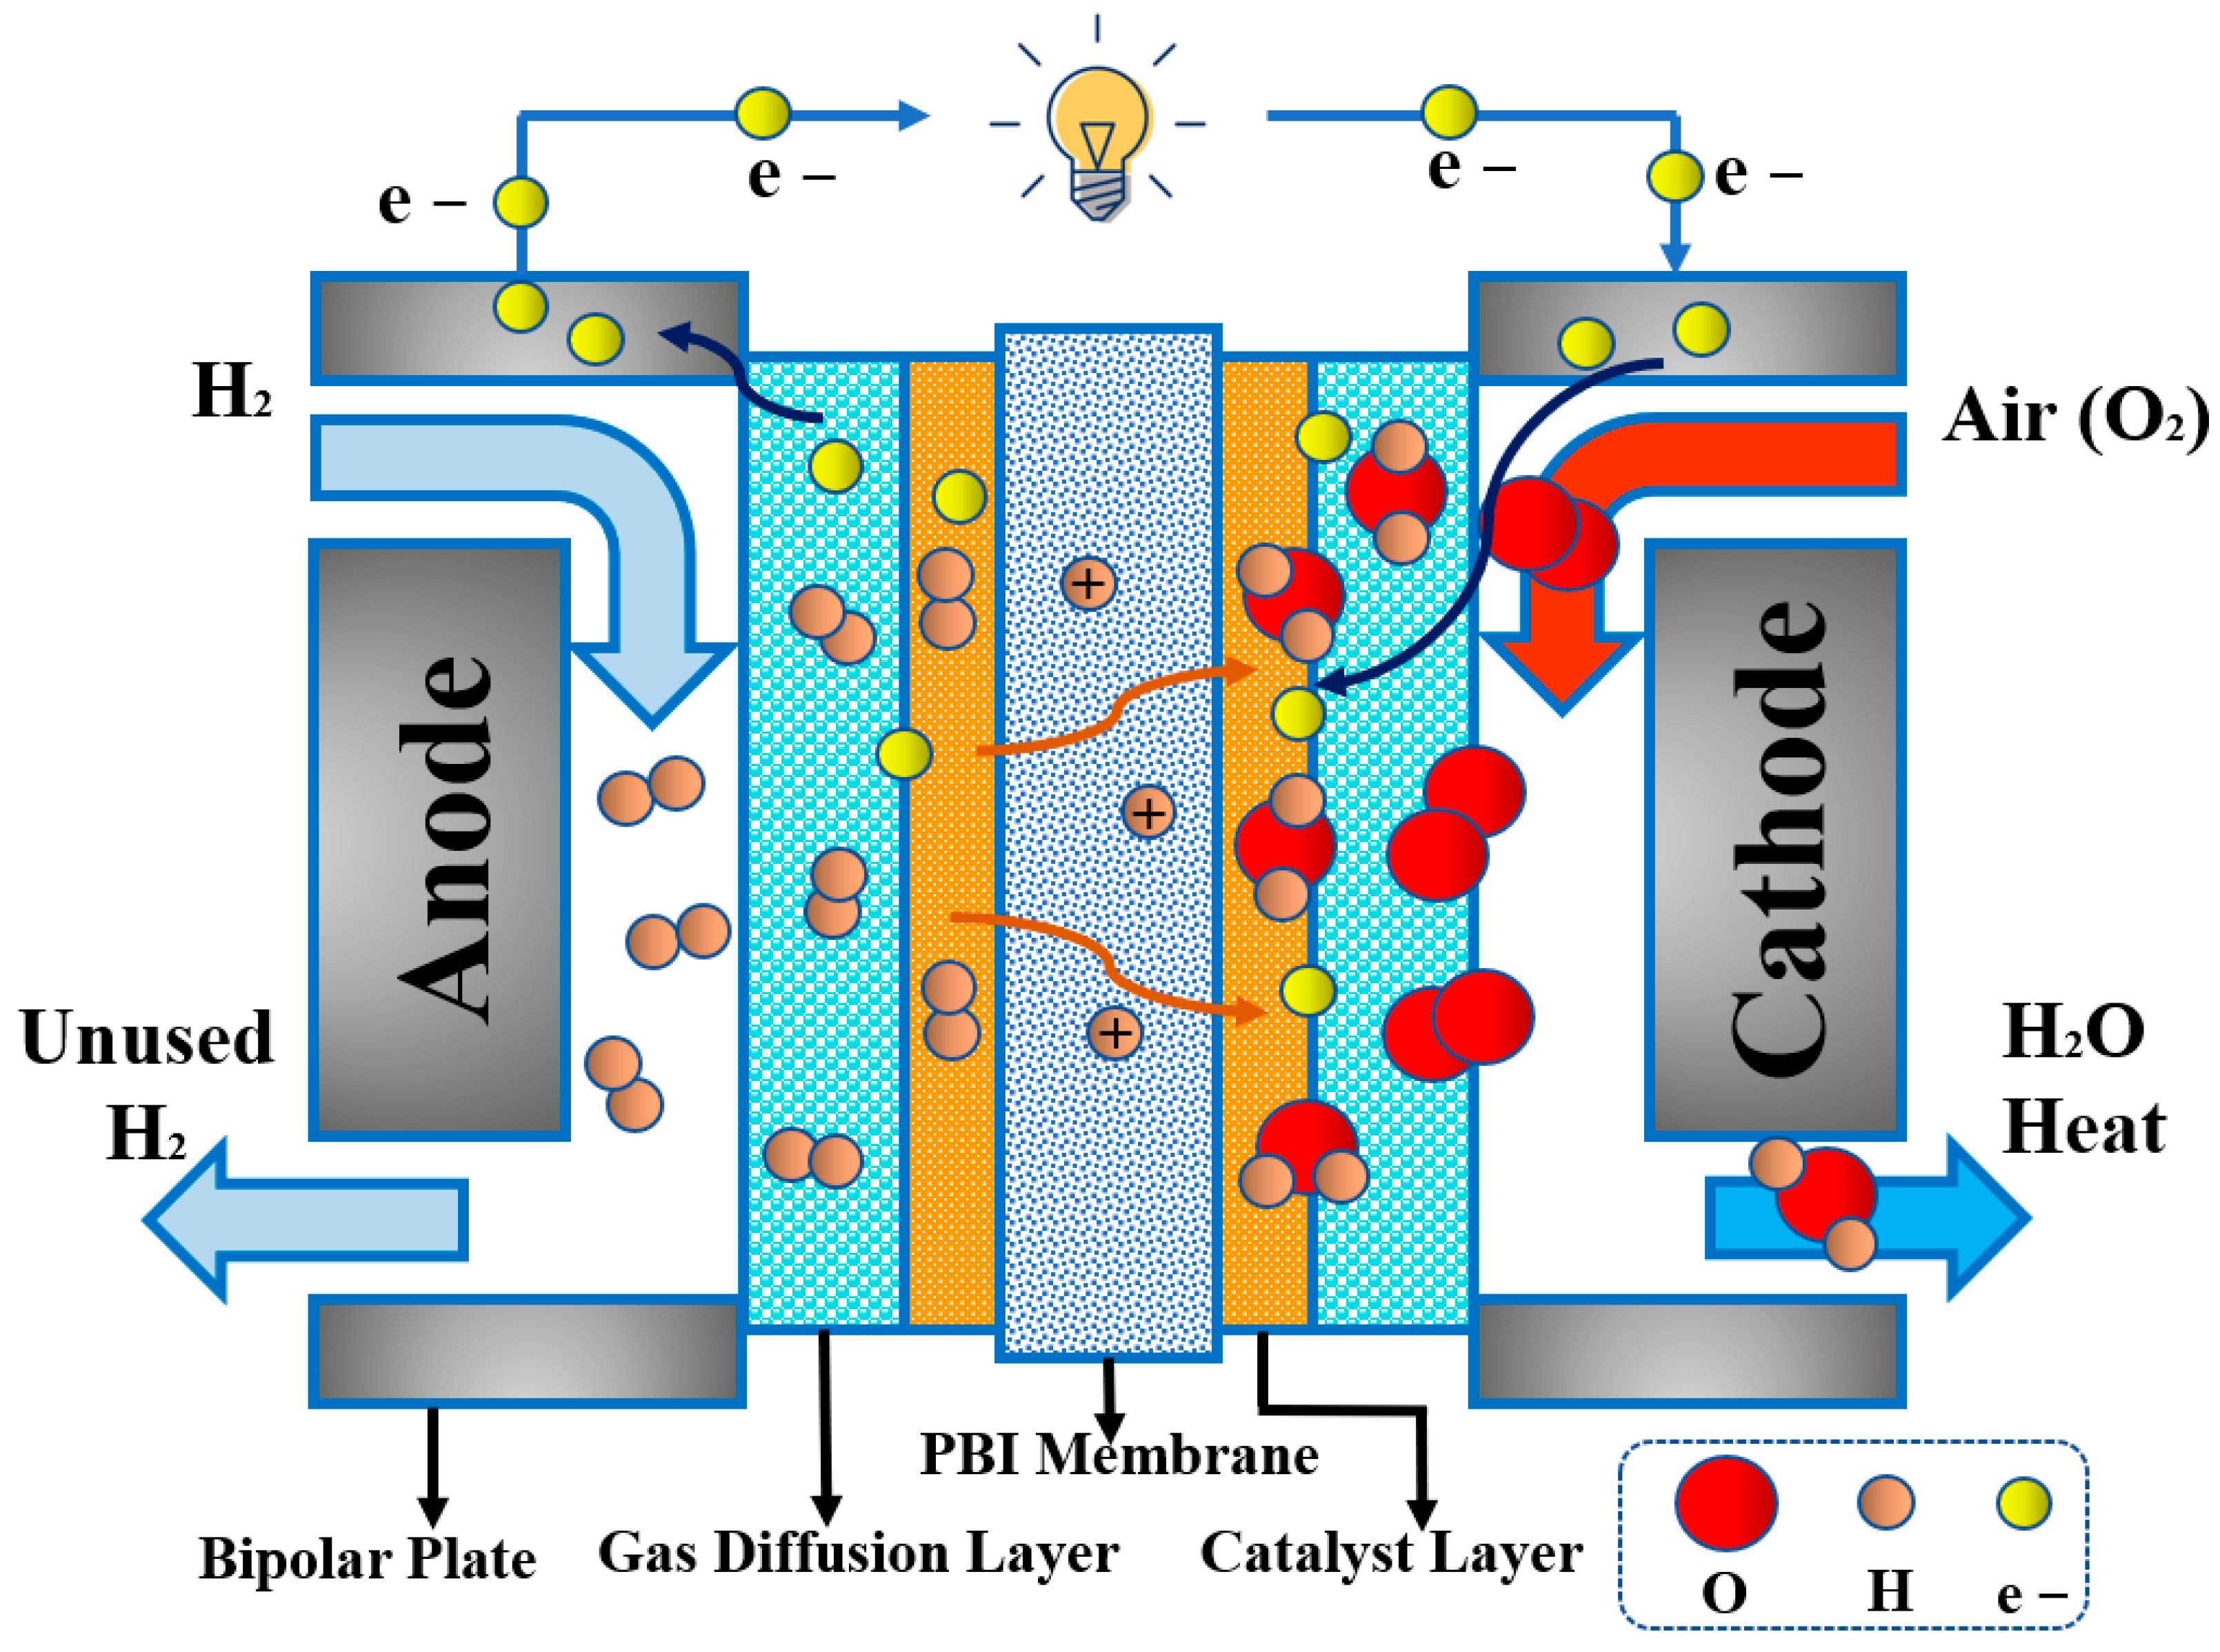
HT-PEMFCs function at elevated temperatures of 120–200 °C. Under high temperature and dry conditions, protons move between phosphoric acid (PA) molecules in the phosphoric acid-doped polybenzimidazole (PA-PBI) membrane through the Grotthuss mechanism [35]. This structure is depicted in Figure 1 [36]. Oxygen or air feeds the cathode, while hydrogen is directed to the anode, driving redox reactions. When hydrogen contacts the anode, it oxidizes, producing H+ ions and releasing electrons. These ions move across the electrolyte, promoting ionic flow. Ions then cross the proton exchange membrane to reach the cathode, where they combine with oxygen to create water. The process completes as electrons journey through the outer circuit [37].

Figure 1.
Schematic structure of the HT-PEMFC [38].
2.2. Electrochemical Modeling
The chemical processes inside the HT-PEMFC unfold as such:
To construct a mathematical representation of the HT-PEMFC, a series of logical and commonly accepted assumptions are used to streamline the procedure [5,29,30]: the HT-PEMFC operates under steady-state condition; air and hydrogen serve as the primary reactants; the supply of hydrogen and air corresponds to the produced electrical current; reactant flow is assumed to be steady, laminar, and incompressible; all reactants are treated as ideal gases; the PBI membrane is gas-impermeable, thus gas crossover is not considered. The parameters utilized in the baseline model are displayed in Table 1. Values commonly found in the literature, such as [5,25,29,30], were considered for each key cell parameter.

Table 1.
Parameters utilized in the basic case HT-PEMFC modeling [5,25,29,30].
Based on the relevant literature, the thermodynamic equilibrium potential, the three overpotentials, the internal resistance based on the three major overpotentials, and the net output voltage can be calculated by Equations (4)–(21) in Table 2.
Table 2.
Equations used for HT-PEMFC modeling.
2.3. Energy and Exergy Analysis
The first law of thermodynamics can be used to calculate the energy efficiency of the single HT-PEMFC by combining Equations (22) and (25) in Table 3. Exergy analysis serves as an adjunct to traditional energy analysis. It evaluates the potential work that can be derived from both input and output materials, as well as heat streams. Furthermore, it is pivotal in pinpointing losses that arise from processes that are irreversible [43]. In the present study, variations in kinetic and potential exergy are ignored. Thus, only physical and chemical exergies are considered within the HT-PEMFC [24], as shown in Equation (26). Based on the second law of thermodynamics combined with Equations (23)–(33) in Table 3, the total exergy, the input and output exergy rate, the exergy destruction rate, the entropy production rate, and the exergy efficiency can be determined. The reference chemical exergies of H2, O2, and H2O (g) were obtained from Refs. [39,44,45].
Table 3.
Equations used for energy and exergy analysis of HT-PEMFC.
2.4. Optimization
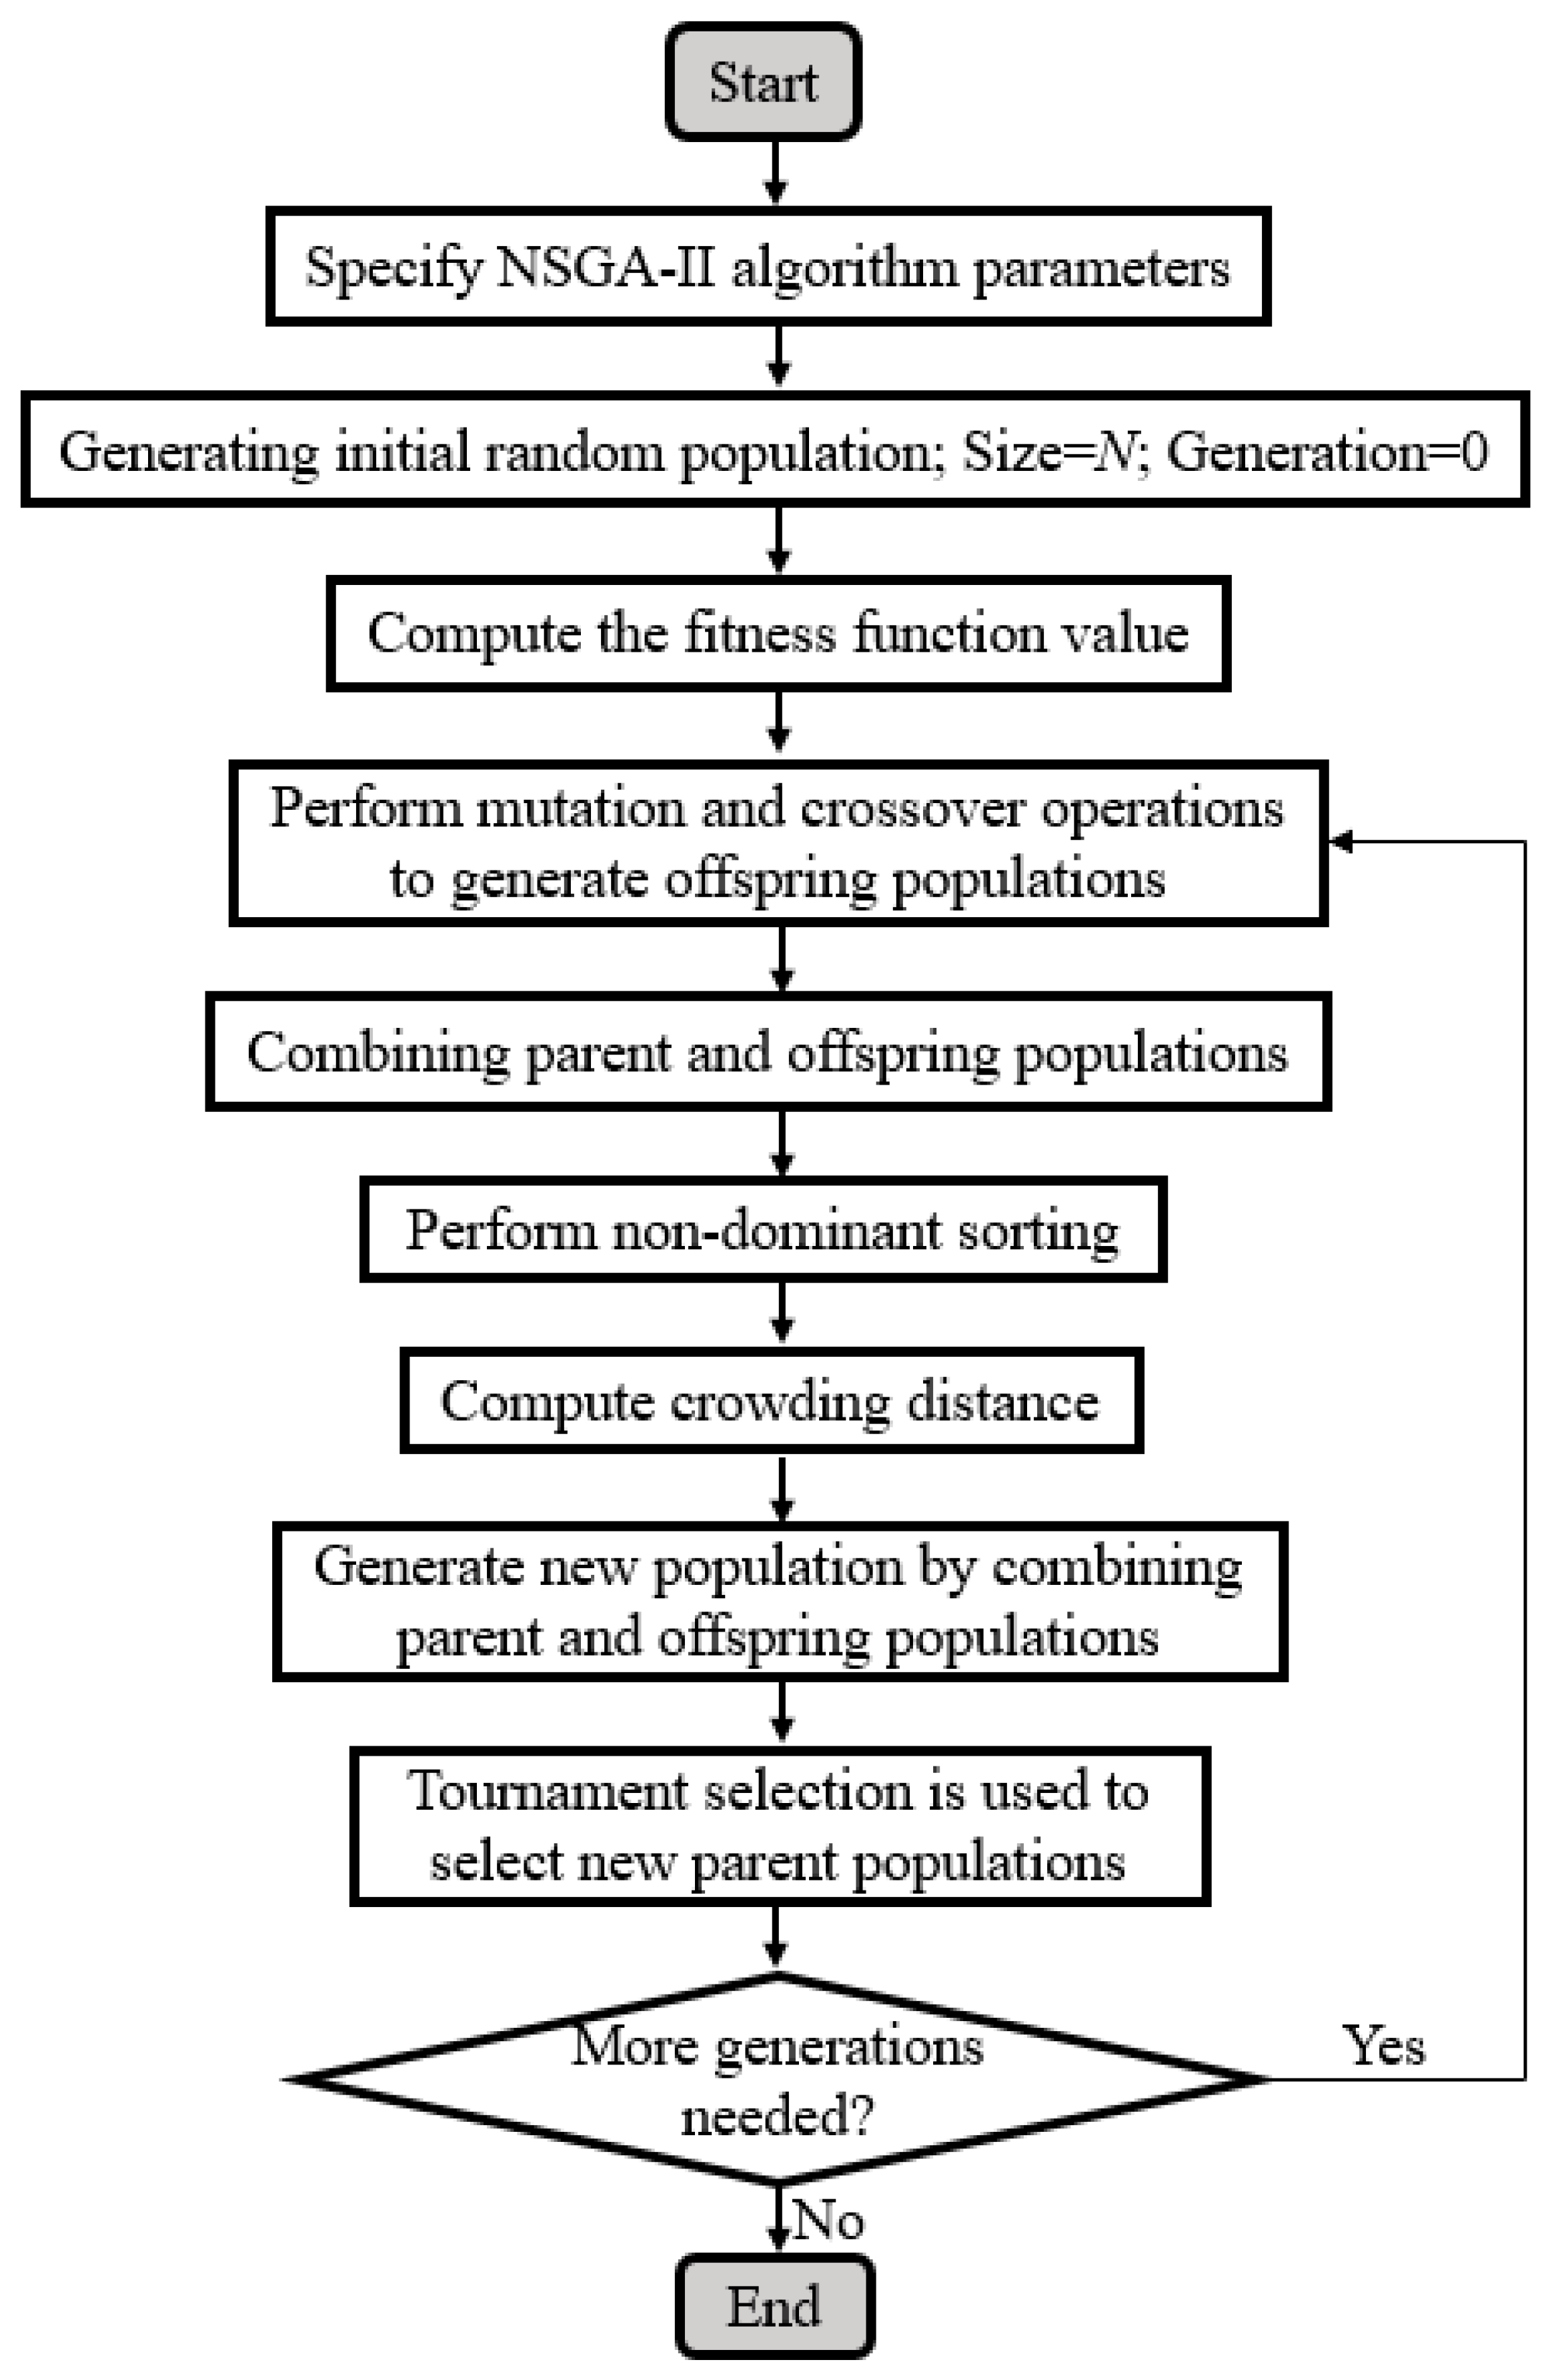
This study centers on optimizing equivalent power density, energy, and exergy efficiency. The NSGA-II method, an enhanced version of the original NSGA proposed by Deb et al., is utilized in this study. This algorithm was chosen for its effective sorting mechanism, which helps mitigate computational complexities. NSGA-II is a well-known algorithm used to identify the Pareto-optimal set in multi-objective optimization. This algorithm achieves this objective by employing particular mathematical equations. The boundary conditions of this study are as follows:
where to represent three objective functions and to are the selected five decision variables. Figure 2 depicts the NSGA-II optimization flowchart. A comprehensive description of the process can be found in Reference [51].
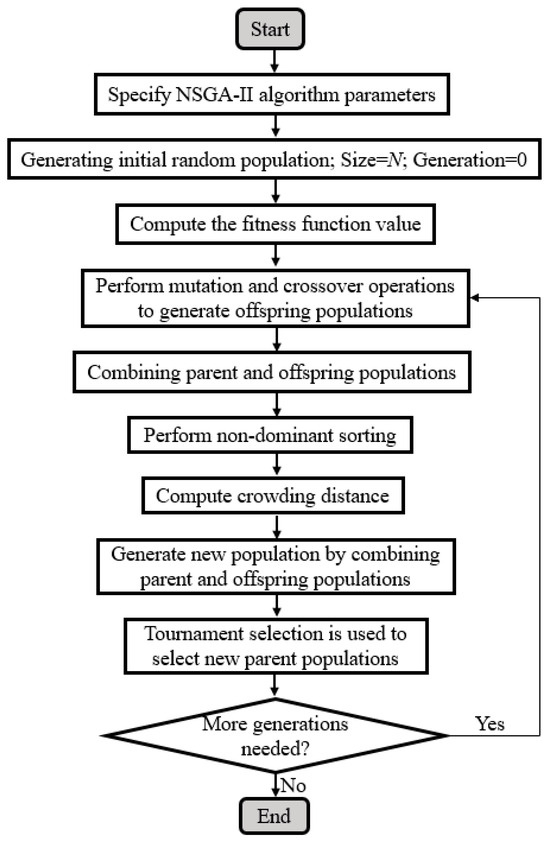
Figure 2.
The flowchart of NSGA-II procedure adapted from Ref. [52].
3. Generic Performance Characteristics
To evaluate the validity of the proposed model, a comparison was made between the predicted and experimental results [53,54,55] at various current densities and operating temperatures. This comparison is depicted in Figure 3. The net output voltage was calculated and compared independently at three different operating temperatures (423 K, 438 K and 453 K).
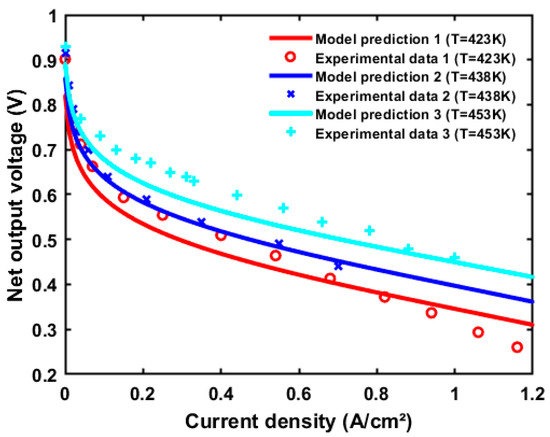
Figure 3.
Validation of the modeled HT-PEMFC at three operating temperatures from references [53,54,55].
The parameters used for validating the HT-PEMFC model can be found in Table 4. During the process of model selection, validation, and comparison with experimental data, variations in the consistency of parameters provided in different literature sources were observed. Ensuring the model’s accuracy and its universality across three temperatures necessitated alignment with the existing model framework. This approach involved aligning key parameters, such as operating temperature and membrane thickness. In cases where complete numerical details were not available, representative values were chosen for input to enhance the reliability and applicability of the model.
Table 4.
Parameters utilized in validation of HT-PEMFC modeling [5,25,29,30,53,54,55].
The discrepancy between the experimental values and the modeling predictions in Figure 3 can be primarily attributed to the following factors. First, the model validated the polarization curves at 423 K, 438 K, and 453 K. Extensive literature research has shown that experiments validating these three temperatures under identical conditions are scarce. In the papers that were accessed for these temperatures, the provided parameters were not entirely consistent. Therefore, representative values were assigned to parameters without specific values, while ensuring that key parameters remained aligned with experimental data. This approach not only maintains the correlation between the polarization curves and experimental values but also explains the characteristics of the three temperatures from a universality perspective. Second, the deviation in the high current density region is primarily due to the concentration overpotential, which is predominantly influenced by the limiting current density. Factors affecting the limiting current density, including pressure, operating temperature, fuel flow rate, and reactant concentration [56], were not considered in this study.
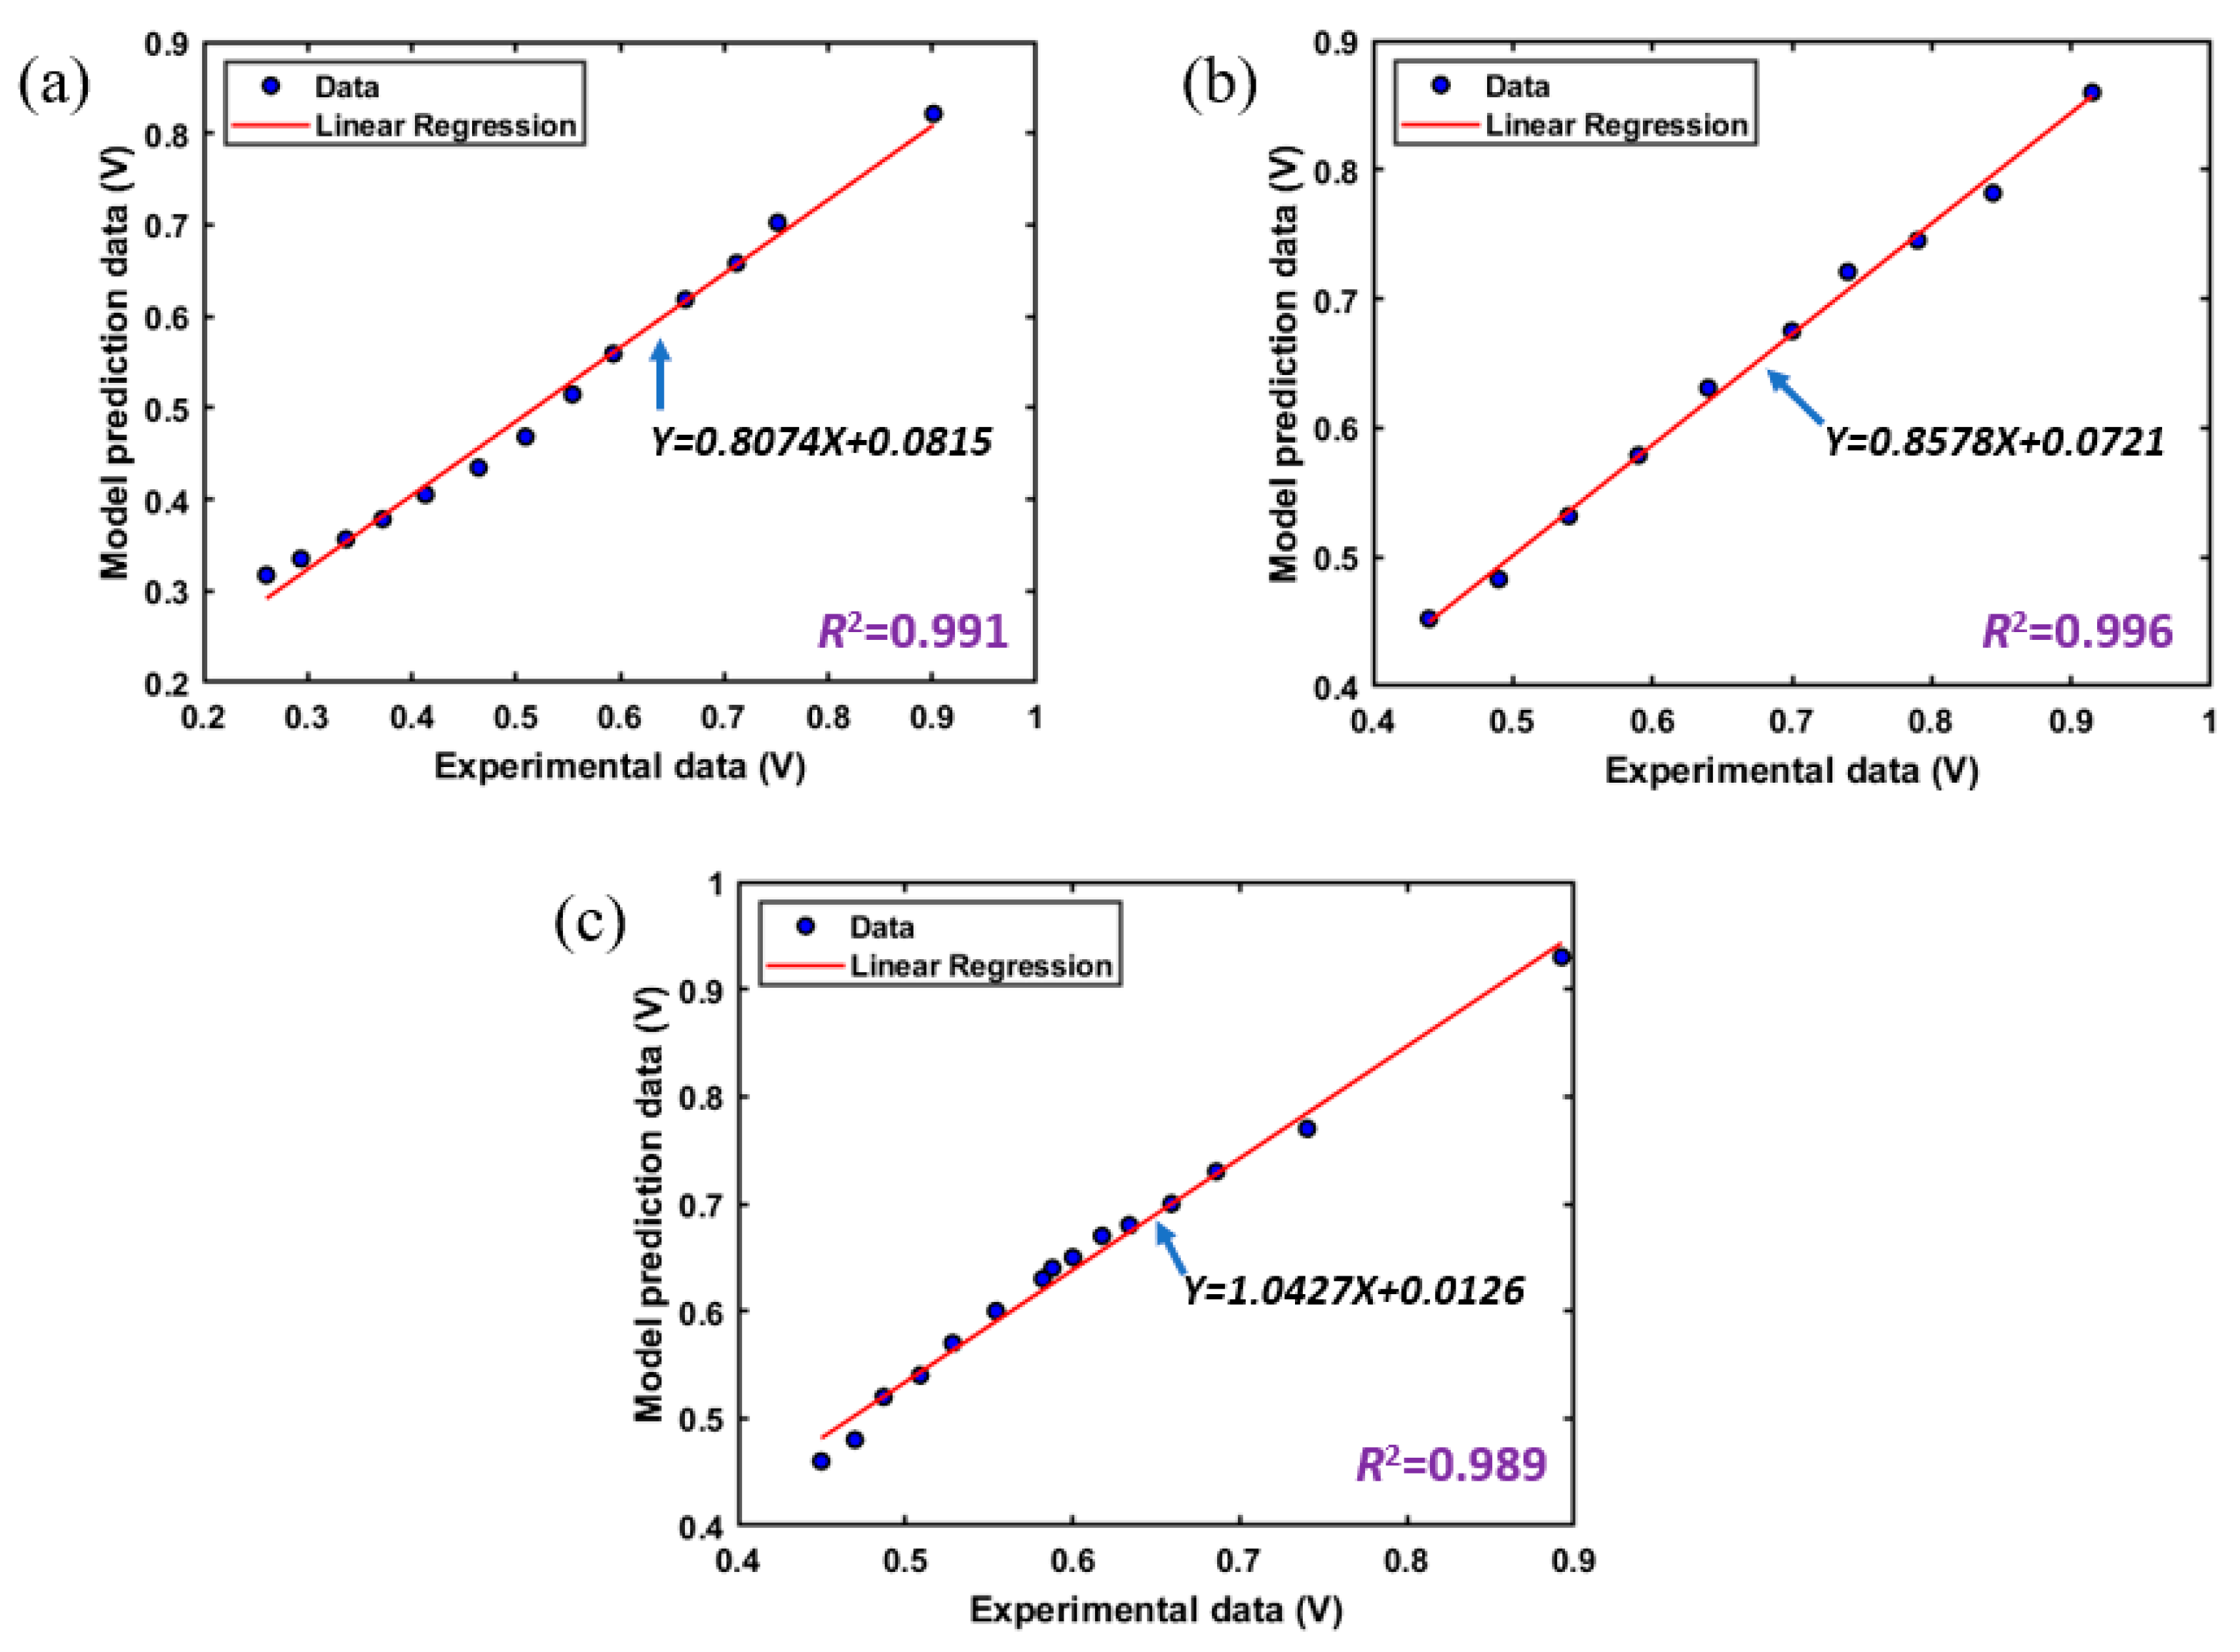
The outcomes of the proposed model were assessed utilizing two mathematical statistical methods to quantify the disparity between the experimental and predicted data. The values of the root-mean-square error (RMSE) for operating temperatures at 423 K, 438 K, and 453 K were 0.043, 0.032, and 0.040, respectively. Moreover, the R-squared (R2) was calculated to be 0.991, 0.996, and 0.989 for operating temperatures at 423 K, 438 K, and 453 K, respectively. Additionally, Figure 4 illustrates R2 correlation coefficient distribution between the predicted and experimental data. Consequently, there is a remarkable correlation between the two data sets, confirming the high validation of the proposed model across nearly the entire current density range. The values of the RMSE and R2 can be obtained by the following formulas [56,57]:
where n stand for the number of data points, and , , and represent the experimental, predicted net output voltage values, and the mean of experimental net output voltage values, respectively.
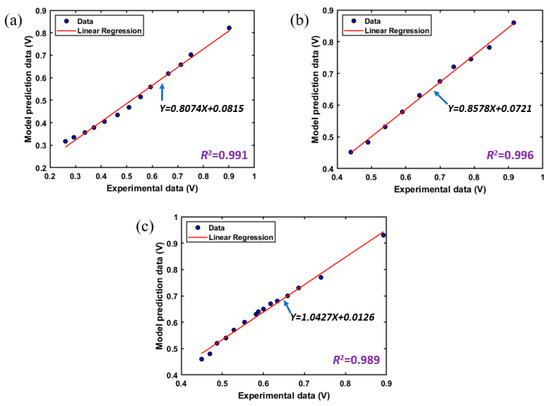
Figure 4.
Distribution of R2 correlation for (a) 423 K, (b) 438 K, and (c) 453 K from references [53,54,55].
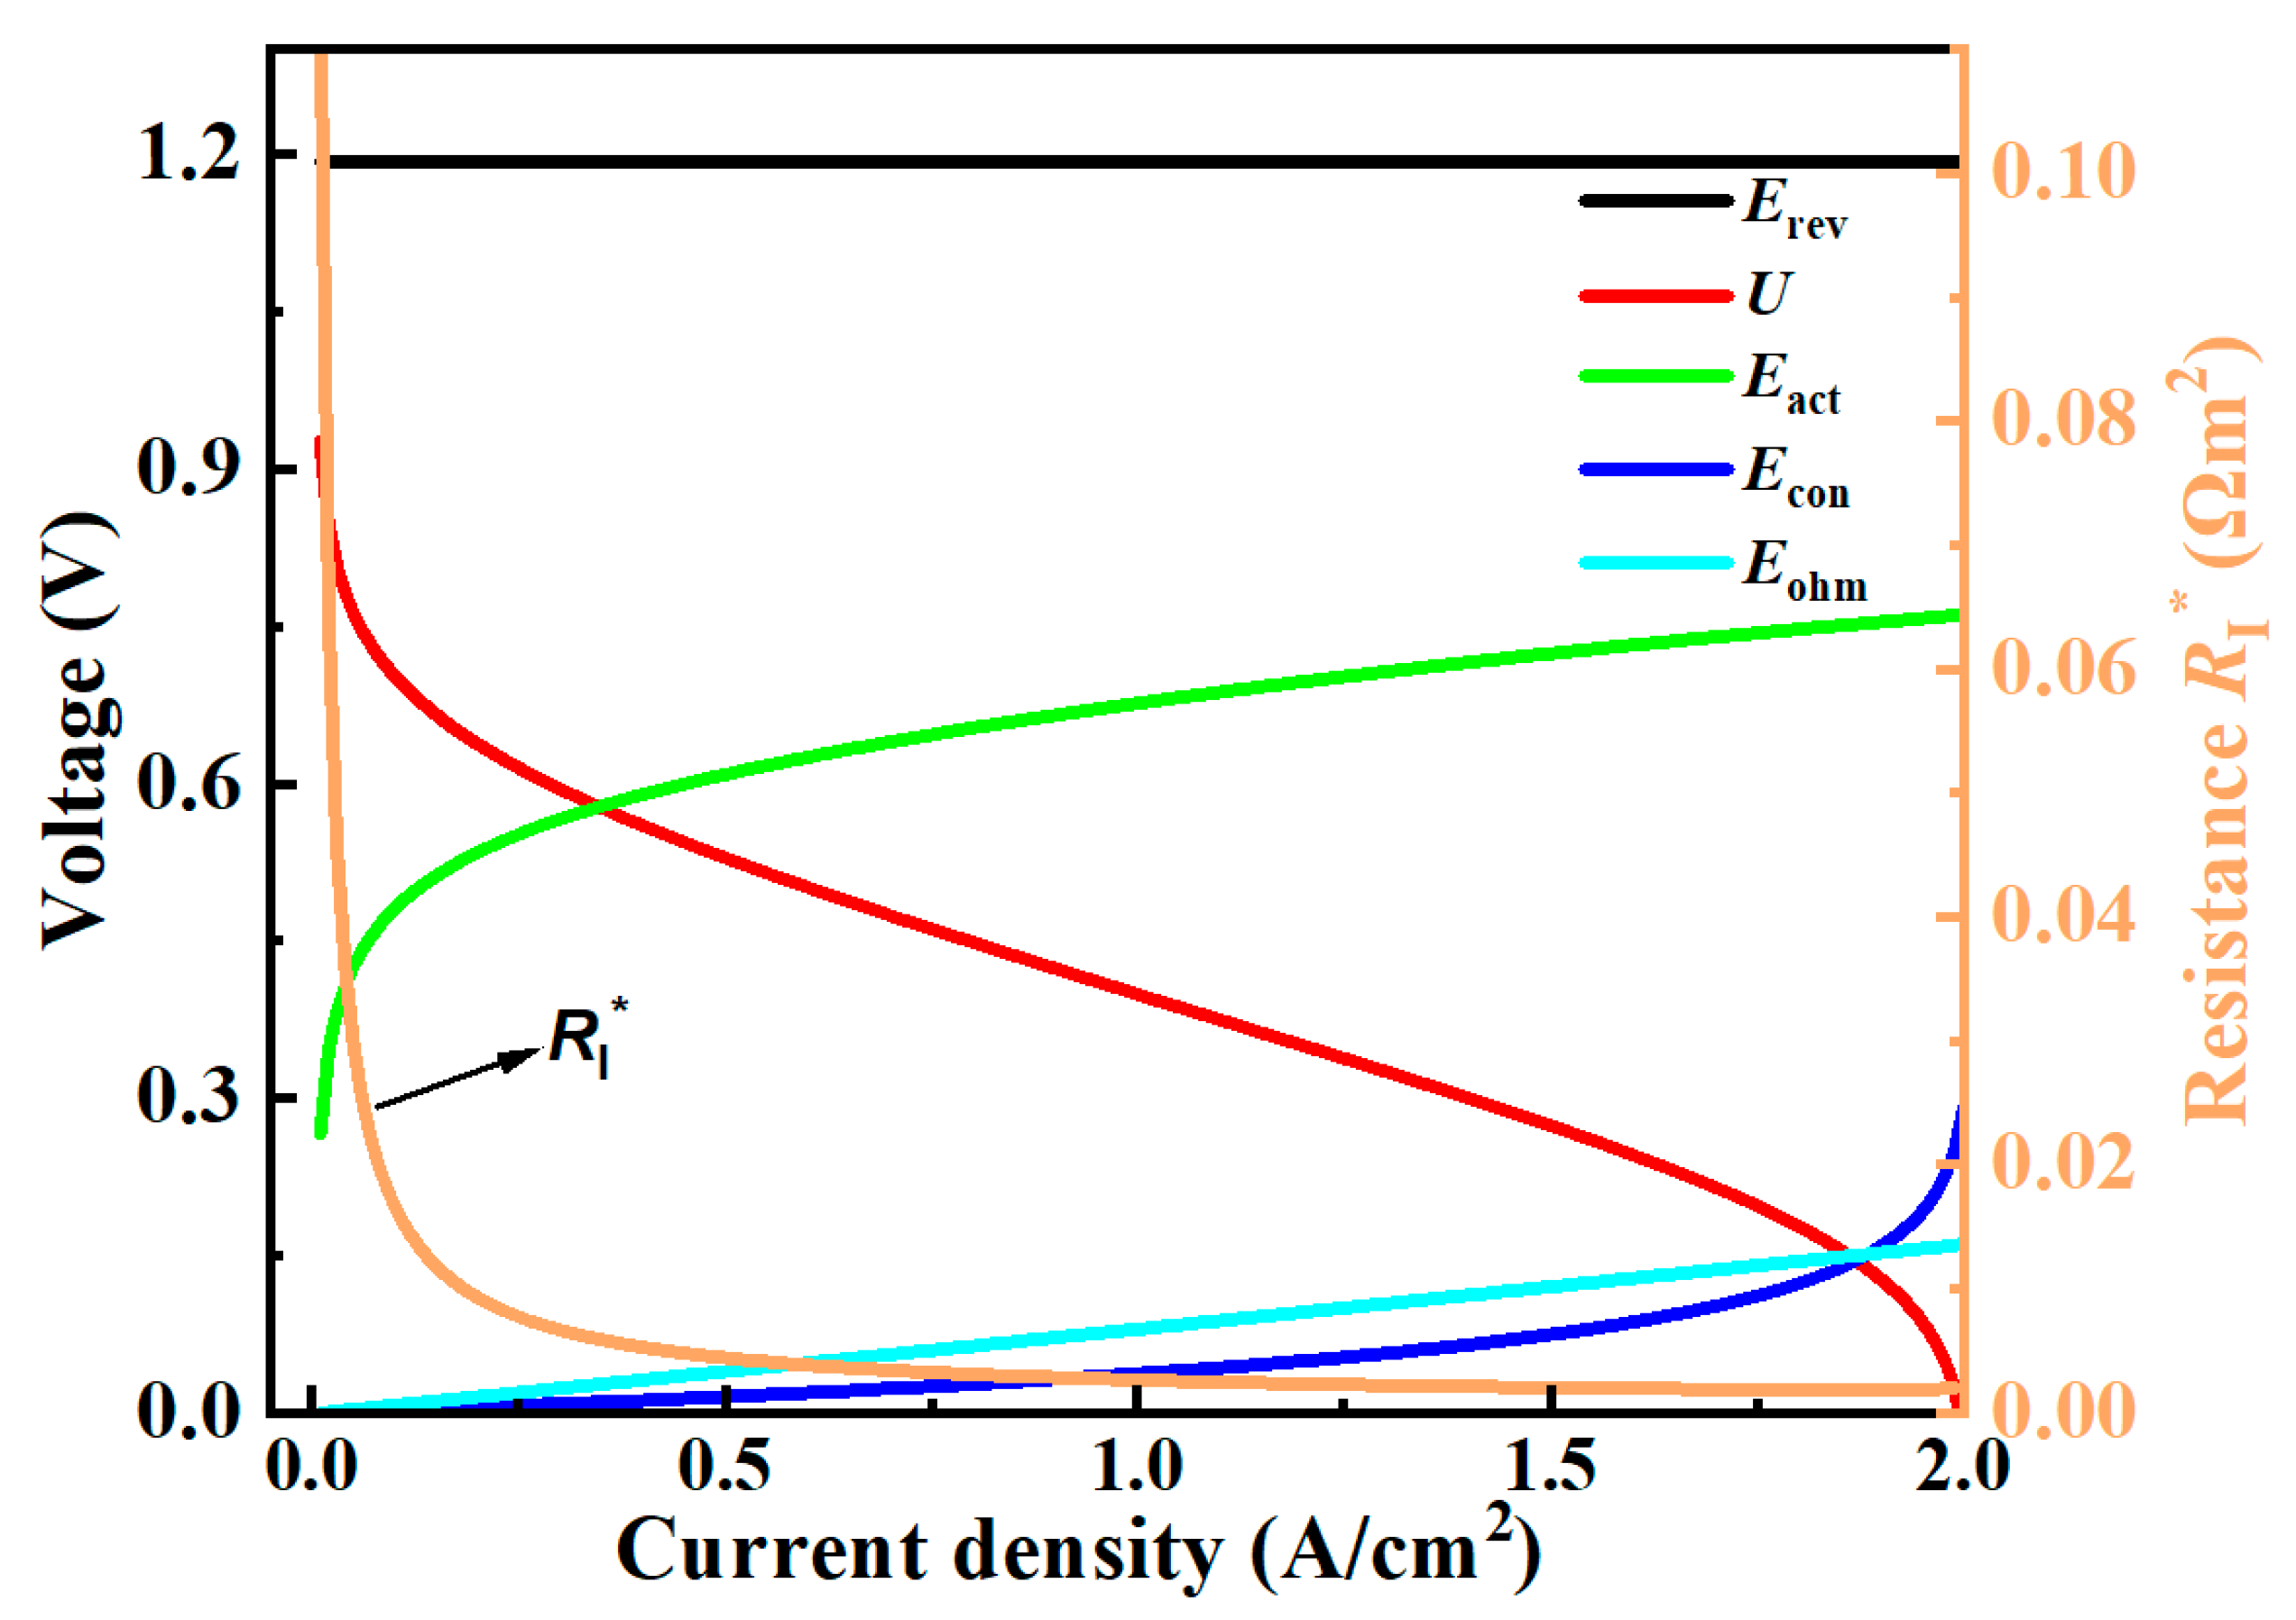
Variations in the internal resistance, , net output voltage, U, reversible potential, and three overpotentials, including concentration overpotential, , activation overpotential, , ohmic overpotential , are illustrated based on Equations (4)–(21), as shown in Figure 5. remains constant regardless of i, whereas the three overpotentials increase with i. and increase hyperbolically and linearly with i, respectively, whereas increases logarithmically with i. At a high current density, U falls sharply due to a rapid increase in , whereas at a low current density, U falls suddenly due to a rapid increase in . RI* decreases monotonically as i increases and approaches zero owing to the three overpotentials cumulative influence, where RI*= RI · A. Subsequent appearances of parameters with an asterisk have similar meanings, that is, they involve multiplying the corresponding parameter by the activated area (A).

Figure 5.
Relation between the current density and the irreversible losses, internal resistance, and reversible potential.
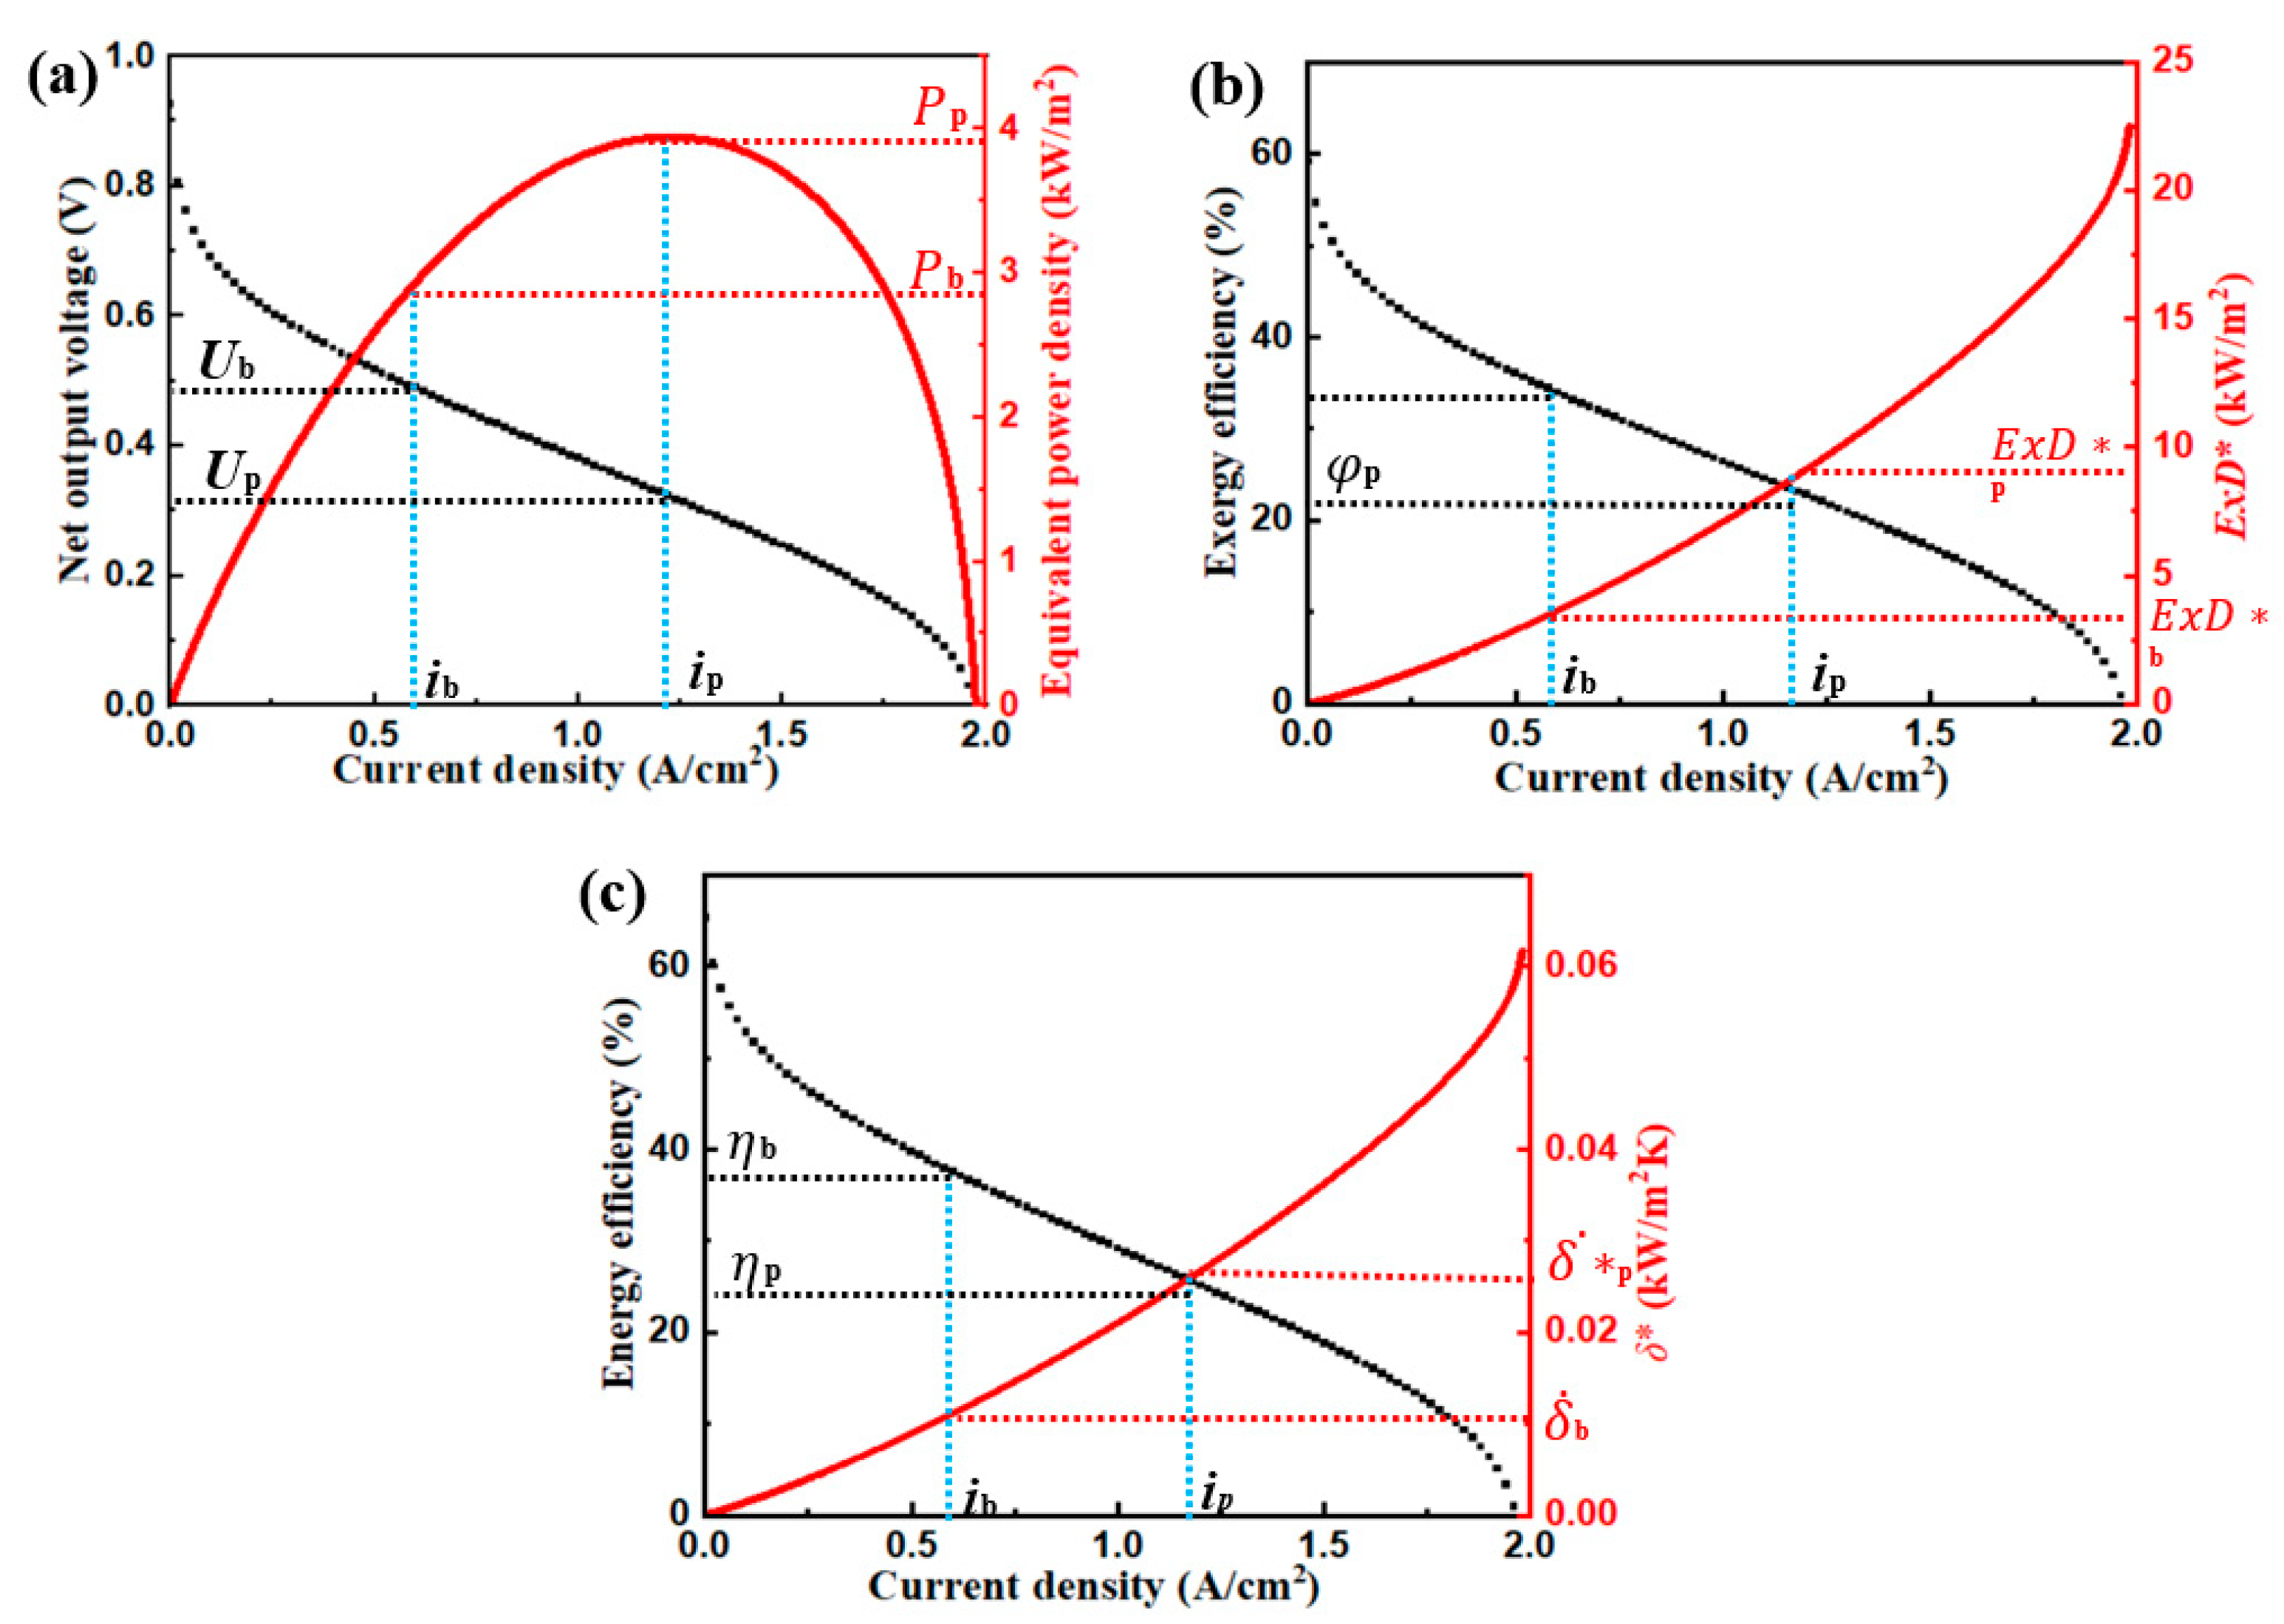
The performance parameters concerning energy and exergy can be derived from Equations (22)–(33) and their respective relationships with current density are illustrated in Figure 6. It is essential to highlight that parameters marked with an asterisk represent equivalents based on the effective polarization area of the fuel cell. According to Refs. [58,59,60], the regular current density is selected at i = ib = 0.60 A/cm2 at base case 1 (BC-1), and the net output voltage (Ub), equivalent power density (P*b), exergy efficiency (φb), exergy destruction rate (ExD*b), energy efficiency (ηb), and entropy production rate (*b) are 0.489 V, 2.932 kW/m2, 33.96%, 3.623 kW/m2, 37.50%, and 0.011 kW/m2K, respectively. It should be highlighted that the ultimate optimization in this study is grounded on the performance metrics of the BC-1. Another base case 2 (BC-2) is when P* reaches its maximum P*p of 3.942 kW/m2, at i = ip = 1.23 A/cm2, and Up, φp, ExD*p, ηp, and *p are 0.321 V, 22.22%, 9.447 kW/m2, 24.54%, and 0.028 kW/m2K, respectively.
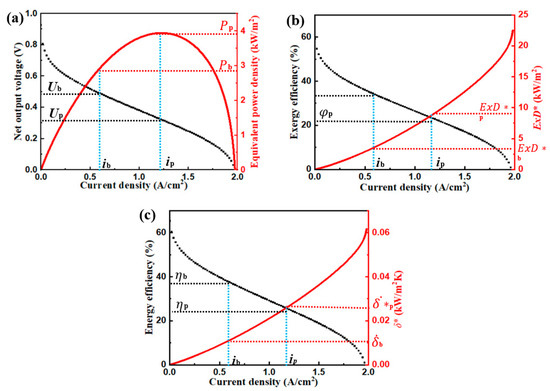
Figure 6.
The variations in (a) U and , (b) and , and (c) and at different operating current density.
4. Parametric Studies
Upon examination of the analysis mentioned above, it becomes evident that HT-PEMFC performance is contingent upon various critical design and operating parameters.
4.1. Operating Temperature
The increase in operating temperature (T) for HT-PEMFCs within the range of 140 to 200 °C has attracted significant interest, as noted in referenc [61]. Figure 7 illustrates the internal resistances and the matching polarization curves of the HT-PEMFC under different cell temperatures (403 K, 418 K, 433 K, 448 K). The results indicate that HT-PEMFC performance increases as the operating temperature rises. The observed enhancement in HT-PEMFC performance can be attributed to the increased proton conductivity and reaction kinetics of the polybenzimidazole membrane as temperature rises.
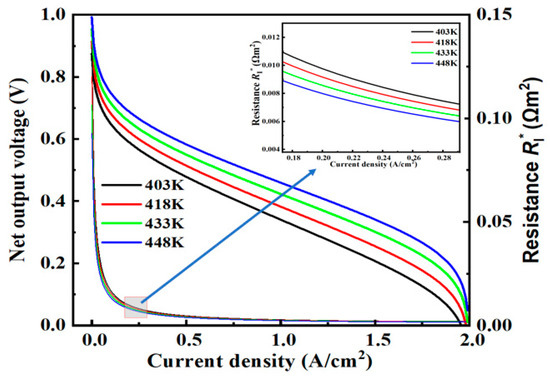
Figure 7.
The relationships between the current density and the net output voltage and the equivalent internal resistance at different operating temperatures.
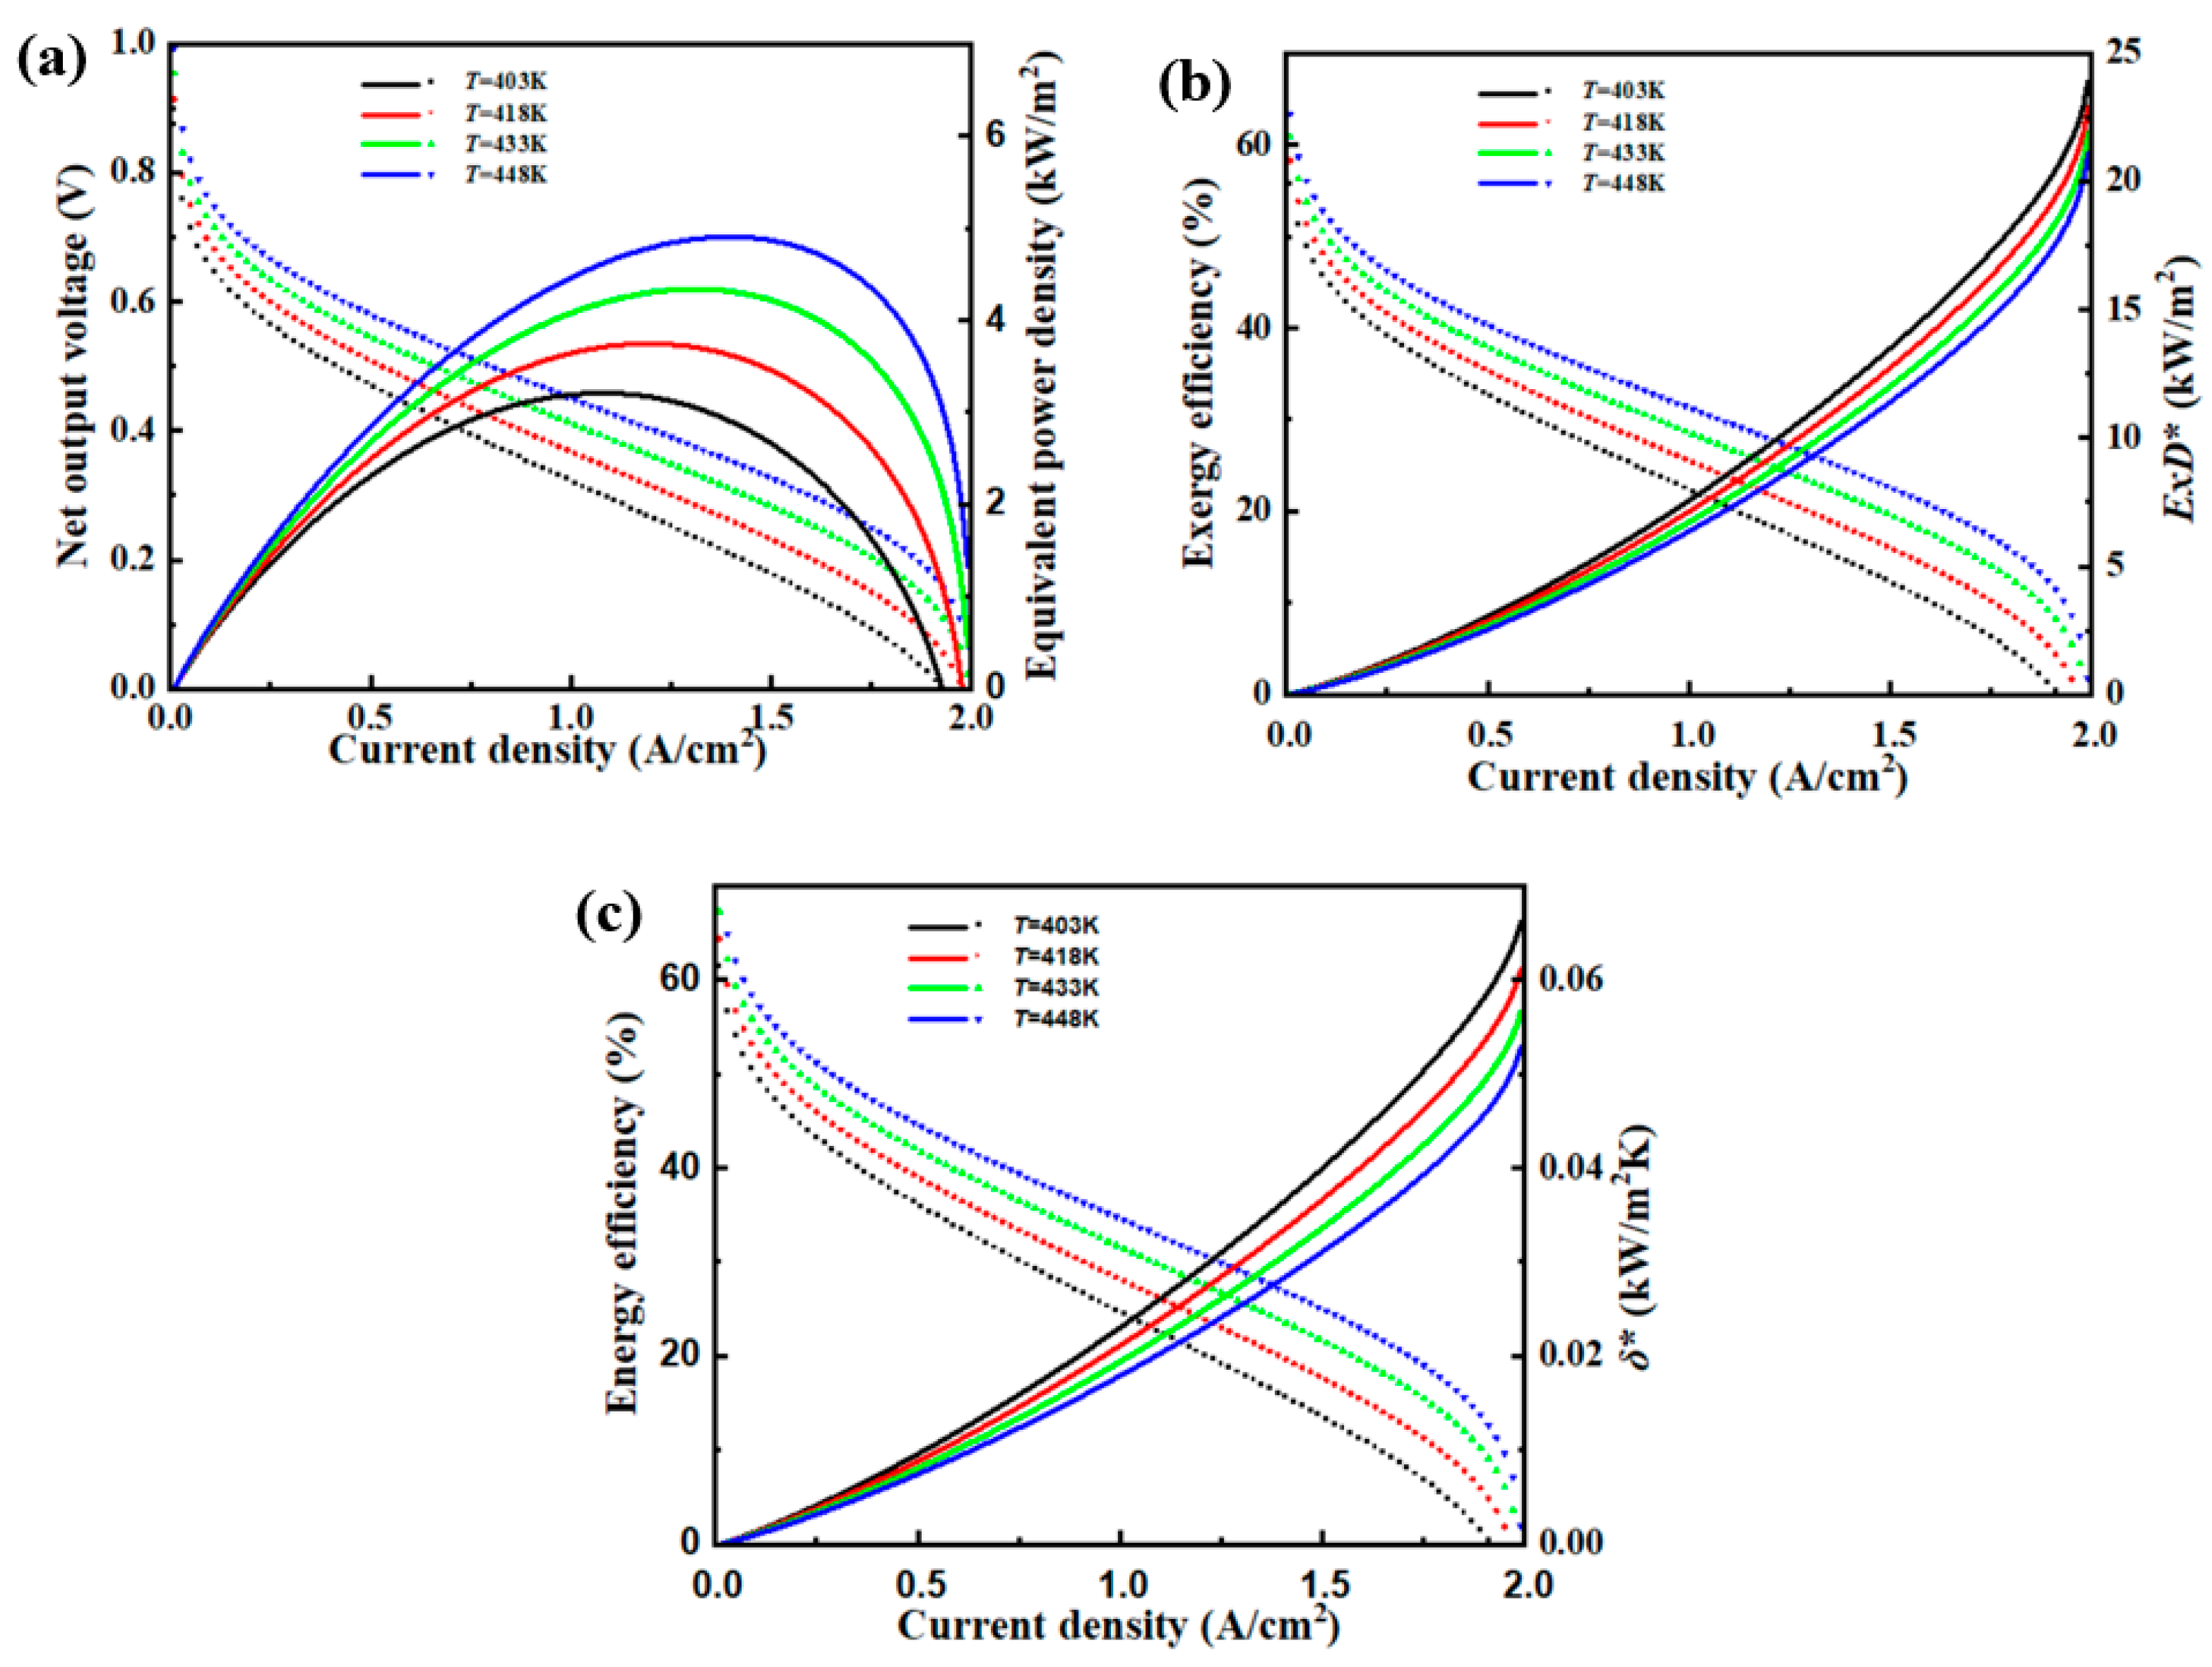
Figure 8 illustrates that as operating temperature increases, there is an enhancement in U, P*, φ and η, while ExD* and * experience a reduction. The observed phenomenon can be principally attributable to the positive correlation between operating temperature and proton conductivity in HT-PEMFC based on Equations (14)–(18). As the temperature rises, the higher proton conductivity leads to a reduction in the ohmic overpotential. Furthermore, it has been observed that the exchange current density exhibits an upward trend as temperature rises based on Equations (12) and (13), thereby resulting in a decrease in activation overpotential. Consequently, the power losses arising from activation overpotential and ohmic overpotential are diminished. In detail, as depicted in Figure 8a, once the regular current density is achieved at BC-1, the corresponding P*b values are observed to be 2.592, 2.822, 3.048, and 3.256 kW/m2, respectively, as T increases from 403 K to 448 K. Consequently, elevating the temperature to 433 K and 448 K results in a 3.96% and 11.05% improvement in the P*b values in comparison to the BC-1. Correspondingly, the P*p values are observed to be 3.208, 3.743, 4.335, and 4.903 kW/m2 from 403 to 448 K. Consequently, elevating the temperature to 433 K and 448 K results in a 9.97% and 28.38% enhancement in the P*b values in comparison to the BC-2. Figure 8b shows how φ and ExD* change with different temperatures. With the temperature rising from 403 K to 448 K, φb values rise progressively, with notable increases of 5.77% and 12.93% at 433 K and 448 K compared to BC-1. Similarly, φp values also rise, with improvements of 4.05% and 10.04% at 433 K and 448 K compared to BC-2. Furthermore, the maximum ExD* decreases as temperature increases, with values ranging from 23.886 to 21.075 kW/m2. Figure 8c illustrates how η and * vary with temperature. As temperature rises from 403 K to 448 K, ηb values increase, with enhancements of 5.76% and 13.04% at 433 K and 448 K relative to BC-1. Similarly, ηp values grow, with boosts of 4.08% and 10.15% at the same temperatures compared to BC-2. Concurrently, maximum * values decrease, ranging from 0.066 to 0.053 kW/m2K. Overall, elevating the temperature positively influences HT-PEMFC performance.
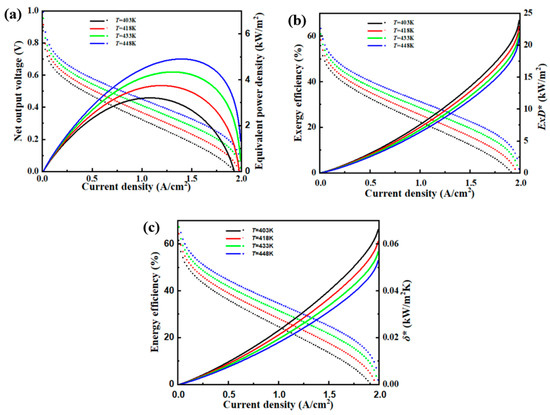
Figure 8.
The relation between (a) U and , (b) and , and (c) and under different operating temperatures and current densities.
4.2. Operating Pressure
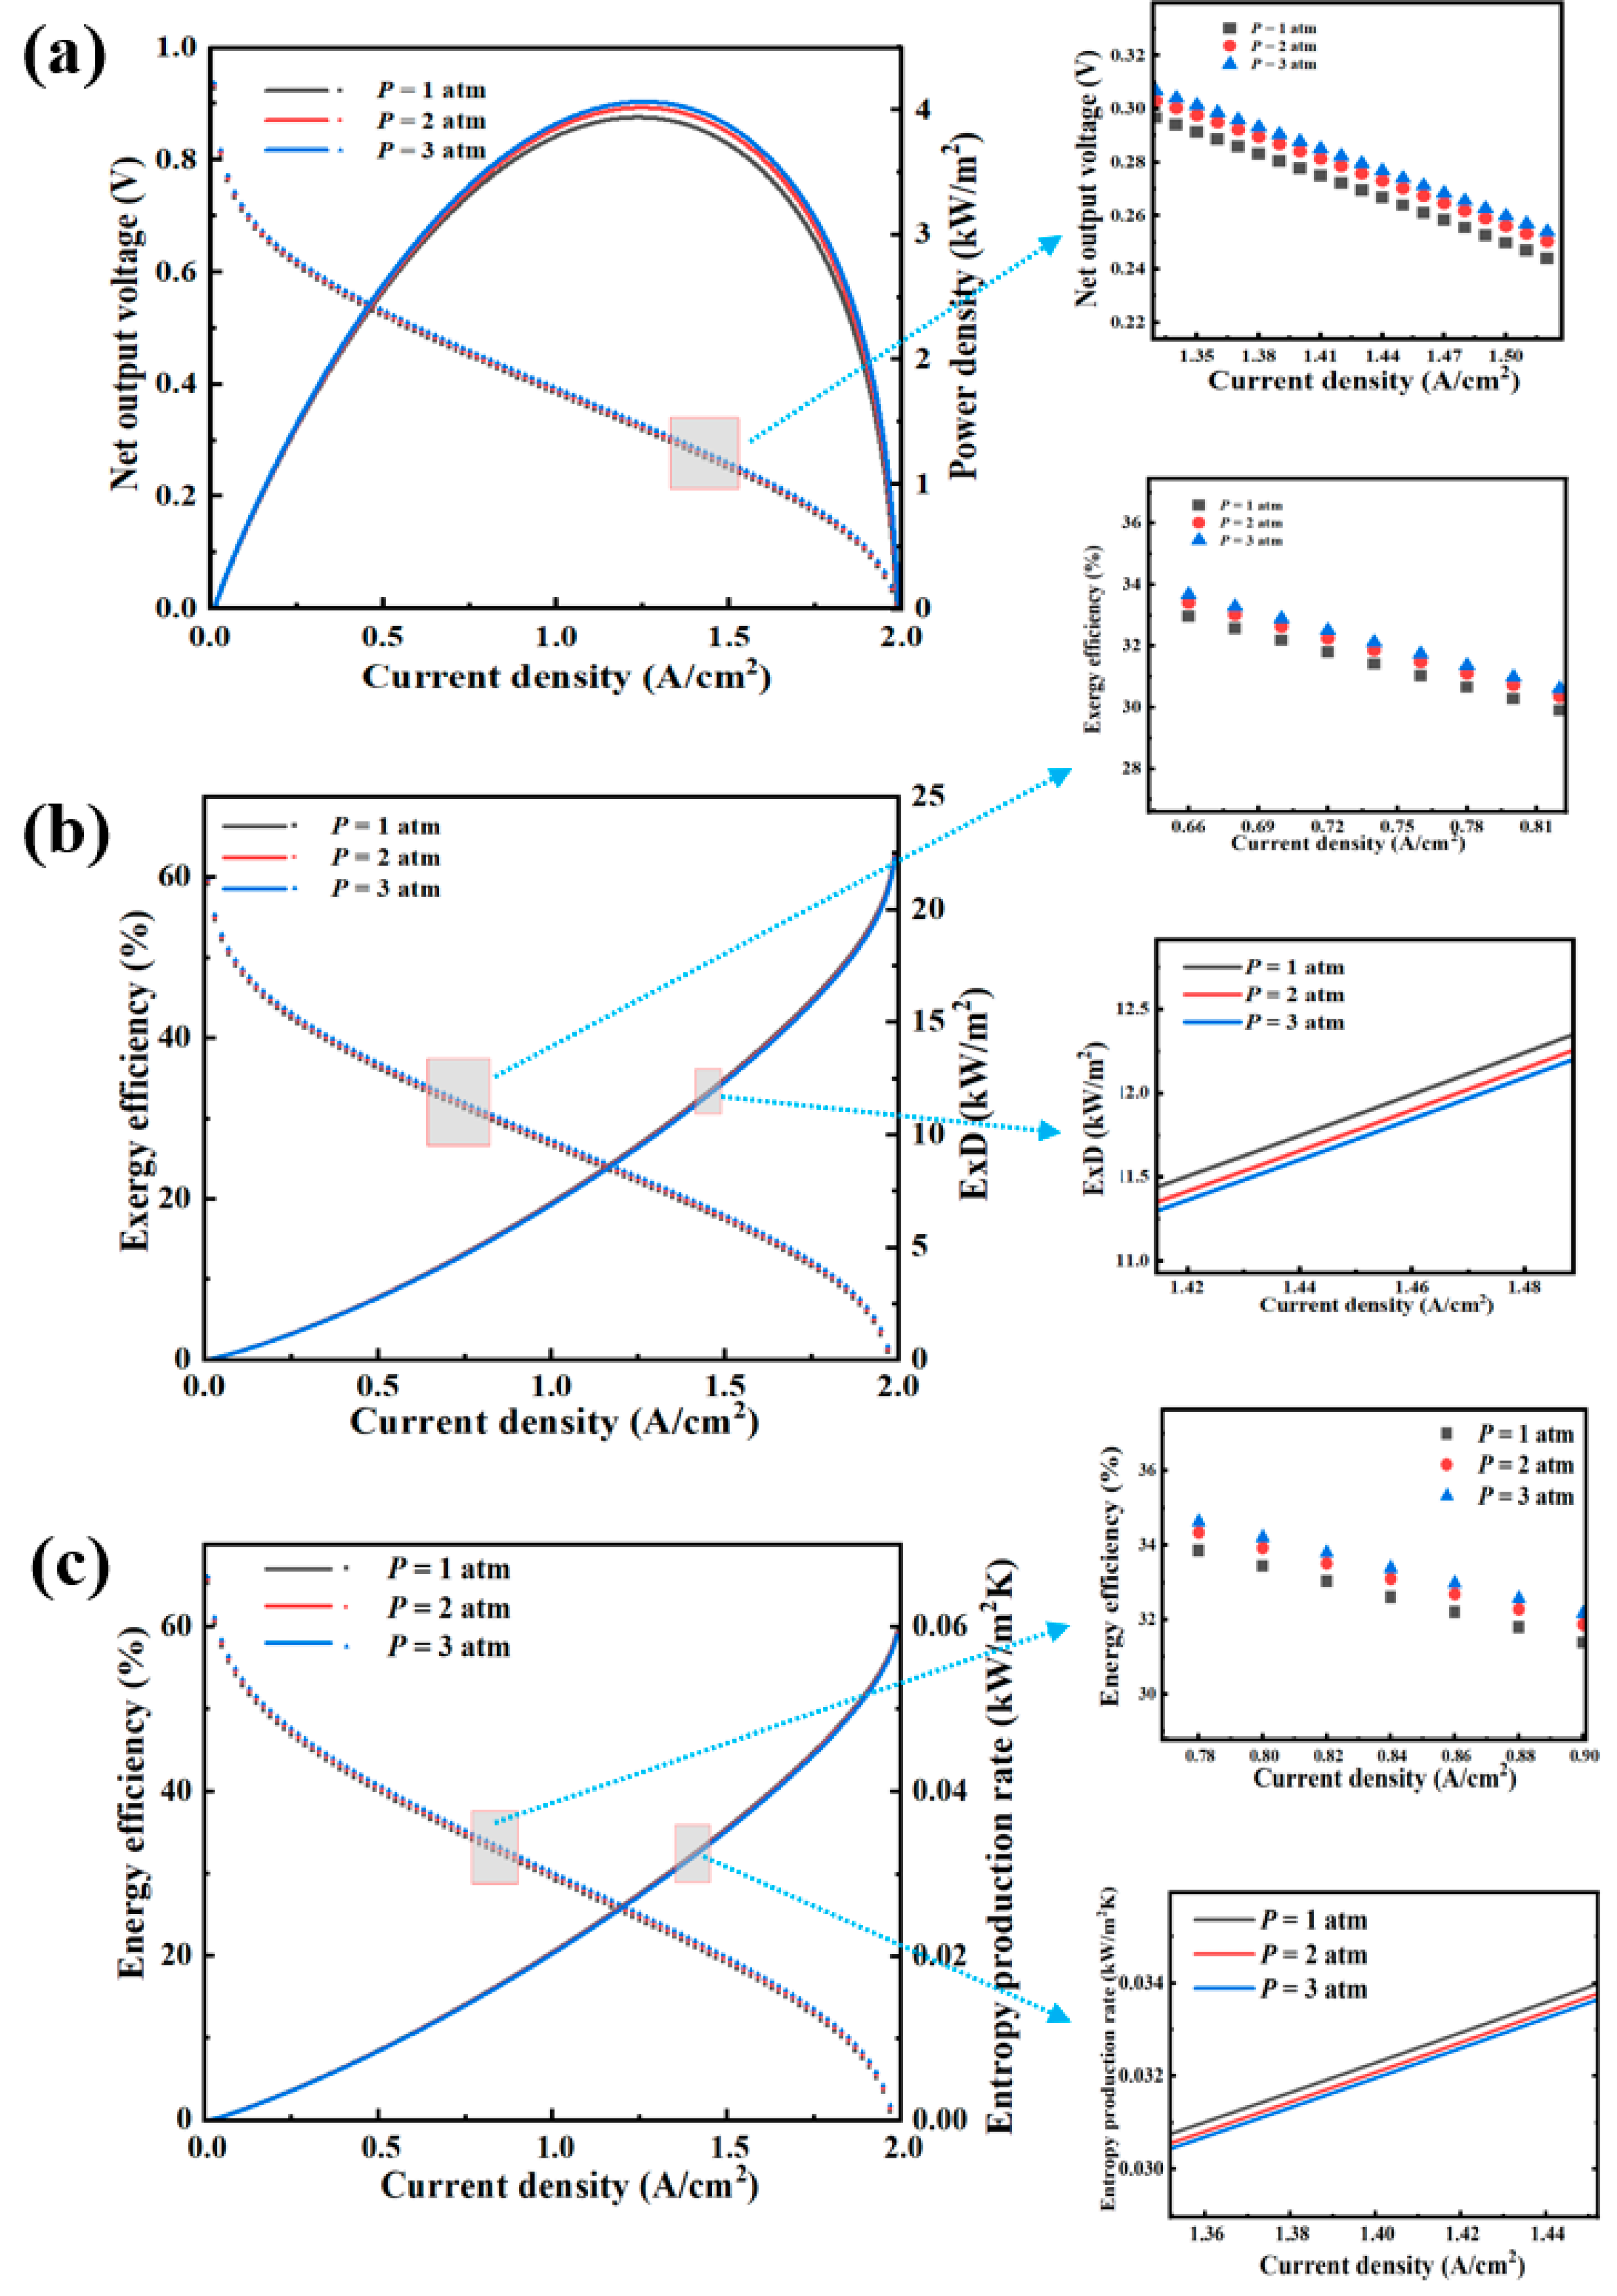
The performance of HT-PEMFCs is subject to the influence of the operating pressure (P). An increasese is parameter P yields a corresponding elevation in based on Equation (4), hence resulting in a rise in both U and P*. In detail, Figure 9a reveals that elevating operating pressure to 3 atm yields minor increments in U and P* values, leading to only about 3% improvement in Pb and Pp values compared to BC-1 and BC-2, respectively. Figure 9b shows a subtle increase in φ values with pressure because increasing P decreases ExD*, with φb values rising marginally from 34.16% to 34.86% as P varies from 1 to 3 atm. Similarly, φp values ascend from 22.22% to 22.74% and the maximum ExD* decreases slightly. Figure 9c illustrates that as P is elevated from 1 to 3 atm, ηb values enhance by just 2.64% and ηp by 2.32% relative to their base cases. Meanwhile, the maximum * values drop gradually. The main reasons for the aforementioned finding lie in the empirical equations employed in this model concerning the exchange current density, which only accounts for the influence of temperature while neglecting the impact of concentration variations caused by pressure changes on the kinetic performance. Consequently, variations in pressure within the electrochemical model can solely affect the thermodynamic equilibrium potential. Similar modeling approaches and outcomes are also documented in the references [29,30]. Broadly, while higher pressure does enhance HT-PEMFC performance, the benefits are less pronounced compared to temperature elevation. Additionally, pressure increase demands more energy for reactant compression, implying augmented weight, equipment size, and costs [62].
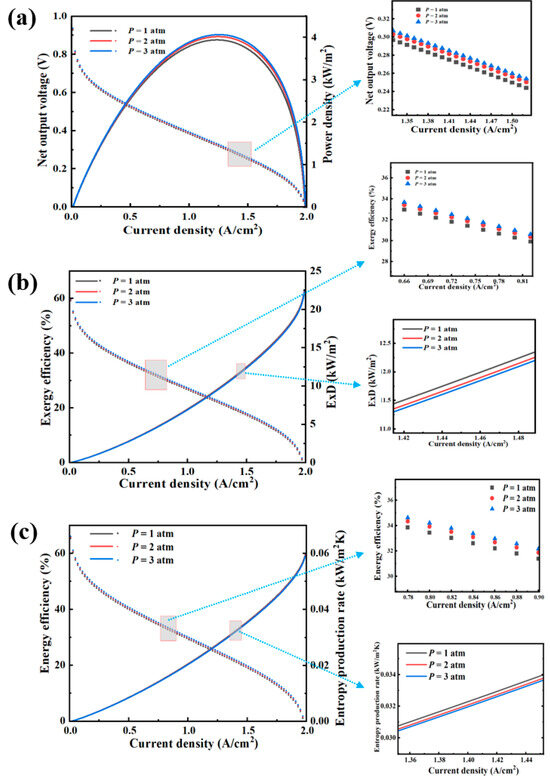
Figure 9.
Changes in (a) U and , (b) and , and (c) and across various operating pressures and current densities.
4.3. Doping Level
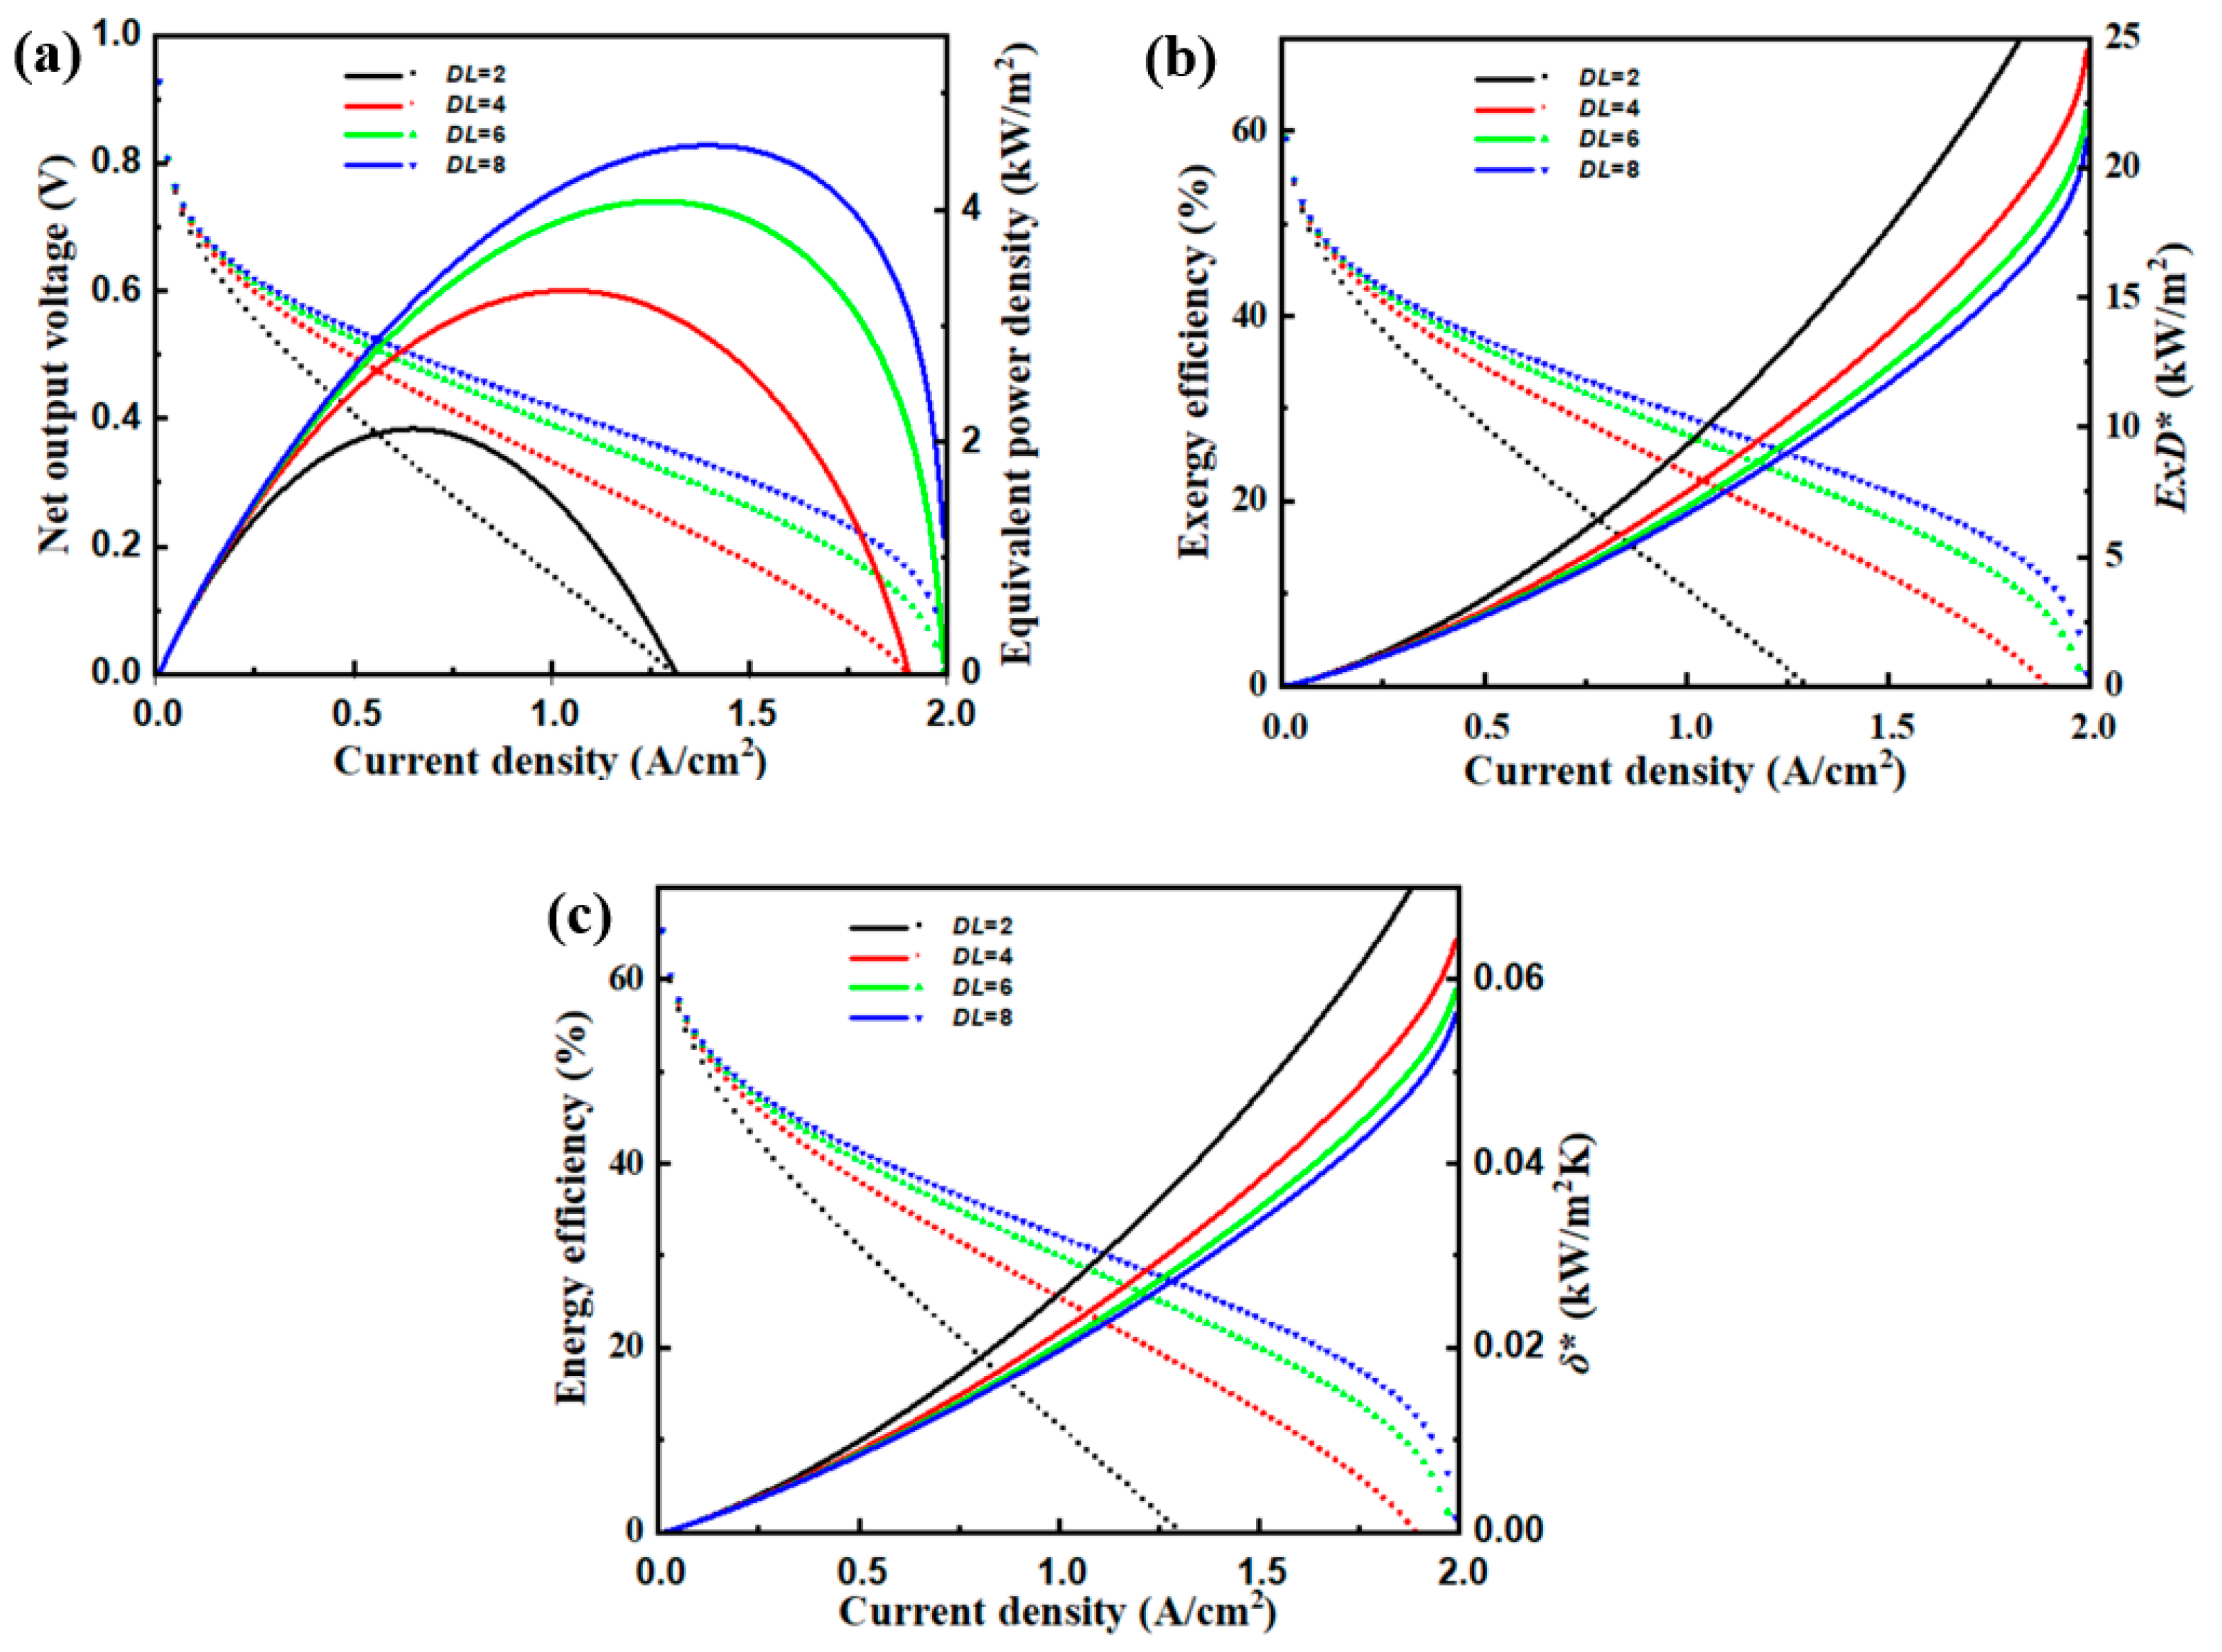
The doping level (DL) of phosphoric acid to polybenzimidazole, governed by acid concentration [63] and soaking time [64], critically affects HT-PEMFC performance. The DL is chatacterized as the number of phosphoric acid molecules per polymer repeart unit. A higher DL is advantageous for achieving reduced ohmic overpotential. This is because an increased DL implies a greater number of phosphoric acid molecules, which can function as both acceptors and donors in accordance with the Grotthuss mechanism [30]. As DL increases from 2 to 8, the net output voltage and equivalent power density increases accordingly. The observed phenomenon can be principally ascribed to the increase in doping levels, resulting in a reduction in ohmic overpotential and an increase in reversible potential based on Equations (14)–(18) and Equation (20). In detail, as DL escalates from 2 to 8 (Figure 10a), P*b values rise, with an enhancement of approximately 3.17% at DL = 8 compared to BC-1. P*p values similarly increase with a 3.22% improvement at DL = 8 relative to BC-2. In Figure 10b, φb values grow by 1.62% at DL = 8 compared to BC-1, and φp values display a 2.25% increase at the same DL value compared to BC-2. Meanwhile, ExD* values decline across the DL range. Figure 10c shows that ηb and ηp values improve by 4.99% and 2.24%, respectively, at DL = 8 compared to their base cases. The maximum * values decrease as DL rises. In essence, while elevated phosphoric acid doping bolsters HT-PEMFC performance, the efficiency gain plateaus beyond a certain DL due to potential phosphate leakage from the membrane [65]. Numerous experiments have been conducted to develop membranes with an optimized DL for superior performance.
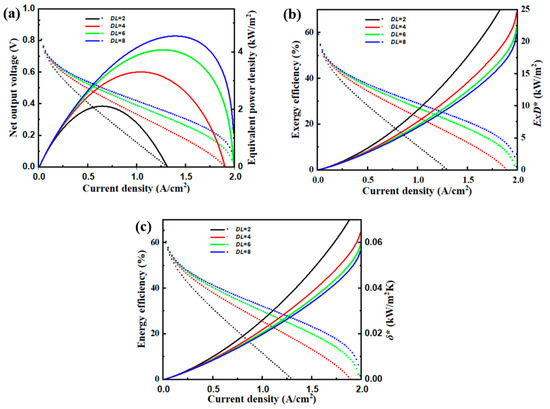
Figure 10.
Changes in (a) U and , (b) and , and (c) and across various doping levels and current densities.
4.4. Membrane Thickness
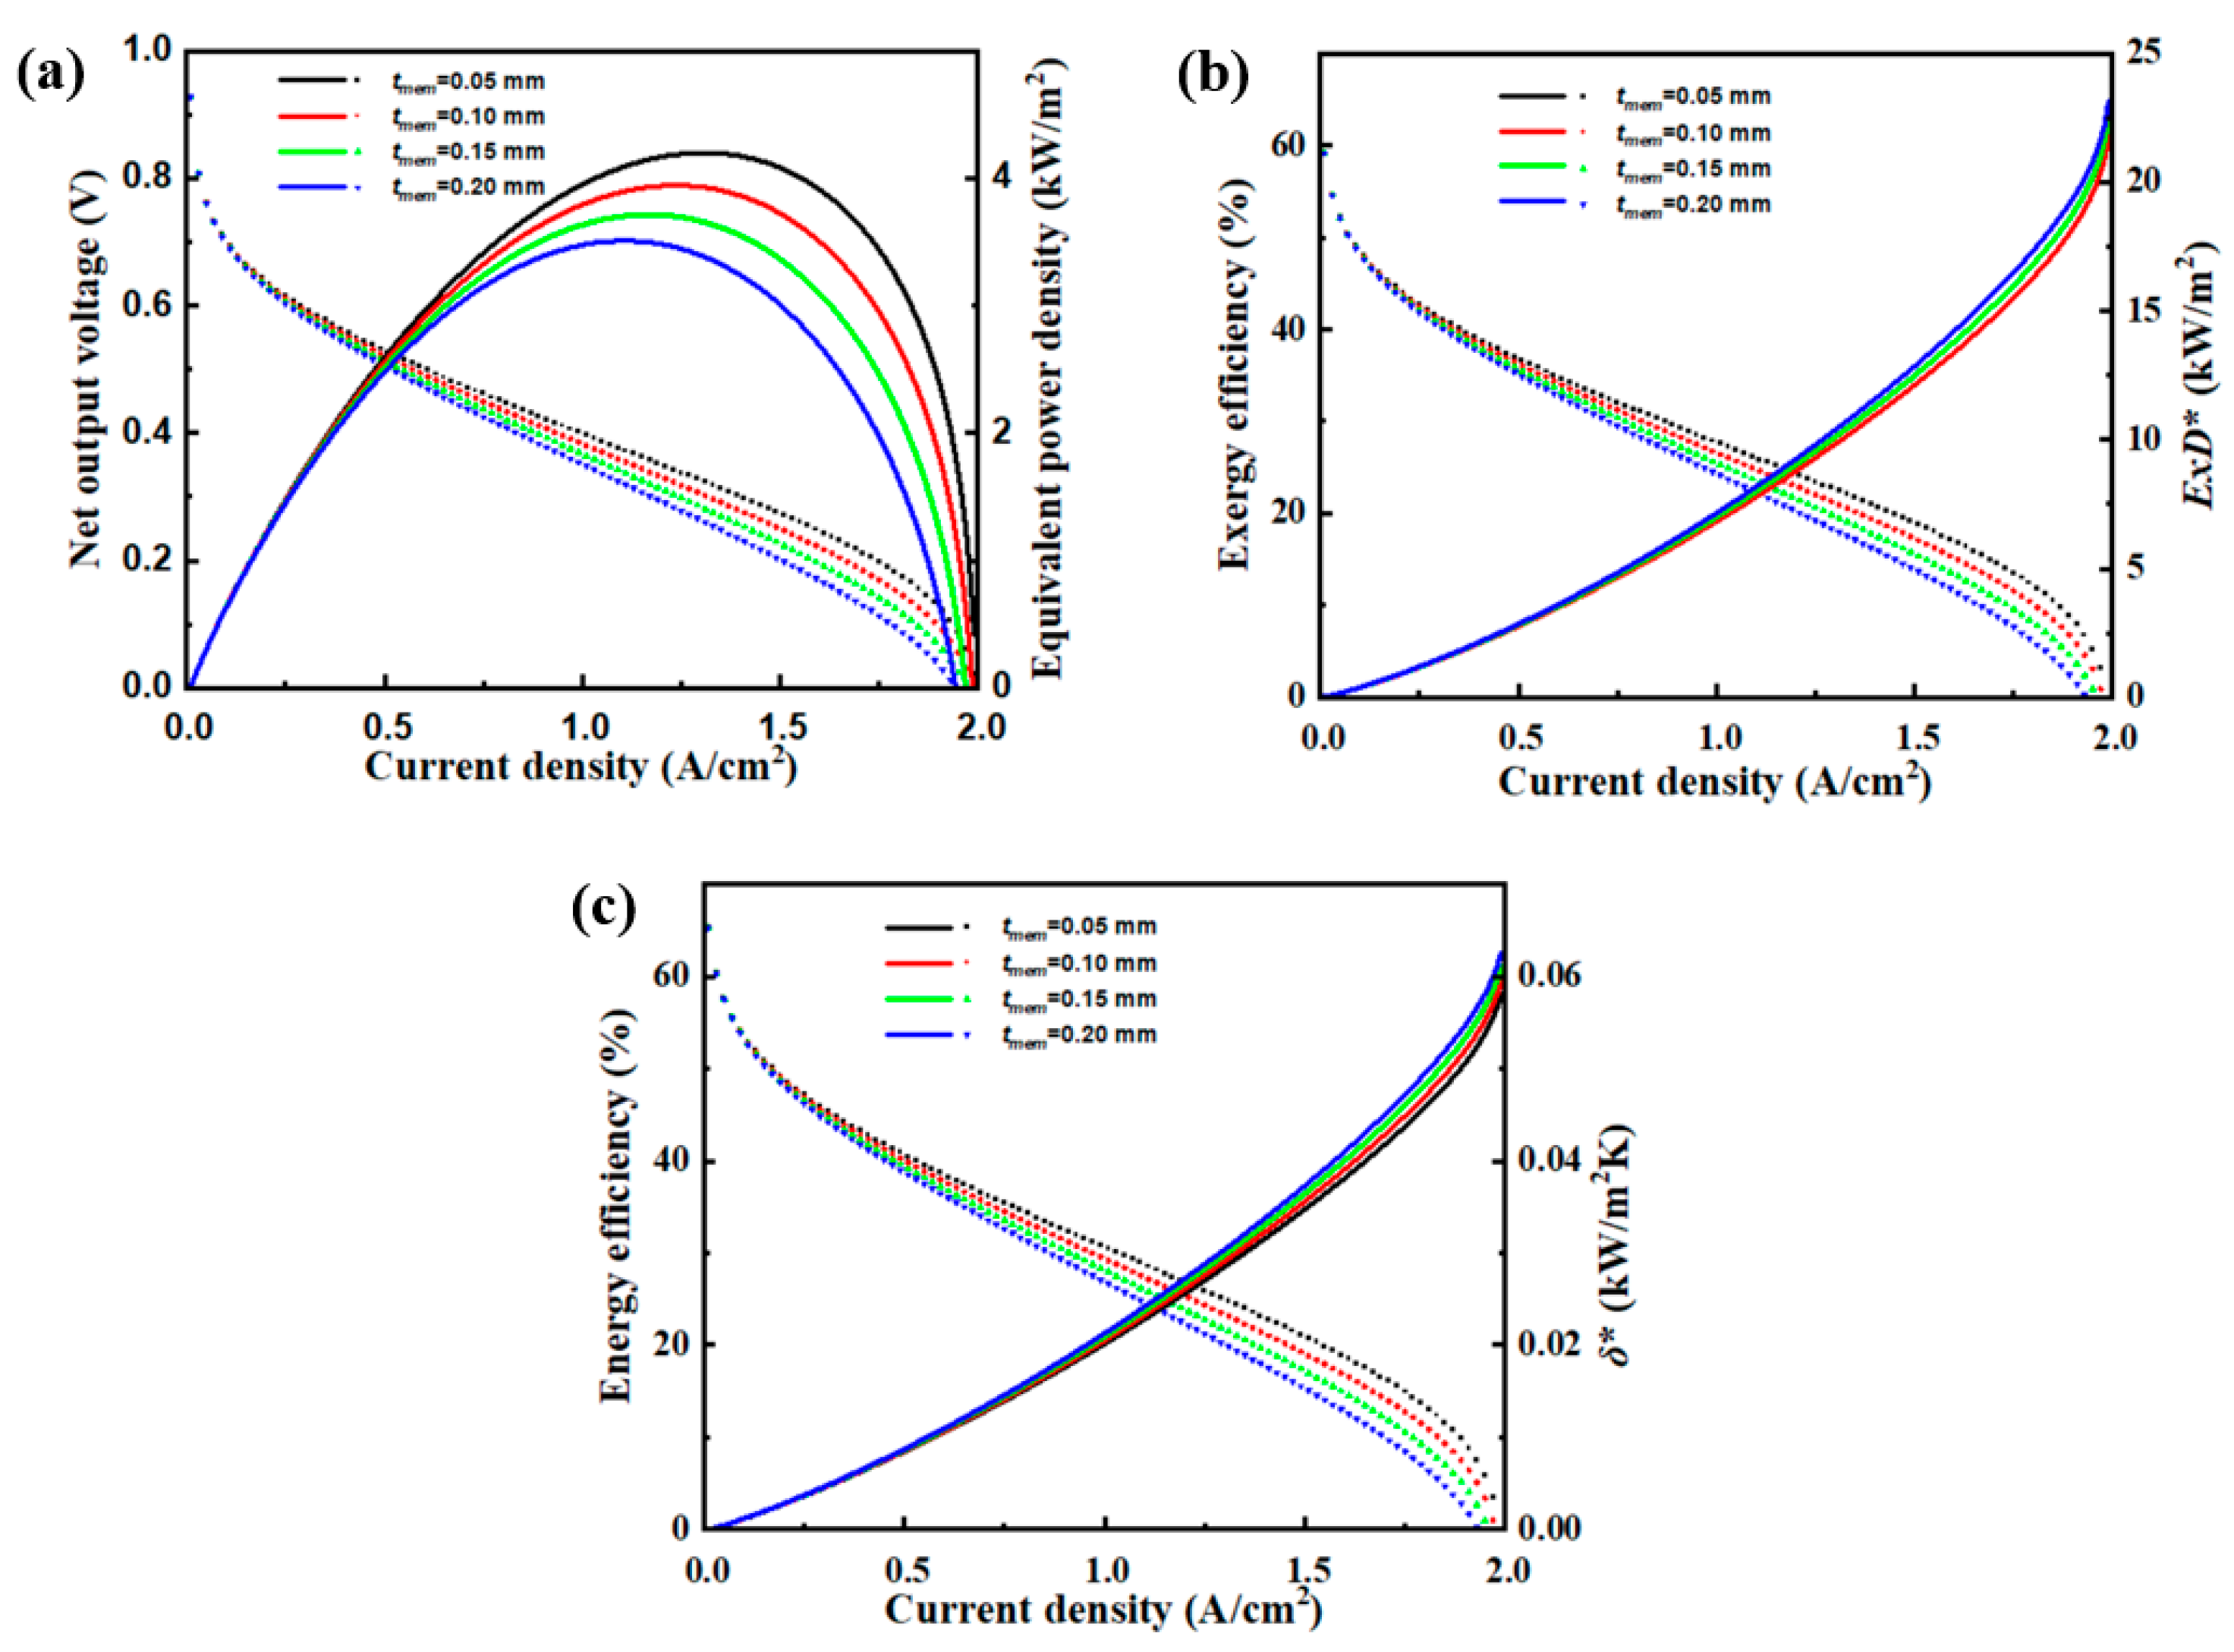
Membrane thickness (tmem) directly affects Eohm and U, with a slimmer tmem enhancing proton permeability and U values based on Equations (14) and (20). It is evident that as membrane thickness decreases, equivalent power density and efficiency both increase accordingly. The primary factor behind this alteration is the membrane’s thinning, which reduces the ion path length between the anode and cathode, resulting in a reduction in the ohmic overpotential of the HT-PEMFC. In detail, Figure 11a shows that as tmem ranges from 0.005 to 0.02 cm, P*b values decrease, with a 0.8% performance boost at 0.005 cm compared to BC-1. P*p values similarly decrease, seeing a 6.51% enhancement at 0.005 cm relative to BC-2. In Figure 11b, decreasing tmem to 0.005 cm results in φb and φp values boosting by 2.62% and 0.85%, respectively, compared to their baselines. ExD* values increase with tmem decreases. Figure 11c indicates that as tmem decreases, ηb and ηp values ascend, with improvements of 2.59% and 0.81% at 0.005 cm compared to BC-1 and BC-2, respectively. Concurrently, the maximum * values slightly increase. It is vital to choose the thinnest tmem under the premise of considering proton conductivity and durability during the design phase.
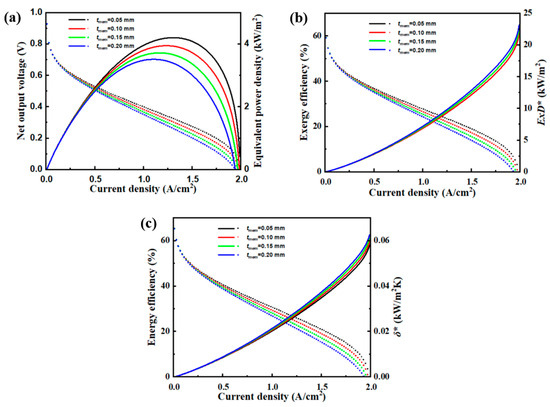
Figure 11.
Changes in (a) U and , (b) and , and (c) and across various membrane thickness and current densities.
5. Optimization Analysis
In this section, the HT-PEMFC is optimized using the NSGA-II method for multi-objective purposes. The Pareto solution reveals an equilibrium among power density, energy efficiency, and exergy efficiency. Notably, all optimal solutions are represented on the Pareto surface, derived by weighting these three objectives.
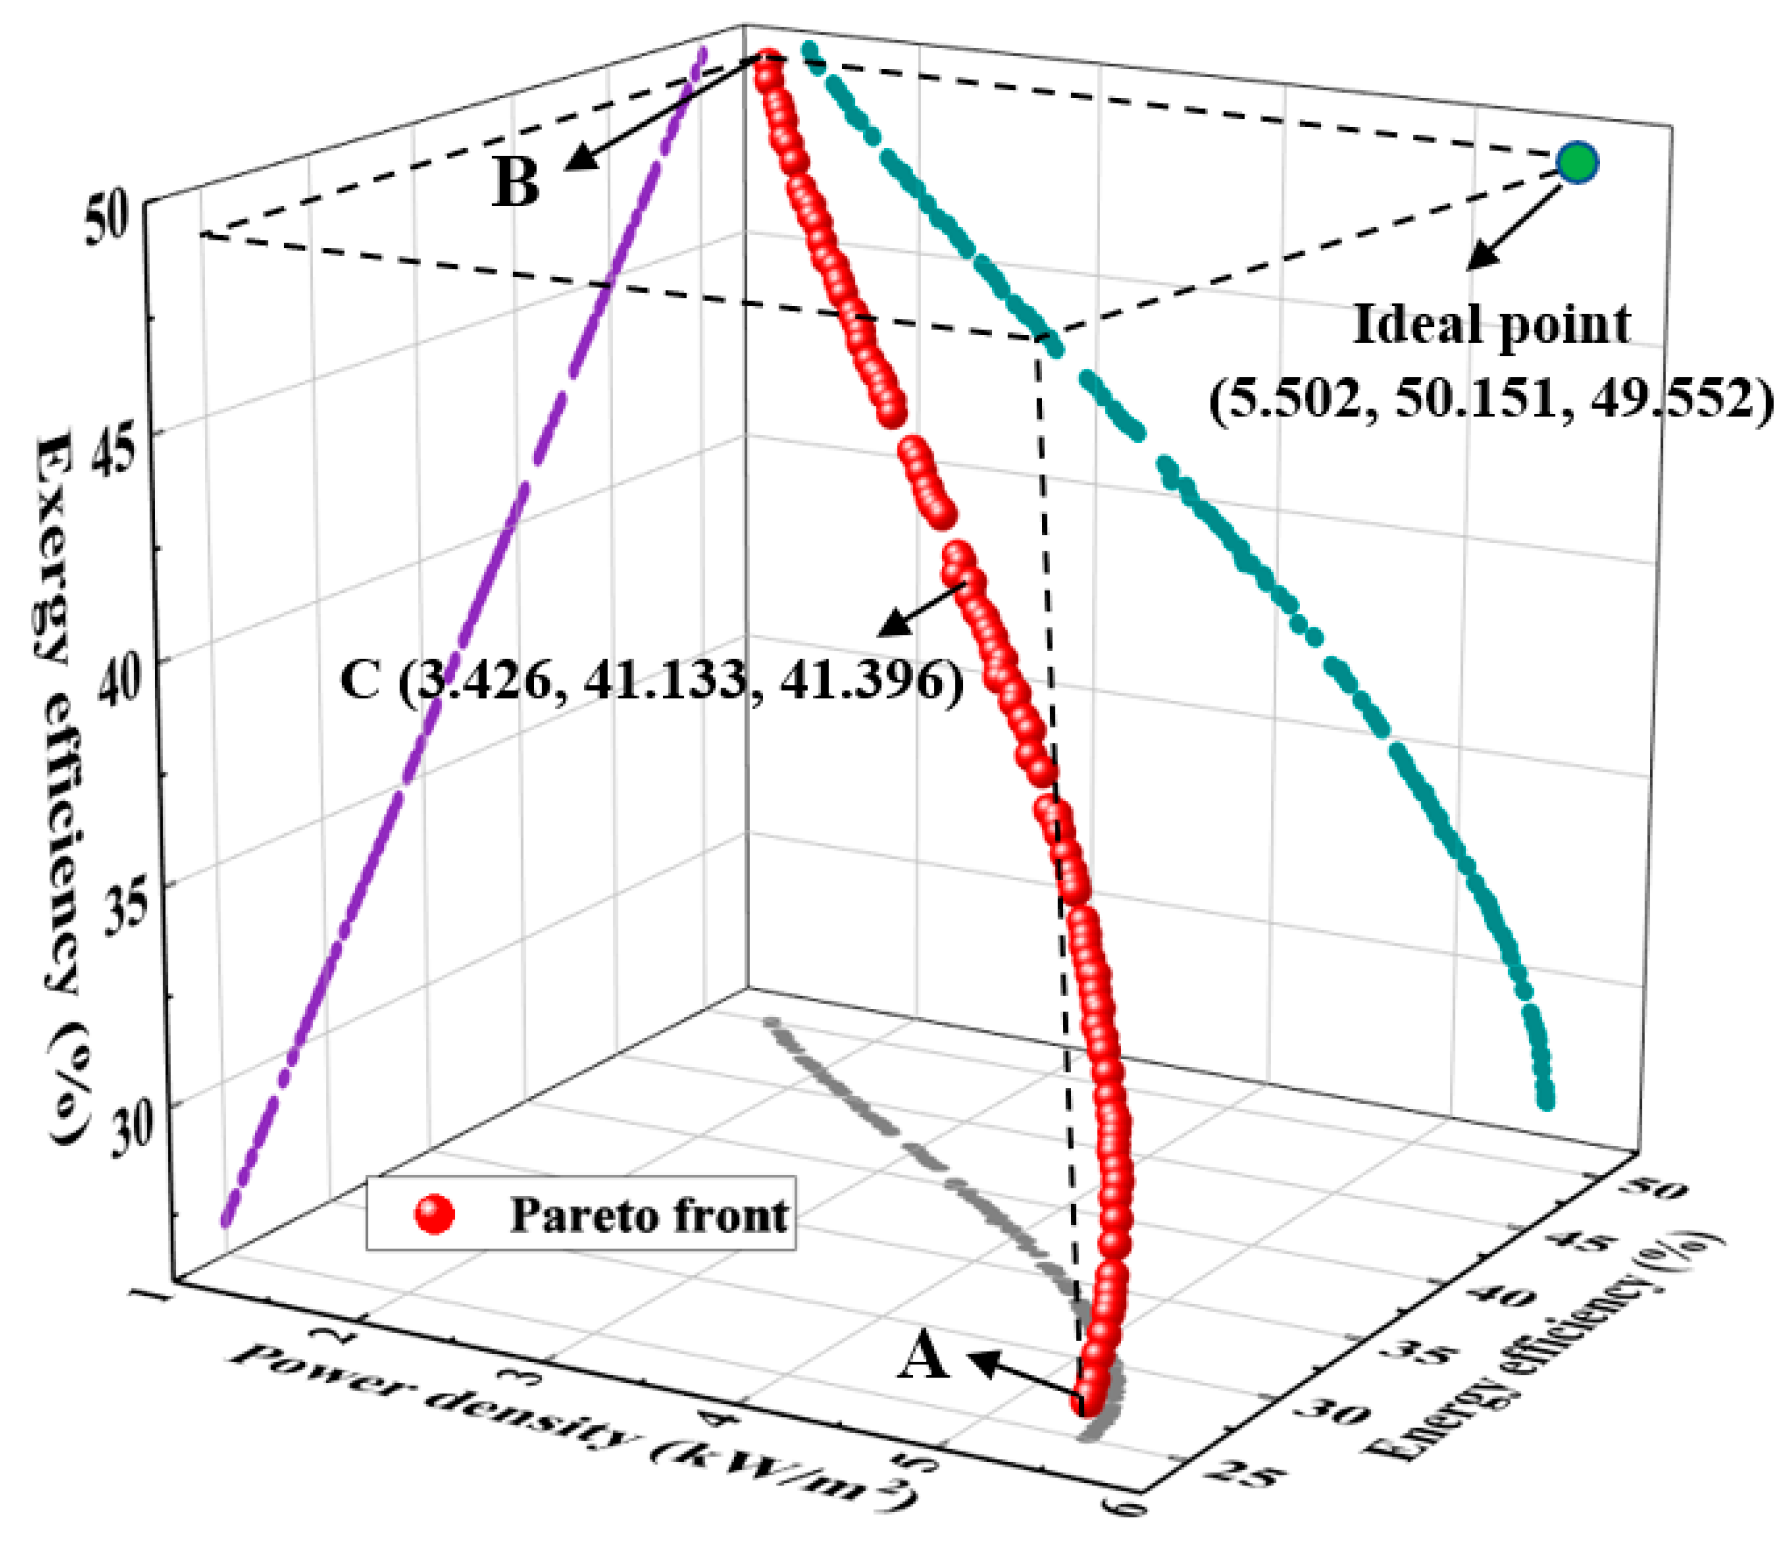
Figure 12 demonstrates the Pareto surface used to identify the optimal solution. At Point A, while the equivalent power density peaks at 5.50 kW/m2, energy and exergy efficiency are minimized at 25.03% and 26.88%. Conversely, Point B prioritizes energy and exergy efficiency at 50.15% and 49.55% but sees a marked dip in power density to 1.38 kW/m2. Point C, being nearest to the ideal point, emerges as the optimal choice, registering values of 3.42 kW/m2, 41.13%, and 41.30% for power density, energy, and exergy efficiencies, respectively. Fluctuations around Point C have minimal impact on the evaluation indicators.

Figure 12.
Distribution of Pareto-Optimal solutions.
Figure 13 depicts the optimization of HT-PEMFC parameters, highlighting the distribution of different parameters. As presented in Figure 13a, the optimal range for the operating current density lies between 0.2–1.4 A/cm2. This result could be attributed to the optimization process involving uniform varying of the weights for the three objectives. Therefore, the derived solutions represent the optimal trade-off among the objectives. As depicted in Figure 13b, the preponderance of optimal operating temperature values is approximately 447.91K. The optimal operating pressure, as shown in Figure 13c, is uniformly distributed between 2.3 and 3 atm. In addition, as illustrated in Figure 13d, the optimal membrane thickness is predominantly around 0.0070 cm, whereas the optimal DL is mostly around 7.95, as depicted in Figure 13e.
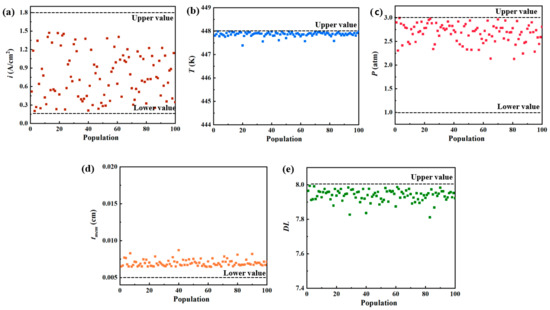
Figure 13.
Population distributions of the HT-PEMFC (a) operating current density, (b) operating temperature, (c) operating pressure, (d) membrane thickness, (e) doping level.
Table 5 compares optimization outcomes, encompassing design and operating parameters, along with performance indicators of the HT-PEMFC at points A, B, C, BC-1, and BC-2. By employing parameters associated with Point A, the equivalent power density rose by 87.71% in comparison to BC-1. Meanwhile, Point B stands out as the best solution for energy and exergy efficiency. Point C is identified as the ultimate optimal point, exhibiting commendable performance across all assessment criteria. By adopting the operating parameters of Point C, there was a 17.72% rise in equivalent power density, a 21.11% enhancement in energy efficiency, and a 10.37% boost in exergy efficiency relative to BC-1. These findings indicate that employing the NSGA-II algorithm for optimization leads to diverse enhancements in the efficiency of the HT-PEMFC and equivalent power density at the ultimate optimal point, balancing between power density and efficiency.
Table 5.
Comparisons of the optimization results.
6. Conclusions
In this research, a zero-dimensional, isothermal steady-state model was employed to probe the thermodynamic and electrochemical attributes of the HT-PEMFC. The multi-objective optimization strategy was proven effective in the trade-off of the optimizing process between power and efficiency. This methodology can be helpful during cell and system designing to optimize cell dimensions and operation parameters. Initially, the accuracy of the established model was validated using two mathematical statistical techniques. Subsequently, two primary cases were given based on the model results, namely BC-1 and BC-2. After evaluating their performances, BC-1 was ultimately chosen as the baseline case. After conducting parameter studies, it was established that the performance of HT-PEMFC is primarily affected by factors such as operating temperature, membrane thickness, and doping level. In contrast, variations in operating pressure were observed to have minimal influence on improving the performance of HT-PEMFC. Lastly, the NSGA-II approach was employed to optimize power and efficiency. The optimization results show that the optimal point significantly increased the power density by 17.72%, the energy efficiency by 21.11%, and the exergy efficiency by 10.37% compared with BC-1.
Author Contributions
Conceptualization, Z.Z. and S.S.A.; methodology, Z.Z., V.L. and S.S.A.; software, all; validation, all; formal analysis, Z.Z., V.L. and S.S.A.; investigation, all; resources, S.S.A.; data curation, Z.Z. and J.Z.; writing—original draft preparation, Z.Z., V.L. and S.S.A.; writing—review and editing, all; visualization, Z.Z. and J.Z.; supervision, V.L. and S.S.A.; project administration, V.L. and S.S.A.; funding acquisition, S.S.A. All authors have read and agreed to the published version of the manuscript.
Funding
This research was funded by the China Scholarship Council (grant number 202008440490) and the Danish Energy Technology Development and Demonstration Program (EUDP) through the MFC MultiGen project (grant number 64020-2073), and the BlueDolphin project (grant number 64021-2065).
Data Availability Statement
Data employed in this study are from existing literature, with all references comprehensively cataloged in the references list.
Conflicts of Interest
The authors declare no conflict of interest.
Abbreviations
In this manuscript, the following abbreviations are used:
| root-mean-square error | |
| R2 | R-squared |
| reversible potential (V) | |
| net output voltage (V) | |
| molar entropy change (J mol−1K−1) | |
| p | partial pressure (atm) |
| molar fraction | |
| T | operating temperature (K) |
| operating current density (A cm−2) | |
| membrane thickness (cm) | |
| A0 | pre-exponential coefficient |
| activation energy (J mol−1) | |
| A | effective working area (m2) |
| limiting current density (A cm−2) | |
| power output (kW m−2) | |
| molar enthalpy change (J mol−1) | |
| standard molar enthalpy (J mol−1) | |
| equivalent internal resistant (Ω) | |
| standard molar entropy ((J mol−1 K−1) | |
| Greek symbols | |
| δ | entropy production (kJ K−1) |
| charge transfer coefficient | |
| proton conductivity of the membrane (S m−1) | |
| Subscripts and superscripts | |
| rev | reversible |
| act | activation |
| ohm | ohmic |
| con | concentration |
| * | unit area |
| · | unit time |
| an | anode |
| cat | cathode |
| e | electron |
| I | internal resistance |
| 0 | environmental condition |
References
- Al-Tememy, M.G.H.; Devrim, Y. Development of effective bimetallic catalyst for high-temperature PEM fuel cell to improve CO tolerance. Int. J. Energy Res. 2021, 45, 3343–3357. [Google Scholar] [CrossRef]
- Alegre, C.; Alvarez-Manuel, L.; Mustata, R.; Valiño, L.; Lozano, A.; Barreras, F. Assessment of the durability of low-cost Al bipolar plates for High Temperature PEM fuel cells. Int. J. Hydrogen Energy 2019, 44, 12748–12759. [Google Scholar] [CrossRef]
- Nalbant, Y.; Colpan, C.O.; Devrim, Y. Energy and exergy performance assessments of a high temperature-proton exchange membrane fuel cell based integrated cogeneration system. Int. J. Hydrogen Energy 2020, 45, 3584–3594. [Google Scholar] [CrossRef]
- Saeedan, M.; Afshari, E.; Ziaei-Rad, M. Modeling and optimization of turbulent flow through PEM fuel cell cooling channels filled with metal foam-a comparison of water and air cooling systems. Energy Convers. Manag. 2022, 258, 115486. [Google Scholar] [CrossRef]
- Wu, W.; Zhai, C.; Sui, Y.; Zhang, H. A novel distributed energy system using high-temperature proton exchange membrane fuel cell integrated with hybrid-energy heat pump. Energy Convers. Manag. 2021, 235, 113990. [Google Scholar] [CrossRef]
- Guo, H.; Li, Z.; Sun, P.; Pei, H.; Zhang, L.; Cui, W.; Yin, X.; Hui, H. Enhancing proton conductivity and durability of crosslinked PBI-Based high-temperature PEM: Effectively doping a novel cerium triphosphonic-isocyanurate. J. Electrochem. Soc. 2021, 168, 024510. [Google Scholar] [CrossRef]
- Lv, B.; Geng, K.; Yin, H.; Yang, C.; Hao, J.; Luan, Z.; Huang, Z.; Qin, X.; Song, W.; Li, N. Polybenzimidazole/cerium dioxide/graphitic carbon nitride nanosheets for high performance and durable high temperature proton exchange membranes. J. Membr. Sci. 2021, 639, 119760. [Google Scholar] [CrossRef]
- Bai, H.; Peng, H.; Xiang, Y.; Zhang, J.; Wang, H.; Lu, S.; Zhuang, L. Poly (arylene piperidine) s with phosphoric acid doping as high temperature polymer electrolyte membrane for durable, high-performance fuel cells. J. Power Sources 2019, 443, 227219. [Google Scholar] [CrossRef]
- Nikiforov, A.; Petrushina, I.; Christensen, E.; Tomás-García, A.; Bjerrum, N. Corrosion behaviour of construction materials for high temperature steam electrolysers. Int. J. Hydrogen Energy 2011, 36, 111–119. [Google Scholar] [CrossRef]
- Kannan, A.; Kabza, A.; Scholta, J. Long term testing of start–stop cycles on high temperature PEM fuel cell stack. J. Power Sources 2015, 277, 312–316. [Google Scholar] [CrossRef]
- Yan, W.-M.; Chen, C.-Y.; Liang, C.-H. Comparison of performance degradation of high temperature PEM fuel cells with different bipolar plates. Energy 2019, 186, 115836. [Google Scholar] [CrossRef]
- Zhang, C.; Zhou, W.; Ehteshami, M.M.; Wang, Y.; Chan, S.H. Determination of the optimal operating temperature range for high temperature PEM fuel cell considering its performance, CO tolerance and degradation. Energy Convers. Manag. 2015, 105, 433–441. [Google Scholar] [CrossRef]
- Kerr, R.; García, H.; Rastedt, M.; Wagner, P.; Alfaro, S.; Romero, M.; Terkelsen, C.; Steenberg, T.; Hjuler, H. Lifetime and degradation of high temperature PEM membrane electrode assemblies. Int. J. Hydrogen Energy 2015, 40, 16860–16866. [Google Scholar] [CrossRef]
- Barati, S.; Mehdipourghazi, M.; Abdollahi, M.; Hooshyari, K.; Khoshandam, B. Preparation, characterization and proton transport of new porous nanocomposite membranes based on polybenzimidazole, lignin and TiO2 nanoparticles for high temperature PEM fuel cells. Int. J. Energy Res. 2021, 45, 20057–20072. [Google Scholar] [CrossRef]
- Subianto, S. Recent advances in polybenzimidazole/phosphoric acid membranes for high-temperature fuel cells. Polym. Int. 2014, 63, 1134–1144. [Google Scholar] [CrossRef]
- Chandan, A.; Hattenberger, M.; El-Kharouf, A.; Du, S.; Dhir, A.; Self, V.; Pollet, B.G.; Ingram, A.; Bujalski, W. High temperature (HT) polymer electrolyte membrane fuel cells (PEMFC)–A review. J. Power Sources 2013, 231, 264–278. [Google Scholar] [CrossRef]
- Du, B.; Guo, Q.; Pollard, R.; Rodriguez, D.; Smith, C.; Elter, J. PEM fuel cells: Status and challenges for commercial stationary power applications. JOM 2006, 58, 45–49. [Google Scholar] [CrossRef]
- Dimitrova, Z.; Nader, W.B. PEM fuel cell as an auxiliary power unit for range extended hybrid electric vehicles. Energy 2022, 239, 121933. [Google Scholar] [CrossRef]
- Li, Y.; Li, D.; Ma, Z.; Zheng, M.; Lu, Z.; Song, H.; Guo, X.; Shao, W. Performance analysis and optimization of a novel vehicular power system based on HT-PEMFC integrated methanol steam reforming and ORC. Energy 2022, 257, 124729. [Google Scholar] [CrossRef]
- Yang, Y.; Zhang, H.; Yan, P.; Jermsittiparsert, K. Multi-objective optimization for efficient modeling and improvement of the high temperature PEM fuel cell based Micro-CHP system. Int. J. Hydrogen Energy 2020, 45, 6970–6981. [Google Scholar] [CrossRef]
- Mamaghani, A.H.; Najafi, B.; Casalegno, A.; Rinaldi, F. Optimization of an HT-PEM fuel cell based residential micro combined heat and power system: A multi-objective approach. J. Clean. Prod. 2018, 180, 126–138. [Google Scholar] [CrossRef]
- Sarabchi, N.; Mahmoudi, S.S.; Yari, M.; Farzi, A. Exergoeconomic analysis and optimization of a novel hybrid cogeneration system: High-temperature proton exchange membrane fuel cell/Kalina cycle, driven by solar energy. Energy Convers. Manag. 2019, 190, 14–33. [Google Scholar] [CrossRef]
- Guo, X.; Zhang, H.; Yuan, J.; Wang, J.; Zhao, J.; Wang, F.; Miao, H.; Hou, S. Energetic and exergetic analyses of a combined system consisting of a high-temperature polymer electrolyte membrane fuel cell and a thermoelectric generator with Thomson effect. Int. J. Hydrogen Energy 2019, 44, 16918–16932. [Google Scholar] [CrossRef]
- Ye, L.; Jiao, K.; Du, Q.; Yin, Y. Exergy analysis of high-temperature proton exchange membrane fuel cell systems. Int. J. Green Energy 2015, 12, 917–929. [Google Scholar] [CrossRef]
- Guo, X.; Zhang, H. Performance analyses of a combined system consisting of high-temperature polymer electrolyte membrane fuel cells and thermally regenerative electrochemical cycles. Energy 2020, 193, 116720. [Google Scholar] [CrossRef]
- Araya, S.S.; Zhou, F.; Liso, V.; Sahlin, S.L.; Vang, J.R.; Thomas, S.; Gao, X.; Jeppesen, C.; Kær, S.K. A comprehensive review of PBI-based high temperature PEM fuel cells. Int. J. Hydrogen Energy 2016, 41, 21310–21344. [Google Scholar] [CrossRef]
- Li, D.; Li, S.; Ma, Z.; Xu, B.; Lu, Z.; Li, Y.; Zheng, M. Ecological performance optimization of a high temperature proton exchange membrane fuel cell. Mathematics 2021, 9, 1332. [Google Scholar] [CrossRef]
- Li, D.; Li, Y.; Ma, Z.; Zheng, M.; Lu, Z. Exergetic performance coefficient analysis and optimization of a high-temperature proton exchange membrane fuel cell. Membranes 2022, 12, 70. [Google Scholar] [CrossRef]
- Bayat, M.; Özalp, M.; Gürbüz, H. Comprehensive performance analysis of a high-temperature PEM fuel cell under different operating and design conditions. Sustain. Energy Technol. Assess. 2022, 52, 102232. [Google Scholar] [CrossRef]
- Guo, Y.; Guo, X.; Zhang, H.; Hou, S. Energetic, exergetic and ecological analyses of a high-temperature proton exchange membrane fuel cell based on a phosphoric-acid-doped polybenzimidazole membrane. Sustain. Energy Technol. Assess. 2020, 38, 100671. [Google Scholar] [CrossRef]
- Xia, L.; Zhang, C.; Hu, M.; Jiang, S.; Chin, C.S.; Gao, Z.; Liao, Q. Investigation of parameter effects on the performance of high-temperature PEM fuel cell. Int. J. Hydrogen Energy 2018, 43, 23441–23449. [Google Scholar] [CrossRef]
- Nalbant, Y.; Colpan, C.O.; Devrim, Y. Development of a one-dimensional and semi-empirical model for a high temperature proton exchange membrane fuel cell. Int. J. Hydrogen Energy 2018, 43, 5939–5950. [Google Scholar] [CrossRef]
- Haghighi, M.; Sharifhassan, F. Exergy analysis and optimization of a high temperature proton exchange membrane fuel cell using genetic algorithm. Case Stud. Therm. Eng. 2016, 8, 207–217. [Google Scholar] [CrossRef]
- Li, H.; Xu, B.; Lu, G.; Du, C.; Huang, N. Multi-objective optimization of PEM fuel cell by coupled significant variables recognition, surrogate models and a multi-objective genetic algorithm. Energy Convers. Manag. 2021, 236, 114063. [Google Scholar] [CrossRef]
- Zamora, H.; Plaza, J.; Cañizares, P.; Lobato, J.; Rodrigo, M.A. Improved electrodes for high temperature proton exchange membrane fuel cells using carbon nanospheres. ChemSusChem 2016, 9, 1187–1193. [Google Scholar] [CrossRef] [PubMed]
- Jiao, K.; Li, X. A Three-Dimensional Non-isothermal Model of High Temperature Proton Exchange Membrane Fuel Cells with Phosphoric Acid Doped Polybenzimidazole Membranes. Fuel Cells 2010, 10, 351–362. [Google Scholar] [CrossRef]
- Li, Q.; Aili, D.; Hjuler, H.A.; Jensen, J.O. High Temperature Polymer Electrolyte Membrane Fuel Cells; Springer: Cham/Heidelberg, Germany; New York, NY, USA; Dordrecht, The Netherlands; London, UK, 2016; Volume 545. [Google Scholar]
- Yuan, H.; Dai, Y.; Li, H.; Wang, Y. Modeling of high-temperature polymer electrolyte membrane fuel cell for reaction spatial variation. Int. J. Heat Mass Transf. 2022, 195, 123209. [Google Scholar] [CrossRef]
- Guo, X.; Zhang, H.; Zhao, J.; Wang, F.; Wang, J.; Miao, H.; Yuan, J. Performance evaluation of an integrated high-temperature proton exchange membrane fuel cell and absorption cycle system for power and heating/cooling cogeneration. Energy Convers. Manag. 2019, 181, 292–301. [Google Scholar] [CrossRef]
- Olapade, P.O.; Meyers, J.P.; Borup, R.L.; Mukundan, R. Parametric study of the morphological proprieties of HT-PEMFC components for effective membrane hydration. J. Electrochem. Soc. 2011, 158, B639. [Google Scholar] [CrossRef]
- Najafi, B.; Mamaghani, A.H.; Baricci, A.; Rinaldi, F.; Casalegno, A. Mathematical modelling and parametric study on a 30 kWel high temperature PEM fuel cell based residential micro cogeneration plant. Int. J. Hydrogen Energy 2015, 40, 1569–1583. [Google Scholar] [CrossRef]
- Zhang, H.; Lin, G.; Chen, J. Multi-objective optimisation analysis and load matching of a phosphoric acid fuel cell system. Int. J. Hydrogen Energy 2012, 37, 3438–3446. [Google Scholar] [CrossRef]
- Arshad, A.; Ali, H.M.; Habib, A.; Bashir, M.A.; Jabbal, M.; Yan, Y. Energy and exergy analysis of fuel cells: A review. Therm. Sci. Eng. Prog. 2019, 9, 308–321. [Google Scholar] [CrossRef]
- Szargut, J. Exergy Method: Technical and Ecological Applications; WIT Press: Southampton, UK, 2005. [Google Scholar]
- Zhang, X.; Chen, X.; Lin, B.; Chen, J. Maximum equivalent efficiency and power output of a PEM fuel cell/refrigeration cycle hybrid system. Int. J. Hydrogen Energy 2011, 36, 2190–2196. [Google Scholar] [CrossRef]
- Zhang, X.; Cai, L.; Liao, T.; Zhou, Y.; Zhao, Y.; Chen, J. Exploiting the waste heat from an alkaline fuel cell via electrochemical cycles. Energy 2018, 142, 983–990. [Google Scholar] [CrossRef]
- Wu, Z.; Zhu, P.; Yao, J.; Tan, P.; Xu, H.; Chen, B.; Yang, F.; Zhang, Z.; Ni, M. Thermo-economic modeling and analysis of an NG-fueled SOFC-WGS-TSA-PEMFC hybrid energy conversion system for stationary electricity power generation. Energy 2020, 192, 116613. [Google Scholar] [CrossRef]
- Nguyen, H.Q.; Aris, A.M.; Shabani, B. PEM fuel cell heat recovery for preheating inlet air in standalone solar-hydrogen systems for telecommunication applications: An exergy analysis. Int. J. Hydrogen Energy 2016, 41, 2987–3003. [Google Scholar] [CrossRef]
- Seifert, U. Entropy production along a stochastic trajectory and an integral fluctuation theorem. Phys. Rev. Lett. 2005, 95, 040602. [Google Scholar] [CrossRef]
- Cohce, M.; Dincer, I.; Rosen, M. Energy and exergy analyses of a biomass-based hydrogen production system. Bioresour. Technol. 2011, 102, 8466–8474. [Google Scholar] [CrossRef]
- Chen, Z.; Zuo, W.; Zhou, K.; Li, Q.; Huang, Y.; Jiaqiang, E. Multi-objective optimization of proton exchange membrane fuel cells by RSM and NSGA-II. Energy Convers. Manag. 2023, 277, 116691. [Google Scholar] [CrossRef]
- Zhao, J.; Cai, S.; Huang, X.; Luo, X.; Tu, Z. 4E analysis and multiobjective optimization of a PEMFC-based CCHP system with dehumidification. Energy Convers. Manag. 2021, 248, 114789. [Google Scholar] [CrossRef]
- Sousa, T.; Mamlouk, M.; Scott, K. An isothermal model of a laboratory intermediate temperature fuel cell using PBI doped phosphoric acid membranes. Chem. Eng. Sci. 2010, 65, 2513–2530. [Google Scholar] [CrossRef]
- Üregen, N.; Pehlivanoğlu, K.; Özdemir, Y.; Devrim, Y. Development of polybenzimidazole/graphene oxide composite membranes for high temperature PEM fuel cells. Int. J. Hydrogen Energy 2017, 42, 2636–2647. [Google Scholar] [CrossRef]
- Ubong, E.; Shi, Z.; Wang, X. Three-dimensional modeling and experimental study of a high temperature PBI-based PEM fuel cell. J. Electrochem. Soc. 2009, 156, B1276. [Google Scholar] [CrossRef]
- Barnston, A. Correspondence among the Correlation [root mean square error] and Heidke Verifcation Measures; Refinement Heidke Score. Cover. Weather. Forecast. Weather. Forecast. 1992, 7, 699–709. [Google Scholar] [CrossRef]
- Han, I.-S.; Chung, C.-B. Performance prediction and analysis of a PEM fuel cell operating on pure oxygen using data-driven models: A comparison of artificial neural network and support vector machine. Int. J. Hydrogen Energy 2016, 41, 10202–10211. [Google Scholar] [CrossRef]
- Leader, J.; Yue, Y.; Walluk, M.; Trabold, T. Voltage degradation of high-temperature PEM fuel cells operating at 200° C under constant load and start-stop conditions. Int. J. Hydrogen Energy 2022, 47, 18820–18830. [Google Scholar] [CrossRef]
- Thomas, S.; Jeppesen, C.; Steenberg, T.; Araya, S.S.; Vang, J.R.; Kær, S.K. New load cycling strategy for enhanced durability of high temperature proton exchange membrane fuel cell. Int. J. Hydrogen Energy 2017, 42, 27230–27240. [Google Scholar] [CrossRef]
- Hwa, S. Energy-and exergy-based working fluid selection and performance analysis of a high-temperature PEMFC-based micro-CCHP system. Appl. Energy 2017, 204, 446–458. [Google Scholar]
- Tseng, C.-J.; Heush, Y.-J.; Chiang, C.-J.; Lee, Y.-H.; Lee, K.-R. Application of metal foams to high temperature PEM fuel cells. Int. J. Hydrogen Energy 2016, 41, 16196–16204. [Google Scholar] [CrossRef]
- Rosli, R.; Sulong, A.; Daud, W.; Zulkifley, M.; Husaini, T.; Rosli, M.; Majlan, E.; Haque, M. A review of high-temperature proton exchange membrane fuel cell (HT-PEMFC) system. Int. J. Hydrogen Energy 2017, 42, 9293–9314. [Google Scholar] [CrossRef]
- Saidi, H.; Uthman, H. Phosphoric acid doped polymer electrolyte membrane based on radiation grafted poly (1-vinylimidazole-co-1-vinyl-2-pyrrolidone)-g-poly (ethylene/tetrafluoroethylene) copolymer and investigation of grafting kinetics. Int. J. Hydrogen Energy 2017, 42, 9315–9332. [Google Scholar] [CrossRef]
- Han, S.; Jeong, Y.H.; Jung, J.H.; Begley, A.; Choi, E.; Yoo, S.J.; Jang, J.H.; Kim, H.-J.; Nam, S.W.; Kim, J.Y. Spectrophotometric analysis of phosphoric acid leakage in high-temperature phosphoric acid-doped polybenzimidazole membrane fuel cell application. J. Sens. 2016, 2016, 5290510. [Google Scholar] [CrossRef]
- Ribeirinha, P.; Abdollahzadeh, M.; Pereira, A.; Relvas, F.; Boaventura, M.; Mendes, A. High temperature PEM fuel cell integrated with a cellular membrane methanol steam reformer: Experimental and modelling. Appl. Energy 2018, 215, 659–669. [Google Scholar] [CrossRef]


Disclaimer/Publisher’s Note: The statements, opinions and data contained in all publications are solely those of the individual author(s) and contributor(s) and not of MDPI and/or the editor(s). MDPI and/or the editor(s) disclaim responsibility for any injury to people or property resulting from any ideas, methods, instructions or products referred to in the content. |
© 2023 by the authors. Licensee MDPI, Basel, Switzerland. This article is an open access article distributed under the terms and conditions of the Creative Commons Attribution (CC BY) license (https://creativecommons.org/licenses/by/4.0/).