Article

Experimental Study of an Air-Conditioning System in an Electric Vehicle with R1234yf

1
School of Mechanical Engineering, Pusan National University, Busan 46241, Republic of Korea
2
R&D Division, KORENS, Yangsan 50591, Republic of Korea
3
Department of Automotive Engineering, Gangneung-Wonju National University, Wonju 26403, Republic of Korea
4
School of Convergence Science, Pusan National University, Busan 46241, Republic of Korea
*
Authors to whom correspondence should be addressed.
Energies 2023, 16(24), 8017; https://doi.org/10.3390/en16248017
Submission received: 28 October 2023 / Revised: 27 November 2023 / Accepted: 29 November 2023 / Published: 12 December 2023
(This article belongs to the Section E: Electric Vehicles)

Abstract

:
R134a, a vehicle refrigerant used in the vehicle heat pump system, is regulated according to the Montreal Protocol. Refrigerants such as R1234yf, R744, and R290 in vehicle heat pump systems are being investigated to identify their alternatives. Because developing a new system exclusively for new refrigerants is costly, an empirical test was conducted on the R1234yf refrigerant in a heat pump system designed for the R134a refrigerant in an actual vehicle system. The heating, cooling, and battery-cooling modes were tested for the amount of refrigerant charge, and operability tests were conducted for the compressor load; heating, ventilation, air conditioning (HVAC) air flow rate; coolant temperature; and flow rate of each mode. The optimal refrigerant charge in heating mode was 0.7 kg, and the optimal refrigerant charge in the cooling and battery-cooling modes was 0.9 kg. To yield the highest coefficient of performance of the system, the compressor load was 50%, the HVAC fan was 12 V, and the coolant flow rate was 10 LPM. The most efficient system operation was possible at a coolant temperature of 30 °C in the cooling and heating modes and at 20 °C in battery-cooling mode.

1. Introduction

The Kigali Amendment to the Montreal Protocol [1], currently in effect, constitutes regulations for hydrofluorocarbons worldwide. R134a, used as a refrigerant for vehicle air conditioners, is now subject to regulation. Accordingly, studies on the use of low-global-warming-point (GWP) refrigerants, some of which are commercialized and are not regulated, are ongoing. According to the 2050 carbon neutrality milestone proposed by the International Energy Agency [2], the sales of internal combustion engine vehicles are scheduled to cease in 2035. Therefore, the ownership of electric vehicles is expected to gradually increase. However, the use of electric heaters in the heating and cooling system of electric vehicles considerably reduces the driving performance of the electric vehicle [3]. Heat pump systems for electric vehicles are being widely applied to build integrated thermal management systems to improve driving performance. Vaghela [4] constructed a theoretical model of a vehicle air-conditioning system and analyzed the pressure ratio, discharge temperature, compressor work, and coefficient of performance (COP) based on the physical properties of R134a and its alternative refrigerants. Results of the analysis reveal that when R1234yf is applied, the COP is 6.3% lower than that of R134a. However, because it is most similar to R134a, the Specific Compressor Displacement can be used with minimal system modification. Dai et al. [5,6,7] constructed a simulation model for a vehicle air-conditioning system and analyzed the COP, heat per unit volume, pressure ratio, and discharge temperature for R134a, its alternative refrigerants, and mixed refrigerants. The results of this study revealed that R13I1/R152a and R13I1/R290 mixed refrigerants were superior to R134a in terms of the environment and performance. Kopeić [8] created an R134a refrigeration cycle with theoretical equations; analyzed the mass flow rate, heat dissipation, compressor work, and COP when applying the physical properties of R134a and R1234yf; and used the NTU method to analyze each refrigerant according to the volume flux of air. The heat absorption of the star evaporator was analyzed. When R1234yf was used in this study, the COP increased slightly compared with R134a. Direk et al. [9,10,11,12,13] conducted an experiment to analyze the performance of R1234yf when used as an alternative refrigerant to R134a. In this study, a test bench consisting of two air-cooled heat exchangers, two expansion valves, a four-way valve, and a compressor was constructed using the equipment for an automobile air-conditioning system for a European compact automobile. Results of the study show that the R1234yf refrigerant can be used as an alternative to R134a in both cooling and heating cases. Chen et al. [14,15,16,17] conducted a performance analysis of the cold climate of an air-cooled heat pump using R1234yf as an alternative refrigerant to R134a. The experimental results show that indoor/outdoor temperature, wind volume, and wind speed have a significant impact on performance and that, under certain conditions, the performance of the R1234yf system is superior to that of R134a. Although the system performance is low, the discharge temperature is also low, resulting in an advantage in terms of system protection at the same speed standard. Erdem et al. [18] conducted a performance analysis of R1234yf and R744 as alternatives to R134a. They built a model and simulation of each R134a, R1234yf, and R744 heat pump systems to analyze their performance. They found that R1234yf yielded a result similar to that of R134a, but R744 performed worse than R134a. Li et al. [19] analyzed heating performance with different refrigerants by simulating an electric vehicle heat pump system; they found that R32 showed an optimal COP and relatively little carbon emissions.
Therefore, various studies have been conducted to replace the R134a refrigerant. However, studies comparing the R134a system and R1234yf refrigerant in the same system have mainly been conducted using simulation models, and studies have reported different trends. Therefore, analysis of the actual trends through empirical testing rather than simply evaluating the system theoretically is important. In addition to testing R1234yf refrigerant and R134a refrigerant systems, certain studies have also conducted tests on air-cooled systems. To build an integrated thermal management system for electric vehicles, waste heat from batteries and electric vehicles needs to be utilized; therefore, a complex heat source, including a water-cooled heat exchanger built based on R134a, is necessary. The performance of systems using the R1234yf refrigerant in heat pump systems needs to be researched.
In the present study, we conducted an experiment with R1234yf on an R134a-based test bench simulating the refrigerant and coolant lines of an actual vehicle. We analyzed the impact of each parameter on the heating, cooling, and battery-cooling modes, all of which influence the thermodynamic performance and power consumption when the R1234yf refrigerant is applied to a composite heat source system for R134a-based electric vehicles. We expect an analysis of the impact of the parameter to aid in deriving a control algorithm that can derive an optimal COP.

2. Test Methods and Conditions

2.1. System Configuration

Figure 1 shows the test bench used in this study. This system consists of one scroll compressor for R134a, three air-cooled heat exchangers, two water-cooled heat exchangers, and a manual expansion valve. Additionally, the cooling, heating, and battery-cooling modes are controlled by controlling the flow path of each refrigerant using ball valves for each flow path. The specifications of the components used in the system are as presented in Table 1. All the condensers and evaporators are designed to operate within −20 °C to 90 °C.
Figure 2 shows the refrigerant flow path for each mode. The grey path indicates a process that is not in use for each mode. The red path is the high-pressure operating condition, and the blue one is the low-pressure operating condition. The measured position has been marked with circled number, and the p-h diagram of the system shows the effect of 30%, 50%, and 80% compressor loads. Figure 2a shows the heating mode. In the heating mode, the high-temperature, high-pressure refrigerant that has passed through the compressor changes into liquid refrigerant by exchanging heat with indoor air in an air-cooled heat exchanger. The radiated heat is used for indoor heating. The condensed liquid refrigerant is expanded through an expansion valve, and the expanded two-phase refrigerant absorbs heat through a water-cooled heat exchanger and turns into a high-temperature gaseous refrigerant. The refrigerant that has passed through the water-cooled heat exchanger is immediately sucked into the compressor and the process above is repeated. Figure 2b shows the cooling mode. The gaseous refrigerant discharged from the compressor bypasses the first air-cooled heat exchanger.
The bypassed refrigerant passes through a flow path without an expansion valve, passes through a water-cooled heat exchanger, and exchanges heat with the coolant in the water-cooled heat exchanger to form a liquid refrigerant. The changed liquid refrigerant is further subcooled by passing through a heat exchanger that exchanges heat with the outside air; then, it is further subcooled by exchanging heat with the refrigerant coming from the evaporator outlet through an internal heat exchanger. The refrigerant that passes through the internal heat exchanger expands through an expansion valve, absorbs heat through another air-cooled heat exchanger that exchanges heat with indoor air, and becomes a gaseous refrigerant. The absorbed air is used for indoor cooling. Afterwards, the refrigerant passes through the internal heat exchanger again and additional superheating occurs through heat exchange with the liquid refrigerant. Afterwards, the refrigerant is sucked through a compressor and undergoes a compression process. Figure 2c shows the battery-cooling mode. In the case of the battery-cooling mode, the overall cycle is similar to that of the cooling mode; however, the high-pressure liquid refrigerant that passes through the internal heat exchanger enters the water-cooled heat exchanger flow path that exchanges heat with the battery coolant rather than the heat exchanger that exchanges heat with indoor air, expands through the expansion valve, and performs water-cooled heat exchange. As it passes through the battery, heat exchange with the battery coolant occurs. The heat exchanger coolant is used to cool the battery.

2.2. Test Conditions

Table 2 shows the test conditions for R1234yf refrigerant in the air-conditioning system for electric vehicles, which is designed and optimized with R134a. The compressor load was changed by changing the value of the voltage input to the compressor, and the compressor power consumption was calculated using the voltage and current values measured by the power meter connected to the compressor. The fan air volume was adjusted by changing the value of the voltage input to the fan. The fan power consumption was determined by calculating the voltage and current consumed through a power meter connected to the fan, and the final system power consumption was calculated by adding the compressor power consumption to the fan power consumption. The coolant flow rate was measured through a flow meter connected to the coolant pump and the coolant pump output was adjusted to control the coolant flow rate. The coolant temperature was measured using a temperature sensor connected to the coolant line, and the coolant temperature was controlled through an electric heater and cooling fan connected to the coolant line. Compressor changes were measured for 40 min and the remaining parameter changes for 20 min, and the average of the recorded values for the preceding 5 min was used. The stabilization criterion was determined to be stable if the change in mass flow rate was below 5% in 5 min.
First, the amounts of refrigerant charge in heating, cooling, and battery-cooling mode were tested. Because R134a and R1234yf have different properties, their optimal amount of refrigerant should differ. The refrigerant charge test was performed in the cooling and heating modes with the compressor power being 80% and the fan voltage being 16 V, which are the maximum power conditions. In the battery-cooling mode, the test was performed with the compressor power being 80% and the fan being non-operational as it did not operate in the battery-cooling mode. After the refrigerant charge test, the amount of refrigerant with the maximum COP was applied in the tests performed to investigate the operating characteristics of the system for various parameters that can affect the operability of the air-conditioning system of electric vehicles.
For compressor power, tests were conducted under 30%, 50%, and 80% load conditions in three operation modes. In the heating and cooling modes, the heating, ventilation, and air-conditioning (HVAC) fan was tested at its maximum output of 16 V. In the battery-cooling mode, the HVAC fan is not considered because it does not operate in this mode. System performance evaluation for the HVAC air flow rate was performed under a medium compressor load of 50% and HVAC fan voltages of 9 V, 12 V, and 16 V, respectively. Because the battery-cooling mode does not use an HVAC fan, a test considering the actual electric vehicle operating characteristics was performed. System performance evaluation for coolant temperature was performed with compressor output at 50% and HVAC fan output at 12 V in heating and cooling modes, and the HVAC fan was not applied in the battery-cooling mode. Evaporator and condenser coolant temperatures of 20 °C, 30 °C, and 40 °C were tested in the heating and cooling modes, respectively. For the battery-cooling mode, test coolant temperatures of 20 °C and 30 °C were used. In the case of performance evaluation for the coolant flow rate, the 50% compressor load and 12 V of HVAC fan power were considered in the heating and cooling mode test. The HVAC fan was not considered in the battery-cooling mode. The evaporator coolant flow rate in the heating mode varies between 5, 10, and 15 LPM. Condenser coolant flow rates of 5, 10, and 15 LPM were tested for the cooling and battery-cooling modes.

3. Results and Discussion

3.1. Effects of Refrigerant Charge

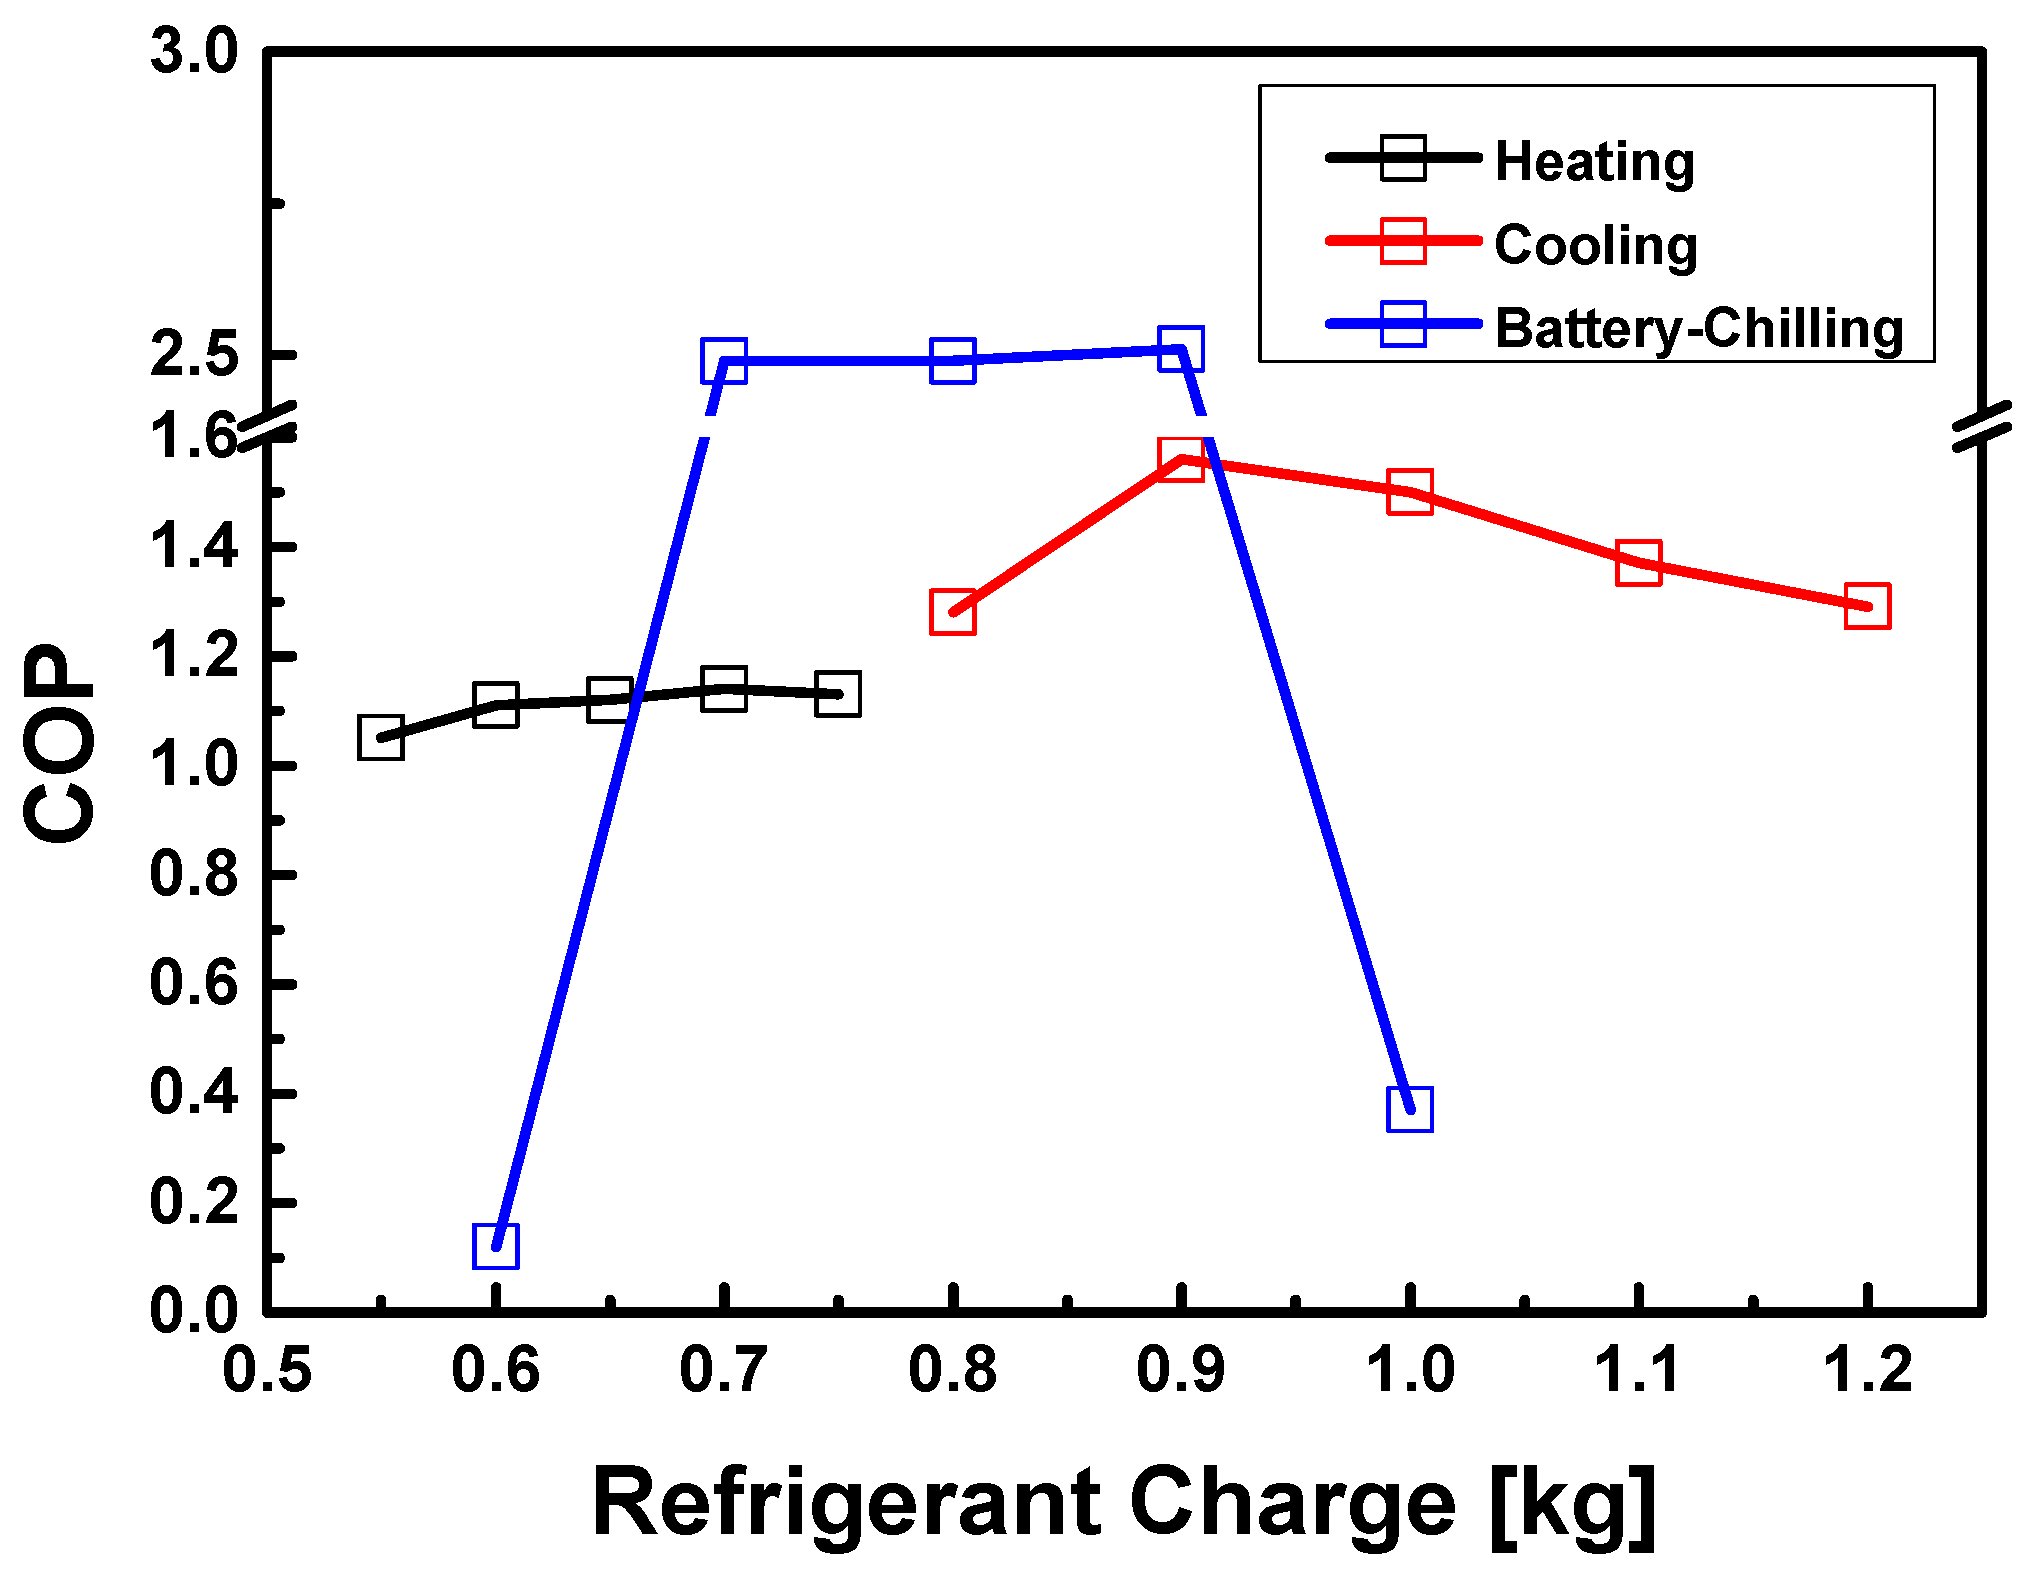
Figure 3 shows the COP for various amounts of refrigerant charge in heating and cooling, and the graph shows the refrigerant charge for each mode. The refrigerant charge with the highest COP in the heating and cooling modes is 0.7 kg. In the battery-cooling mode, the refrigerant charge with the highest COP is 0.9 kg. In the heating mode, if the refrigerant charge is below 0.55 kg, the amount of refrigerant charge in the system is insufficient; therefore, the efficiency of the system decreases rapidly and the cycle is not formed. In addition, if the amount of refrigerant charge exceeds 0.75 kg, the refrigerant at the evaporator outlet does not completely turn into a gaseous state owing to refrigerant overcharge in the heating mode. In the cooling mode, if the amount of refrigerant charge is below 0.8 kg, the efficiency tends to decrease rapidly owing to insufficient refrigerant charge. If the amount of refrigerant charge exceeds 1.2 kg, the refrigerant at the heat exchanger outlet cannot completely change phase owing to the overcharged refrigerant. In battery-cooling mode, if the refrigerant charge is below 0.7 kg, the efficiency decreases rapidly owing to insufficient refrigerant charge, and if it exceeds 0.9 kg, efficiency decreases sharply owing to overcharging. The optimal refrigerant charge in battery-cooling mode differs considerably from that in the cooling and heating operations because the passage through which the refrigerant flows in cooling and the passage through which it flows in heating differ from that of the air-cooled condenser until the intake of the compressor and the difference in the volume of the passages is large.

3.2. Effects of Operation Parameters of Electric Vehicle Air-Conditioning System with R1234yf Refrigerant (Heating Mode)

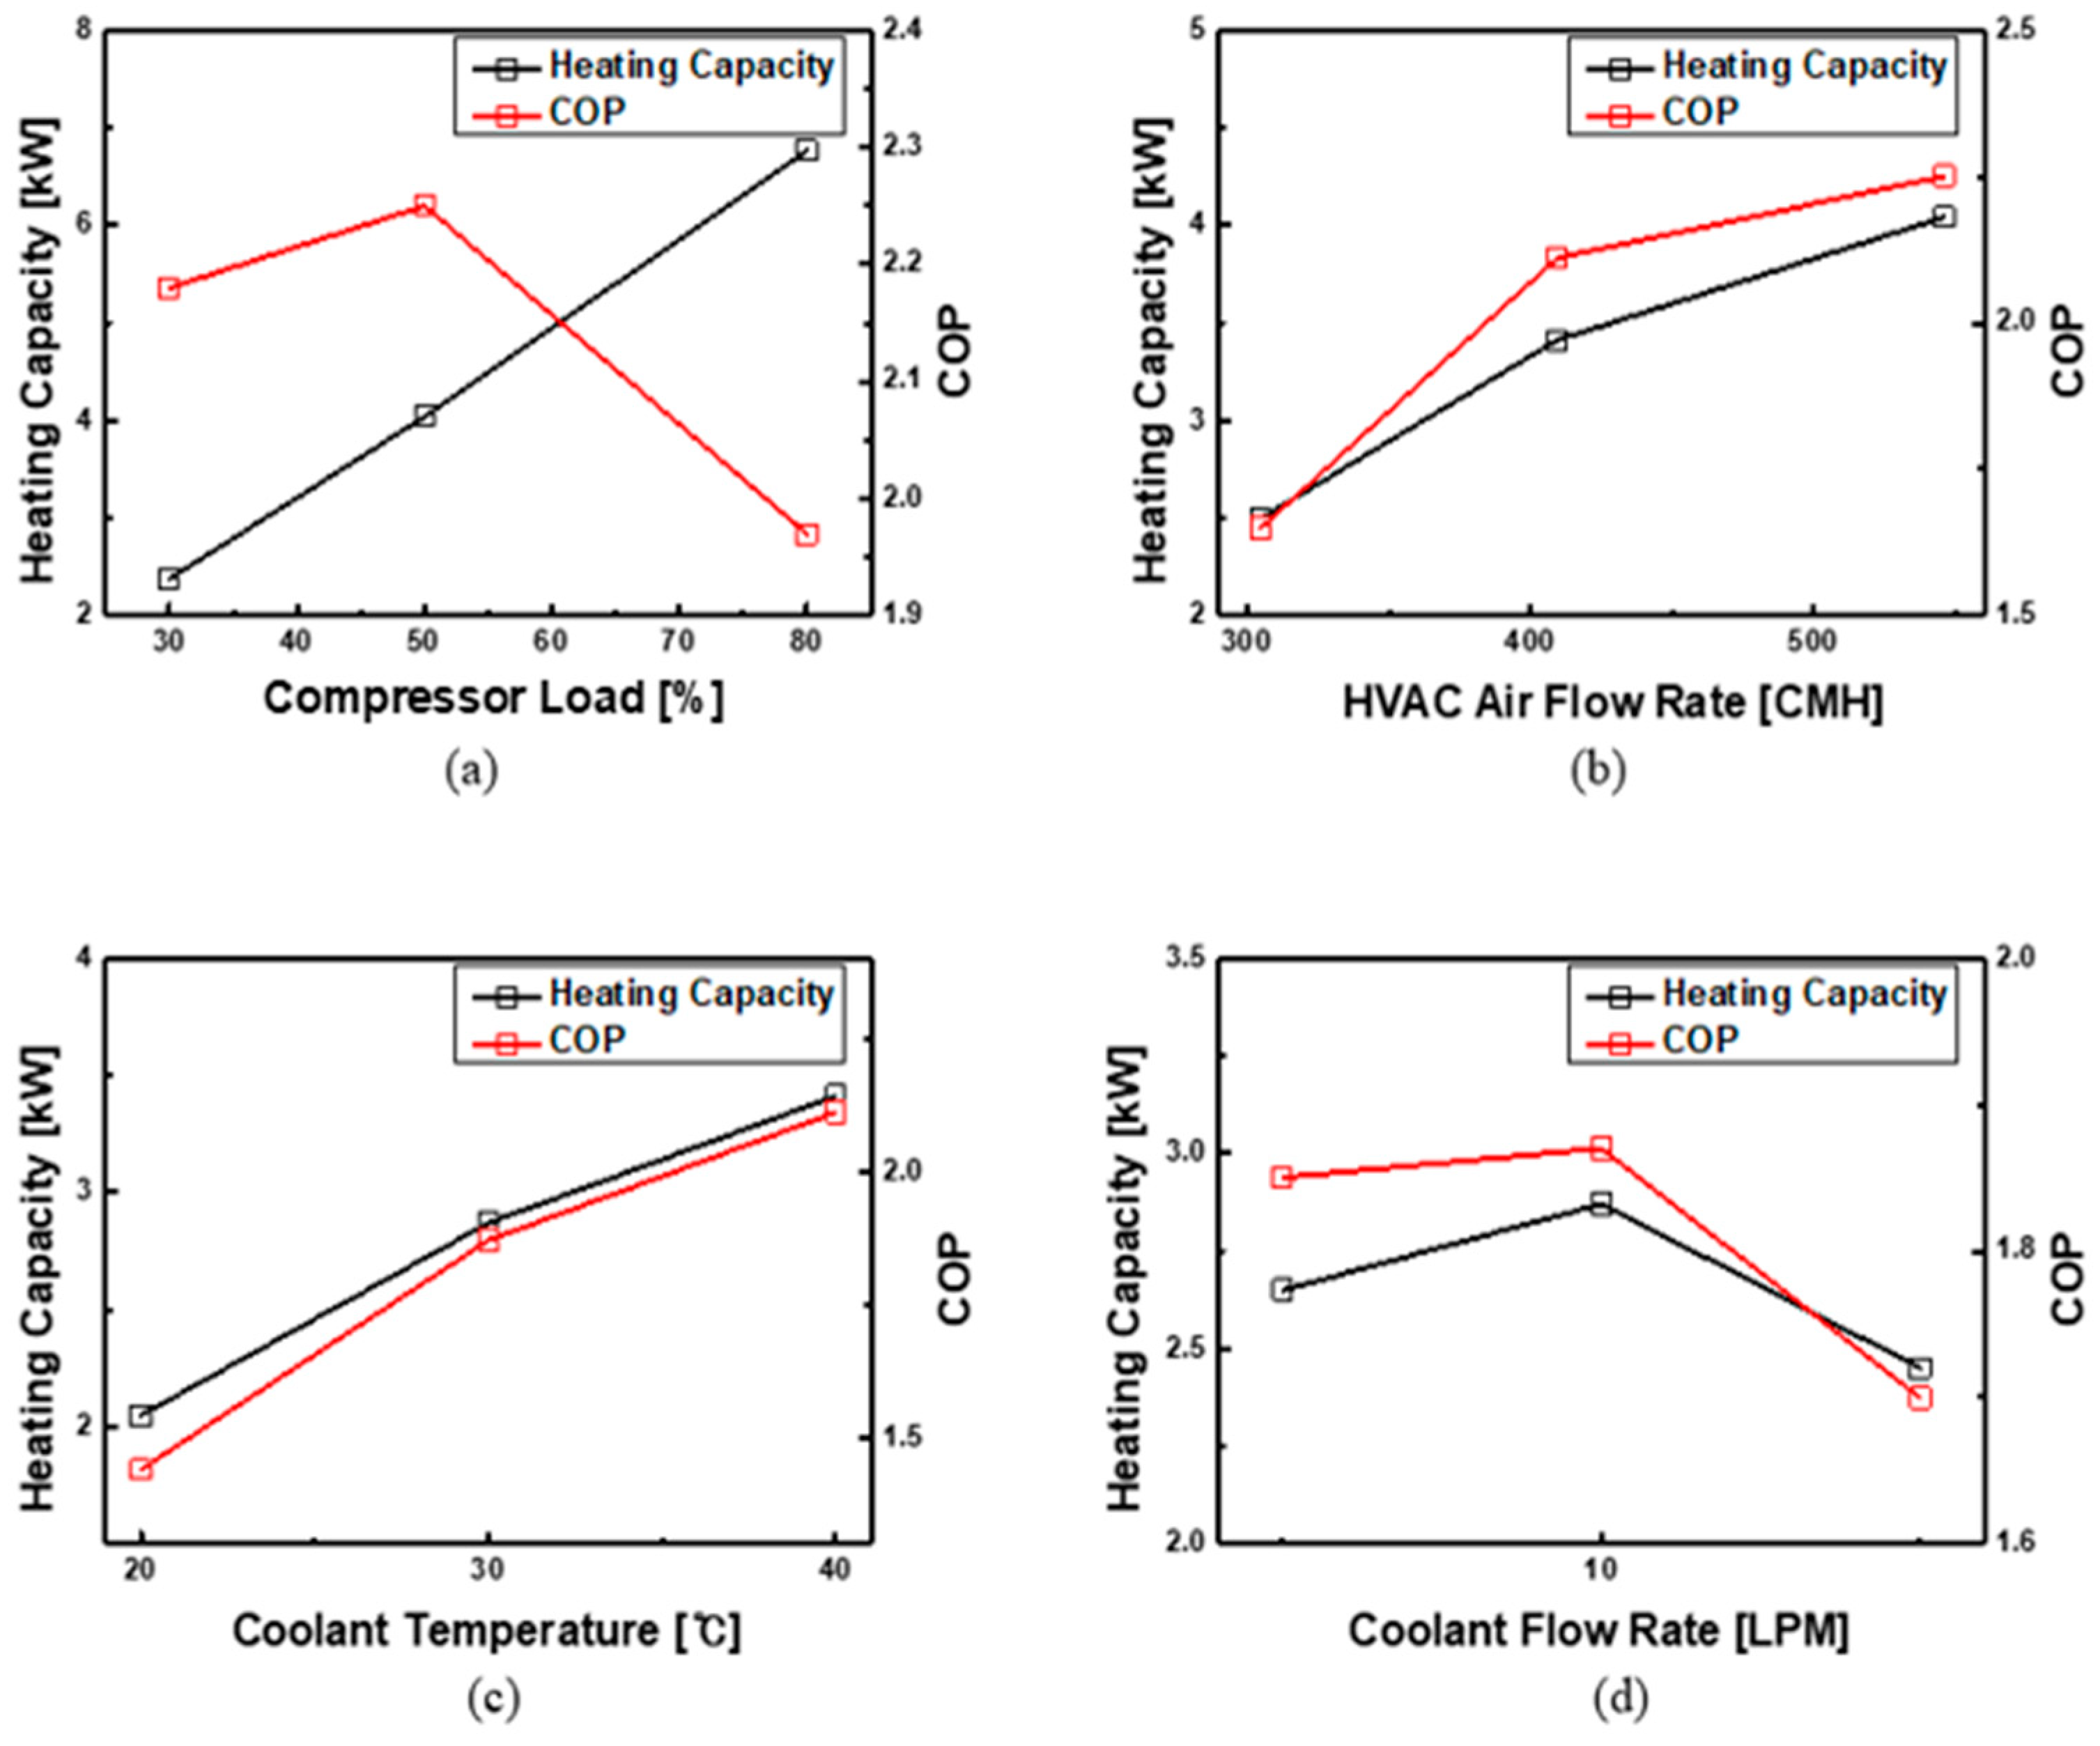
Figure 4 shows results of the heating capacity of the condenser and COP for compressor power, HVAC air flow rate, evaporator coolant temperature, and flow rate in heating mode. Figure 4a shows the effects of the compressor load on the heating capacity and COP. As the compressor load increases, the amount of heat dissipation in the condenser increases to 2.38 kW, 4.04 kW, and 6.76 kW, respectively, and the COP changes to 2.18, 2.25, and 1.97. As shown in Figure 4, the effect of compressor load is the largest compared with the effects of other operating parameters with respect to the heating capacity and COP. As the compressor load increases, the COP increases and then decreases. Because the mass flow rate of the refrigerant increases, the amount of heating capacity continuously increases. When the compressor load increases from 30% to 50%, the COP increases because the increase in heat capacity exceeds the increase in compressor work. When the compressor load increases from 50% to 80%, the COP decreases as the increase in compressor work exceeds the increase in heat capacity. A modified compressor load of 50% yields optimal performance. Figure 4b shows the effects of HVAC air flow rate on the heating capacity and COP. As HVAC air flow rate increases, heating capacity in the condenser increases to 2.50 kW, 3.41 kW, and 4.04 kW, respectively, and the COP changes to 1.65, 2.11, and 2.25. As HVAC air flow rate increases, heat capacity and the COP increase; further, the amount of available air for heat exchange in the condenser increases, resulting in increased heating capacity. As the HVAC air volume increases, the power consumption of the system increases; however, because the increase in heat capacity exceeds the increase in power consumption, the COP also increases overall. With respect to the modified HVAC air flow rate, 16 V yielded relatively optimized performance. Figure 4c shows the effects of coolant temperature of the evaporator on the heating capacity and COP. As the temperature of the evaporator coolant increases, the heating capacity of the condenser increases to 2.05 kW, 2.87 kW, and 3.41 kW, respectively, and the COP changes to 1.44, 1.87, and 2.11. As the coolant temperature increases, the heat capacity and COP of the system increase. As the coolant temperature increases, the temperature difference between the refrigerant passing through the evaporator and the coolant increases, causing an increase in the heat absorption of the evaporator. Because the heat absorption of the evaporator increases, the temperature of the refrigerant in the system increases and causes an increase in the difference between the temperatures of the refrigerant and air passing through the condenser, which also increases the amount of heat capacity. The increase in evaporator coolant temperature causes an increase in refrigerant temperature. In addition, as the temperature of the refrigerant increases, the mass flow rate and power consumption of the system increase; however, the COP increases because the increase in heat capacity exceeds the increase in system power consumption. A coolant temperature of 40 °C yields optimal COP. Figure 4d shows the effects of the coolant flow rate of the evaporator on the heating capacity and COP. As the coolant flow rate increases, the heat capacity increases to 2.65 kW, 2.87 kW, and 2.46 kW, and the COP shifts to 1.85, 1.87, and 1.70, respectively. Both the amount of heat exchange in the condenser and the reduction in power consumption after increasing as the coolant flow rate increases are attributed to the increase then decrease in the refrigerant mass flow rate, as mentioned in Figure 4a. As the coolant flow rate increases, the absorbable heat in the coolant increases. However, owing to the increase in flow rate, the absorption efficiency of the heat exchanger is reduced. When the cooling water flow rate changes from 5 LPM to 10 LPM, the amount of absorbed heat increases because the effect of the increasing absorbed heat is larger than the effect of reducing the heat absorption efficiency. When the cooling water flow rate varies from 10 LPM to 15 LPM, the absorbed heat is decreased, because the effect of reducing the absorption efficiency is larger than the effect of the absorbable heat increase. A coolant flow rate of 10 LPM yields the optimal COP.

3.3. Effects of Operation Parameters of Electric Vehicle Air-Conditioning System with R1234yf Refrigerant (Cooling Mode)

Figure 5 shows results of the cooling capacity and COP for compressor power, HVAC air flow rate, condenser coolant temperature and flow rate, and radiator air flow rate in the cooling mode. Figure 5a shows the effect of compressor power on the cooling capacity and COP. As the compressor load increases, the cooling capacity of the evaporator increases to 4.83 kW, 7.43 kW, and 8.13 kW, and the COP increases to 2.87, 3.05, and 2.20, respectively. As shown in Figure 5, the effect of compressor load on the amount of cooling capacity and the COP are the largest compared with other parameters. As the compressor load increases, the absorbed heat in the evaporator continuously increases, after which the COP decreases because the mass flow rate of the refrigerant increases as the compressor load increases. The COP decreases after increasing because when the compressor load changes from 30% to 50%, the increase in heat absorption exceeds the increase in compressor work. However, when it changes from 50% to 80%, the increase in heat absorption is less than the increase in compressor work. A compressor load of 50% yields the optimal COP. Figure 5b shows the effect of HVAC air flow rate on the cooling capacity and COP. As the HVAC air flow rate increases, the cooling capacity increases to 6.35 kW, 7.43 kW, and 8.05 kW, and the COP increases to 2.75, 3.05, and 3.00, respectively. As the air flow rate of HVAC increases, the absorbed heat increases, but the COP tends to decrease after increasing. As the HVAC air flow rate increases, the amount of exchanged heat increases in evaporators; however, the power consumption of HVAC fans also increases simultaneously. The COP increases when the amount of heat exchange exceeds the increase in power consumption. However, the COP decreases when power consumption exceeds the amount of heat exchange. When changing the HVAC air flow rate, 12 V results the optimal COP. Figure 5c shows the effect of condenser coolant temperature on the cooling capacity and COP. As the coolant temperature increases, the cooling capacity decreases to 7.52 kW, 7.43 kW, and 5.49 kW, and the COP changes to 3.52, 3.05, and 2.01, respectively. As the coolant temperature increases, the absorbed heat and COP decrease. As the coolant temperature increases, the condenser heat dissipation is reduced because the temperature difference between the refrigerant and coolant in the condenser is reduced, and the temperature of the refrigerant that has passed through the condenser increases. In addition, the temperature of the refrigerant that enters the evaporator through the expansion valve increases, and the temperature difference between the refrigerant and air in the evaporator is reduced, resulting in a reduction in heat absorption. The compressor work increases as the coolant temperature increases, and the refrigerant mass flow also increases. Further, when the coolant temperature increases, the amount of heat absorption of the evaporator decreases and the compressor work increases; therefore, the COP decreases. When changing the coolant temperature, 20 °C yields the optimal COP. Figure 5d shows the effect of the condenser coolant flow rate on the cooling capacity and COP. As the coolant flow rate increases, the cooling capacity changes to 6.91 kW, 7.43 kW, and 7.22 kW, and the COP changes to 2.64, 3.05, and 3.03, respectively. As the coolant flow rate increases, the heat absorption of the evaporator and of the cooling COP increases and then decreases. Increased coolant mass flow causes an increase in the amount of exchangeable heat; however, the efficiency of the heat exchange decreases owing to the increase in flow velocity. When the coolant flow rate varies from 5 LPM to 10 LPM, the amount of heat exchange increases because the effect on the increase in the exchanged heat due to the coolant flow rate exceeds that on the reduction in heat exchange efficiency due to the coolant flow velocity. As the amount of heat exchange increases, the refrigerant temperature at the condenser outlet decreases, causing the refrigerant temperature at the evaporator inlet to decrease. Because the temperature difference between the refrigerant and the air in the evaporator increases, the amount of heat absorption increases. When the coolant flow rate varies from 10 LPM to 15 LPM, the decrease in heat exchange efficiency due to the increase in coolant flow velocity is greater than the effect of the increase in heat exchange capacity due to the increase in coolant flow rate. Therefore, the amount of exchanged heat decreases. As the amount of exchanged heat decreases, the refrigerant temperature at the condenser outlet decreases, causing the refrigerant temperature at the evaporator inlet to increase. Because the temperature difference between the refrigerant and the air in the evaporator decreases, the amount of heat exchange decreases. When the coolant flow rate increases from 5 LPM to 10 LPM, heat absorption increases; however, as the mass flow rate of the refrigerant decreases, the power consumption of the system decreases and the COP increases. When the coolant flow rate increases from 10 LPM to 15 LPM, heat absorption decreases, but the mass flow rate of the refrigerant increases; therefore, the system power consumption increases and COP decreases. When changing the coolant flow rate, 10 LPM shows the optimal COP. Figure 5e shows the effect of radiator air flow rate on the cooling capacity and COP. As the radiator air flow rate increases, the cooling capacity changes to 7.23 kW, 7.43 kW, and 7.36 kW, and the COP decreases to 3.20, 3.05, and 2.71, respectively. As the air flow rate of the radiator increases, heat absorption increases and then decreases; however, the COP continuously decreases. The amount of heat absorption also increases and then decreases, but the difference is negligible. When the radiator air flow rate increases from 600 to 950 CMH, there is almost no difference in the refrigerant mass flow rate at 150.66 kg/h, 149.69 kg/h, and 150.98 kg/h, and the air intake temperature is 33.58 °C, 34.13 °C, and 34.26 °C, respectively, which are within the experimental error range. The discharge temperature also increases and then decreases (1586 °C, 1713 °C, and 1602 °C); however, this is within the experimental error range of 5%. Therefore, the heat absorption of the evaporator in the HVAC hardly changes depending on the radiator fan air flow rate, but the COP decreases because the power consumption of the overall system increases. When changing the radiator air flow rate, 9 V yields the optimal COP.

3.4. Effects of Operation Parameters of Electric Vehicle Air-Conditioning System with R1234yf Refrigerant (Battery-Cooling Mode)

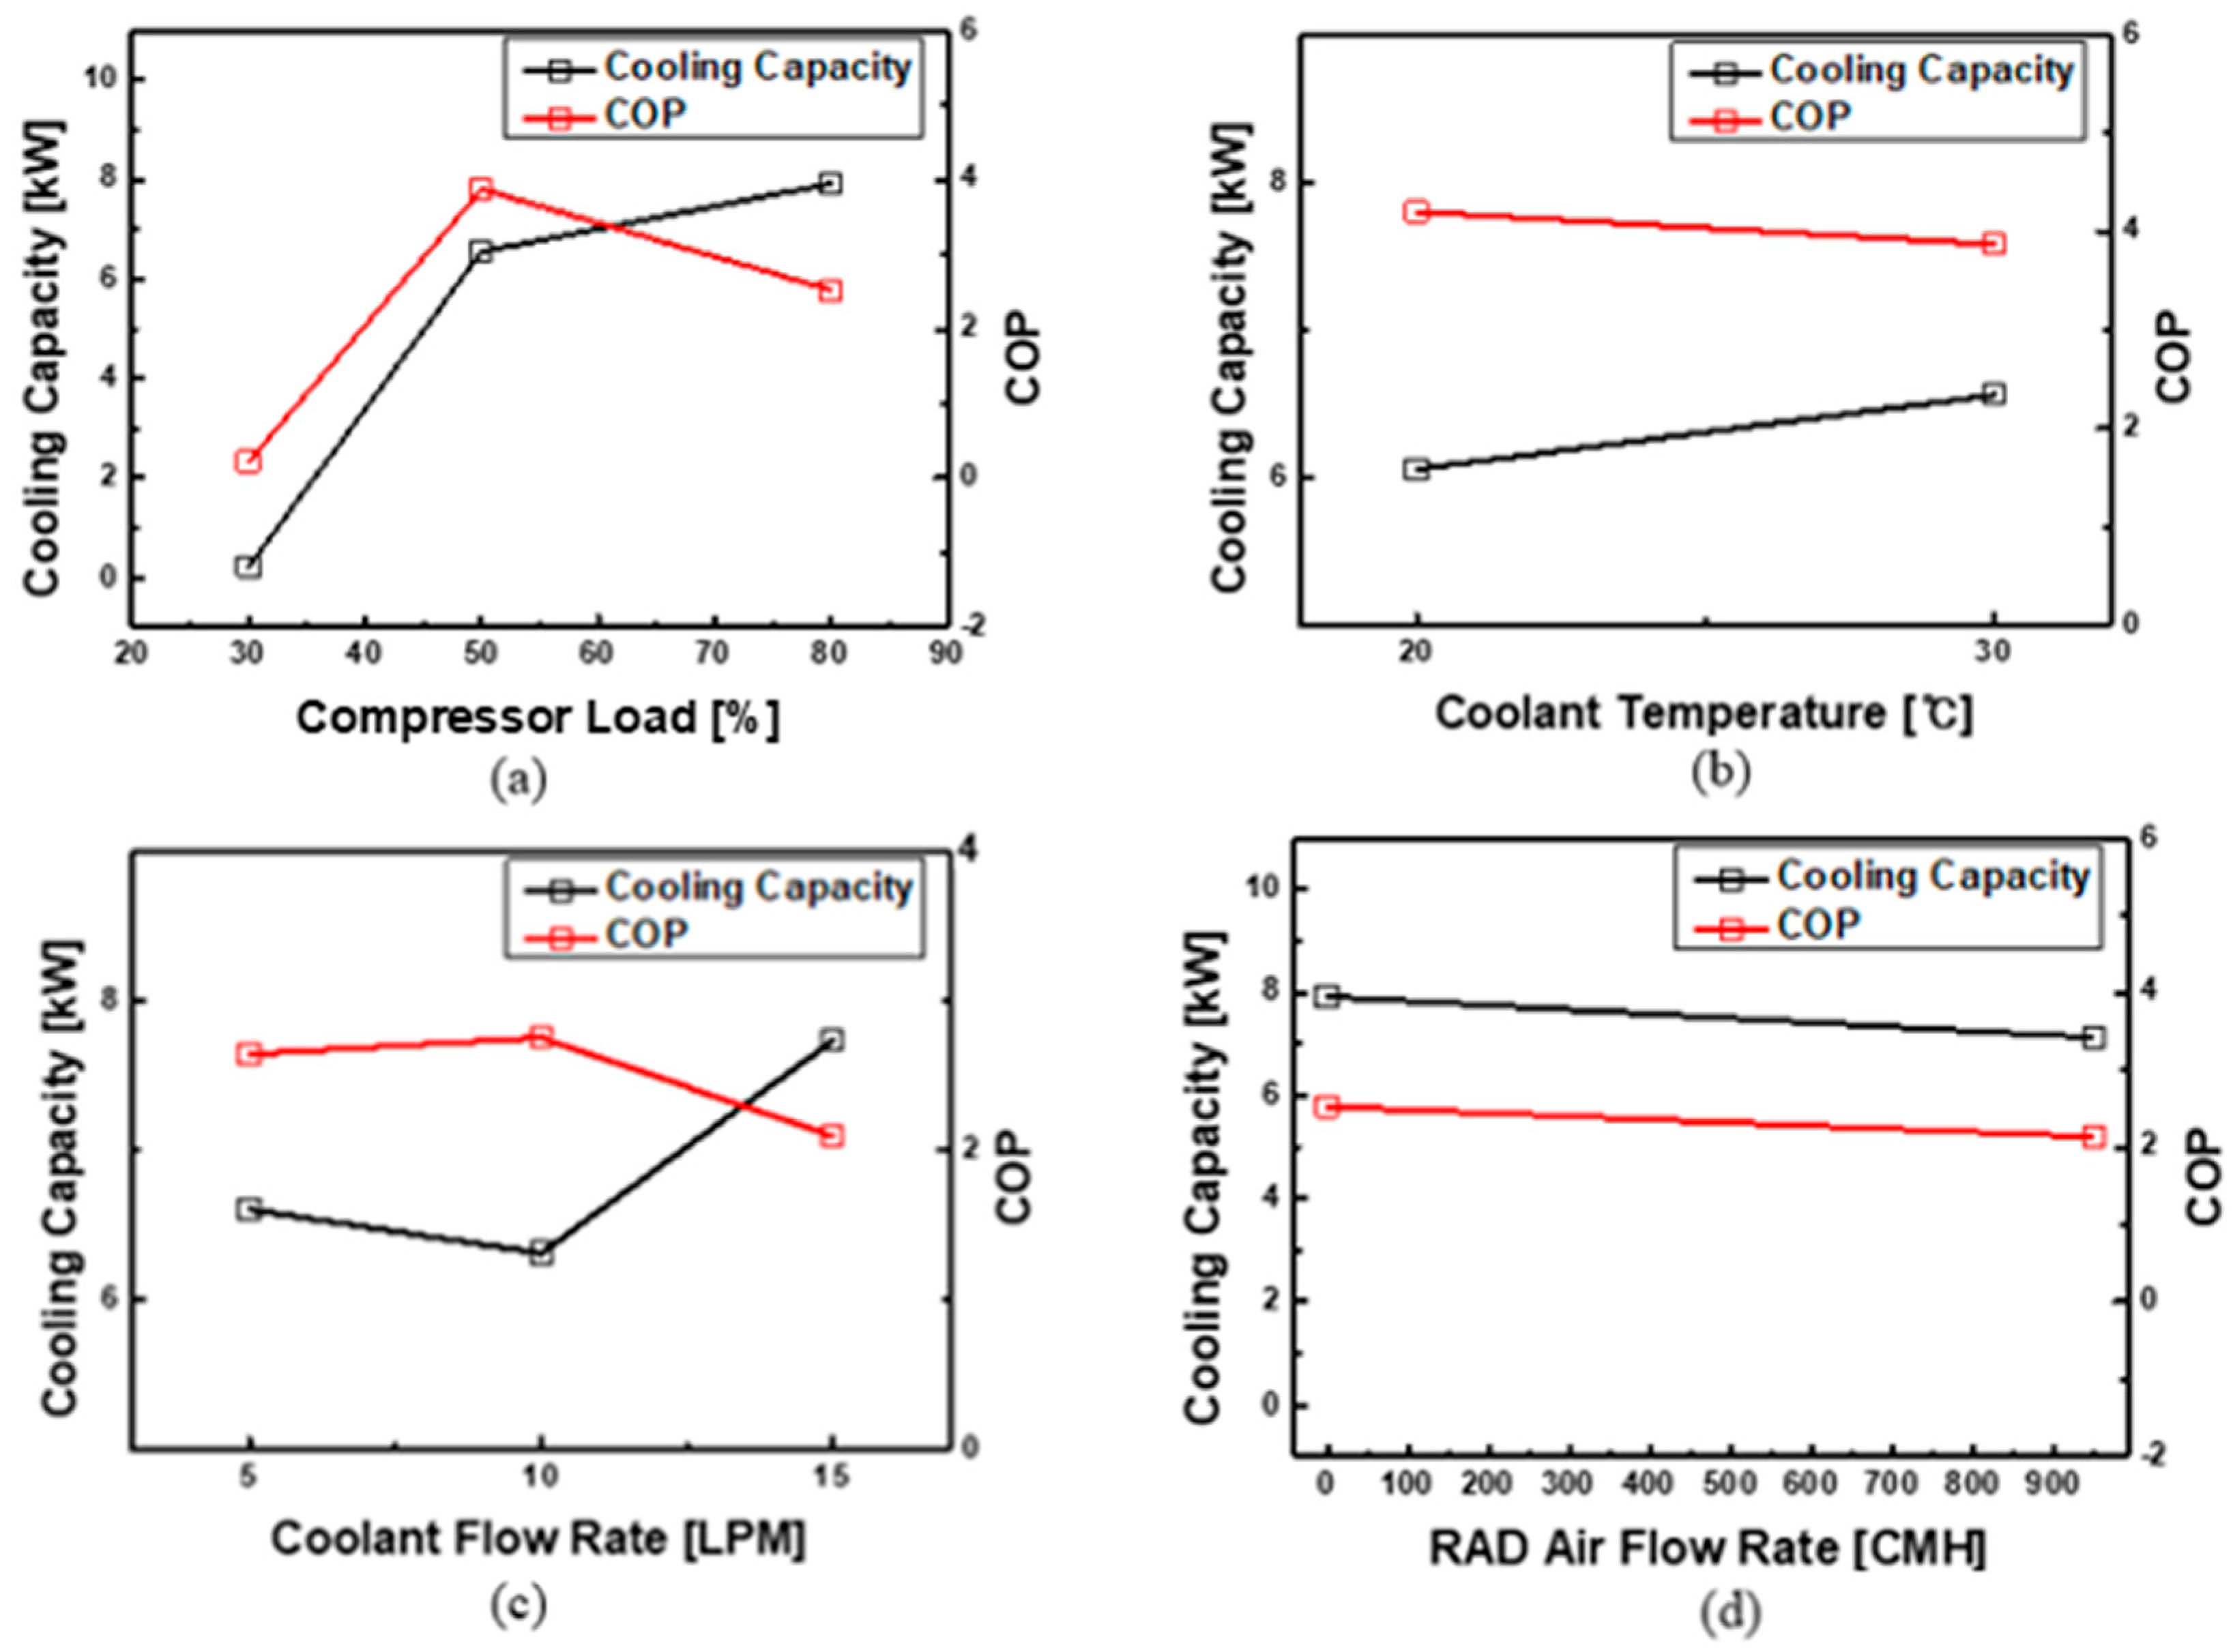
Figure 6 shows the cooling capacity, which represents the dissipated heat and COP for the compressor load, condenser coolant temperature, condenser coolant flow rate, and radiator air flow rate. Figure 6a displays a result of cooling capacity, indicating the amount of heat absorption in the evaporator and the COP for compressor load. As the compressor load increases, the cooling capacity increases to 0.22 kW, 6.56 kW, and 7.92 kW, and the COP shifts to 0.22, 3.87, and 2.52, respectively. As the compressor load increases, the amount of absorbed heat increases and the COP increases and then decreases. An increase in the compressor load causes an increase in the mass flow rate of the refrigerant and, consequently, an increase in the heat absorption. The COP increases and decreases when the compressor load changes from 30% to 50%. The increase in heat absorption is greater than the increase in compressor work; however, when the compressor load changes from 50% to 80%, the increase in heat absorption is less than the increase in compressor work. When changing the compressor load, 50% shows the optimal COP. Figure 6b shows the result of the cooling capacity and COP for coolant temperature. A coolant temperature of 40 °C is an inoperable condition because when the coolant temperature exceeds 40 °C, the condenser cannot cool the refrigerant sufficiently. As the coolant temperature increases, the heat absorption of the evaporator increases to 6.05 kW and 6.56 kW, and the COP changes to 4.20 and 3.87, respectively. As the condenser cooling water temperature increases, heat absorption increases but the COP decreases. As the condenser coolant temperature increases, the temperature of the refrigerant passing through the condenser increases and the temperature of the refrigerant passing through the expansion valve and entering the evaporator also increases. The temperature difference between the refrigerant and coolant passing through the evaporator decreases; however, the heat absorption increases because of the increased mass flow rate. The COP decreases because the increased power consumption is greater than the increased heat absorption due to an increase in refrigerant mass flow rate. When changing the coolant temperature, 20 °C shows the optimal COP. Figure 6c shows the results of heat absorption of the evaporator and the COP for coolant flow rate. As the coolant flow rate increases, heat absorption increases to 6.60 kW, 6.31 kW, and 7.37 kW, and the COP changes to 1.85, 1.87, and 1.70, respectively. As the condenser coolant flow rate increases, the heat absorption decreases and then increases, but the COP increases and then decreases. The amount of absorbable heat increases from the refrigerant when the amount of coolant is high. However, when the coolant flow rate increases, the heat exchange efficiency decreases owing to increased coolant velocity. At a coolant flow rate of 10 LPM compared to 5 LPM, the effect of increased heat dissipation capacity of the condenser due to an increase in flow rate exceeds the effect of a decrease in efficiency owing to an increase in flow velocity, and causes a decrease in the temperature of the refrigerant. Because of this, the refrigerant flow rate decreases and the heat absorption of the evaporator also decreases. However, when the coolant flow rate varies from 10 LPM to 15 LPM, the effect of the reduction in heat exchange efficiency owing to the increase in flow velocity is greater than the effect due to the increase in flow rate, so the temperature of the refrigerant in the system increases. As a result, the refrigerant flow rate increases and the evaporator heat absorption increases. System power consumption increases when the refrigerant flow rate increases and decreases when the refrigerant flow rate decreases. Because the difference between the increase and decrease in system power consumption is greater than that in evaporator heat absorption, the COP shows an opposite trend to that of the evaporator heat absorption. When changing the coolant flow rate, 10 LPM shows the optimal COP. Figure 6d shows the heat dissipation and COP for the on/off of the radiator. As the radiator works, indicating a supply of air flow, the heat absorption of the evaporator changes to 7.92 kW and 7.13 kW, and the COP changes to 2.52 and 2.13, respectively. The heat absorption and COP are lower when a radiator is used compared to when a radiator is not used because additional subcooling by the radiator reduces the mass flow rate of the refrigerant, and the amount of heat exchange in the evaporator decreases owing to the reduction in mass flow rate. When changing the radiator air flow rate, the radiator fan is not adequate for improving the COP.

4. Conclusions

In this study, the empirical tests were conducted using the R1234yf refrigerant in the air-conditioning system of the electric vehicle optimized with the R134a refrigerant.
(1)
The optimum amount of refrigerant was determined based on the highest COP and differed for the heating and cooling/battery-cooling modes because the passage through which the refrigerant passes is different for each mode.
(2)
The required compressor operating loads for the required heat capacity in each mode differ; however, the 50% compressor load from the COP perspective is the most efficient in all operating modes.
(3)
In the heating and cooling modes, running the HVAC fan at 12 V and not using the radiator fan is efficient. However, if securing additional evaporator heat absorption using a radiator fan is necessary, operating under power conditions below 12 V is recommended.
(4)
The effect of coolant temperature and flow rate in terms of COP is most efficient under the conditions of 30 °C and 10 LPM of water coolant in the cooling and heating modes. In the battery-cooling mode, coolant conditions of 20 °C and 10 LPM yield optimal results.
In this study, we analyzed the impact of the parameter that influences system performance. The results showed that the impact of the compressor load is dominant. Therefore, controlling the compressor load improves the COP. Discharging temperature via the vapor injection technique is one way of improving performance—that is, increasing the mass flow rate of the system and lowering the compressor suction [20]. We controlled the compressor load at a fixed point to analyze the impact of the compressor load. To achieve the optimal COP, we conducted an experiment using a test bench equipped with a variable compressor speed controller. Future studies will involve the use of a control algorithm of the compressor. We also intend to construct a test bench fitted with the vapor injection system and to analyze the impact of vapor injection.

Author Contributions

Conceptualization, Y.P.; methodology, Y.C.; validation, S.E.; formal analysis, J.L.; investigation, J.K.; resources, J.S.; data curation, J.S. and S.C.; writing—original draft preparation, J.S.; writing—review and editing, M.C.; visualization, J.S.; supervision, Y.P.; project administration, G.C. All authors have read and agreed to the published version of the manuscript.

Funding

This research was funded by KORENS.

Data Availability Statement

Data are contained within the article.

Acknowledgments

Following are results of a study on the “Leaders in Industry-university Cooperation 3.0” Project, supported by the Ministry of Education and National Research Foundation of Korea. This research was supported by Basic Science Research Program through the National Research Foundation of Korea (NRF) funded by the Ministry of Education (RS-2023-00245460).

Conflicts of Interest

The authors declare no conflict of interest.

References

  1. 2. f Amendment to the Montreal Protocol on Substances That Deplete the Ozone Layer, United Nations Treaty Collection. Available online: https://treaties.un.org/Pages/ViewDetails.aspx?src=TREATY&mtdsg_no=XXVII-2-f&chapter=27&clang=_en (accessed on 27 October 2023).
  2. IEA. Net Zero by 2050: A Roadmap for the Global Energy Sector; IEA: Paris, France, 2021. [Google Scholar]
  3. Kim, K.; Lee, W.-S.; Kim, Y.Y. Investigation of Electric Vehicle Performance Affected by Cabin Heating. J. Korea Acad.-Ind. Coop. Soc. 2013, 14, 4679–4684. [Google Scholar] [CrossRef]
  4. Vaghela, J.K. Comparative Evaluation of an Automobile Air—Conditioning System Using R134a and Its Alternative Refrigerants. Energy Procedia 2017, 109, 153–160. [Google Scholar] [CrossRef]
  5. Zhang, N.; Dai, Y. Performance evaluation of alternative refrigerants for R134a in automotive air conditioning system. Asia-Pac. J. Chem. Eng. 2021, 17, e2732. [Google Scholar] [CrossRef]
  6. Zhang, N.; Li, B.; Feng, L.; Dai, Y. Research on the Thermophysical Properties and Cycle Performances of R1234yf/R290 and R1234yf/R600a. Int. J. Thermophys. 2021, 42, 123. [Google Scholar] [CrossRef]
  7. Zhang, N.; Dai, Y.; Feng, L.; Li, B. Study on Environmentally Friendly Refrigerant R13I1/R152a as an Alternative for R134a in Automotive Air Conditioning System. Chin. J. Chem. Eng. 2022, 44, 292–299. [Google Scholar] [CrossRef]
  8. Kopeć, P. Influence of Refrigerant R1234yf as a Substitute for R134a on a Perfect Refrigeration Cycle and Exchanger Efficiency. Czas. Tech. 2015. [Google Scholar]
  9. Direk, M.; Yüksel, F. Experimental Evaluation of an Automotive Heat Pump System with R1234yf as an Alternative to R134a. Arab. J. Sci. Eng. 2019, 45, 719–728. [Google Scholar] [CrossRef]
  10. Direk, M.; Kelesoglu, A.; Akin, A. Drop-in Performance Analysis and Effect of IHX for an Automotive Air Conditioning System with R1234yf as a Replacement of R134a. J. Mech. Eng. 2017, 63, 314–319. [Google Scholar] [CrossRef]
  11. Direk, M.; Tunckal, C.; Yuksel, F. Comparative Performance Analysis of Experimental Frigorific Air Conditioning System Using R-134a and HFO-1234yf as a Refrigerant. Therm. Sci. 2016, 20, 2065–2072. [Google Scholar] [CrossRef]
  12. Direk, M.; Kelesoglu, A. Performance Analysis of Automotive Air Conditioning System with an Internal Heat Exchanger Using R1234YF under Different Evaporation and Condensation Temperatures. Therm. Sci. 2017. [Google Scholar]
  13. Direk, M.; Kelesoglu, A. Automotive air conditioning system with an internal heat exchanger using R1234YF and different evaporation and condensation temperatures. Therm. Sci. 2019, 23, 1115–1125. [Google Scholar] [CrossRef]
  14. Li, W.; Liu, R.; Liu, Y.; Wang, D.; Shi, J.; Chen, J. Performance evaluation of R1234yf heat pump system for an electric vehicle in cold climate. Int. J. Refrig. 2020, 115, 117–125. [Google Scholar] [CrossRef]
  15. Zhao, Y.; Chen, J.; Xu, B.; He, B. Performance of R-1234YF in Mobile Air Conditioning System under Different Heat Load Conditions. Int. J. Air-Cond. Refrig. 2012, 20, 1250016. [Google Scholar] [CrossRef]
  16. Shi, J.; Liu, C.; Hu, J.; Zhao, Y.; Chen, J. Experimental research and optimization on the environmental friendly R1234yf refrigerant in automobile air conditioning system. J. Shanghai Jiaotong Univ. (Sci.) 2016, 21, 548–556. [Google Scholar] [CrossRef]
  17. Zhao, Y.; Qi, Z.; Chen, J.; Xu, B.; He, B. Experimental analysis of the low-GWP refrigerant R1234yf as a drop-in replacement for R134a in a typical mobile air conditioning system. Proc. Inst. Mech. Eng. Part C J. Mech. Eng. Sci. 2012, 226, 2713–2725. [Google Scholar] [CrossRef]
  18. Onan, C.; Erdem, S. R1234yf and R744 as alternatives to R134a at mobile air conditioners. J. Energy Syst. 2021, 5, 284–295. [Google Scholar] [CrossRef]
  19. Lv, R.; Li, Z.; Wang, Y.; Li, M. Heating performance of heat pump air conditioning system for battery electric vehicle with different refrigerants. Proc. Inst. Mech. Eng. Part D J. Automob. Eng. 2022, 09544070221135445. [Google Scholar] [CrossRef]
  20. Kwon, C.; Kim, M.; Choi, Y.; Kim, M. Performance evaluation of a vapor injection heat pump system for electric vehicles. Int. J. Refrig. 2017, 74, 138–150. [Google Scholar] [CrossRef]
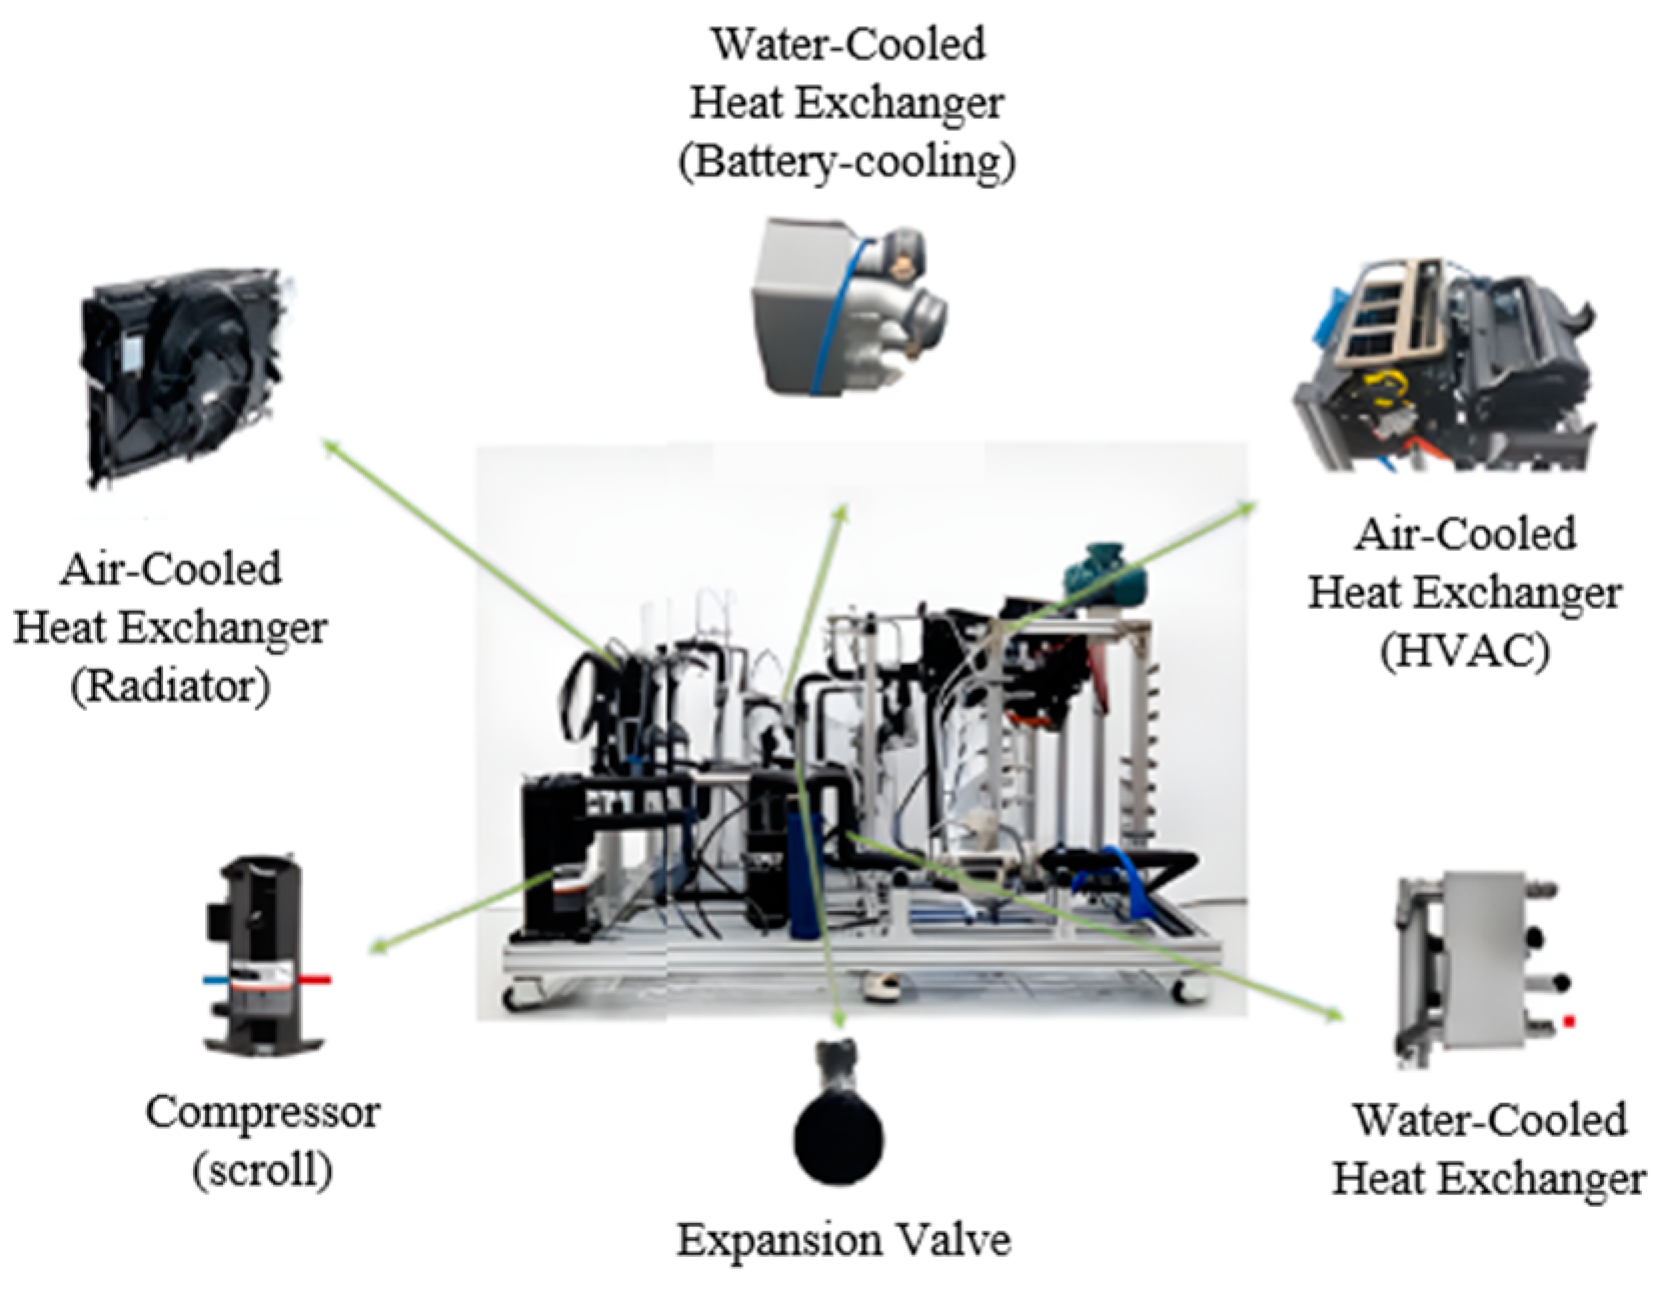
Figure 1. Electric vehicle heat pump test bench.
Energies 16 08017 g001
Figure 2. Schematic of the operating process and PH diagram of the electric vehicle heat pump. (a) Heating mode, (b) cooling mode, and (c) battery-cooling mode.
Energies 16 08017 g002
Figure 3. COP change with different refrigerant charges.
Energies 16 08017 g003
Figure 4. Heating capacity and COP change with different parameters. (a) Compressor load, (b) HVAC air flow rate, (c) coolant temperature, and (d) coolant volume flow rate in heating mode.
Energies 16 08017 g004
Figure 5. Cooling capacity and COP change with different parameters. (a) Compressor load, (b) HVAC air flow rate, (c) coolant temperature, (d) coolant flow rate, and (e) radiator air flow rate in cooling mode.
Energies 16 08017 g005
Figure 6. Cooling capacity and COP change with different parameters. (a) Compressor load, (b) coolant temperature, (c) coolant flow rate, and (d) radiator air flow rate in battery-cooling mode.
Energies 16 08017 g006
Table 1. Component specifications.
ComponentParameterUnitValue
CompressorDisplacementm3/h22.6
Tube-Fin CondenserVolume (L × D × H)mm × mm × mm150 × 20 × 113.5
Tube-Fin EvaporatorVolume (L × D × H)mm × mm × mm150 × 20 × 113.5
Tube-Fin RadiatorVolume (L × D × H)mm × mm × mm610 × 16 × 486
Plate-type heat exchangerVolume (L × D × H)mm × mm × mm210 × 60 × 87.3
Plate-type battery chillerVolume (L × D × H)mm × mm × mm101 × 61 × 49.8
Table 2. Test conditions of the air-conditioning system in electric vehicle.
Test
Parameter
ModeRefrigerant Charge
(kg)
Evaporator Coolant
Temperature (°C)
Evaporator Coolant Flow Rate (LPM)Condenser Coolant
Temperature (°C)
Condenser Coolant Flow Rate (LPM)HVAC
Fan
Voltage
(V)
Compressor Capacity
(%)
Charge
test
Heating mode0.55–0.754010--1680
Cooling mode0.8–1.2--30101680
Battery-cooling mode0.6–1.0301030101680
Compressor loadHeating mode0.73010--1630~80
Cooling mode0.9--30101630~80
Battery-cooling mode0.9301030101630~80
HVAC
flow rate
Heating mode0.73010--9~1650
Cooling mode0.9--30109–1650
Coolant
temperature
Heating mode0.720~4010--1250
Cooling mode0.9--20~40101250
Battery-cooling mode0.9301020~3010-50
Coolant
flow rate
Heating mode0.7305~15--1250
Cooling mode0.9--305~151250
Battery-cooling mode0.93010305~15-50
Disclaimer/Publisher’s Note: The statements, opinions and data contained in all publications are solely those of the individual author(s) and contributor(s) and not of MDPI and/or the editor(s). MDPI and/or the editor(s) disclaim responsibility for any injury to people or property resulting from any ideas, methods, instructions or products referred to in the content.