Article

Polymer-Coated Nanoparticles and Pickering Emulsions as Agents for Enhanced Oil Recovery: Basic Studies Using a Porous Medium Model †

by
Christina Ntente
1,2,
Anastasia Strekla
1,3,
Zacharoula Iatridi
1,2,
Maria Theodoropoulou
1,
Georgios Bokias
1,2 and
Christos D. Tsakiroglou
1,*
1
Foundation for Research and Technology Hellas, Institute of Chemical Engineering Sciences, 26504 Patras, Greece
2
Department of Chemistry, University of Patras, 26504 Patras, Greece
3
Department of Physics, University of Patras, 26504 Patras, Greece
*
Author to whom correspondence should be addressed.
This paper is an extended version of our paper published in IOP Conference Series: Earth and Environmental Science 1123 (2022) 012064, and presented in 3rd International Conference on Environmental Design (ICED2022), Athens, Greece, 22–23 October 2022.
Energies 2023, 16(24), 8043; https://doi.org/10.3390/en16248043
Submission received: 15 November 2023 / Revised: 2 December 2023 / Accepted: 8 December 2023 / Published: 13 December 2023
(This article belongs to the Special Issue Subsurface Energy and Environmental Protection)

Abstract

:
Globally the overall oil recovery factors for primary and secondary recovery range from 35% to 45%, and a tertiary recovery method that can enhance the recovery factor by 10–30% could contribute to the energy supply. The use of nanoparticles in enhanced oil recovery (EOR) processes comprises an emerging and well-promising approach. Polymer-coated nanoparticles (PNPs) were synthesized through the free radical polymerization (FRP) of the monomers 2-acrylamido-2-methyl-1-propanesulfonic acid (AMPSA) and dodecyl methacrylate (DMA) on the surface of acrylic-modified spherical silica nanoparticles. The obtained PNPs were characterized using Attenuated Total Reflectance-Fourier Transform Infrared Spectroscopy (ATR-FTIR) and thermogravimetric analysis (TGA). Dispersions of PNPs were prepared in salt (NaCl, CaCl2) aqueous solutions, the static oil/water interfacial tension were measured using the Du Nouy ring method, and changes caused based on the oil/water contact angle were recorded optically. The PNP dispersions were used to stabilize and characterize shear-thinning oil-in-water Pickering emulsions. The capacity of the PNP dispersions and Pickering emulsions to mobilize the trapped ganglia of viscous paraffin oil, which remained after successive tests of drainage and primary imbibition, was tested with visualization experiments of the secondary imbibition in a transparent glass-etched pore network. The synthesized SiO2-P(AMPSA-co-DMA) nanoparticles were stable even at high temperatures (~200–250 °C) and displayed excellent stability in aqueous dispersions at high ionic strengths with the presence of divalent cations, and their dispersions generated stable oil-in-water Pickering emulsions with a shear-thinning viscosity. The oil-recovery efficiency is maximized when the most viscous Pickering emulsion is selected, but if energy cost factors are also taken into account, then the less viscous Pickering emulsion is preferable.

1. Introduction

Inorganic nanoparticles are widely studied and used in many applications due to their characteristics, like small size, large surface area, and high surface energy. For instance, much attention has been paid to the water treatment with the stabilization of metal oxide nanoparticles in an aqueous phase through atom transfer radical polymerization [1] or the development of aerogels and hydrogels from porous metal organic frameworks (MOFs) [2,3]. The use of inorganic nanoparticles in petroleum engineering applications, including enhanced oil recovery (EOR), has attracted scientific interest in recent years [4]. In general, the water flooding processes become more effective when adding in brine chemicals, like alkaline materials, surfactants, and polymers able to control the wettability, the interfacial tension, and viscosity [5]. The use of polymers in reservoirs suffers from chemical and thermal degradation [6]. Moreover, the polymers used in water flooding have very high molecular weights (~10–20 millions Daltons), and their access to the low-permeability zones may be limited [7]. On the other hand, the surfactants may adsorb on the rock surface and lose their effectiveness under high-temperature and high-salinity conditions [8]. The alkali–surfactant–polymer (ASP) flooding is undoubtfully an efficient tertiary oil recovery technique, but it still has some disadvantages, like scaling due to corrosion caused in alkaline conditions, and loss of surfactant and polymer due to their adsorption and degradation, respectively. It has become clear that the effect of the rheological properties of the various additives used in EOR must be taken into account for the selection and design of chemical flooding [9]. Nanotechnology can be used to successfully overcome such problems by developing more cost-effective and environmental-friendly EOR methods [10]. Dispersed nanoparticles are much smaller that the pore sizes in reservoir rocks and can be transported at long distances within their pore space [11]. Furthermore, Pickering emulsions [12] and foams [13] stabilized by nanoparticles can be used as EOR agents. It is widely known that waterflooding with low salinity water (LSW~200–8000 ppm) leads to higher oil production, mainly due to cation exchange with the rock surface, which makes the rock surface more negative and lowers the attractive forces between the solid surface and crude oil [14]. However, at the same time, the LSW flooding causes the release of indigenous particles, their migration through the medium, and formation damage [15]. The use of nanoparticles dispersed in LSW for the modification of the surface charge may prevent the formation damage [16]. During the chemical flooding of residual oil in a glass micromodel, the addition of silica nanoparticles in a polyacrylamide solution was found to increase the polymer viscosity and weaken the negative effect of high salinity on the oil-recovery efficiency [17].
For EOR applications, the colloidal stability of the nanoparticles under “adverse’’ conditions (i.e., high ionic strength, presence of divalent cations, like Ca2+ and Mg2+) is a prerequisite. In order to stabilize the inorganic nanoparticles in high salinity environments and prevent their agglomeration and subsequent precipitation, their surface could be coated with polymers [18,19,20]. Nanoporous graphene/silica nanohybrids have been used to prepare Pickering emulsions with distilled water, n-octane, sodium dodecyl benzene sulfonic acid (SDBS), and 2-propanol co-surfactant at pH = 7 [21]. The emulsions demonstrated excellent properties as agents for chemical flooding and, more specifically, stability at 1% salinity and ambient and reservoir temperatures, whereas the nanohybrids caused a reduction in the interfacial tension and wettability alterations from oil-wet to water-wet. Visualization experiments performed on a three-dimensional transparent porous medium, by injecting nanosized cross-linked polymeric nanoparticles (nanogels), revealed the in situ emulsification of the large trapped ganglia of oil due to the reduction of interfacial tension and the increase in the oil recovery rate [22]. A systematic analysis of the imbibition flow pattern in a large-scale etching model allowed for the plot of the phase diagram for the invasion front governed by the viscosity ratio, injection rate, interfacial tension, and wettability [23]. Polyelectrolytes that are highly soluble in the aqueous phase, regardless of salinity and temperature, have widely been used to modify the surface of silica (SiO2) NPs and stabilize them for a long period [24]. One of these polyelectrolytes is poly(2-acrylamido-2-methyl-1-propanesulfonic acid) (PAMPSA), a hydrophilic, ionic polymer that offers excellent stability to polymer-coated SiO2 NPs [25,26,27,28]. In core flooding tests conducted on real cores, the PNP-enhanced oil recovery increased from 5 up to about 20% [29]. As the NP concentration increases, changes of wettability may increase the EOR efficiency by 20%, but simultaneously, the potential deposition of NPs on the grain surface might reduce the permeability significantly [30], and for this reason, low NP concentrations are preferable.
During the last years, attention has also been paid to the use of hydrolyzed polymeric nanoparticles to enhance the oil-recovery efficiency [31]. Pickering emulsions stabilized by solid particles have demonstrated high stability, low toxicity, controllable rheological properties, and stimuli-responsive behavior, compared to the traditional emulsions emulsified by surfactants, and the design of novel and stable Pickering emulsion systems for EOR, under the harsh conditions of varying pH, high salinity, and high temperature, is a challenge [32]. The Pickering emulsions could be utilized to prevent viscous or capillary fingering and the bypass of trapped oil, particularly with reference to high-viscosity oil reservoirs [33]. The Pickering nanoemulsions prepared from nanoparticles compared to classical nanoemulsions have shown stronger stability against gravity separation, flocculation, Ostwald ripening, and coalescence as the attachment of nanoparticles on the droplet surface weakens the mass transfer of hydrocarbon molecules from the bulk to the droplets [34]. Due to their hydrophilic characteristic, silica nanoparticles are unable to adsorb on oil/water interfaces, and their combination with an oppositely charged surfactant at a specific concentration, along with ultrasonication, seems to be an efficient method to synthesize oil-in-water emulsions [35]. Compared to conventional polymer gels and foams, Pickering emulsions offer superior shear resistance, deeper penetration, and reduced formation damage [36].
More recently, PAMPSA-based co-polymers were synthesized and used for the synthesis of aqueous solutions/dispersions and Pickering emulsions, which were tested as “smart fluids” for the enhanced recovery of n-dodecane from a glass-etched pore network [37]. Specifically, amphiphilic P(AMPSAx-co-AAy-co-DMAz) terpolymers containing the anionic monomer AMPSA, the weakly acidic monomer acrylic acid (AA), and the hydrophobic dodecyl methacrylate (DMA) monomer, respectively, were synthesized. Their self-association behavior in aqueous media, due to their amphiphilic nature, changed the interfacial and wetting properties, while the anionic characteristic of the AMPSA and AA counterbalanced the presence of salt cations. Stable polymer dispersions and Pickering emulsions were prepared and tested as agents for the displacement of residual n-dodecane from the model porous medium, and the EOR efficiency reached 10–18% and 94%, respectively. The use of co-polymers as coatings for the stabilization of silica nanoparticles, the synthesis of Pickering oil-in-water emulsions from such polymer-coated nanoparticles, and the testing of all as EOR agents is a challenge.
In the present study, the surface of SiO2 NPs was modified with the grafting of copolymers AMPSA and DMA through the free radical copolymerization of the monomers AMPSA and DMA on an acrylic-modified silica surface. In this manner, the SiO2-P(AMPSA-co-DMA) PNPs were obtained and characterized to control the effectiveness of grafting. PNP dispersions in NaCl and CaCl2 solutions were prepared and used to stabilize oil-in-water Pickering emulsions. Finally, the PNPs and emulsions were tested as EOR agents for the displacement of a viscous residual oil (paraffin oil) from a glass-etched pore network model. The stabilization of dispersions of polymer-coated silica nanoparticles and Pickering emulsions under high ionic strength and the correlation of their rheological and capillary properties with their capacity to mobilize trapped viscous oil from glass-etched pore networks are the innovative features of the present work. This is the first step of an integrated methodology for the pre-selection of PNP-based fluids for further EOR studies using sandpacks and core plugs so that, in combination with a cost-benefit analysis, a decision can be made regarding their applicability to reservoir rocks.

2. Materials and Methods

2.1. Materials

The monomer 2-acrylamido-2-methyl-1-propanesulfonic acid (AMPSA) and 3-(trimethoxysilyl)-propyl methacrylate (MPS) were purchased from Alfa Aesar (Haverhill, MA, USA). The monomer dodecyl methacrylate (DMA), initiator azobisisobutyronitrile (AIBN), and silicon dioxide nanopowder, 10–30 nm particle size, were obtained from Sigma Aldrich (Steinheim, Germany). The solvents dimethylformamide (DMF), ethanol (EtOH), and toluene were purchased from Fischer (Waltham, MA, USA). In addition, triple distilled water (3DW) and the following chemicals were also used: CaCl2 2H2O (Merck, Darmstadt, Germany), NaCl (Merck, Darmstadt, Germany), MgSO4 7H2O (AnalytiCals Carlo Erba, Milano, Italy), n-dodecane (n-C12) and n-decane (n-C10) (Merck, Darmstadt, Germany), Paraffin oil (LabChem, Zelienople, PA, USA). All reagents and solvents were used as received without any further purification.

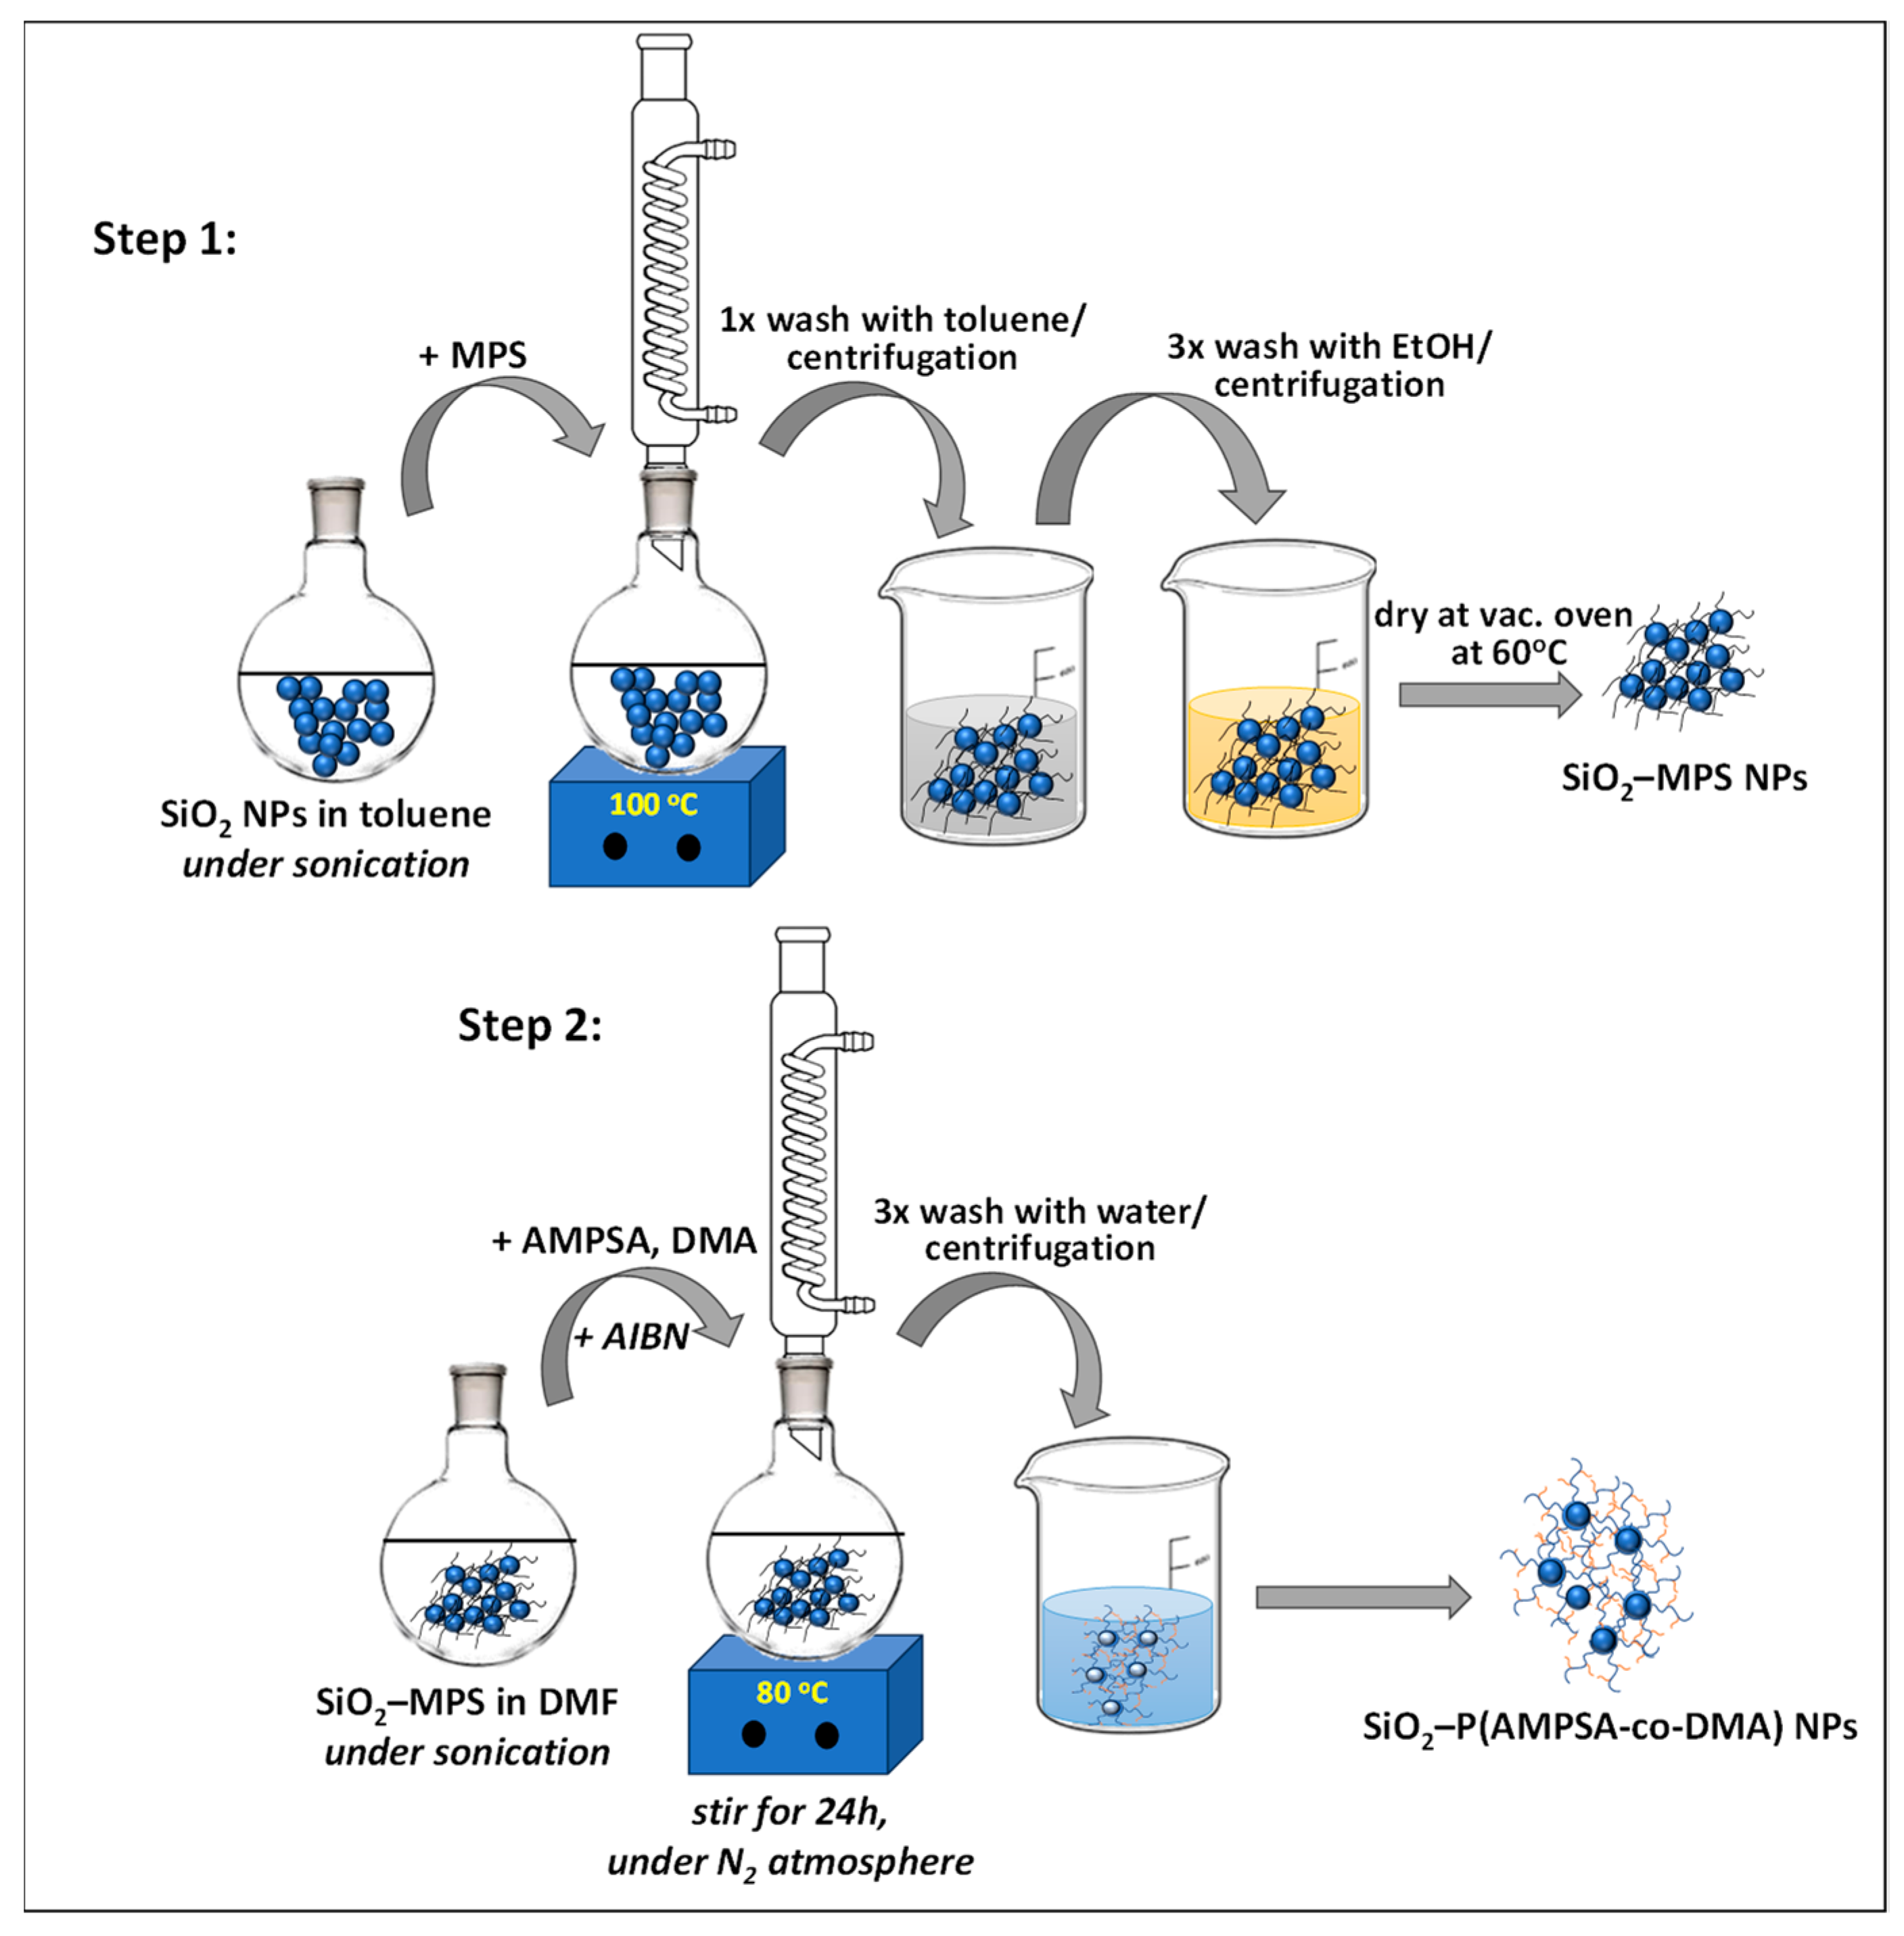
2.2. Functionalization of SiO2 NPs with 3-(trimethoxysilyl)-propyl methacrylate (SiO2-MPS)

More specifically, the –OH groups in the surface of the SiO2 nanoparticles were replaced with functional methacrylate groups via MPS. The attachment of these groups on the silica nanoparticles surface was necessary for the subsequent chemical modifications. In a 500 mL round-bottom flask, 5.5 g of commercial SiO2 NPs was dispersed in 180 mL of toluene, under sonication, and then, 8 mL of MPS was added in the dispersion under vigorous stirring. The system was left under stirring and reflux at 100 °C for 24 h, then cooled down, and the SiO2-MPS NPs were separated with centrifugation at 9000 rpm. The 1st cycle of washing/centrifugation with toluene was followed by 3 cycles of washing/centrifugation with EtOH. The final product was obtained through vacuum-drying in an oven at 60 °C.

2.3. Copolymerization of AMPSA and DMA onto the Modified SiO2-MPS NPs (SiO2-P(AMPSA-co-DMA))

The PNPs were synthesized through surface modification of the MPS-functionalized SiO2 nanoparticles with the growth of polymer chains through surface-initiated free radical polymerization (FRP). Specifically, amphiphilic SiO2/polymer NPs where prepared via FRP of the anionic AMPSA monomer and the hydrophobic co-monomer DMA onto the functionalized with methacrylate functional groups SiO2 NPs, in the presence of the initiator AIBN. In a 250 mL round-bottom flask, 1.25 g of the aforementioned SiO2-MPS NPs was sonicated inside 50 mL of dimethyl formamide (DMF) for 20 min. Then, 11 g of AMPSA monomer dissolved in 50 mL of DMF and 4 mL of DMA were added to the flask containing the SiO2-MPS NP dispersion, and the mixture was stirred under an N2 environment for 20 min. An amount of 55 mg of initiator AIBN was added, and the fluid was left under stirring at 80 °C for 24 h. Afterwards, the system was cooled and centrifuged at 11,000 rpm, and the supernatant was removed. The SiO2-P(AMPSA-co-DMA) NPs were dispersed in water and washed three times, centrifuged at 8500 rpm, and dried in vacuum at 50 °C.
A schematic representation of the two modification steps described in Section 2.2 and Section 2.3 (step 1: functionalization of SiO2 NPs with 3-(trimethoxysilyl)-propyl methacrylate; step 2: copolymerization of AMPSA and DMA onto the modified SiO2-MPS NPs) is provided in Figure 1.

2.4. Characterization of PNPs and Dispersions

The ATR-FTIR spectra were recorded on a Bruker Platinum ATR-FTIR spectrometer (Billerica, MA, USA), while the TGA thermograms were recorded on a Setaram Labsys (Caluire, France) thermogravimetric analyzer (under a nitrogen atmosphere, from 40 to 800 °C, at a heating rate of 20 °C/min). Transmission Electron Microscope (TEM) images were obtained with a JEM-2100 at 120kV at magnifications from 10,000× to 400,000×.
Dispersions of pure SiO2 and SiO2-P(AMPSA-co-DMA) nanoparticles were prepared with sonication at a concentration of 0.1% w/v in distilled water and NaCl solutions at concentrations ranging from 1% to 10% w/v. The stability of aqueous dispersions of bare SiO2 and SiO2-P(AMPSA-co-DMA) nanoparticles was examined by optically inspecting the turbidity and particle sedimentation with time. Static measurements of the surface tension and interfacial tension with n-C10 and paraffin oil were performed on a tensiometer Sigma-702 by using the Du Nouy Ring method. The particle size distribution of PNP dispersions was measured using dynamic light scattering (ζ-nanosizer, MALVERN). The wettability of fluid systems was characterized by placing several drops of aqueous dispersions on a horizontal glass surface of an empty or oil-occupied cell and measuring the contact angle between the aqueous phase air or oil (n-decane, paraffin oil) with the aid of a HY-2307 CMOS camera (Hayear, Shenzhen, China), connected via USB with a PC, and OpenDrop software 3.1.7 [38].

2.5. Synthesis and Characterization of Pickering Emulsions

Oil-in-water Pickering emulsions were prepared by using aqueous dispersions containing SiO2-P(AMPSA-co-DMA) at a concentration of 0.25% w/v and NaCl at 1.0 M or a mixture of NaCl at 0.5 M and CaCl2 at 0.25 M. Each aqueous dispersion was mixed with n-decane at a volume ratio of 2:1, and the mixture was homogenized with agitation for 10 min under an ultrasound probe UP400St (Hielscher Ultrasonics GmbH, Teltow, Germany). The long-term stability of emulsions was examined by detecting the relative volumes of the three phases (oil, water, emulsion) as a function of time. The shear viscosity of emulsions was measured as a function of the shear rate with a cone-and-plate geometry in a stress rheometer (SR-200, Rheometrics) at 25 °C, and the results were fitted with a modified power law model

2.6. Visualization EOR Tests in a Glass-Etched Pore Network

Visualization tests were conducted on a glass-etched pore network (Figure 2a,b). A syringe pump (PHD2000, Harvard Apparatus, Holliston, MA, USA) was used to inject the fluids, and a CCD camera equipped with zoom lenses (AW-E-300/LZ14MD55, Panasonic, Tokyo, Japan) was used to record successive snap-shots of the displacement (Figure 2a). The images were analyzed with ImageJ, and the oil saturation over the central area of the pore network (Figure 2b) was calculated as function of time. The pressure drop across the central area of the model bounded by the four holes (Figure 2b) was measured with two absolute pressure transducers (Figure 2a) using SGM_P 350 mBar (Electronsystems, Bergamo, IT). The fluids were injected through four (4) inlet holes (injection wells) and expelled through four (4) outlet holes (production wells) (Figure 2b). For each system, a cycle of primary drainage (oil displaces brine), primary imbibition (brine displaces residual oil), and secondary imbibition (PNP-dispersion or the emulsion displaces residual oil) was carried out, where each displacement step started at the point that the previous step stopped, so that a continuous saturation history was recorded. Paraffin oil colored with oil red (concentration = 1500 ppm) was selected as the model viscous oil phase. Aqueous solutions of 1 M NaCl or 0.5 M NaCl /0.25 M CaCl2were used as brines in drainage and primary imbibition tests. The corresponding dispersions of SiO2-P(AMPSA-co-DMA) at a concentration of 0.25% w/v, as well as their Pickering emulsions with n-decane, were used as the displacing fluids in secondary imbibition tests.

3. Results and Discussion

3.1. Physicochemical Properties of PNPs

The purpose was to develop stable composite silica-polymer nanoparticles in aqueous or salt solutions. To this end, initially, polymerizable groups needed to be attached on the surface of SiO2 nanoparticles, enabling these to copolymerize with the desired monomers through free radical polymerization (FRP). The pathways for the synthesis of the MPS-modified SiO2-MPS NPs and the polymer coated SiO2-P(AMPSA-co-DMA) NPs are shown in Figure 3a,b. First, the modification of the SiO2 nanoparticle surface with the silane-coupling reagent 3-(trimethoxysilyl)-propyl methacrylate (MPS) took place (Figure 3a). This way, the NP surface is decorated with functional methacrylate groups, necessary during the subsequent polymerization step. In this step, the composite SiO2 NPs with a polymer-decorated surface were obtained through copolymerization of the monomers AMPSA and DMA on the SiO2-MPS NPs, via FRP (Figure 3b).
The MPS-modified and polymer-modified SiO2 NPs were characterized using techniques, like ATR-FTIR and TGA. The chemical composition of bare SiO2 and MPS-functionalized nanoparticles was evaluated via ATR-FTIR. The ATR-FTIR spectra are presented in Figure 4a. For the two spectra, absorption peaks appear at 1095 and 465 cm−1 and are assigned to the asymmetric stretching vibration of the Si-O-Si groups of silica. In addition, a peak at around 955 cm−1 reflects the vibration of the Si-OH groups of silica. Two new important bands appear in the spectrum of the SiO2 -MPS NPs, which are due to the structure of the MPS modifier. These bands are at 1715 cm−1, which corresponds to the axial deformation of the C=O group, and at 1640 cm−1, corresponding to the axial deformation of the C=C terminations. These two bands verify the modification of the surface of the SiO2 NPs via MPS [39,40,41,42].
The thermogravimetric analysis (TGA) of bare silica, SiO2-MPS, and SiO2-P(AMPSA-co-DMA) particles is shown in Figure 4b. With a mass loss of only ~2% at 700 °C, it is clear that the bare silica particles show excellent thermal stability. A horizontal weight loss curve is seen, indicating the absence of organic impurities in the particles. The modified SiO2-MPS NPs exhibit a weight loss of ~12%, over the range 200–700 °C, due to the thermal decomposition of the organic MPS layer. The high temperature (~350 °C) required to decompose and evaporate the organic content of the modified silica particles demonstrates that the silane-coupling agent MPS is strongly bound to the particle surface, and one can expect a covalent bond. As for the SiO2-P(AMPSA-co-DMA) NPs, initially, a mass loss (for T ≤ 200 °C) can be observed, which involves the evaporation of residual solvent and adsorbed water. After that, it can be seen that for temperatures above 250 °C, thermal decomposition of the organic P(AMPSA-co-DMA) copolymer layer takes place. A higher weight loss of ~25% is displayed for the SiO2-P(AMPSA-co-DMA) NPs, over the temperature range 200–700 °C. This finding suggests that the polymerization of the AMPSA and DMA monomers onto the SiO2 surface was successful [43,44,45]. The fact that the decomposition of the organic NP coating takes place after 250 °C indicates that the SiO2-P(AMPSA-co-DMA) NPs remain stable even at high temperatures, which are higher than those prevailing at oil reservoirs (<150 °C) [46].
The morphology of bare SiO2 nanoparticles and the composite SiO2 particles modified by polymer chains was investigated via TEM, as shown in Figure 5. Figure 5a reveals that the bare silica particles with an effective average diameter of 20 nm are weakly dispersed and have a few aggregates. In Figure 5b, a thick polymer layer on the surface of the silica particles can be seen, indicating that AMPSA and DMA have successfully been polymerized onto the surface of SiO2 modified with C=C double bonds.

3.2. Stability of PNP Dispersions

The stabilization of the purchased SiO2 and synthesized SiO2-P(AMPSA-co-DMA) NPs was explored in the presence of electrolytes. The unsalted dispersion of pure SiO2 was stable, but with the addition of NaCl, after 2 h, sedimentation occurred, and the nanoparticles started to aggregate and precipitate (Figure 6a). Regarding the stability of SiO2-P(AMPSA-co-DMA) NPs in aqueous phase, the dispersions were greyish, and no NP precipitation was observed 6 h after their storage (Figure 6b), indicating that the successful polymerization of the AMPSA and DMA monomers onto the silica surface acted as an effective coating that offered NP stability in aqueous media, with or without the presence of salts. It is worth mentioning that the dispersions lost part of their stability after 24 h of storage, and this is evident by a small content of NPs that had precipitated at the bottom of the glass vials (Figure 6b).

3.3. Interfacial Properties and Wettability of PNP Dispersions

The number-based diameter distribution of the PNP in the two brines was measured based on dynamic light scattering (Figure 7a,b). Evidently, the functionalization of SiO2 NPs (10–30 nm) with polymer coatings led to an increase in their size by almost one order of magnitude (Figure 7).
Both the surface tension and n-C10/water interfacial tension are reduced respectably with the presence of PNPs, which is an indication of the capacity of PNPs to adsorb onto the interfaces and stabilize Pickering foams and emulsions (Table 1). On the other hand, the paraffin oil/water interfacial tension changes mildly when the PNP is added to the solution (Table 1), indicating that the in situ emulsification of paraffin oil mediated by PNP dispersions is not favored. Photos of drops of PNP dispersions surrounded by air or n-C10/paraffin oil are shown in Table 2 along with the statistical moments of the contact angle measurements. The contact angle is almost insensitive to the PNP concentration in distilled water (Table 2). The contact angle has the tendency to increase with the salt concentration almost increasing for all cases (Table 2), and the glass surface seems to be more water-wet to the PNP dispersion in 1.0 M NaCl than to the PNP in 0.5 M NaCl /0.25 M CaCl2 (Table 2).

3.4. Stability of Pickering Emulsions

In the short term, the emulsions are stable, but with regard to their long-term stability, it seems that after 20 days, almost 30% of the aqueous phase was separated (Figure 8a,b), after 50 days, the emulsion volume was reduced by 50% (Figure 8a,b), and thereafter, in the one case, the emulsion remained stable (Figure 8a), while in the other case a linear decrease in the emulsion volume occurred due to water evaporation (Figure 8b).

3.5. Rheology of Pickering Emulsions

The measured shear viscosity of emulsions was fitted with the modified power law fluid model [37]:
μ = μ i n f + μ 0 μ i n f γ ˙ n 1
where γ ˙ is the shear rate (s−1), μ i n f is the asymptotic viscosity at the limit γ ˙ , μ 0 is the viscosity at γ ˙ = 1.0 , and n is a power law exponent ( n < 1 ). As the μ 0 ,   μ i n f increases, the fluid becomes more viscous, while as the exponent n decreases, the viscosity drops more rapidly with the shear rate increasing. For the emulsion prepared using SiO2-P(AMPSA-co-DMA) NPs in 1 M NaCl, the viscosity drops very rapidly to a relatively low value (Figure 9a). Comparatively, the emulsion prepared using SiO2-P(AMPSA-co-DMA) NPs in 0.5 M NaCl/0.25 M CaCl2 appears to be a more compact structure with the viscosity decreasing more slowly, reaching an asymptotic value that is one order of magnitude higher than that of the previous emulsion (Figure 9b). As the shear rate increases, the distances between the droplets increase and their resistance to the flow of the continuous aqueous phase weakens. It seems that the higher ionic strength, due to the presence of divalent ions, increases the size of droplets [37] and enhances their resistance to water flow, so that the rate of the viscosity reduction decreases, and this is evident from the higher value of the power law exponent (Figure 9a,b).

3.6. Flow of Shear-Thinning Fluid through a Pore

To calculate the flow velocity u p of non-Newtonian fluids through pores with an arbitrary shape of the cross-section, the Rabinowitch–Mooney approximate analysis [47,48] can be followed, where a momentum balance averaged over the entire cross-section results in the following:
2 u p r H = 1 a τ w b / a 0 τ w τ b / a μ d τ
where τ w is the wall shear stress averaged over the pore-wall perimeter, r H is the hydraulic radius defined as the ratio of the cross-section area to perimeter length of the pore, and a , b are two shape factors depending on the pore shape ( a = 1/4, b = 3/4 for circular pores, a = 1/2, b = 1 for slit-shaped pores). For elliptical pores of the minor axis D p , and major axis, W p , we have [48] the following:
a = π 2 1 + ξ 2 32 E 0 1 ξ 2 , π / 2
b = 3 π 2 1 + ξ 2 32 E 0 1 ξ 2 , π / 2
where, ξ is the pore aspect ratio and E 0 is an incomplete elliptical integral of the second kind, given by the following:
ξ = D p W p
E 0 1 ξ 2 , π / 2 = π 2 1 j 1 1 ξ 2 j 2 j 1 2 j 1 ! 2 j ! 2
while the hydraulic radius is calculated as
r H = π D p 8 E 0 1 ξ 2 , π / 2
The flow velocity of a purely power law fluid ( μ i n f 0 )   through pores is related to the pressure drop across the pore length according to [47,48]:
u p = r H 2 a n 3 n + 1 r H μ 0 d P d x 1 / n
The corresponding relation for Newtonian fluids states:
u p = r H 2 8 a μ e f f d P d x
By combining Equation (8) with Equation (9) the effective viscosity for power-law fluids is defined:
μ e f f = r H u p 1 n 2 a 3 n + 1 n n μ 0 8 a

3.7. Immiscible Displacement in the Pore Network

The experimental conditions along with the results of displacement tests conducted on the glass micromodel are shown in Figure 10 and Figure 11 and summarized in Table 3. It is worth mentioning that a relatively low EOR efficiency was achieved with the PNP dispersion (Table 3, Figure 10a and Figure 11a) compared with the significant EOR efficiency achieved by injecting Pickering emulsions (Table 3, Figure 10c and Figure 11c) and the moderate EOR efficiency achieved by injecting the mixture of the dispersion and emulsion (Table 3, Figure 11e).
When the dispersion of a low PNP concentration is injected, the viscosity of the injected aqueous phase does not differ from that of water, and the resistance displayed by the trapped viscous oil is still quite large. On the other hand, the decrease in interfacial tension (Table 1) and the increase in the contact angle (Table 2) weaken the capillary resistance on the downstream front of trapped oil ganglia [49] and may facilitate the detachment of small ganglia and their motion along the flow direction (Figure 12a and Figure 13a). However, the changes in the capillary properties are not very large, and no significant viscous force is applied along the injected fluid, and hence, there is a high probability for these moved ganglia, after having travelled a short distance along the flow direction, to coalescence with larger ones downstream and become trapped again. In this manner, only a small percentage of residual oil is finally displaced (Figure 10a, Figure 11a, Figure 12a and Figure 13a, Table 3). The aforementioned ganglia release and entrapment events are reflected by the spatial redistribution of the local fluid saturation without causing significant changes to the total oil saturation (Figure 10a and Figure 11a), while low-amplitude oscillations are evident on the measured pressure drop during the secondary imbibition (Figure 10b and Figure 11b). In general, such oscillations of the pressure drop have been correlated with wettability [50] and the pore space structure [51]. It is observed that the EOR efficiency is higher for dispersion 1 (Figure 10a and Figure 11a, Table 3), where low capillary pressures and frequent release–entrapment events are evident (Figure 10b and Figure 11b).
As the high-viscosity emulsion is injected, the viscous forces prevail against the capillary ones, and the trapped oil starts to be displaced from the low-hydraulic-resistance areas, which are swept first (Figure 12b and Figure 13b,c). As an area is swept by the emulsion, some amount of oil remains within the pores (Figure 12b and Figure 13b,c), the aqueous phase of the emulsion gradually disperses throughout the pore network, while locally, oil droplets accumulate in pore areas partially occupied by residual oil, and pore blockage may occur. Under such conditions, higher inlet pressure is required to keep the influx rate constant, so that the pressure drop starts increasing, until the blocked pores are released, and then decreases rapidly. These successive blockingrelease events may temporarily result in very-high-amplitude oscillations of the pressure drop (Figure 10d and Figure 11d,f), a phenomenon that deserves a more extensive analysis and interpretation [52]. At the same time, the residual oil displacement becomes very efficient (Figure 10c and Figure 11c, Table 3). When the mixture of the PNP dispersion and Pickering emulsion is injected at constant influx rates, both aforementioned flow patterns are observed (Figure 13c), the oil-recovery efficiency is moderate (Figure 11e, Table 3), and the amplitude of the pressure-drop oscillations decreases (Figure 11f).

3.8. Two-Phase Flow Patterns

A quantitative interpretation of the observed two-phase flow patterns relies on the calculation of some dimensionless numbers, like the capillary number, C a , and viscosity ratio, κ , defined by [53,54] as follows:
C a = u 0 μ i n j σ o w
κ = μ i n j μ d i s p
respectively, and where μinj and μdisp are the viscosities of the injected (invader) and displaced (defender) fluid, σ o w is the oil/water interfacial tension, and u 0 is the mean superficial flow velocity in the pore network defined as
u 0 = Q A
Q is the volumetric flow rate, and A = W L p is a conventional cross-section area of the porous medium ( W = 0.10 m is the width of pore network, and L p = 1.84 mm is the pore length). The ratio of viscous to capillary forces at the pore-scale is governed by the pore capillary number, C a L 1 while at the network-scale, it is governed by the network capillary number, C a L N , [54] defined as
C a L 1 = f C a
C a L N = C a L 1 L N / L P
f = L P r H k
where f is a dimensionless ratio, L N is the network length ( L N = 0.14 m), and k the absolute permeability of the porous medium ( k = 20.5 Da). Due to the variation in the viscosity of shear-thinning fluids from the pore-level to network-scale, a value of viscosity averaged over the pore cross-section, μ , can be calculated with the following relationship:
μ = μ i n f + μ 1 μ i n f n γ ˙ w n 1
where γ ˙ w is the shear rate averaged over the perimeter of the pore cross-section, which for purely power-law fluids is given by the following:
γ ˙ w = 2 u p r H b n + a n
while the mean pore velocity and volumetric porosity are defined as
u p = u 0 φ V
φ V = π W p D p 4 L p 2
respectively.
The mean pore width and depth are W p = 774   μ m , D p = 125   μ m , while the corresponding parameter values calculated using Equations (3)–(7) and (16) are as follows: r H = 47.2   μ m ,   a = 0.2925 ,   b = 0.8775 ,   f = 4.2365 × 10 3 . In addition, the shear-thinning parameters calculated using Equations (10), (17), and (18) are as follows: μ e f f = 0.01805 Pa s, μ = 0.05367 Pa s, γ ˙ w = 108.35 s−1 for emulsion 1; μ e f f = 0.03795 Pa s, μ = 0.07814 Pa s, γ ˙ w = 53.55 s−1, for emulsion 2.
With the aid of Equations (11)–(20), the conventional dimensionless numbers were calculated for each displacement (Table 4). When the NP dispersion was injected in the secondary imbibition test, the much less than unity values of the viscosity ratio and capillary number at all length-scales (Table 4) are reflected by the capillary fingering transient pattern (Figure 12a and Figure 13a) [53,54]. On the other hand, when emulsions are used as invaders in secondary imbibition tests, the high values of the viscosity ratio and capillary number at the network scale (Table 4) are reflected by the frontal drive pattern (Figure 12b and Figure 13b) [53,55]. When both fluids (emulsion and NP dispersion) are injected, the flow pattern is dominated by frontal drive and capillary fingering (Figure 13c) leading to a lower displacement efficiency compared to the cases when only the emulsion was used (Table 3). Moreover, the simultaneous injection of two fluids with completely different rheological behavior results in a mixed pattern consisting of the superposition of the two individual patterns. Earlier studies focusing on the immiscible displacement of shear-thinning fluids revealed that the macroscopic transient patterns identified for Newtonian fluids are still valid [55], while non-uniform interfacial configurations, associated with viscosity changes at the pore level, were observed at the micro-scale [56].
It is worth mentioning that identical polymer-coated nanoparticles and Pickering emulsions could also be regarded as agents for the in situ remediation of oil-contaminated soils [57].

3.9. Energy Efficiency of Secondary Imbibition

In order to evaluate the energy efficiency of the various secondary displacement tests, except for the oil-recovery efficiency, we have to account for the relevant energy consumption. During a flow process, the instantaneous loss of mechanical energy is proportional to the pressure drop, and a simple way to estimate the total energy consumed during an immiscible displacement test is to calculate the integral:
E d = t = 0 t = t d Δ P t Q t d t = Q t = 0 t = t d Δ P t d t
while the time averaged power required for the displacement is given by the following:
P d = E d t d
where t d is the duration of the test. To evaluate the energy efficiency of the secondary displacement tests, the oil removal efficiency per unit of consumed power is defined by the following:
E E = R e f f P d
Based on the transient responses of the pressure drop measured across the visualized area of the porous medium (Figure 10b,d and Figure 11b,d,f) the energy efficiencies were calculated using Equations (21)–(23), and the results are shown in Table 5.
Based on both values of E E and R e f f (Table 5), we can classify the various fluids according to the following ranking: Emulsion 1 > Emulsion 2 > Dispersion 1 > Emulsion 2 + Dispersion 2 > Dispersion 2. Of course, several cost factors, like the energy consumed for the generation of emulsions or the cost of chemicals and energy consumed for the synthesis of NPs, were ignored for the sake of clarity and simplicity.

4. Conclusions

Polymer-coated nanoparticles (PNPs) were prepared by grafting copolymers of hydrophilic AMPSA and hydrophobic DMA onto the appropriately modified surface of silica nanoparticles. PNP dispersions in aqueous solutions of salts (NaCl, CaCl2) were prepared, and their stability, interfacial properties, and wettability were investigated. An ultrasound probe was used to prepare Pickering oil-in-water emulsions by mixing PNP dispersions and n-decane, and the long-term stability of emulsions along with their rheological properties were recorded. Immiscible displacement tests were performed on a glass-etched pore network where the PNP dispersions and emulsions were evaluated with respect to the recovery efficiency of paraffin oil, trapped in the pore network, after a drainage–primary imbibition cycle. The most important conclusions are outlined below.
  • The surfaces of SiO2 NPs were coated with the polymer through the copolymerization of the monomers AMPSA and DMA on the SiO2-MPS NPs, via free radical polymerization.
  • SiO2-P(AMPSA-co-DMA) NPs remain stable even at high temperatures (~200–250 °C), which are higher than those prevailing at an oil reservoir (<150 °C).
  • SiO2-P(AMPSA-co-DMA) NPs demonstrated excellent stability in salt solutions at a high ionic strength.
  • SiO2-P(AMPSA-co-DMA) NPs dispersed in salt solutions result in stable oil-in-water Pickering emulsions with a power law shear-thinning rheology.
  • The injection of SiO2-P(AMPSA-co-DMA) NP dispersions facilitates successive events of ganglia mobilization and coalescence that lead to fluid redistribution and a weak-to-moderate increase in the oil recovery.
  • The higher ionic strength and presence of divalent ions lead to larger oil droplet sizes and more viscous Pickering emulsions, which are able to attain a higher oil-recovery efficiency.
  • As one goes from PNP dispersions to Pickering emulsions, the increase in the capillary number and viscosity ratio favor the transition of the flow pattern from capillary fingering to frontal drive and a higher oil-recovery efficiency.
  • In terms of the oil-recovery efficiency, the most viscous Pickering emulsion is selected, but in terms of energy efficiency, the less viscous Pickering emulsion is preferable.

Author Contributions

Conceptualization, C.D.T. and G.B.; methodology, C.D.T. and M.T.; formal analysis, C.D.T. and A.S.; validation, C.N. and A.S.; investigation, C.N., A.S., and Z.I.; data curation, C.D.T. and M.T..; resources, C.N. and Z.I.; writing—original draft preparation, C.D.T.; supervision, C.D.T. and G.B.; data processing, C.N., A.S., and Z.I.; visualization, C.N. and A.S.; project administration, C.D.T. and M.T.; funding acquisition, C.D.T. All authors have read and agreed to the published version of the manuscript.

Funding

The research project was supported by the Hellenic Foundation for Research and Innovation (H.F.R.I.) under the “1st Call for H.F.R.I. Research Projects to support Faculty members and Researchers and the procurement of high-cost research equipment” (Project Number: HFRI-FM17-361, Title: Enhanced oil recovery by polymer-coated nanoparticles, Acronym: EOR-PNP).

Data Availability Statement

The data are available on reasonable request from the corresponding author.

Conflicts of Interest

The authors declare no conflict of interest.

References

  1. Golas, P.L.; Louie, S.; Lowry, G.V.; Matyjaszewski, K.; Tilton, R.D. Compartive study of polymeric stabilizers for magnetic nanoparticles using ATRP. Langmuir 2010, 26, 16890–16900. [Google Scholar] [CrossRef]
  2. Wang, L.; Xu, H.; Gao, J.; Yao, J.; Zhang, Q. Recent progress in metal-organic frameworks-based hydrogels and aerogels and their applications. Coord. Chem. Rev. 2019, 398, 213016. [Google Scholar] [CrossRef]
  3. Wu, Y.; Li, Y.; Zhao, T.; Wang, X.; Isaeva, V.I.; Kustov, L.M.; Yao, J.; Gao, J. Bimetal-organic framework-derived nanotube@cellulose aerogels for peroxymonosulfate (PMS) activation. Carbohydr. Polym. 2022, 296, 119969. [Google Scholar] [CrossRef]
  4. Wei, Β.; Li, Q.; Ning, J.; Wang, Y.; Sun, L.; Pu, W. Macro- and micro-scale observations of a surface-functionalized nanocellulose based aqueous nanofluids in chemical enhanced oil recovery (C-EOR). Fuel 2019, 236, 1321–1333. [Google Scholar] [CrossRef]
  5. Husein, N.; Yunan, M.H.; Ismail, I.; Wan Sulaiman, W.R.; Boyou, N. Enhanced Oil Recovery by Alkaline-Surfactant-Polymer Alternating with Waterflooding. Chem. Eng. Transact. 2018, 63, 823–828. [Google Scholar]
  6. Levitt, D.B.; Pope, G.A. Selection and Screening of Polymers for Enhanced-Oil Recovery. In Proceedings of the SPE Symposium on Improved Oil Recovery, Tulsa, OK, USA, 20–23 April 2008. [Google Scholar] [CrossRef]
  7. Al-Shakry, B.; Shiran, B.S.; Skauge, T.; Skauge, A. Polymer Injectivity: Influence of Permeability in the Flow of EOR Polymers in Porous Media. In Proceedings of the SPE Europec featured at 81st EAGE Conference and Exhibition, London, UK, 3–6 June 2019. [Google Scholar] [CrossRef]
  8. Puerto, M.; Hirasaki, G.J.; Miller, C.A.; Barnes, J.R. Surfactant Systems for EOR in High-Temperature, High-Salinity Environments. SPE J. 2011, 17, 11–19. [Google Scholar] [CrossRef]
  9. Machale, J.; Majumder, K.S.; Ghosh, P.; Sen, T.K. Role of chemical additives and their rheological properties in enhanced oil recovery. Rev. Chem. Eng. 2020, 26, 789–830. [Google Scholar] [CrossRef]
  10. Sircar, A.; Rayavarapu, K.; Bist, N.; Yadav, K.; Singh, S. Applications of nanoparticles in enhanced oil recovery. Petrol. Res. 2022, 7, 77–90. [Google Scholar] [CrossRef]
  11. Ponnapati, R.; Karazincir, O.; Dao, E.; Ng, R.; Mohanty, K.K.; Krihnamoorti, R. Polymer-functionalized nanoparticles for improving waterfllod sweep effciiency: Characterization and transport properties. Ind. Eng. Chem. Res. 2011, 50, 13030–13036. [Google Scholar] [CrossRef]
  12. Liu, L.; Pu, X.; Tao, H.; Chen, K.; Guo, W.; Luo, D.; Ren, Z. Pickering emulsion stabilized by organoclay and interediately hydrophobic nanosilica for high temperature conditions. Coll. Surf. A Physicochem. Eng. Asp. 2021, 610, 125694. [Google Scholar] [CrossRef]
  13. Harati, S.; Bayat, A.E.; Sarvestani, M.T. Assessing the effects of different gas types on stability of SiO2 nanopartciles foam for enhanced oil recovery purpose. J. Mol. Liq. 2020, 313, 113521. [Google Scholar] [CrossRef]
  14. Morrow, N.R.; Buckley, J. Improved oil recovery by low salinitywaterflooding. J. Petrol. Technol. 2011, 63, 106–112. [Google Scholar] [CrossRef]
  15. Yuan, H.; Shapiro, A.A. Induced migration of fines during waterlooding in communicating layer-cake reervoirs. J. Petrol. Sci. Eng. 2011, 78, 618–626. [Google Scholar] [CrossRef]
  16. Arab, D.; Pourafshary, P. Nanoparticles-assisted surface charge modification of the porous medium to treat colloidal particles migration induced by low salinity water flooding. Coll. Surf. A Physicochem. Eng. Asp. 2013, 436, 803–814. [Google Scholar] [CrossRef]
  17. Maghzi, A.; Kharrat, R.; Mohebbi, A.; Ghazanfari, M.H. The impact of silica nanoparticles on the performance of polymer solution in presence of salts in polymer flooding for heavy oil recovery. Fuel 2014, 123, 123–132. [Google Scholar] [CrossRef]
  18. ShamsiJazeyi, H.; Miller, C.A.; Wong, M.S.; Tour, J.M.; Verduzco, R. Polymer-coated nanoparticles for enhanced oil recovery. J. Appl. Polym. Sci. 2014, 131, 123–132. [Google Scholar] [CrossRef]
  19. Hu, X.; Ke, Y.; Zhao, Y.; Yu, C.; Lu, S.; Peng, F. Preparation and properties of nanocomposites of β-cyclodextrin- functionalized polyacrylamide and its application for enhancing oil recovery. RSC Adv. 2018, 8, 30491–30501. [Google Scholar] [CrossRef]
  20. Gbadamosi, A.O.; Junin, R.; Manan, M.A.; Yekeen, N.; Agi, A.; Oseh, J.O. Recent advances and prospects in polymeric nanofluids application for enhanced oil recovery. J. Ind Eng. Chem. 2018, 66, 1–19. [Google Scholar] [CrossRef]
  21. Tabar, M.A.; Alaei, M.; Bazmi, M.; Khojasteh, R.R.; Koolivand-Salooki, M.; Motiee, F.; Rashidi, A.M. Facile and economical preparation method of nanoporous graphene/silica nanohybrid and evaluation of its Pickering emulsion properties for chemical enhanced oil recovery (C-EOR). Fuel 2017, 206, 453–466. [Google Scholar]
  22. Zhang, Y.; Geng, J.; Liu, J.; Bai, B.; He, X.; Wei, M.; Deng, W. Direct Pore-Level Visualization and Verification of In Situ Oil-in-Water Pickering Emulsification during Polymeric Nanogel Flooding for EOR in a Transparent Three-Dimensional Micromodel. Langmuir 2021, 37, 13353–13364. [Google Scholar] [CrossRef]
  23. Chen, X.; Li, Y.; Liu, Z.; Trivedi, J.; Tang, Y.; Sui, M. Visualized investigation of the immiscible displacemnet: Influencing factors, improved method, and EOR effect. Fuel 2023, 331, 125841. [Google Scholar] [CrossRef]
  24. Haruna, M.A.; Gardy, J.; Yao, G.; Hu, Z.; Hondow, N.; Dongsheng, W.D. Nanoparticle modified polyacrylamide for enhanced oil recovery at harsh conditions. Fuel 2020, 268, 117186. [Google Scholar] [CrossRef]
  25. Ranka, M.; Brown, P.; Hatton, T.A. Responsive Stabilization of Nanoparticles for Extreme Salinity and High Temperature Reservoir Applications. ACS Appl. Mater. Interfaces 2015, 7, 19651–19658. [Google Scholar] [CrossRef]
  26. Lee, J.; Moesari, E.; Dandamudi, C.B.; Beniah, G.; Chang, B.; Iqbal, M.; Fei, Y.; Zhou, N.; Ellison, C.J.; Johnston, K.P. Ultra-Stable Silica Nanoparticles as Nano-plugging Additive for Shale Exploitation in Harsh Environments. Macromolecules 2019, 50, 7699–7711. [Google Scholar] [CrossRef]
  27. Wu, Y.; Wang, Z.; Zhang, T.; Bai, Y.; Wang, P.; Luo, P.; Gou, S.; Guo, Q. Poly(2-acrylamide-2-methylpropanesulfonic acid)-modified SiO2 nanoparticles for water-based drilling fluids. Ind. Eng. Chem. Res. 2016, 56, 168–174. [Google Scholar] [CrossRef]
  28. Park, H.; Lim, H.S.; Yang, J.; Kwak, C.; Kim, J.; Kim, J.; Choi, S.S.; Kim, C.B.; Lee, J. A Systematic Investigation on the Properties of Silica Nanoparticles “Multipoint”-Grafted with Poly(2-acrylamido-2-methylpropanesulfonate-co-acrylic Acid) in Extreme Salinity Brines and Brine-Oil Interfaces. Langmuir 2020, 36, 3174–3183. [Google Scholar] [CrossRef]
  29. Hendraningrat, L.; Torsaeter, O. A Stabilizer that Enhances the Oil Recovery Process Using Silica-Based Nanofluids. Transp. Porous Media 2015, 108, 679–696. [Google Scholar] [CrossRef]
  30. Ehtesabi, H.; Ahadia, M.M.; Taghikhani, V.; Ghazanfari, M.H. Enhanced Heavy Oil Recovery in Sandstone Cores Using TiO2 Nanofluids. Energy Fuels 2013, 28, 423–430. [Google Scholar] [CrossRef]
  31. Yadav, U.S.; Kumar, H.; Roy, V.; Juyal, S.; Tripathi, A.; Shanker, A. Experimental evaluation of partially hydrolyzed polyacrylamide and silica nanoparticles solutions for enhanced oil recovery. J. Pet. Explor. Prod. Technol. 2020, 10, 1109–1114. [Google Scholar] [CrossRef]
  32. Liu, J.X.; Zhu, H.J.; Wang, P.; Pan, J.M. Recent studies of Pickering emulsion system in petroleum treatment: The role of particles. Petrol. Sci. 2021, 18, 1551–1563. [Google Scholar] [CrossRef]
  33. DiCarlo, D.A.; Aminzadeh, B.; Roberts, M.; Chung, D.H.; Bryant, S.L.; Huh, C. Mobility control through spontaneous formation of nanoparticle stabilized emulsions. Geopys. Res. Lett. 2011, 38, 1–5. [Google Scholar] [CrossRef]
  34. Ding, B.; Ahmadi, S.H.; Babak, P.; Bryant, S.L.; Kantzas, A. On the Stability of Pickering and Classical Nanoemulsions: Theory and Experiments. Langmuir 2023, 39, 6975–6991. [Google Scholar] [CrossRef]
  35. Arab, D.; Kantzas, A.; Bryant, S.L. Nanoparticle stabilized oil in water emulsions: A critical review. J. Pet. Sci. Eng. 2018, 163, 217–242. [Google Scholar] [CrossRef]
  36. Yousufi, M.M.; Dzulkarnain, I.B.; Mohyaldinn Elhaj, M.E.; Ahmed, S. A perspective on the prospect of Pickering emulsion in reservoir conformance control with insight into the influential parameters and characterization techniques. Processes 2023, 11, 2672. [Google Scholar] [CrossRef]
  37. Ntente, C.; Iatridi, Z.; Theodoropoulou, M.; Bokias, G.; Tsakiroglou, C. Anionic amphiphilic copolymers as potential agents for enhanced oil recovery. React. Funct. Polym. 2023, 184, 105521. [Google Scholar] [CrossRef]
  38. Berry, J.D.; Neeson, M.J.; Dagastine, R.R.; Chan, D.Y.C.; Tabor, R.F. Measurment of surface and interfacial tension using pendant drop tensiometry. J. Colloid Interface Sci. 2015, 454, 226–237. [Google Scholar] [CrossRef]
  39. Pantoja, M.; Díaz-Benito, B.; Velasco, F.; Abenojar, J.; Del Real, J.C. Analysis of hydrolysis process of γ-methacryloxypropyltrimethoxysilane and its influence on the formation of silane coatings on aluminum alloy. Appl. Surf. Sci. 2009, 255, 6386–6390. [Google Scholar] [CrossRef]
  40. Zhang, H.; Li, C.; Guo, J.; Zang, L.; Luo, J. In Situ Synthesis of Poly(methyl methacrylate)/SiO2 Hybrid Nanocomposites via “Grafting Onto” Strategy Based on UV Irradiation in the Presence of Iron Aqueous Solution. J. Nanomater. 2012, 2012, 217412. [Google Scholar] [CrossRef]
  41. Kunst, S.R.; Beltrami, L.V.R.; Cardoso, H.R.P.; Santana, J.A.; Sarmento, V.H.V.; Muller, I.L.; Malfatti, F. Characterization of siloxane-poly(methyl methacrylate) hybrid films obtained on a tinplate substrate modified by the addition of organic and inorganic acids. Mater. Res. 2015, 201518, 151–163. [Google Scholar] [CrossRef]
  42. Lopes, I.M.F.; Abersfelder, K.; Oliveira, P.W.; Mousavi, S.H.; Junqueira, R.M.R. Flower-like silicon dioxide/polymer composite particles synthesized by dispersion polymerization route. J. Mater. Sci. 2018, 53, 11367–11377. [Google Scholar] [CrossRef]
  43. Hartwig, A.; Sebald, M.; Kleemeier, M. Cross-linking of cationically polymerised epoxides by nanoparticles. Polymer 2005, 46, 2029–2039. [Google Scholar] [CrossRef]
  44. Jiang, J.; Wang, W.; Shen, H.; Wang, J.; Cao, J. Characterization of silica particles modified with γ-methacryloxypropyltrimethoxysilane. Appl. Surf. Sci. 2017, 397, 104–111. [Google Scholar] [CrossRef]
  45. Massoumi, B.; Abbasian, M.; Jahanban-Esfahlan, R.; Motamedi, S.; Samadian, H.; Rezaei, A.; Derakhshankhah, H.; Farnudiyan-Habibi, A.; Jaymand, M. PEGylated hollow pH-responsive polymeric nanocapsules for controlled drug delivery. Polym. Int. 2020, 69, 519–527. [Google Scholar] [CrossRef]
  46. Jouenne, S. Polymer flooding in high temperature, high salinity conditions: Selection of polymer type and polymer chemistry, thermal stability. J. Pet. Sci. Eng. 2020, 195, 107545. [Google Scholar] [CrossRef]
  47. Kozicki, W.; Chou, C.H.; Tiu, C. Non-Newtonian flow in ducts of arbitrary cross-sectional shape. Chem. Eng. Sci. 1966, 21, 665–679. [Google Scholar] [CrossRef]
  48. Tsakiroglou, C.D. A methodology for the derivation of non-Darcian models for the flow of generalized Newtonian fluids in porous media. J. Non-Newt. Fluid Mech. 2002, 105, 79–110. [Google Scholar] [CrossRef]
  49. Payatakes, A.C.; Dias, M.M. Immiscible Microdisplacement and Ganglion Dynamics in Porous Media. Rev. Chem. Eng. 1984, 2, 85–174. [Google Scholar] [CrossRef]
  50. Sygouni, V.; Tsakiroglou, C.D.; Payatakes, A.C. Using wavelets to characterize the wettability of porous materials. Phys. Rev. E 2007, 76, 056304. [Google Scholar] [CrossRef]
  51. Yuan, H.H.; Swanson, B.F. Resolving Pore-Space Characteristics by Rate-Controlled Porosimetry. SPE Form. Eval. 1989, 4, 17–24. [Google Scholar] [CrossRef]
  52. Moradi, M.; Kazempour, M.; French, J.T.; Alvarado, V. Dynamic flow response of crude oil-in-water emulsion during flow through porous media. Fuel 2014, 135, 38–45. [Google Scholar] [CrossRef]
  53. Lenormand, R.; Touboul, E.; Zarcone, C. Numerical models and experiments on immiscible displacements in porous media. J. Fluid Mech. 1988, 189, 165–187. [Google Scholar] [CrossRef]
  54. Tsakiroglou, C.D.; Theodoropoulou, M.; Karoutsos, V. Non-equilibrium capillary pressure and relative permeability curves of porous media. AIChE J. 2003, 49, 2472–2486. [Google Scholar] [CrossRef]
  55. Tsakiroglou, C.D. Correlation of the two-phase flow coefficients of porous media with the rheology of shear-thinning fluids. J. Non-Newtonian Fluid Mech. 2004, 117, 1–23. [Google Scholar] [CrossRef]
  56. Tsakiroglou, C.D.; Theodoropoulou, M.; Karoutsos, V.; Papanicolaou, D.; Sygouni, V. Experimental study of the immiscible displacement of shear-thinning fluids in pore networks. J. Coll. Interface Sci. 2003, 267, 217–232. [Google Scholar] [CrossRef]
  57. Ntente, C.; Strekla, A.; Iatridi, Z.; Theodoropoulou, M.; Bokias, G.; Tsakiroglou, C.D. Polymer-functionalized nanoparticles as agents for the in situ remediation of oil-contaminated soils. IOP Conf. Ser. Earth Environ. Sci. 2022, 1123, 012064. [Google Scholar] [CrossRef]
Figure 1. Schematic representation of step 1: functionalization of SiO2 NPs with 3-(trimethoxysilyl)-propyl methacrylate (SiO2-MPS); step 2: Copolymerization of AMPSA and DMA onto the modified SiO2-MPS NPs (SiO2-P(AMPSA-co-DMA)).
Energies 16 08043 g001
Figure 2. (a) Experimental setup. (b) Morphology of glass-etched pore network model.
Energies 16 08043 g002
Figure 3. (a) Modification of SiO2 NP surface via MPS. (b) Polymerization of AMPSA and DMA monomers onto the modified surface of SiO2-MPS NPs.
Energies 16 08043 g003
Figure 4. (a) ATR-FTIR spectra of SiO2 (black) and SiO2 -MPS (red) NPs. (b) TGA curves of SiO2 (black), SiO2-MPS (red), and the polymer functionalized SiO2-P(AMPSA-co-DMA) (blue) nanoparticles.
Energies 16 08043 g004
Figure 5. TEM images of (a) bare SiO2 NPs and (b) functionalized SiO2-P(AMPSA-co-DMA) NPs.
Energies 16 08043 g005
Figure 6. (a) Photos of the transient changes to aqueous dispersions of 0.1% w/v SiO2 NPs in 3DW and aqueous solutions of 1% w/v (0.17 M), 4% w/v (0.7 M), 10% w/v (1.7 M) NaCl, after their preparation and storage for 2 h. (b) Photos of the transient changes to 0.1% w/v SiO2-P(AMPSA-co-DMA) NPs in 3DW, and aqueous solutions of 1% w/v (0.17 M), 4% w/v (0.7 M), 10% w/v (1.7 M) NaCl, after their preparation and storage for 2, 6, or 24 h.
Energies 16 08043 g006
Figure 7. Particle size distributions of NPs suspended in the following: (a) 1.0 M NaCl, (b) 0.5 M NaCl, and 0.25 M CaCl2. The different colors correspond to the particle size distributions of different liquid samples collected from the same batch.
Energies 16 08043 g007
Figure 8. Transient changes to the relative volumes of phases after the preparation of emulsions from a dispersion of 0.25% w/v SiO2-P(AMPSA-co-DMA) in an aqueous solution of (a) 1 M NaCl, (b) 0.5 M NaCl, and 0.25 M CaCl2.
Energies 16 08043 g008
Figure 9. Shear viscosity of Pickering emulsion prepared from a dispersion of 0.25% w/v SiO2-P(AMPSA-co-DMA) in an aqueous solution of (a) 1 M NaCl (ionic strength = 1 M), (b) 0.5 M NaCl, and 0.25 M CaCl2 (ionic strength = 1.25 M).
Energies 16 08043 g009
Figure 10. Transient responses of the (a,c) paraffin oil saturation; (b,d) pressure drop across the central area of the pore network for successive displacement tests, using brine as an aqueous solution of 1.0 M NaCl, and as a displacing fluid in the secondary imbibition step, (a,b) the PNP dispersion [SiO2-P(AMPSA-co-DMA) 0.25%/1.0 M NaCl] or (c,d) Pickering emulsion prepared from the dispersion.
Energies 16 08043 g010
Figure 11. Transient responses of the (a,c,e) paraffin oil saturation, (b,d,f) pressure drop across the central area of the pore network for successive displacement tests, using brine as an aqueous solution of 0.5 M NaCl and 0.25 M CaCl2, and as a displacing fluid in the secondary imbibition step, (a,b) the PNP dispersion [SiO2-P(AMPSA-co-DMA) 0.25%/0.5 M NaCl/0.25 M CaCl2], (c,d) the PNP Pickering emulsion, (e,f) the PNP Pickering emulsion, and the dispersion injected at equal flow rates.
Energies 16 08043 g011aEnergies 16 08043 g011b
Figure 12. Successive snap-shots of the displacement of residual paraffin oil (secondary imbibition) by the (a) PNP dispersion [0.25% SiO2-P(AMPSA-co-DMA)/1.0 M NaCl] and (b) PNP Pickering emulsion.
Energies 16 08043 g012
Figure 13. Successive snap-shots of the displacement of residual paraffin oil (secondary imbibition) by the (a) PNP dispersion [0.25% SiO2-P(AMPSA-co-DMA)/0.5 M NaCl + 0.25 M CaCl2], (b) PNP Pickering emulsion, and (c) PNP dispersion and PNP Pickering emulsion injected at equal flow rates.
Energies 16 08043 g013
Table 1. Measured surface and interfacial tensions for CNP=0.25 % w/v.
Aqueous Phase Surface   Tension ,   σ a w (mN/m) Interfacial   Tension   with   n - C 10 ,   σ o w (mN/m) Interfacial   Tension   with   Paraffin   Oil ,   σ o w (mN/m)
3DW72.40 ± 0.2049.9234.76
NaCl 1.0 M73.70 ± 0.1548.4834.02
CNP = 0.25% w/v in NaCl 1.0 M53.07 ± 0.4626.8830.28
NaCl 0.5 M + CaCl2 0.25 M71.05 ± 0.2343.5534.13
CNP = 0.25% w/v in NaCl 0.5 M + CaCl2 0.25 M55.40 ± 0.2133.2528.04
Table 2. Measured contact angles on a glass surface.
NP
(% w/v)
Salt (M)Contact Angle (ο)ImageContact Angle (ο)Image
Fluid systemNP aqueous dispersion/airNP aqueous dispersion/n-C10
1.03DW45.00 ± 0.05Energies 16 08043 i00166.30 ± 0.14Energies 16 08043 i002
0.53DW50.00 ± 0.71Energies 16 08043 i00367.35 ± 1.91Energies 16 08043 i004
0.253DW46.35 ± 0.49Energies 16 08043 i00563.95 ± 0.05Energies 16 08043 i006
0.25NaCl 0.25 M38.40 ± 0.14Energies 16 08043 i00768.60 ± 1.41Energies 16 08043 i008
0.25NaCl 0.5 M48.80 ± 1.41Energies 16 08043 i00971.70 ± 1.41Energies 16 08043 i010
0.25NaCl 1.0 M63.80 ± 0.28Energies 16 08043 i01171.50 ± 1.56Energies 16 08043 i012
0.25NaCl 0.5 M +CaCl2 0.25 M59.10 ± 0.99Energies 16 08043 i01371.15 ± 0.07Energies 16 08043 i014
Fluid system NP aqueous dispersion/paraffin oil
0.03DW 60.32 ± 2.13
0.0NaCl 1.0 M 54.4 ± 1.03Energies 16 08043 i015
0.25NaCl 1.0 M 62.75 ± 0.05Energies 16 08043 i016
0.0NaCl 0.5 M + CaCl2 0.25 M 54.2 ± 0.09Energies 16 08043 i017
0.25NaCl 0.5 M + CaCl2 0.25 M 79.00 ± 1.56Energies 16 08043 i018
Table 3. Summary of immiscible displacement tests conducted on pore network model.
Type of DisplacementDisplaced FluidInjected FluidFlow Rate Q (mL/min)Injected Vol (mL)Oil SaturationOil Removal Efficiency Reff (%)
Drainage1 M NaClParaffin oil0.087.60.86-
Primary ImbibitionResidual paraffin oil1 M NaCl0.280.4745.3
Secondary ImbibitionResidual paraffin oil0.25% SiO2-P(AMPSA-co-DMA) w/v in 1 M NaCl (Dispersion 1)0.280.4014.9
Drainage1 M NaClParaffin oil0.0880.83-
Primary ImbibitionResidual paraffin oil1 M NaCl0.280.4545.8
Secondary ImbibitionResidual paraffin oil0.25% SiO2-P(AMPSA-co-DMA) w/v in 1 M NaCl (Emulsion 1)0.280.1664.4
DrainageNaCl 0.5 M–CaCl2 0.25 MParaffin oil0.0880.82-
Primary ImbibitionResidual paraffin oil0.5 M NaCl, 0.25 M CaCl20.280.5630.2
Secondary ImbibitionResidual paraffin oil0.25% SiO2-P(AMPSA-co-DMA) w/v in 0.5 M NaCl/0.25 M CaCl2 (Dispersion 2)0.280.551.7
Drainage0.5 M NaCl–0.25 M CaCl2Paraffin oil0.0880.86-
Primary ImbibitionResidual paraffin oil0.5 M NaCl, 0.25 M CaCl20.280.5239.5
Secondary ImbibitionResidual paraffin oil0.25% SiO2-P(AMPSA-co-DMA) w/v in 0.5 M NaCl / 0.25 M CaCl2 (Emulsion 2)0.280.01497.3
Drainage0.5 M NaCl–0.25 M CaCl2Paraffin oil0.088.00.843-
Primary ImbibitionResidual paraffin oil0.5 M NaCl, 0.25 M CaCl20.28.00.54135.8
Secondary ImbibitionResidual paraffin oil0.25% SiO2-P(AMPSA-co-DMA) w/v in 0.5 M NaCl/0.25 M CaCl2 (Emulsion 2)0.14.00.38528.8
0.25% SiO2-P(AMPSA-co-DMA) w/v in 0.5 M NaCl /0.25 M CaCl2 (Dispersion 2)0.14.0
Table 4. Dimensionless numbers of displacement tests.
DisplacementDefenderInvaderCa × 105κCaL1CaLN
Drainage1 M NaCl (μ = 0.97 × 10⁻³ Pa s)Paraffin oil (μ = 0.02 Pa s)0.42420.60.0181.365
Primary imbibitionParaffin oil (μ = 0.02 Pa s)1 M NaCl0.05160.04850.002180.165
Secondary imbibitionParaffin oil (μ = 0.02 Pa s)CNP = 0.25% w/v in 1.0 M NaCl0.05790.04850.002450.186
Secondary imbibitionParaffin oil (μ = 0.02 Pa s)Pickering emulsion (μ = 0.05367 Pa s)3.2082.6830.135910.32
Drainage0.5 M NaCl 0.25 M CaCl2 (μ = 0.93 × 10⁻³ Pa s)Paraffin oil (μ = 0.02 Pa s)0.42521.50.01801.367
Primary imbibitionParaffin oil (μ = 0.02 Pa s)0.5 M NaCl 0.25 M CaCl2 (μ = 0.93 × 10⁻³ Pa s)0.04930.04650.002090.159
Secondary imbibitionParaffin oil (μ = 0.02 Pa s)CNP = 0.25% w/v in 0.5 M NaCl 0.25 M CaCl20.060.04650.002550.193
Secondary imbibitionParaffin oil (μ = 0.02 Pa s)Pickering emulsion (μ = 0.07814 Pa s)5.0543.9070.21416.27
Secondary imbibitionParaffin oil (μ = 0.02 Pa s)Pickering emulsion (μ = 0.07814 Pa s)2.5273.9070.1078.13
Secondary imbibitionParaffin oil (μ = 0.02 Pa s)CNP = 0.25% w/v in 0.5 M NaCl 0.25 M CaCl20.030.04650.001270.0965
Table 5. Energy efficiency of secondary imbibition tests.
Injected FluidEnergy Efficiency, EE (% μW−1)Oil Removal Efficiency, Reff (%)
Dispersion 124.8314.9
Emulsion 120.0664.4
Dispersion 20.3491.7
Emulsion 213.6897.3
Emulsion 2 + Dispersion 26.0328.8
Disclaimer/Publisher’s Note: The statements, opinions and data contained in all publications are solely those of the individual author(s) and contributor(s) and not of MDPI and/or the editor(s). MDPI and/or the editor(s) disclaim responsibility for any injury to people or property resulting from any ideas, methods, instructions or products referred to in the content.

