Article

Geological and Geochemical Responses to Productivity of CBM Wells in the Baiyang River Block of the Southern Junggar Basin, China

1
PetroChina Research Institute of Petroleum Exploration and Development, Langfang 065007, China
2
School of Energy Resources, China University of Geosciences (Beijing), Beijing 100083, China
*
Author to whom correspondence should be addressed.
Energies 2023, 16(24), 8063; https://doi.org/10.3390/en16248063
Submission received: 20 October 2023 / Revised: 24 November 2023 / Accepted: 4 December 2023 / Published: 14 December 2023
(This article belongs to the Special Issue Coalbed Methane Exploration and Production)

Abstract

:
The southern Junggar Basin, Xinjiang, has abundant coalbed methane (CBM) resources. Currently, the Baiyang River development pilot test area (BYR block for short) in the Fukang east block has achieved large-scale CBM development, but the productivity characteristics and its controlling factor are still unclear. Based on the field production data of the BYR block and experimental tests, this paper summarizes the gas and water production characteristics and presents the analysis results of the geological and geochemical responses to the productivity of CBM wells. The productivity of CBM wells in the BYR block was generally characterized as medium-to-low yield. The productivity was jointly controlled by the burial depth, structure condition, thickness and number of co-production coal seams, and hydrogeological conditions. The gas production first increased and then decreased with the increase in the burial depth of the coal seam, and a burial depth between 750 and 1000 m was the most beneficial to increasing the gas production due to the good gas preservation conditions and suitable permeability and stress conditions. The total thickness of the co-production coal seams had a positive effect on the productivity of gas wells, but the productivity was also affected by the number of co-production coal seams and interlayer interference. In the BYR block, the co-production of the nos. 41 and 42 coal seams was the most favorable combination form for CBM drainage. The productivity of CBM wells had a good response to the Na+, K+ and HCO3 concentrations but a poor response to δD-H2O and δ18O-H2O. Based on the concentrations of the main ions and TDSs of the coal seam water, a productivity response index δ* was established, and there was a good positive correlation between the productivity and δ*.

1. Introduction

Coalbed methane is an unconventional clean energy source that can be used as a supplement to conventional natural gas, with huge reserves and widespread attention [1,2]. As the world’s largest coal-consuming and coal-producing country, China has a huge amount of coalbed methane resources, ranking third in the world behind Russia and Canada [3,4,5]. According to the new round of national coalbed methane resource evaluation results, the geological resources in the coal layers of 30 major gas-bearing basins in China with a depth of less than 2000 m are 29.82 × 10¹² m3 [6]. With the rapid development of the coalbed methane industry, the production capacity characteristics of gas wells and the factors affecting production capacity have gradually become key research issues.
Studying the influencing factors in the production process of coalbed methane (CBM) is helpful for understanding the dynamic changes of reservoirs and guiding the CBM development in the research area. The main factors affecting the production capacity of coal seams include geological factors, such as the structure; buried depth and thickness of the coal seam; gas content; permeability; ratio of the critical desorption pressure to the initial reservoir pressure (Rc/Rr); and engineering factors, such as drilling, fracturing and bottom hole flow pressure [7,8,9,10]. CBM development usually reduces the reservoir pressure in the method of drainage, and thus, there is a large amount of water used during the production process [11,12]. As the direct product of CBM drainage, the coal seam water carries rich hydrological geological information. The dynamic changes in various types of geochemical characteristics of gas and water have guidance significance for the gas production capacity of coal seams [13,14].
Many scholars have conducted research on the factors that affect gas production capacity. Zhao et al. [15] quantitatively evaluated the impact of six factors (burial depth and thickness of coal seam, Rc/Rr, gas content, permeability and fracturing effect) on CBM production in the Hancheng Block based on grey system theory. It was also pointed out that the Rc/Rr, the fracturing effect and the gas content have a great influence on gas production capacity, and it put forward reasonable parameters for high-yield CBM wells in this area. Ayers [16] compared two completely different CBM systems in the San Juan Basin and the Powder River Basin and indicated that the control factors of gas production were the thermal maturity, gas content, coal seam thickness, permeability and other factors working together. Guo et al. [17] discussed the sources of produced water from CBM wells in the Qianxi Bide–Santang Basin based on the hydrogen and oxygen isotope characteristics of produced water from CBM wells and pointed out that the hydrogen and oxygen isotope composition of produced water in high-yield wells is relatively heavy and D isotope drift is obvious, in contrast to low production wells. The parameters reflecting the degree of D isotope drift and the identification template of drainage water sources were established, and the produced water was divided into three categories: coal seam water, surface water and fracturing water. Li et al. [18] analyzed the coal seam water in the Qinshui Basin using the characteristics of ion composition and divided the water production stage into three stages according to the stiff diagram. It was also pointed out that the higher the salinity of the produced water and the higher the HCO3 concentration, the higher the gas production. Wang et al. [19] analyzed the hydrogeological characteristics of the Fanzhuang block in the Qinshui Basin and revealed that the smaller the sodium–chloride coefficient and the desulfurization coefficient, the higher the CBM content and the more likely the CBM will be enriched, and when the value of δD/δ18O is less than 0.5, it is beneficial to high yield.
Three pilot test areas, namely, Baiyang River, Sigong River and Urumqi River East, were built on the southern Junggar Basin in Xinjiang. For the Baiyang River test area (hereinafter referred to as the block), a series of studies were conducted on CBM genesis, gas accumulation and CBM well type [20,21,22], but there are few studies on the factors affecting gas production capacity [23]. In particular, the lack of understanding of the factors affecting the productivity of multilayer combined production wells greatly restricts the efficient development of CMB in this area. In this study, the production characteristics of gas and water of CBM wells were analyzed and the response relationships between the geological, geochemical indicators and productivity of CBM wells were identified to analyze the factors that affected the production capacity of coalbed methane wells in the research area.

2. Geological Overview

2.1. Geological Background

The Junggar Basin is a large-scale depression in northern Xinjiang with an area of about 13.4 × 10⁴ km2. The southern margin of the Junggar Basin is abundant in CBM, especially low-coal-rank CBM, which is conducive to large-scale exploration and development [24]. Since the late Paleozoic, the Junggar Basin has experienced multiple tectonic movements, such as the Hercynian, Indosinian, Yanshanian and Himalayan, and formed a series of compressive faults and compound folds.
The target area of this research is the Baiyang River development pilot test area (BYR block for short) located in the Fukang Fault Belt. The BYR block is distributed in a nearly east–west direction with an area of about 18.23 km2 and is located in the north wing of the Huangshan–Ergong River inverted syncline. In general, the BYR block is a southward-dipping monoclinal structure with a dip angle of 30°–58° and an average of 46°. The coal-bearing strata show little change in strike and inclination (Figure 1). The northern and southern boundaries of the block are controlled by the Fukang overthrust and Yaomoshan reverse fault.
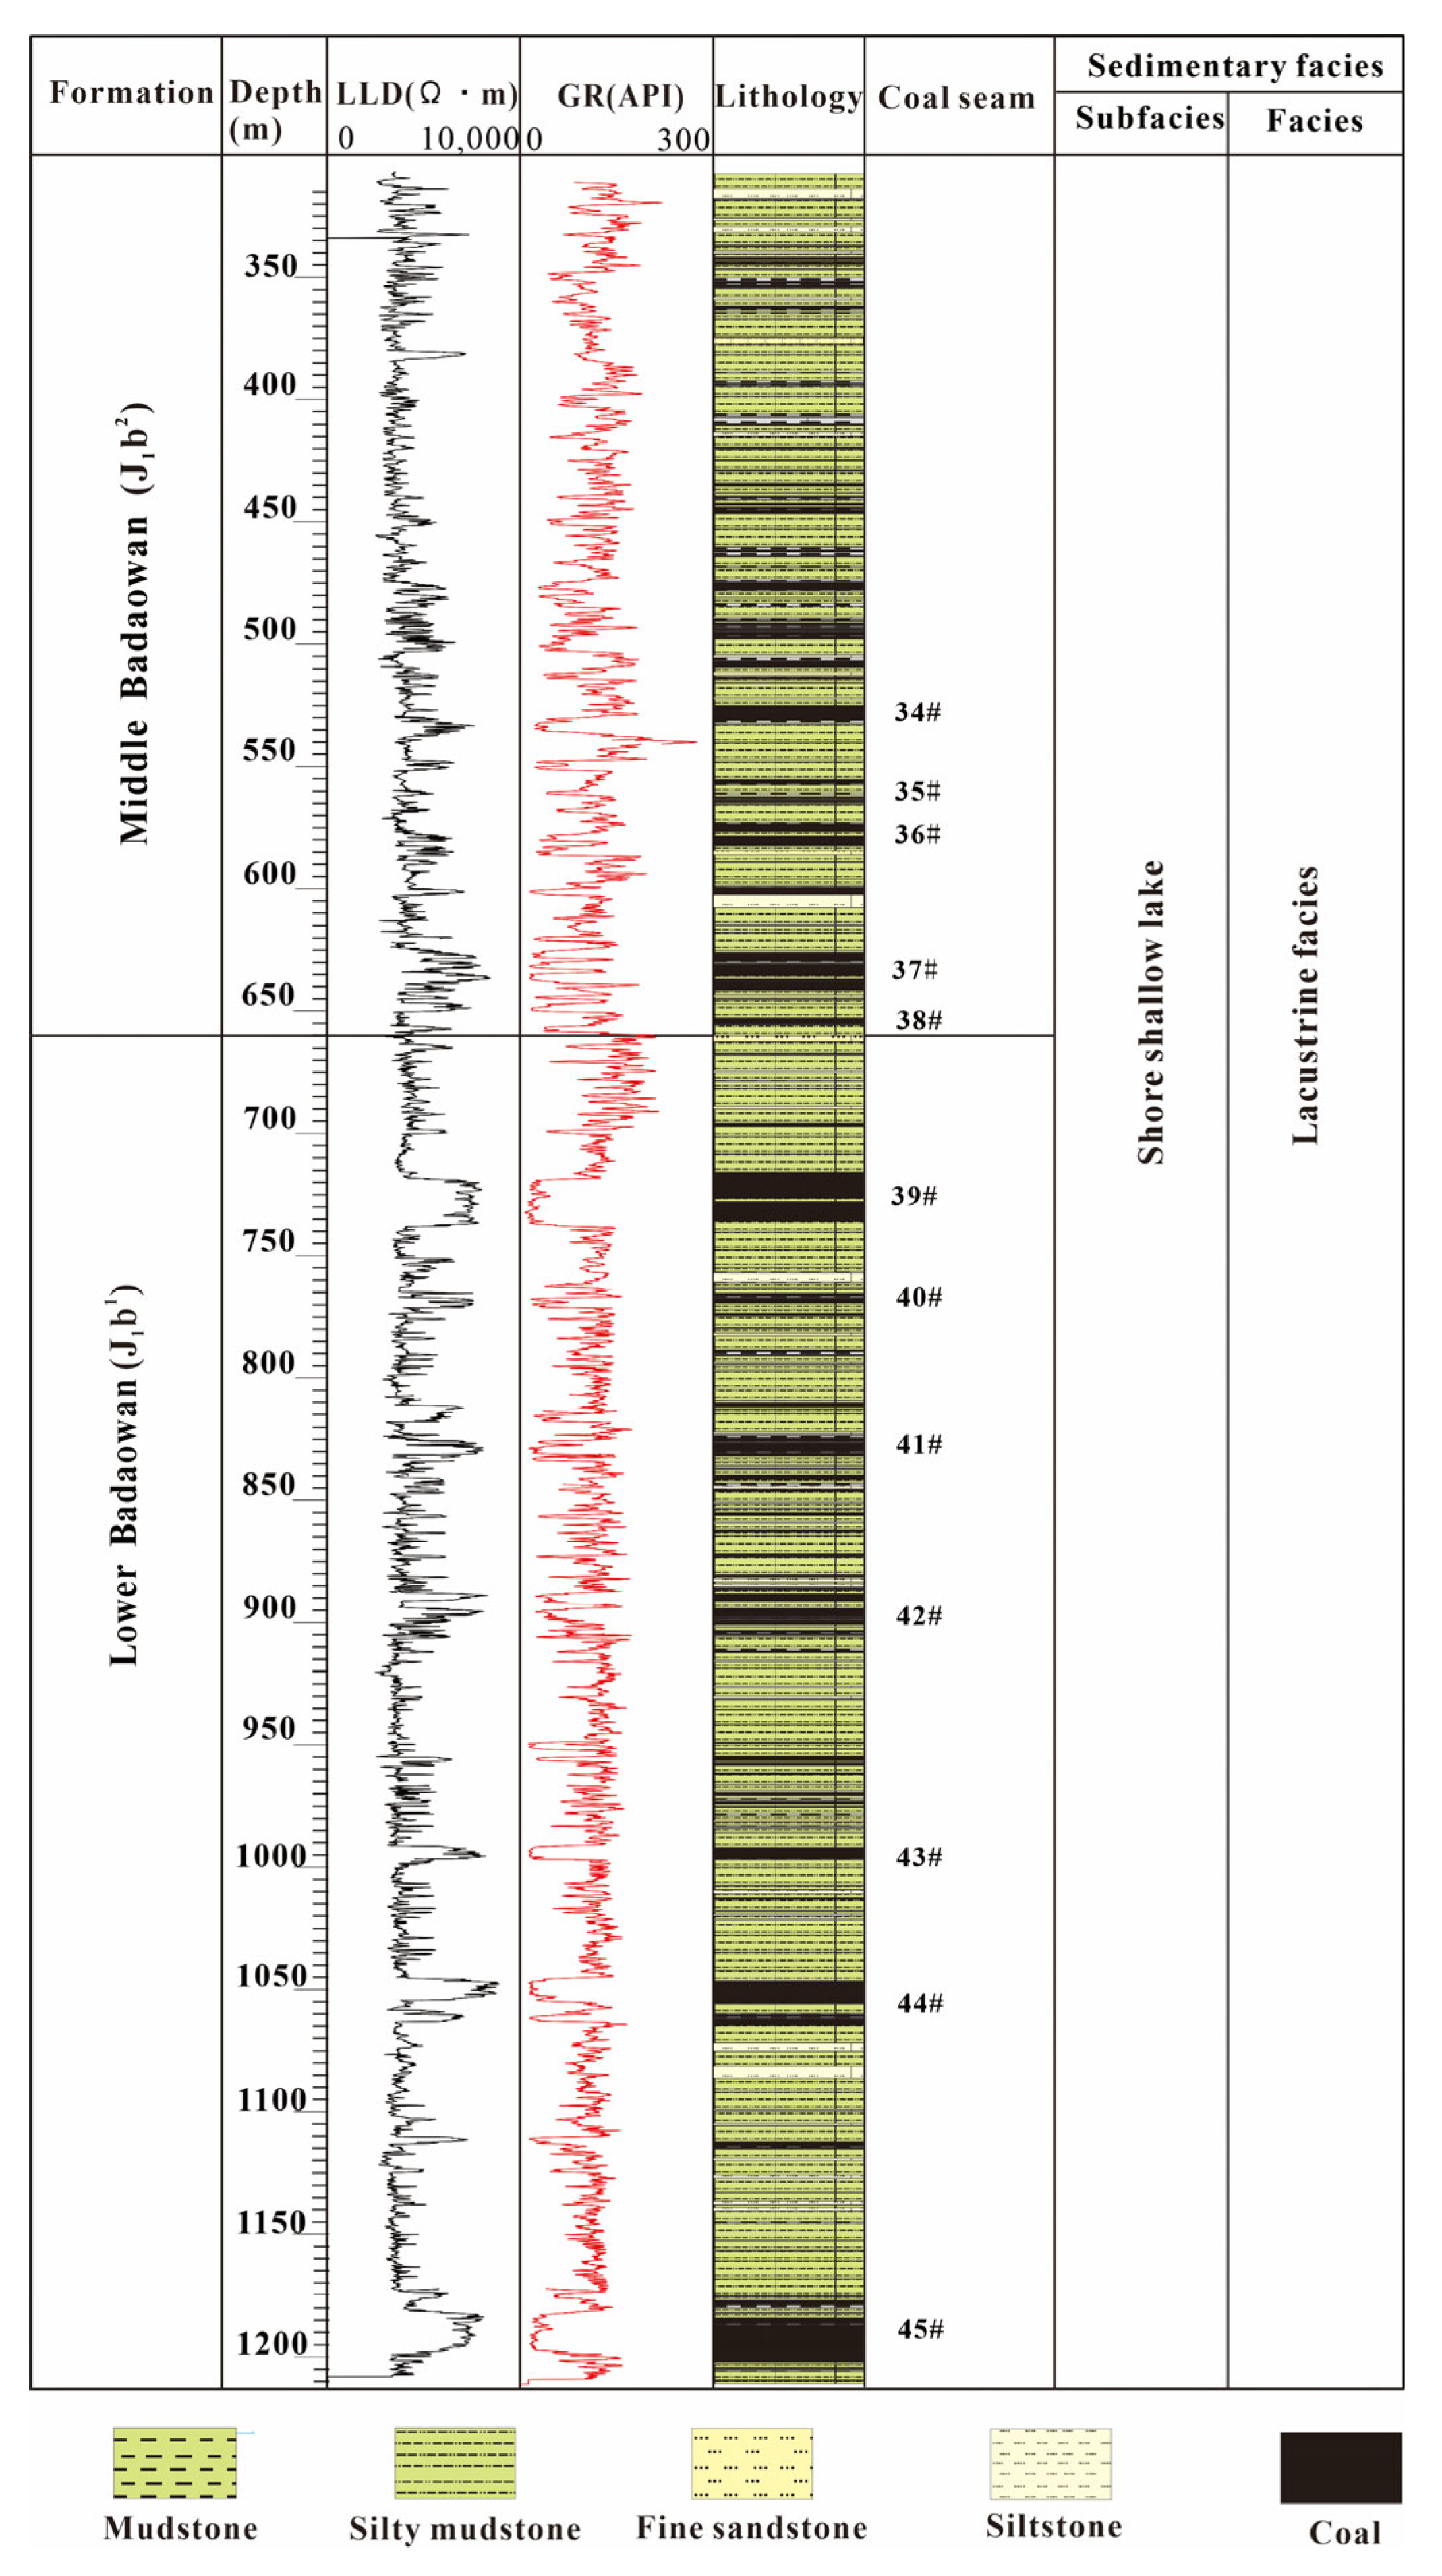
The main coal-bearing strata in the study area were the lower and middle parts of the Badaowan Formation (J1b1 and J1b2), which were mainly formed in the sedimentary environment of a coastal shallow lake. The lithology is gray-black mudstone, argillaceous siltstone, fine-grained sandstone, siltstone and coal, and containing a small amount of medium coarse-grained sandstone (Figure 2). The average thickness of the coal-bearing strata is 569.34 m, and the average thickness of the coal seam is 32.79 to 106.34 m, with the average total thickness of the recoverable strata being about 60.86 m. The main development coal seams in the research area are the nos. 39, 41 and 42 coal seams in the lower section of the Badaowan Formation, and the no. 40 thin coal seam between the nos. 39 and 41 coal seams. The burial depth of the coal seams are between 500 and1200 m. Overall, they are deep in the south and shallow in the north, with the deepest burial depth in the southeast and the shallowest burial depth in the northwest. The coal seams in the BYR block are prone to spontaneous combustion, forming a deep and widely distributed red burnt rock zone in the northern part of the block. The maximum vitrinite reflectance (Ro, max) of the main coal seam is 0.60% to 1.01%, with an average of 0.82%. The moisture and ash content are low, and the porosity is between 2.5% and 14.5%, with an average of about 7.6%. The cleats of the coal seams are well developed.
According to previous studies [20], the genesis type of CBM in the BYR block is mixed with the early thermogenic gas and secondary biogenetic gas, with thermogenic gas predominantly, and a small amount of secondary biogenetic gas in the shallow part. Secondary biogenetic gas can make up for the decrease in gas content caused by the loss of shallow thermogenic gas and promotes the enhancement of the gas production rate to a certain extent.

2.2. Hydrogeology

There are many rivers distributed in the southern Junggar Basin, which are roughly perpendicular to the mountains and strata. They flow through the block from south to north, cutting through the strata, and are consistent with the flow direction of groundwater. The melting water of the North Tianshan Mountain constitutes the main supply source of surface runoff in the region, as well as indirectly supplying groundwater, with obvious seasonality. Among these rivers, the Baiyang River and Huangshan River are distributed in the west and east of the BYR block, and flow through the block from south to north. From the perspective of the entire southern Junggar Basin, the BYR block is located in the groundwater convergence area and has a high-fluid-pressure system.

3. Sampling and Methods

3.1. Data and Sampling

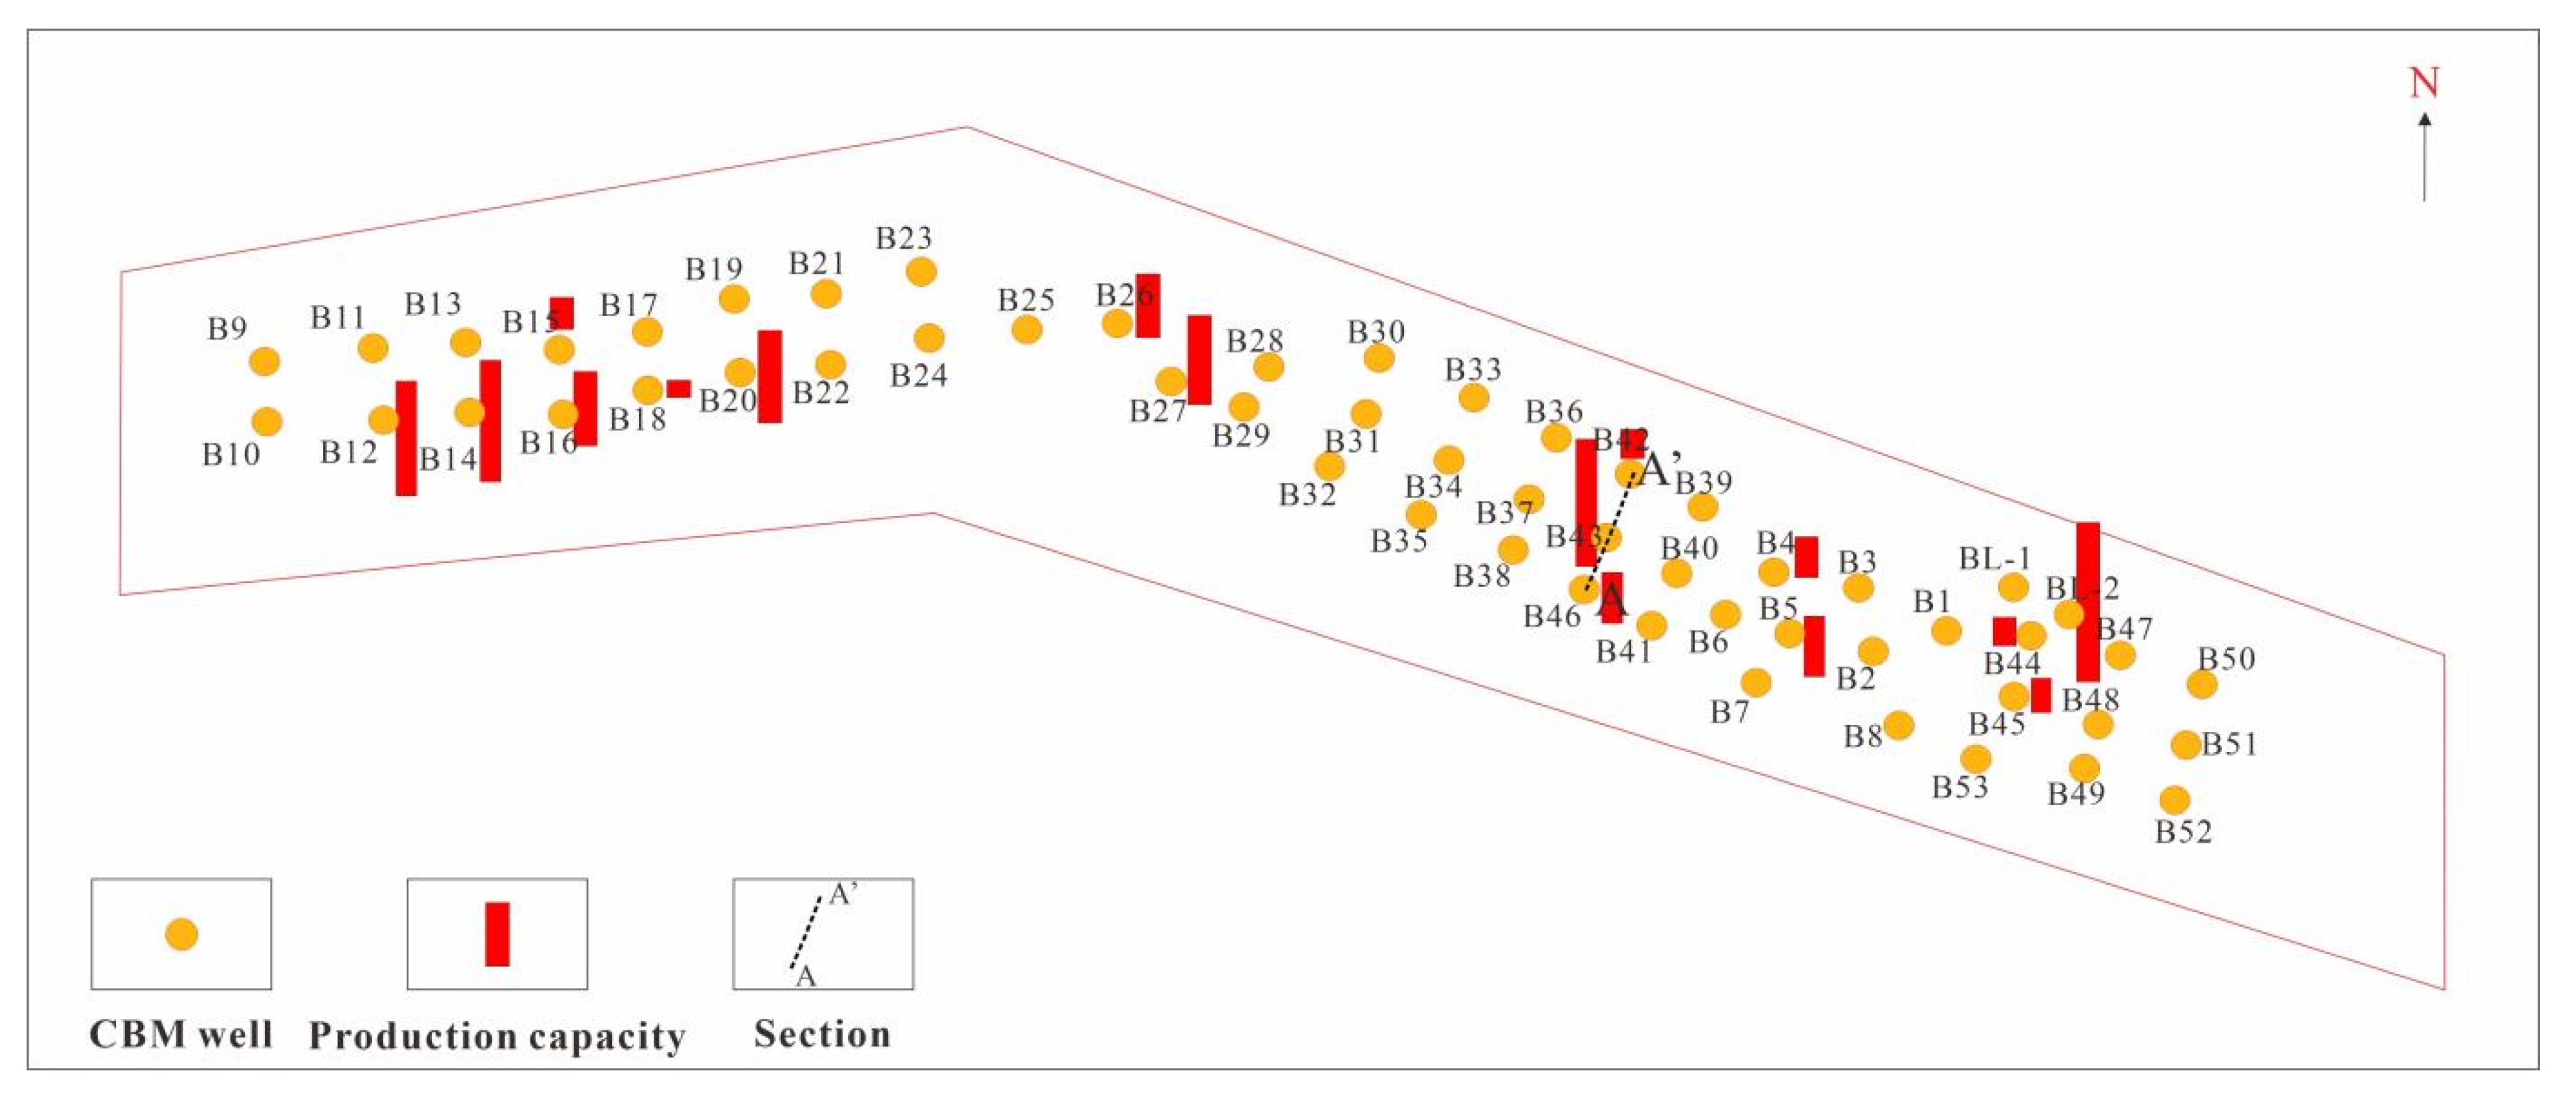
Limited by the terrain of the hills, the coalbed methane wells in the BYR block are mainly distributed in the northern wing of the Huangshan–Ergonghe syncline. Among the wells, there are two rows on the west and three rows on the east, and the south wing strata are inverted, which are mostly missed due to the cutting of the fault (as shown in Figure 3). The productivity data of 12 CBM wells in the BYR block were collected and analyzed. In this block, multi-layer combined production was the main development method.
In order to analyze the geochemical characteristics of co-produced water, 25 water samples were collected from 25 CBM wells according to the China Petroleum and Natural Gas Industry Standard (SY/T 5523−2016) [25]. All samples were from the Badaowan Formation, and the production time of the selected CBM Wells was more than 40 months to ensure that the fracture liquid was completely returned and the CBM wells entered the stable production stage.

3.2. Tests for Geochemical Characteristics of Produced Water

The collected coal seam water samples were sent to the China Geological Survey for geochemical characteristics testing. An ICAP 6300 inductively coupled plasma atomic emission spectrometer was used to test the ion concentration, water type and total dissolved solids (TDSs) of the water samples, and the Finnigan MAT253 mass spectrometer was used to measure the stable hydrogen and oxygen isotopes of the water samples (δD and δ18O). The detailed experimental process can be found in the study by Zhang [26] et al. The experimental results are shown in Table 1.

4. Results and Interpretation

4.1. Gas and Water Production Characteristics of CBM Wells

The output of CBM is a dynamic process, and there are three stages for CBM swell development: the water drainage and decompression stage, stable production stage and production decline stage [15,27,28]. The gas production and water production of CBM wells have obvious differences in size and change trends in different production stages. According to the classification method for CBM production capacity [29], the production data of 12 CBM wells in the BYR block were analyzed and it was concluded that the productivity of the CBM wells in the research area was medium-to-low yield. The medium-yield wells were three wells with an average daily gas production (ADGP) between 1000 and 3000 m3/d, and the low-yield wells were nine wells with ADGP less than 1000 m3/d.
Although the average daily gas production of some wells was very low, the maximum daily gas production could be greater than 2000 m3/d. In this area, the average daily water production (ADWP) of CBM wells was generally low, with most wells producing less than 10 m3/d, except for wells B26 and B42, with an average daily water production of more than 100 m3/d and a maximum daily water production up to 580 m3/d, respectively (Figure 4 and Table 2).
In order to observe the drainage dynamic characteristics of CBM wells, the production curves were drawn by using the average daily gas production, average daily water production and the bottom-hole flow pressure. The production curves of CBM wells could be classified into three types. Type I wells were characterized by medium gas production and low water production with ADGP > 1000 m3/d and ADWP < 8 m3/d. Type II wells were characterized by low gas production and low water production with ADGP < 1000 m3/d and ADWP < 8 m3/d. Type III wells had the characteristics of low gas production and high water production with ADGP < 1000 m3 and ADWP > 8 m3/d.The sudden increase in pressure and gas production between 500 and 700 days was caused by secondary hydraulic fracturing (Figure 5).
Three wells belonged to type I, namely, wells B43, BS2 and B77, among which the B77 well had the highest ADGP, up to 2137 m3/d. As shown in Figure 5a, the ADWP and bottom-hole flow pressure of this type of well was maintained at a very low level in the late stage of drainage. The gas production curve was usually bimodal, and the gas production quickly reached the first peak and then entered the stable production stage. The second peak was generally higher than the first peak, and the stable production time was longer than the first peak.
Four CBM wells belonged to type II, namely, B45, B46, B72 and B79. As shown in Figure 5b, this type of well generally had a large burial depth, short stable production time, low single well production and fast decline in gas production. The water production rate at the initial stage of drainage was high, but it dropped fast, and both the water and gas production rates were relatively low.
Five CBM wells belonged to type III, namely, B9, B26, B27, B42 and B44. Its higher water production may have been the direct reason for the low gas production. Taking the B26 well as an example (Figure 5c), after about 1 year of drainage, the water production rate was still as high as about 150 m3/d, while the gas production was only about 450 m3/d. The high water content of the coal seam caused the inability to reduce the bottom hole pressure, and thus, the gas was difficult to desorb and the gas production rate was reduced.

4.2. Geochemical Characteristics of Co-Produced Water

4.2.1. The Ion Concentration Characteristics of Co-Produced Water

The cations of the produced coal seam water were dominated by Na+, followed by K+, and Ca2+ and Mg2+ had the lowest concentrations. The anions in the coal seam water were mainly HCO3 and Cl, followed by SO 4 2 , and CO 3 2 was not detected. The pH value ranged from 6.88 to 8.02, with an average of 7.5, indicating the coal seam water was weakly alkaline. The chemical characteristics of the coal seam water in the BYR block were similar to those of coal seam water in global continental environments [30,31]. Based on the concentrations of anions and cations in the co-produced water samples, a Piper diagram of hydrochemical compositions in the BYR block (Figure 6) was drawn to determine the type of water. It can be seen from Figure 6 that all the water samples in the BYR block were Na-HCO3-Cl type, and the proportion of HCO3 in the anions was significantly higher than that of Cl. The TDS values of the co-produced water were very high, distributed between 5841 and 27,203 mg/L, with an average of 19,030 mg/L. The TDS values were increased sequentially from east to west and from north to south. The south wing of the syncline was inverted by the reverse thrusting of Bogda Mountain, and most coal measure strata were lost due to fault cutting. The dip angle of the formation on the north wing could reach 75°, which was conducive to the migration of surface water along the coal seams to the synclinal core and forming a stagnant flow zone.
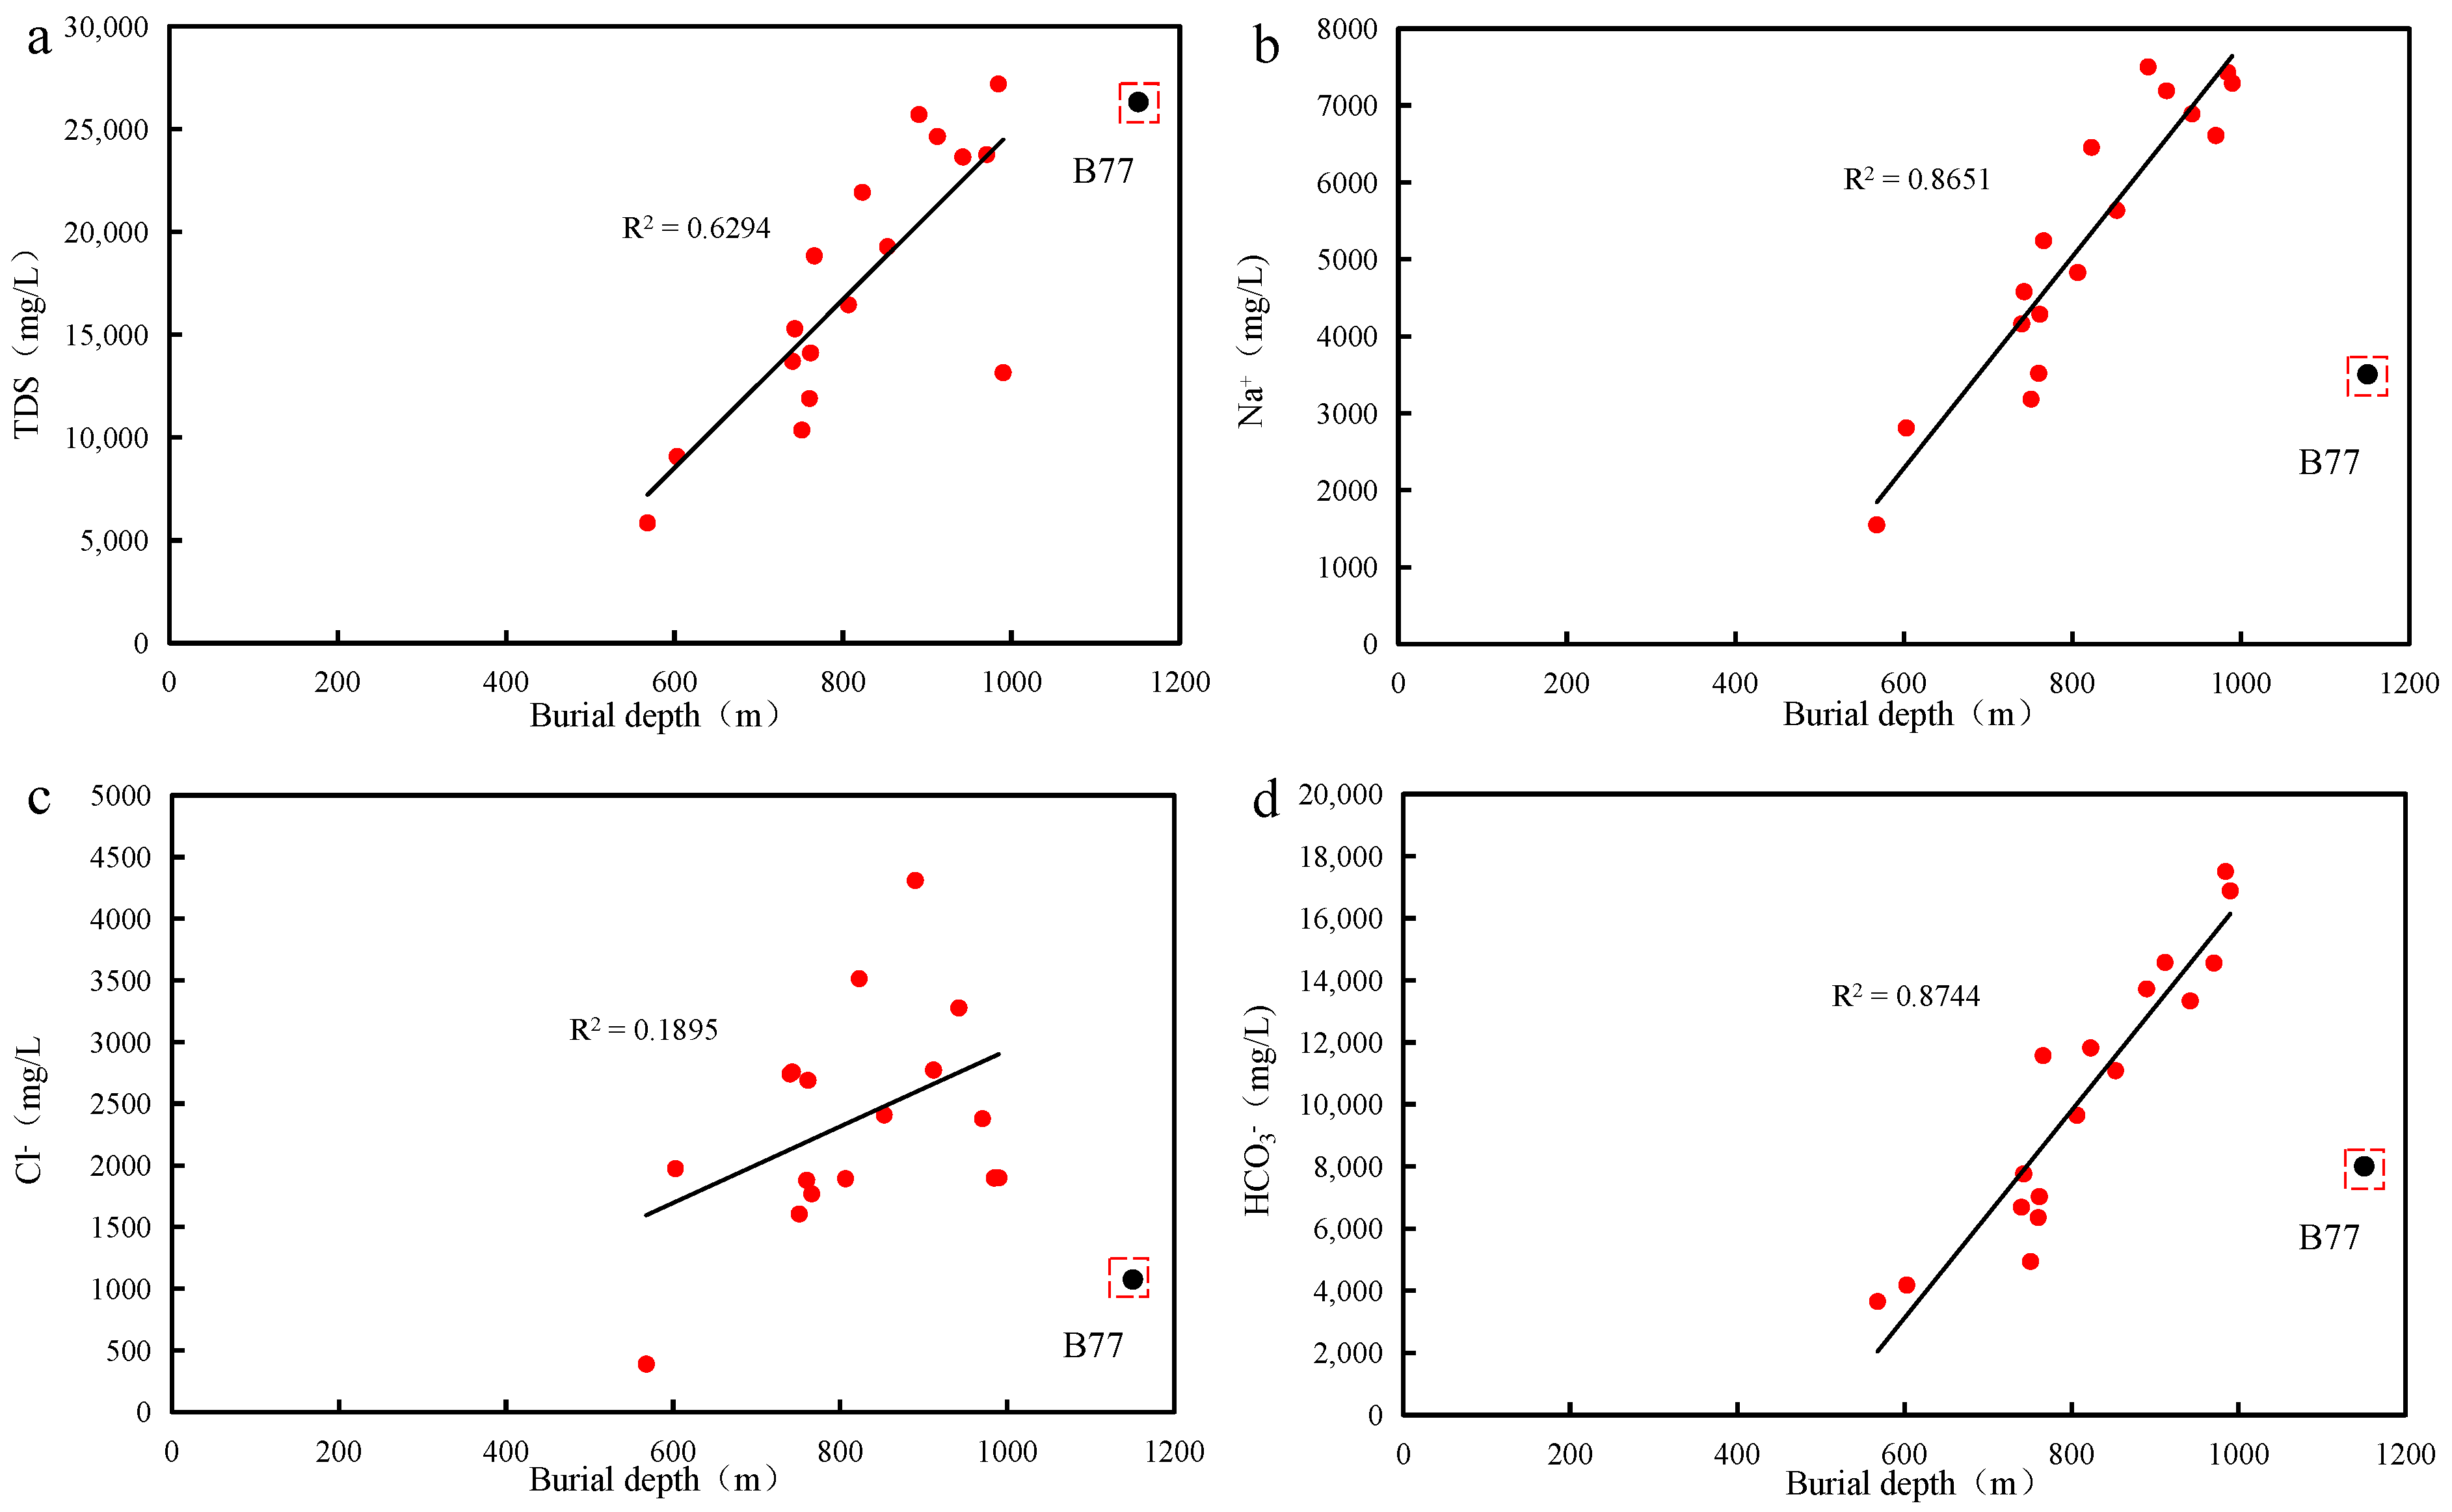
According to the graph of ion concentration versus burial depth (Figure 7), it was found that the TDSs value, Na+, Cl and HCO3 concentration in the coal seam water had an increasing trend with the increase in the buried depth of coal seam, which indicates that from shallow to deep, the closure degree of the water environment gradually increased, and it was far away from the oxygen-rich recharge area. There were also some anomalies in the data of the B79 well, whose TDSs value was relatively high, while the Na+, HCO3 and Cl concentrations were relatively low.
The Ca2+ and Mg2+ concentrations in the coal seam water were much less than that of Na+, which may have been due to the effect of cation exchange or the formation of inorganic precipitates caused by the high HCO3 concentration [18,30]. The reason for the low concentration of SO 4 2 was that SO 4 2 underwent desulphurization and acidification, forming more HCO3 in the closed reducing environment, which resulted in the enrichment of HCO3 [18,32].

4.2.2. Isotopic Characteristics of Co-Produced Water
The isotope characteristics of the co-produced water are very important for studying the origins and evolution of the formation water [33,34]. The H and O isotopes of the coal seam water in the BYR block were very negative, with δD-H2O and δ18O-H2O values ranging from −139.6‰ to −103.1‰ and −15.6‰ to −12.0‰, respectively. Craig [35] et al. proposed the global meteoric water line (GMWL), which is expressed as δD = 8δ18O + 10. Xinjiang Province is far from the ocean and has a dry climate, with high δ18O and δD in the surface water, and therefore, the values of δ18O and δD in the evaporation water vapor are also high [36], which have obvious evaporation effects on the isotope. Li [37] et al. established the meteoric water line equation for the Urumqi region based on the precipitation isotope data of Urumqi, which can be expressed as δD = 7.21δ18O + 4.5, and can be used to study the Xinjiang meteoric water line (XMWL).
Figure 8 shows that all the data were basically located below and to the right of the GMWL and XMWL, indicating that coal seam water originated from the atmospheric precipitation with obvious 18O drift characteristics. During the runoff process, it was transformed through water–rock interactions or evaporation, with obvious 18O drift characteristics.
Figure 7. Plots of TDSs (a), Na+ (b), Cl (c) and HCO3 (d) concentration variation of coal seam water with the burial depth in the BYR block. The red dots represent the data in Table 1, and the black lines represent the trend lines of the red dots data.
Energies 16 08063 g007
Figure 8. Cross plot of δD versus δ18O of coal seam water samples in the BYR block. The red dots represent the data in Table 1.
Energies 16 08063 g008
Methanogenesis and water–rock interactions at low temperatures can shift the formation water isotopic composition to the left side of the GMWL [38,39]. Various processes, such as evaporation, high-temperature water–rock interaction and mixing with brine, will shift water composition to the right side of the GMWL [40,41]. The evaporation effect will enrich both D and 18O in water, while under deep temperature conditions, the water–rock interaction can migrate 18O from rocks to water and enrich 18O in water, but it is not obvious for D enrichment [14,42]. As a result, the isotopic characteristics and the 18O drift of coal seam water in the BYR block are mainly influenced by high-temperature fluid–rock interaction, followed by evaporation.

5. Discussion

5.1. Geological Responses to Gas and Water Production

5.1.1. Structural Condition

The CBM wells of the research area are located in the north wing of the Huangshan–Ergonghe syncline. The formations tilt southward with a relatively large dip angle, and no obvious fault has been found in the coal measure strata.
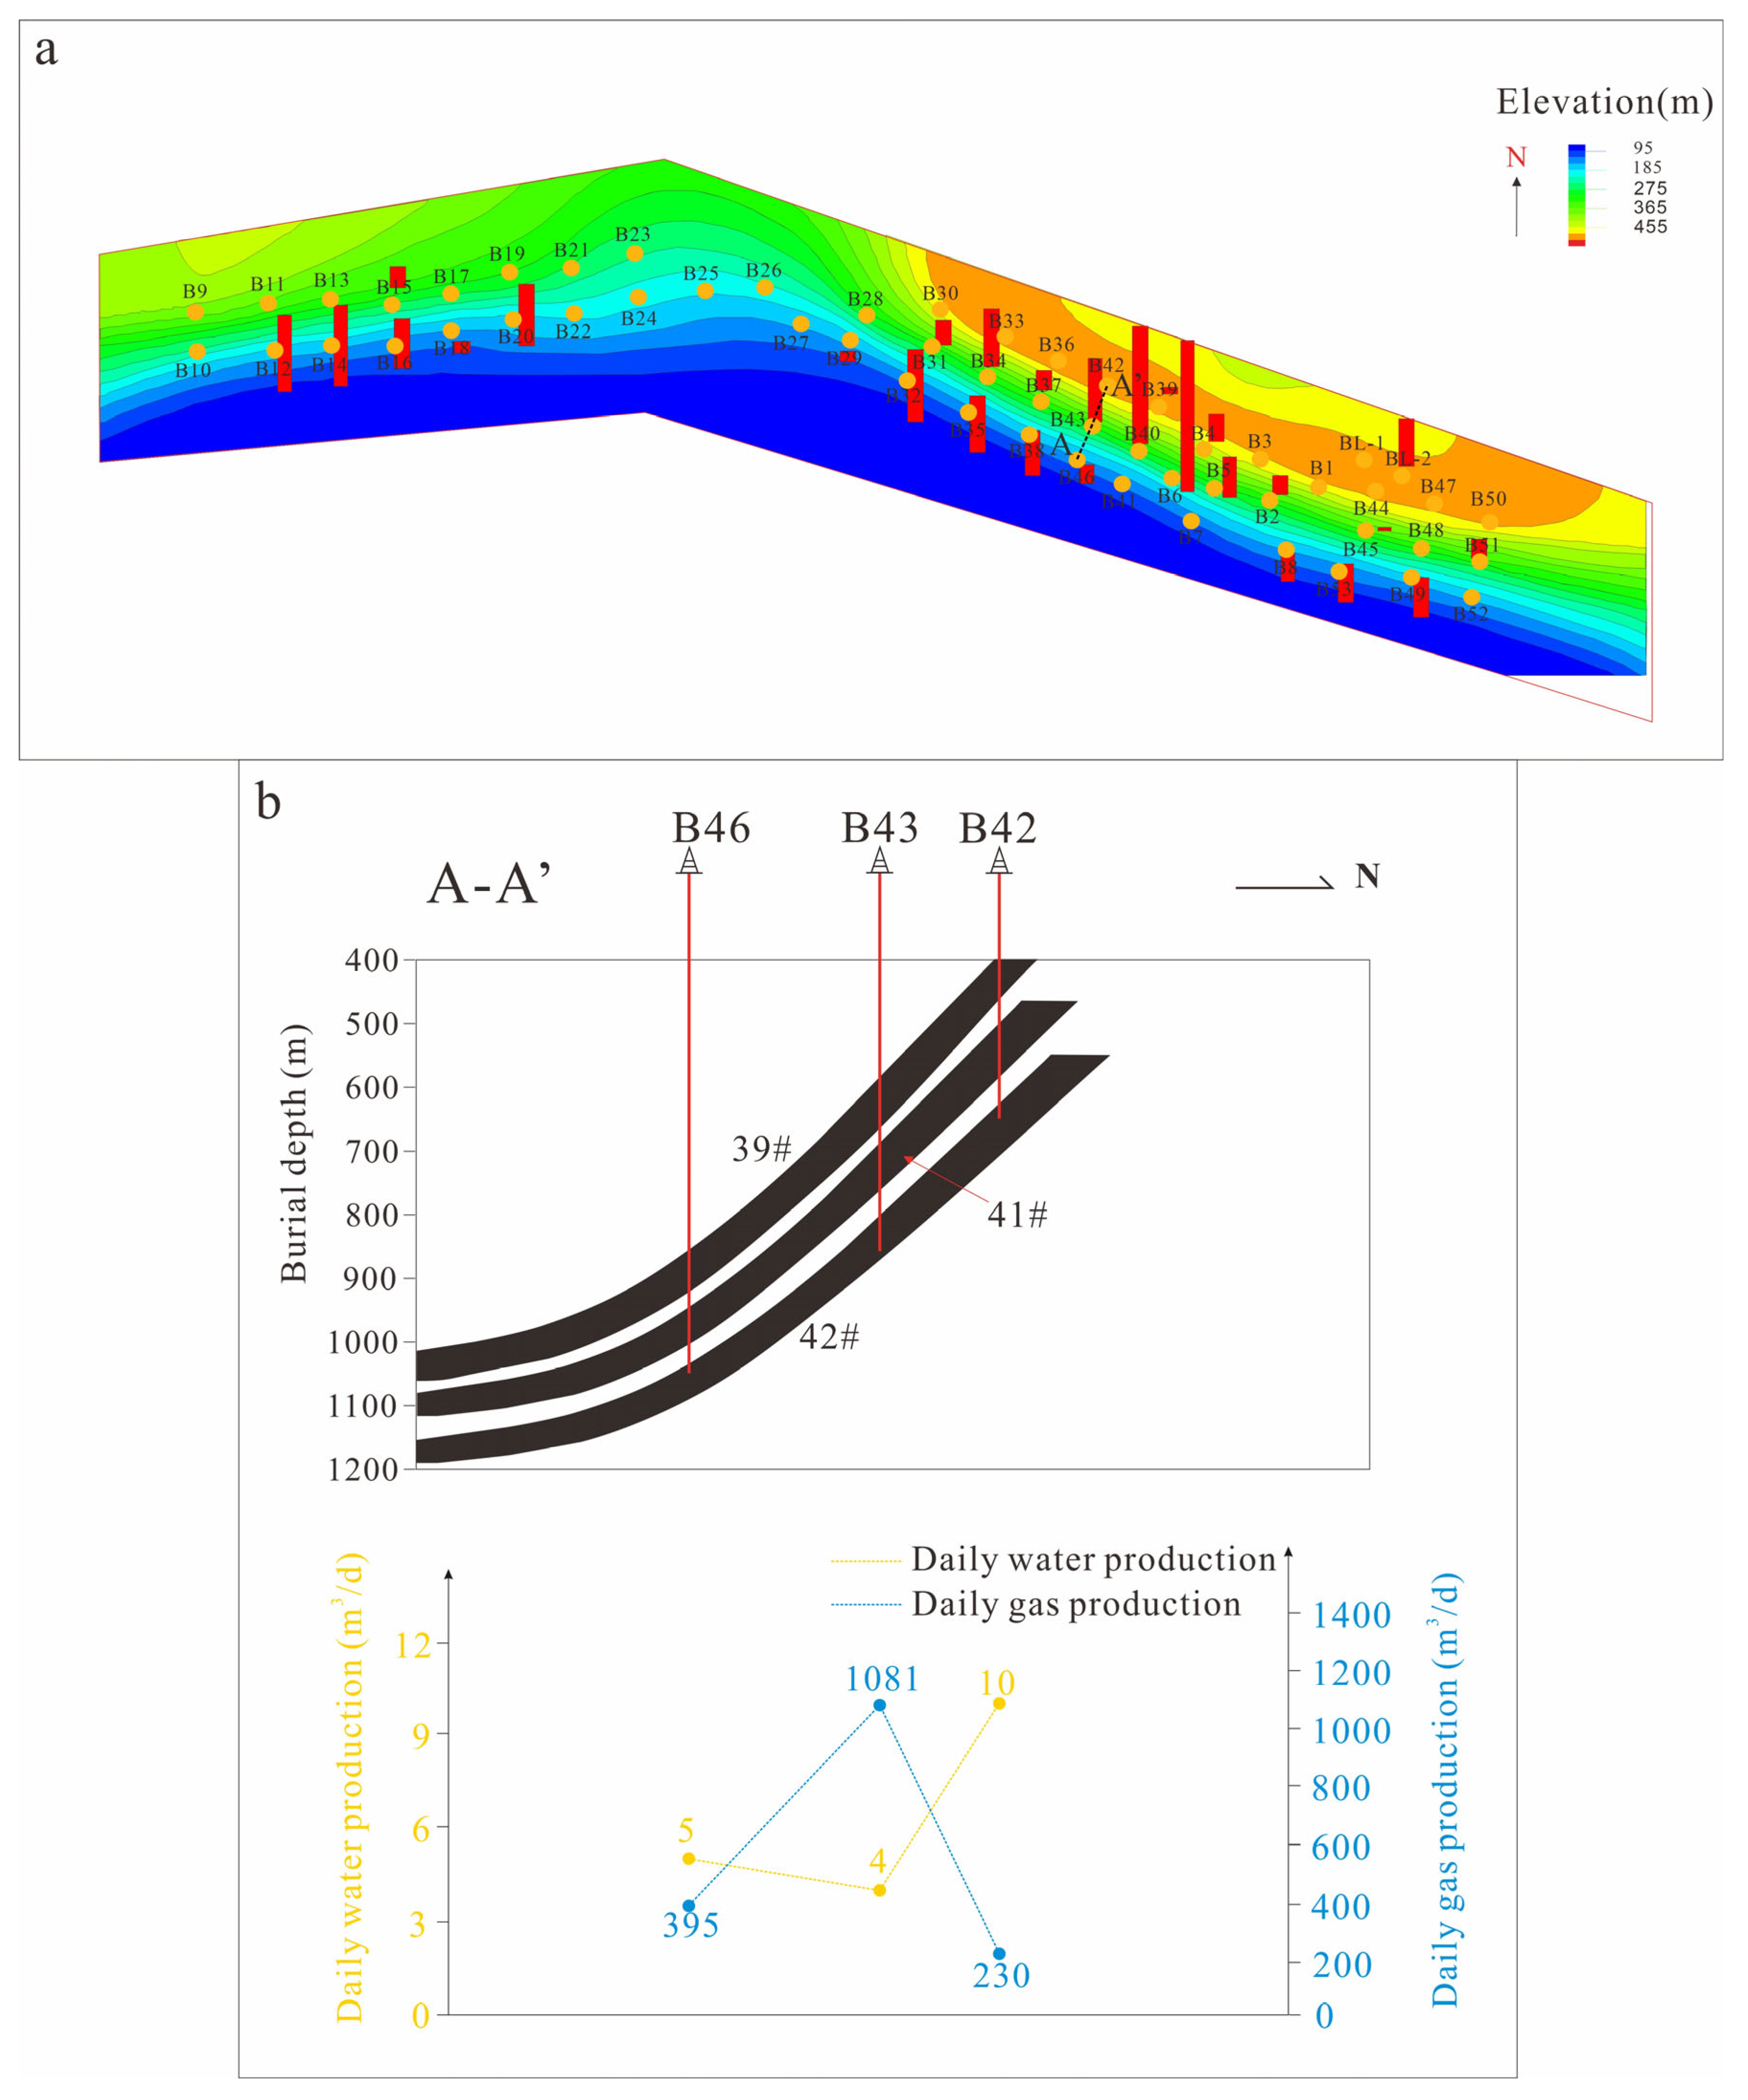
The relationship between gas production and structure location of CBM wells in the study area is shown in Figure 9a; in the western part of the study area, the gas production efficiency of CBM wells located in the deep part near the syncline core was better than that of wells located in the shallow part. However, in the three rows of CBM wells in the east, the gas production efficiency of wells located in the middle structure was the best, followed by the wells in the deep structure located near the syncline core, and wells in the shallow structure in the updip direction had the worst gas production efficiency. By selecting the A–A’ section, it can be visually observed that as the depth increased, the production efficiency first increased and then decreased (Figure 9b). The location of the A–A’ section in the study area can be seen in Figure 1. The reason for this may be that the shallow coal seams in the updip direction were affected by the coal wind oxidation, causing gas to escape along the coal seams, resulting in a decrease in gas content and saturation. In addition, under the influence of coal seam combustion, the permeability of the coal seams improved, strengthening the interaction between the surface water and formation water, making the water production of the coal seams high, which caused it to be difficult for the reservoir to depressurize and desorb. In deep coal seams, the overlying formation pressure was high, resulting in the closure of pores and fractures and a decrease in the formation permeability. In addition, under the influence of strong tectonic compression, stress concentration occurred in the syncline core, making it difficult for reservoir fracturing and transformation. By contrast, the wells in the central structure (the second row in the east) had suitable burial depths and were less affected by combustion zones, and thus, they had higher gas contents; in addition, they also had higher permeability and strong modifiability compared with the deep layers, which were conducive to obtaining higher gas productivity. It can be summarized that the dip angle had a significant impact on the productivity of the CBM wells in the BYR block.

5.1.2. Burial Depth

As shown in Table 2, there were multiple sets of coal seams and multiple stratigraphic associations in the BYR block, and single-layer and multi-layer (two or three layers) combined drainage were the main development methods for CBM. The average burial depth of the combined drainage coal seams was used to analyze the impact on the productivity of the CBM wells.
According to Figure 10a, the correlation between the gas production rate of CBM wells and the average burial depth of the target coal seam was nonlinear. With the increase in the burial depth, the gas production rate of CBM wells first increased and then decreased, and except for several wells with high water production, the water production rate had a complex trend of change (Figure 10b). The high water production rate of several wells may have been due to the high water content of the coal seams themselves in the central and western regions of the study area or the supply of nearby layers to the coal seams, resulting in high water production rate. The wells with relatively good productivity performance were concentrated in the range of 750–1000 m, and they could have an ADGP greater than 1000 m3/d, which has greater potential for CBM production.
Figure 9. Relationship between gas production and structure location of CBM wells in the BYR block. (a) Relationship diagram between coalbed methane well production capacity and structural location; (b) Section A-A’: Gas production of three coalbed methane wells at different structural positions. “#” representing the coal seam number.
Energies 16 08063 g009
The wells with a burial depth of less than 750 m and greater than 1000 m were all low-gas-production wells. Compared with other basins with flat coal seams, such as the Qinshui and Ordos Basins, the difference in the burial depth of coal seams in the BYR block was mainly caused by the dip angle. The updip direction of the coal seams had a small burial depth, strong hydrodynamic conditions, and was affected by wind oxidation zones and coal seam spontaneous combustion, which are not conducive to the enrichment of CBM. With the increase in burial depth, the preservation conditions became better and better, but the seepage conditions became worse, which was not conducive to CBM output. It is known that the permeability of coal seams decreases with the increase in burial depth, especially when the burial depth is greater than 800 m, where the permeability will decline sharply to less than 0.1 mD. Moreover, the strong in situ stress in deep coal seams increases the difficulty of hydraulic fracturing transformation in coal seams, and thus, it is not beneficial for CBM extraction when the burial depth is too large.
As shown in Figure 10c, the wells with high gas production all had low water production, and the wells with ADGP greater than 1000 m3/d all had an ADWP less than 5 m3/d, which suggests that high water production is a key factor in inhibiting gas production. This is also an important reason for the poor production performance of shallow CBM wells. The high water production rate makes it difficult for the reservoir to depressurize and for gas to be desorbed.
In summary, the impact of the burial depth on gas well productivity is actually determined by the relationship between gas content, preservation conditions and permeability. An appropriate burial depth of coal seams can not only ensure high gas content and a stable hydrodynamic environment but also prevent low permeability, thus allowing CBM wells to fully release gas.

5.1.3. Thickness and Number of Co-Production Coal Seams

The total thickness of coal seams is an important parameter that affects the productivity of CBM wells. Under the same conditions, a thick coal seam is more likely to have a larger gas supply capacity [14,43]. In addition, a coal seam has the characteristics of low porosity and permeability, and thus, a thick coal seam usually has self-sealing properties for gas preservation and can effectively prevent gas escape. Except for well B77, the ADGP gradually increased with the increase in coal seam thickness (Figure 10d). Although the thickness of the coal seam in well B77 was small, it had a suitable burial depth and high gas content, which was also conducive to gas production.
Figure 10. Plots of average daily gas production (a) and average daily water production (b) versus burial depth of coal seams; plot of average daily gas production versus average daily water production (c); plot of thickness versus buried depth of coal seam (d). The red dots represent the data in Table 2, the black dots represent values that differ significantly from the red dots data, and the dashed lines represent the trend lines of the red dots data.
Energies 16 08063 g010
There are various combinations of coal seams for CBM drainage in this area. As shown in the statistical diagram of the proportion of the co-production coal seam number (Figure 11a), the CBM wells drainage in the study area mainly displayed multi-layer co-production and the three-layer co-production accounted for the largest proportion.
From the gas production distribution histogram for different co-production coal seam numbers (Figure 11b), it can be seen that the wells with ADGP greater than 1000 m3/d occurred in the nos. 39+41+42 coal seam co-production, the nos. 41+42 coal seam co-production and single-layer production of the no. 42 coal seam. The co-production wells based on the nos. 39+41 coal seams and nos. 42+44 coal seams had the worst productivity performances, with the ADGPs both less than 500 m3/d. However, the low-production wells also appeared in the wells with nos. 39+41+42 coal seams co-production. As we know, the most important factor restricting multi-layer co-production is interlayer interference, which is caused by differences in pressure systems, water content, permeability and other factors of different coal seams. The total thickness of coal seams in multi-layer co-production is usually larger than that of a single coal seam, but the existence of interlayer differences may lead to different coal seams asynchrony in depressurization, desorption, and gas and water flow behaviors, thereby affecting the gas production efficiency. It can be seen from Figure 2, the spacing between the nos. 41 and 42 coal seams was relatively small, while the spacing between the nos. 39 and 41 coal seams and the spacing between the no. 42 and 44 coal seams were relatively large, which resulted in larger interlayer interference and low gas production. This also indicates that the occurrence of low-production wells during the three-layer co-production of the nos. 39+41+42 coal seams was more likely caused by interlayer interference between the nos. 39 and 41 coal seams.

5.2. Geochemical Responses of Gas and Water Production

5.2.1. Response of Ion Concentration and TDSs of Coal Seam Water

In the closed groundwater environment, the mineralization degree was high and the groundwater activity was weak, which was conducive to the enrichment and preservation of the CBM. The co-produced water was rich in Ca2+, Mg2+ and SO 4 2 , indicating that the groundwater was in the oxidation environment, close to the water source recharge area, and in an open hydrological environment. Meanwhile, the enrichment of Na+, K+, HCO3 and Cl indicates that groundwater was in a reducing environment, far away from the water source recharge area, and in a closed environment. A long retention time of the groundwater causes an increase in the mineralization degree and a low degree of hydrodynamic activity [34,44,45]. In a closed underground reducing environment, the lower the stratum water desulfurization coefficient (r SO 4 2 × 100/rCl) and the sodium/chloride coefficient (rNa+/rCl), the easier it is for CBM to be enriched and preserved [19].
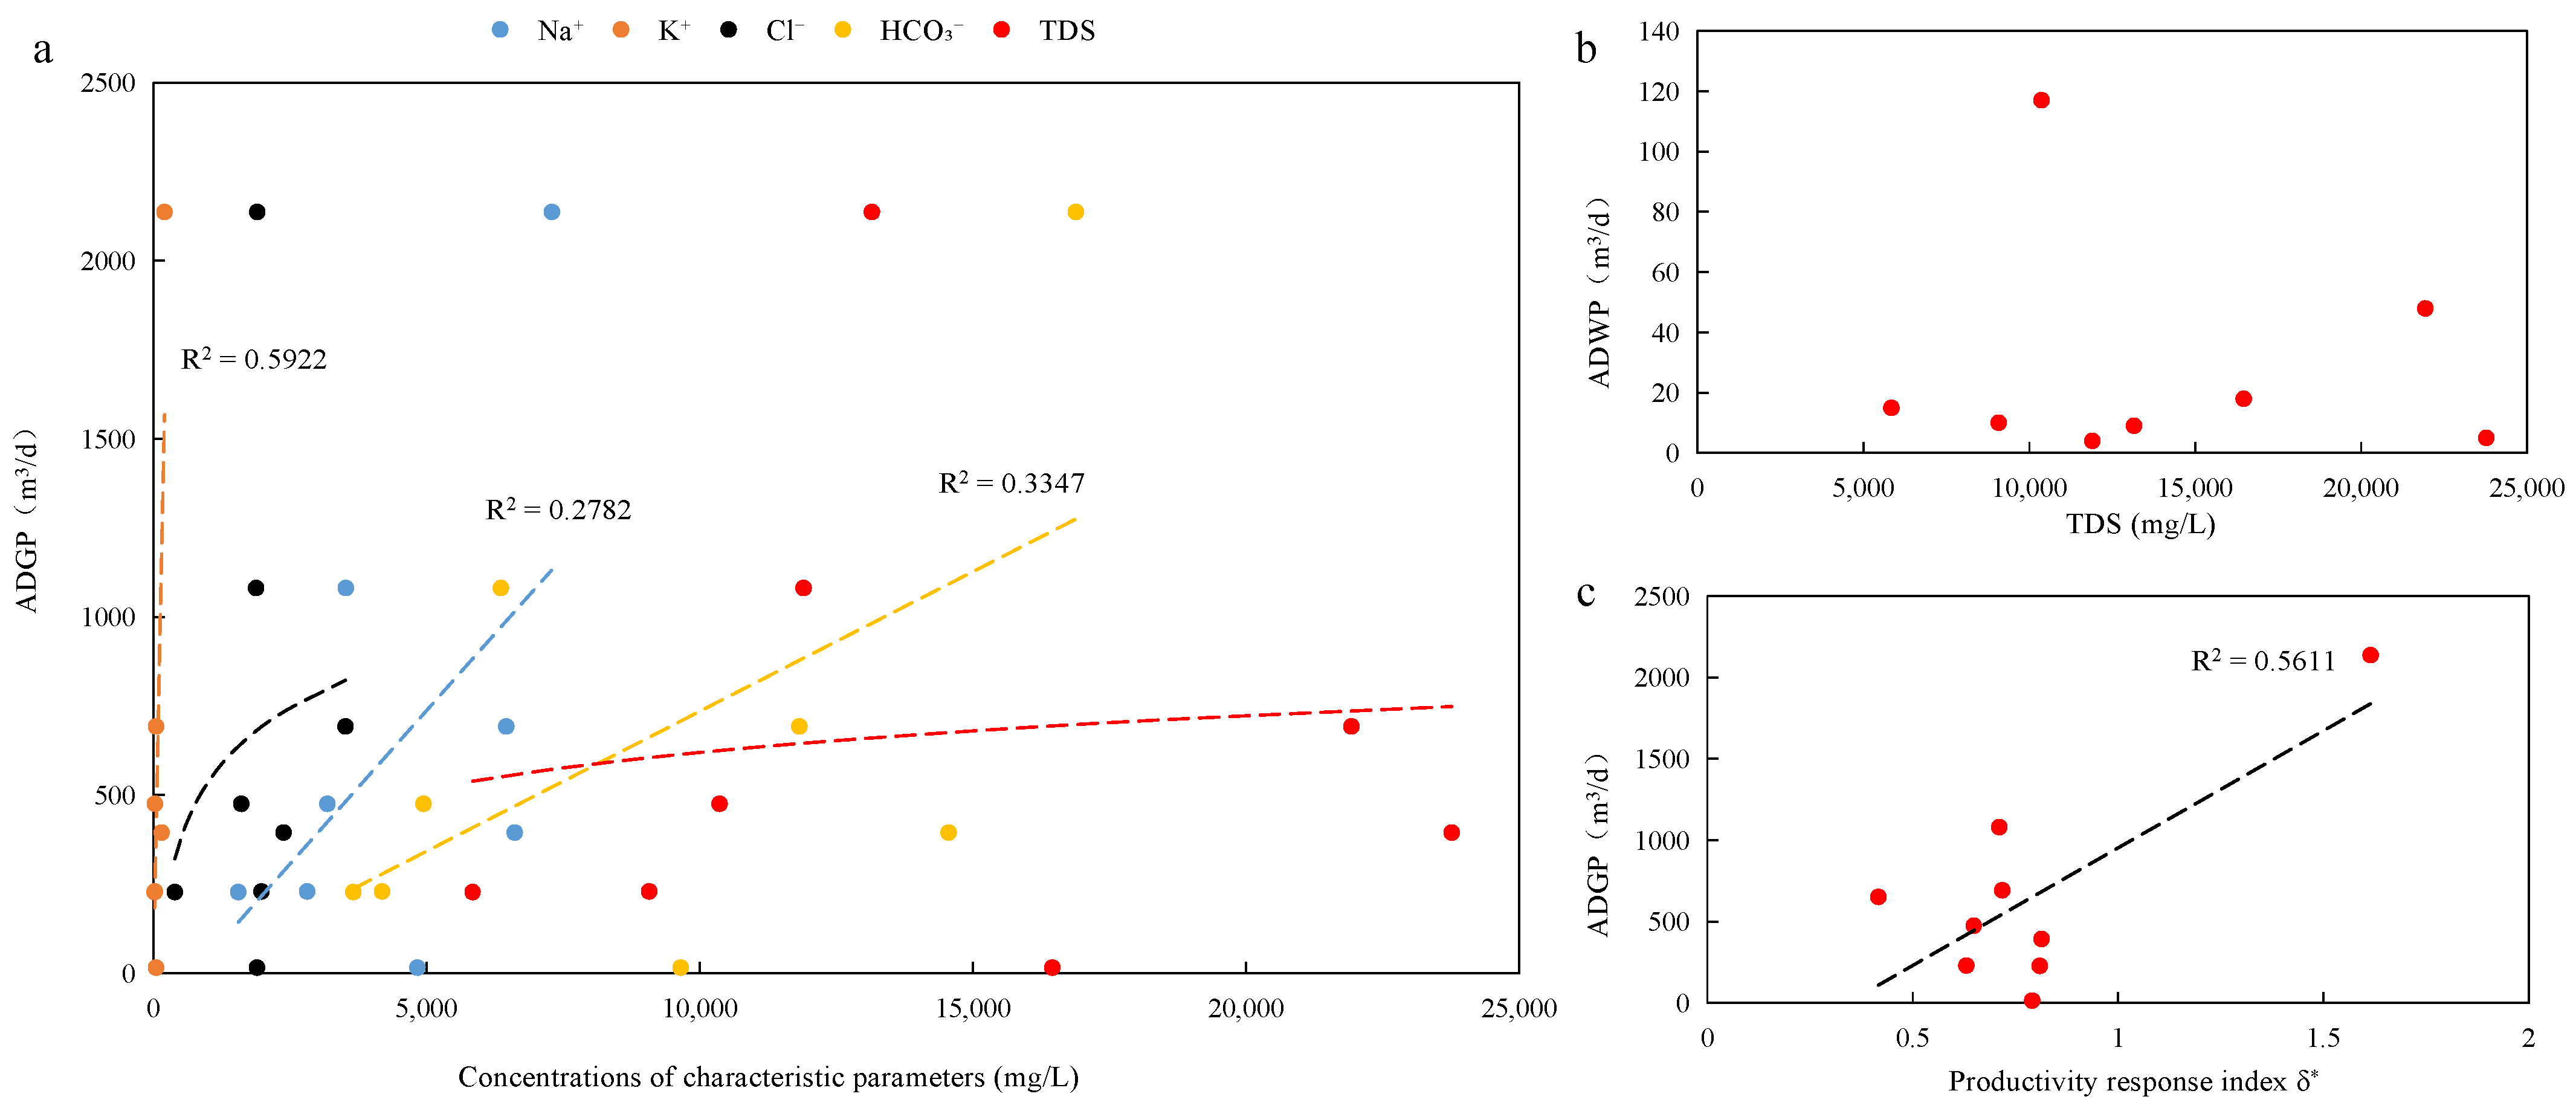
According to the above studies, Na+, HCO3 and Cl were enriched in this area, indicating the formation in a reducing environment. It was found that the concentrations of Na+, K+ and HCO3 had a good positive correlation with ADGP (Figure 12a), while the correlation between Cl ion and TDSs and ADGP was poor. With the increase in TDSs in the coal seam water, the ADGP of the gas well showed a trend of first increasing and then decreasing. This means that it was not the case that the higher the TDSs of the coal seam water, the higher the gas production. Because the coal seams with high TDSs usually had a larger burial depth, the stress of the reservoir was high and the in situ permeability was extremely low, thus it was difficult to transform the reservoir, which increased the difficulty in gas flow. The ADWP showed a weak negative correlation with the TDSs of coal seam water (Figure 12b), which indicates that the weaker the formation closure degree, the easier it was to produce a large volume of water.
On the basis of the productivity response index δ established by Yang [46] et al., this study established a new productivity response index δ* suitable for the research area and analyzed the correlation between the productivity response index δ* and the ADGP. The new productivity response index δ* was established based on the concentrations of the main ions (Na+, K+, HCO3, Ca2+, Mg2+, SO 4 2 and Cl) and the TDSs of the coal seam water (Formula 1). As shown in Figure 12c, there was a good correlation between δ* and the ADGP, and the ADGP was increased with the increase in δ*, indicating that the productivity response index of the coupling geochemical indicators can reflect the productivity potential of CBM wells.
δ = K + + Na + + HCO 3 Ca + + Mg + + Cl + SO 4 2 + TDS
In the newly established productivity response index δ* formula (Formula (1)), the TDSs are introduced as a parameter, which can reflect the burial depth of the formation. In the study area, with the increase in TDSs, the ADGP showed a trend of first increasing and then decreasing. Compared with the concentration values of Ca2+, Mg2+ and SO 4 2 , the TDS values were large, and thus, the productivity response index δ* could also be approximately expressed as
δ = Na + + HCO 3 TDS
That is to say, the larger the proportion of Na+ and HCO3 content in TDSs, the more favorable it is for gas production.
In the formula, (Na+), (K+), (HCO3), (Ca2+), (Mg2+), ( SO 4 2 ) and (Cl) are the ion concentrations (mg/L) of Na+, K+, HCO3, Ca2+, Mg2+, SO 4 2 and Cl, respectively.

5.2.2. Response of Stable Isotopes of Gas and Water

The correlations of the average daily gas and water production with δD-H2O and δ18O-H2O from the CBM wells were analyzed. As shown in Figure 13, the ADGP and ADWP both had negative correlations with δD-H2O and δ18O-H2O, where the larger the δD-H2O and δ18O-H2O, the smaller the ADGP and ADWP. It is generally believed that the larger hydrogen and oxygen isotope values in the retention area (reducing environment) are conducive to the enrichment and preservation of CBM. However, the retention degree of groundwater was jointly controlled by the burial depth and syncline structure, and for the BYR block, the groundwater retention area was located in the deep coal seam area near the syncline core where it is subjected to strong compressive stress and has low permeability, which is not conducive to reservoir fracturing and transformation, and therefore, does not show good gas production effect. Therefore, the relationship between δD-H2O and δ18O-H2O and gas production was inconsistent with previous studies.
In summary, the productivity of the CBM wells in the research area was jointly controlled by the burial depth, structure, thickness and number of co-production coal seams, and hydrogeological conditions. Due to the influence of the structural characteristics, the productivity efficiency was the best in the middle structure, which was basically consistent with the characteristics exhibited by the burial depth. This was affected by the interlayer interference between the nos. 39 and 41 coal seams, which could lead to the occurrence of low-production wells during the three-layer co-production.

6. Conclusions

In this study, the productivity characteristics of CBM wells in the Baiyang River block of the southern Junggar Basin were analyzed, and the geological and geochemical responses to productivity were revealed. The following conclusions were drawn:
(1)
The productivity could be classified into three types. Type I wells were characterized by medium gas production and low water production with ADGP > 1000 m3/d and ADWP < 8 m3/d. Type II wells were characterized by low gas production and low water production with ADGP < 1000 m3/d and ADWP < 8 m3/d. Type III wells had the characteristics of low gas production and high water production with ADGP < 1000 m3 and ADWP > 8 m3/d.
(2)
The productivity of CBM wells in the BYR block was jointly controlled by the burial depth, structure, thickness and number of co-production coal seams, and hydrogeological conditions. The burial depth of a coal seam between 750 and 1000 m was most beneficial to enhancing gas production. Coal seams with a depth of less than 500 m were generally affected by wind oxidation zones, coal seam spontaneous combustion and strong hydrodynamic conditions, resulting in poor gas production. Coal seams with a depth greater than 1000 m were constrained by low permeability and high stress, making reservoir transformation difficult and not conducive to gas output. The total thickness of co-production coal seams has a positive effect on the productivity of gas wells, but the productivity was also affected by the number of co-production coal seams and interlayer interference. In the BYR block, the combination of the nos. 41 and 42 coal seams was the most favorable combination form for CBM co-production.
(3)
The coal seam water in the BYR block was the Na-HCO3-Cl type, and the TDSs value was generally high and increased sequentially from east to west and from north to south. The concentration of the main ions (Na+, Cl and HCO3) increased with the increase in the burial depth. Overall, the coal seam water was in a closed reducing environment. The coal seam water mainly originated from atmospheric precipitation and had obvious 18O drift characteristics, which were mainly influenced by high-temperature fluid–rock interactions, followed by evaporation. The productivity of CBM wells had a good response to the Na+, K+ and HCO3 concentrations but a poor response to δD-H2O and δ18O-H2O. A productivity response index δ* was established based on the concentrations of the main ions (Na+, K+, HCO3, Ca2+, Mg2+, SO 4 2 and Cl) and TDSs of the coal seam water, and the productivity of the CBM wells had a positive correlation with δ*. As a result, the δ* can be used for predicting the productivity of CBM wells in other areas in the Southern Junggar Basin.

Author Contributions

Investigation, Y.Z. and Y.W.; Data curation, B.Z.; Writing—original draft, B.S.; Writing—review & editing, S.T. (Shuling Tang); Supervision, S.T. (Shu Tao) and S.C. All authors have read and agreed to the published version of the manuscript.

Funding

This work was financially supported by the “14th Five Year Plan” Forward-Looking Basic Major Science and Technology Project of CNPC (2021DJ2306-01); Tackling applied science and technology projects of China National Petroleum Corporation (2023zz18-01) and the National Natural Science Foundation of China (42272200, 42102205).

Data Availability Statement

Data are contained within the article.

Conflicts of Interest

Author B.S. was employed by the company PetroChina. The remaining authors declare that the research was conducted in the absence of any commercial or financial relationships that could be construed as a potential conflict of interest. The authors declare that this study received funding from China National Petroleum Corporation. The funder was not involved in the study design, collection, analysis, interpretation of data, the writing of this article or the decision to submit it for publication.

References

  1. Al-Jubori, A.; Johnson, S.; Boyer, C.; Lambert, S.W.; Bustos, O.A.; Pashin, J.C.; Wray, A. Coalbed methane: Clean energy for the world. Oilfield Rev. 2009, 21, 4–13. [Google Scholar]
  2. Moore, T.A. Coalbed methane: A review. Int. J. Coal Geol. 2012, 101, 36–81. [Google Scholar] [CrossRef]
  3. Dai, S.; Ren, D.; Chou, C.; Finkelman, R.B.; Seredin, V.V.; Zhou, Y. Geochemistry of trace elements in Chinese coals: A review of abundances, genetic types, impacts on human health, and industrial utilization. Int. J. Coal Geol. 2012, 94, 3–21. [Google Scholar] [CrossRef]
  4. Lau, H.C.; Li, H.; Huang, S. Challenges and opportunities of coalbed methane development in China. Energy Fuels 2017, 31, 4588–4602. [Google Scholar] [CrossRef]
  5. Yun, J.; Xu, F.; Liu, L.; Zhong, N.; Wu, X. New progress and future prospects of CBM exploration and development in China. Int. J. Min. Sci. Technol. 2012, 22, 363–369. [Google Scholar] [CrossRef]
  6. Geng, M.; Chen, H.; Chen, Y.; Zhen, L.; Chen, S.; Jiang, X. Methods and results of the fourth round national CBM resources evaluation. Coal Sci. Technol. 2018, 46, 64–68. [Google Scholar]
  7. Liu, R.; Liu, F.; Zhou, W.; Li, J.; Wang, H. An analysis of factors affecting single well deliverability of CBM in the Qinshui Basin. Nat. Gas Ind. 2008, 28, 30–33. [Google Scholar]
  8. Chen, Z.; Wang, Y.; Yang, J.; Wang, X.; Chen, Y.; Zhao, Q. Influencing factors on coa-lbed methane production of single well: A case of Fanzhuang Block in the south part of Qinshui Basin. Acta Pet. Sin. 2009, 30, 409–412+416. [Google Scholar]
  9. Tao, S.; Shang, D.; Xu, H.; Lv, Y.; Zhao, X. Analysis on influence factors of CBM wells productivity and development proposals in southern Qinshui Basin. J. China Coal Soc. 2011, 36, 194–198. [Google Scholar]
  10. Tao, S.; Tang, D.; Xu, H.; Gao, L.; Fang, Y. Factors controlling high-yield CBM vertical wells in the Fanzhuang block, southern Qinshui basin. Int. J. Coal Geol. 2014, 134–135, 38–45. [Google Scholar] [CrossRef]
  11. Kaiser, W.R.; Hamilton, D.S.; Scott, A.R.; Tyler, R.; Finley, R.J. Geological and hydrological controls on the producibility of CBM. J. Geol. Soc. 1994, 151, 417–420. [Google Scholar] [CrossRef]
  12. Zhang, S.; Tang, S.; Li, Z.; Pan, Z.; Shi, W. Study of hydrochemical characteristics of CBM co-produced water of the Shizhuangnan Block in the southern Qinshui basin, China, on its implication of CBM development. Int. J. Coal Geol. 2016, 159, 169–182. [Google Scholar] [CrossRef]
  13. Chen, G.U.; Yong, Q.I.; Dong, H.A. Ions dynamics of produced water and indication for CBM production from wells in Bide-Santang Basin, Western Guizhou. J. China Coal Soc. 2017, 42, 680–686. [Google Scholar]
  14. Zhang, Y.; Li, S.; Tang, D.; Liu, J.; Lin, W.; Feng, X.; Ye, J. Geological and engineering controls on the differential productivity of CBM wells in the Linfen block, southeastern Ordos Basin, China, Insights from geochemical analysis. J. Pet. Sci. Eng. 2022, 211, 110159. [Google Scholar] [CrossRef]
  15. Zhao, J.; Tang, D.; Xu, H.; Lv, Y.; Tao, S. High production indexes and the key factors in CBM production, A case in the Hancheng block, southeastern Ordos Basin, China. J. Pet. Sci. Eng. 2015, 130, 55–67. [Google Scholar] [CrossRef]
  16. Ayers, W.B. Coalbed gas systems, resources, and productivity and a review of con-trasting cases from the San Juan and Powder River basins. AAPG Bull. 2002, 86, 1853–1890. [Google Scholar]
  17. Guo, C.; Qin, Y.; Xia, Y.; Ma, D.; Han, D. Source discrimination of produced water from CBM commingling wells based on thehydrogen and oxygen isotopes; a case study of the Upper Permian, Bide-Santang Basin, western Guizhou area. Acta Pet. Sin. 2017, 38, 493–501. [Google Scholar]
  18. Li, Z.; Tang, S.; Wang, X.; Zheng, G.; Zhu, W.; Wang, S.; Zhang, J. Relationship between water chemical composition and production of CBM wells, Qinshui basin. J. China Univ. Min. Technol. 2011, 40, 424–429. [Google Scholar]
  19. Wang, B.; Sun, F.; Tang, D.; Zhao, Y.; Song, Z.; Tao, Y. Hydrological control rule on CBM enrichment and high yield in FZ Block of Qinshui Basin. Fuel 2015, 140, 568–577. [Google Scholar] [CrossRef]
  20. Tang, S.; Tang, D.; Sun, B.; Tao, S.; Zhang, T.; Pu, Y.; Zhang, A.; Zhi, Y. Research progress of multi-source and multi-stage genesis of CO2-enriched CBM and the enlightenments for its exploration and development. Coal Geol. Explor. 2022, 50, 58–68. [Google Scholar]
  21. Li, Y.; Cao, D.; Wei, Y.; Wang, A.; Zhang, Q.; Wu, P. Middle to low rank CBM accumulation and reservoiring in the southern margin of Junggar Basin. Acta Pet. Sin. 2016, 37, 1472–1482. [Google Scholar]
  22. Wang, S.; Wang, F.; Hou, G.; Wu, X.; Zhang, C.; Zhang, Y.; Hu, J. CBM development well type for steep seam in Fukang Baiyanghe mining area, Xin-jiang. J. China Coal Soc. 2014, 39, 1914–1918. [Google Scholar]
  23. Yong, X. CBM Drainage Impacting Factors and Single Well Output Prediction in Fukang Baiyanghe Mine Area, Xinjiang. Coal Geol. China 2017, 29, 45–47. [Google Scholar]
  24. Tang, D.; Yang, S.; Tang, S.; Tao, S.; Chen, S.; Zhang, A.; Pu, Y.; Zhang, T. Advance on exploration-development and geological research of CBM in the Junggar Basin. J. China Coal Soc. 2021, 46, 2412–2425. [Google Scholar]
  25. SY/T 5523−2016; Method for Analysis of Oilfiled Water. China Standard Press: Beijing, China, 2016.
  26. Zhang, Y.; Li, S.; Tang, D.; Zhao, X.; Zhu, S.; Ye, J. Structure- and hydrology-controlled isotopic coupling and heterogeneity of coalbed gases and co-produced water in the Yanchuannan block, southeastern Ordos Basin. Int. J. Coal Geol. 2020, 232, 103626. [Google Scholar] [CrossRef]
  27. Xu, B.; Li, X.; Haghighi, M.; Du, X.; Yang, X.; Chen, D.; Zhai, Y. An analytical model for desorption area in coal-bed methane production wells. Fuel 2013, 106, 766–772. [Google Scholar] [CrossRef]
  28. Men, X.; Yan, X.; Wang, F.; Chen, C. The influence of high yield water on gas production CBM wells and its preventive measures. China Min. Mag. 2017, 26, 393–398. [Google Scholar]
  29. Zhang, P. Study on CBM Well Capacity Grading Scheme. China CBM 2007, 4, 28–29+27. [Google Scholar]
  30. Van Voast, W.A. Geochemical signature of formation waters associated with CBM. AAPG Bull 2003, 87, 667–676. [Google Scholar] [CrossRef]
  31. Zhang, J.; Liu, D.; Cai, Y.; Pan, Z.; Yao, Y.; Wang, Y. Geological and hydrological controls on the accumulation of CBM within the No.3 coal seam of the southern Qinshui Basin. Int. J. Coal Geol. 2017, 182, 94–111. [Google Scholar] [CrossRef]
  32. Liu, H.; Luo, Y.; Lei, K.; Kong, X.; Zhao, L.; Wang, X.; Qi, M. Hydrochemical characteristics and dynamic evolution of hydrochemicalfield for the produced water of CBM wells. Hydrogeol. Eng. Geol. 2019, 46, 92–99. [Google Scholar]
  33. Rice, C.A. Production waters associated with the Ferron CBM fields, central Utah, chemical and isotopic composition and volumes. Int. J. Coal Geol. 2003, 56, 141–169. [Google Scholar] [CrossRef]
  34. Tian, W.; Shao, L.; Sun, B.; Zhao, S.; Huo, W. Chemical behaviors of produced water from CBM wells in the Baode area, Shanxi, China, and their control on gas accumulation. Nat. Gas Ind. 2014, 34, 15–19. [Google Scholar]
  35. Craig, H. Isotopic variations in meteoric waters. Science 1961, 133, 1702–1703. [Google Scholar] [CrossRef] [PubMed]
  36. Li, H.; Jiang, Z.; Zhou, H.; Wang, Y.; Cui, T.S.; Li, Y.; Luo, W.Q. Variation Characteristics of Oxygen and Hydrogen Stable Isotope in Precipitation, Soil Water and Groundwater in the Junggar Basin—Taking Fukang Station of Desert Ecology as a Case. Res. Soil Water Conserv. 2008, 15, 105–108. [Google Scholar]
  37. Li, H.; Jiang, Z.; Wang, Y.; Luo, W.J. Variation Characteristics of Stable Isotopes in the Precipitation of Xinjiang. Res. Soil Water Conserv. 2009, 16, 157–161. [Google Scholar]
  38. Kloppmann, W.; Girard, J.P.; Negrél, P. Exotic stable isotope compositions of saline waters and brines from the crystalline basement. Chem. Geol. 2002, 184, 49–70. [Google Scholar] [CrossRef]
  39. Kinnon, E.C.P.; Golding, S.D.; Boreham, C.J.; Baublys, K.; Esterle, J. Stable isotope and water quality analysis of coal bed methane production waters and gases from the Bowen Basin, Australia. Int. J. Coal Geol. 2010, 82, 219–231. [Google Scholar] [CrossRef]
  40. Golding, S.D.; Boreham, C.J.; Esterle, J.S. Stable isotope geochemistry of coal bed and shale gas and related production waters, a review. Int. J. Coal Geol. 2013, 120, 24–40. [Google Scholar] [CrossRef]
  41. Hamilton, S.K.; Golding, S.D.; Baublys, K.A.; Esterle, J. Stable isotopic and molecular composition of desorbed coal seam gases from the Walloon Subgroup, eastern Surat Basin, Australia. Int. J. Coal Geol. 2014, 122, 21–36. [Google Scholar] [CrossRef]
  42. Criss, R.E.; Taylor, H.P., Jr. An 18O/16O and D/H study of Tertiary hydrothermal systems in the southern half of the Idaho batholith. GSA Bull. 1983, 94, 640–663. [Google Scholar] [CrossRef]
  43. Kang, J.; Fu, X.; Gao, L.; Liang, S. Production profile characteristics of large dip angle coal reservoir and its impact on CBM production, A case study on the Fukang west block, southern Junggar Basin, China. J. Pet. Sci. Eng. 2018, 171, 99–114. [Google Scholar] [CrossRef]
  44. Guo, C.; Qin, Y.; Xia, Y.; Ma, D.; Han, D.; Chen, Y.; Chen, W.; Jian, K.; Lu, L. Geochemical characteristics of produced water from CBM wells and implications for commingling CBM production, a case study of the Bide—Santang Basin, western Guizhou, China. J. Pet. Sci. Eng. 2017, 159, 666–678. [Google Scholar] [CrossRef]
  45. Yang, Z.; Wu, C.; Zhu, J.; Li, Y.; Qin, Z. Research progress on produced water geochemical from CBM wells in China. Coal Sci. Technol. 2019, 47, 110–117. [Google Scholar]
  46. Yang, Z.; Wu, C.; Zhang, Z.; Jin, J.; Zhao, L.; Li, Y. Geochemical significance of CBM produced water, A case study of developed test wellsin Songhe block of Guizhou province. J. China Univ. Min. Technol. 2017, 46, 830–837. [Google Scholar]
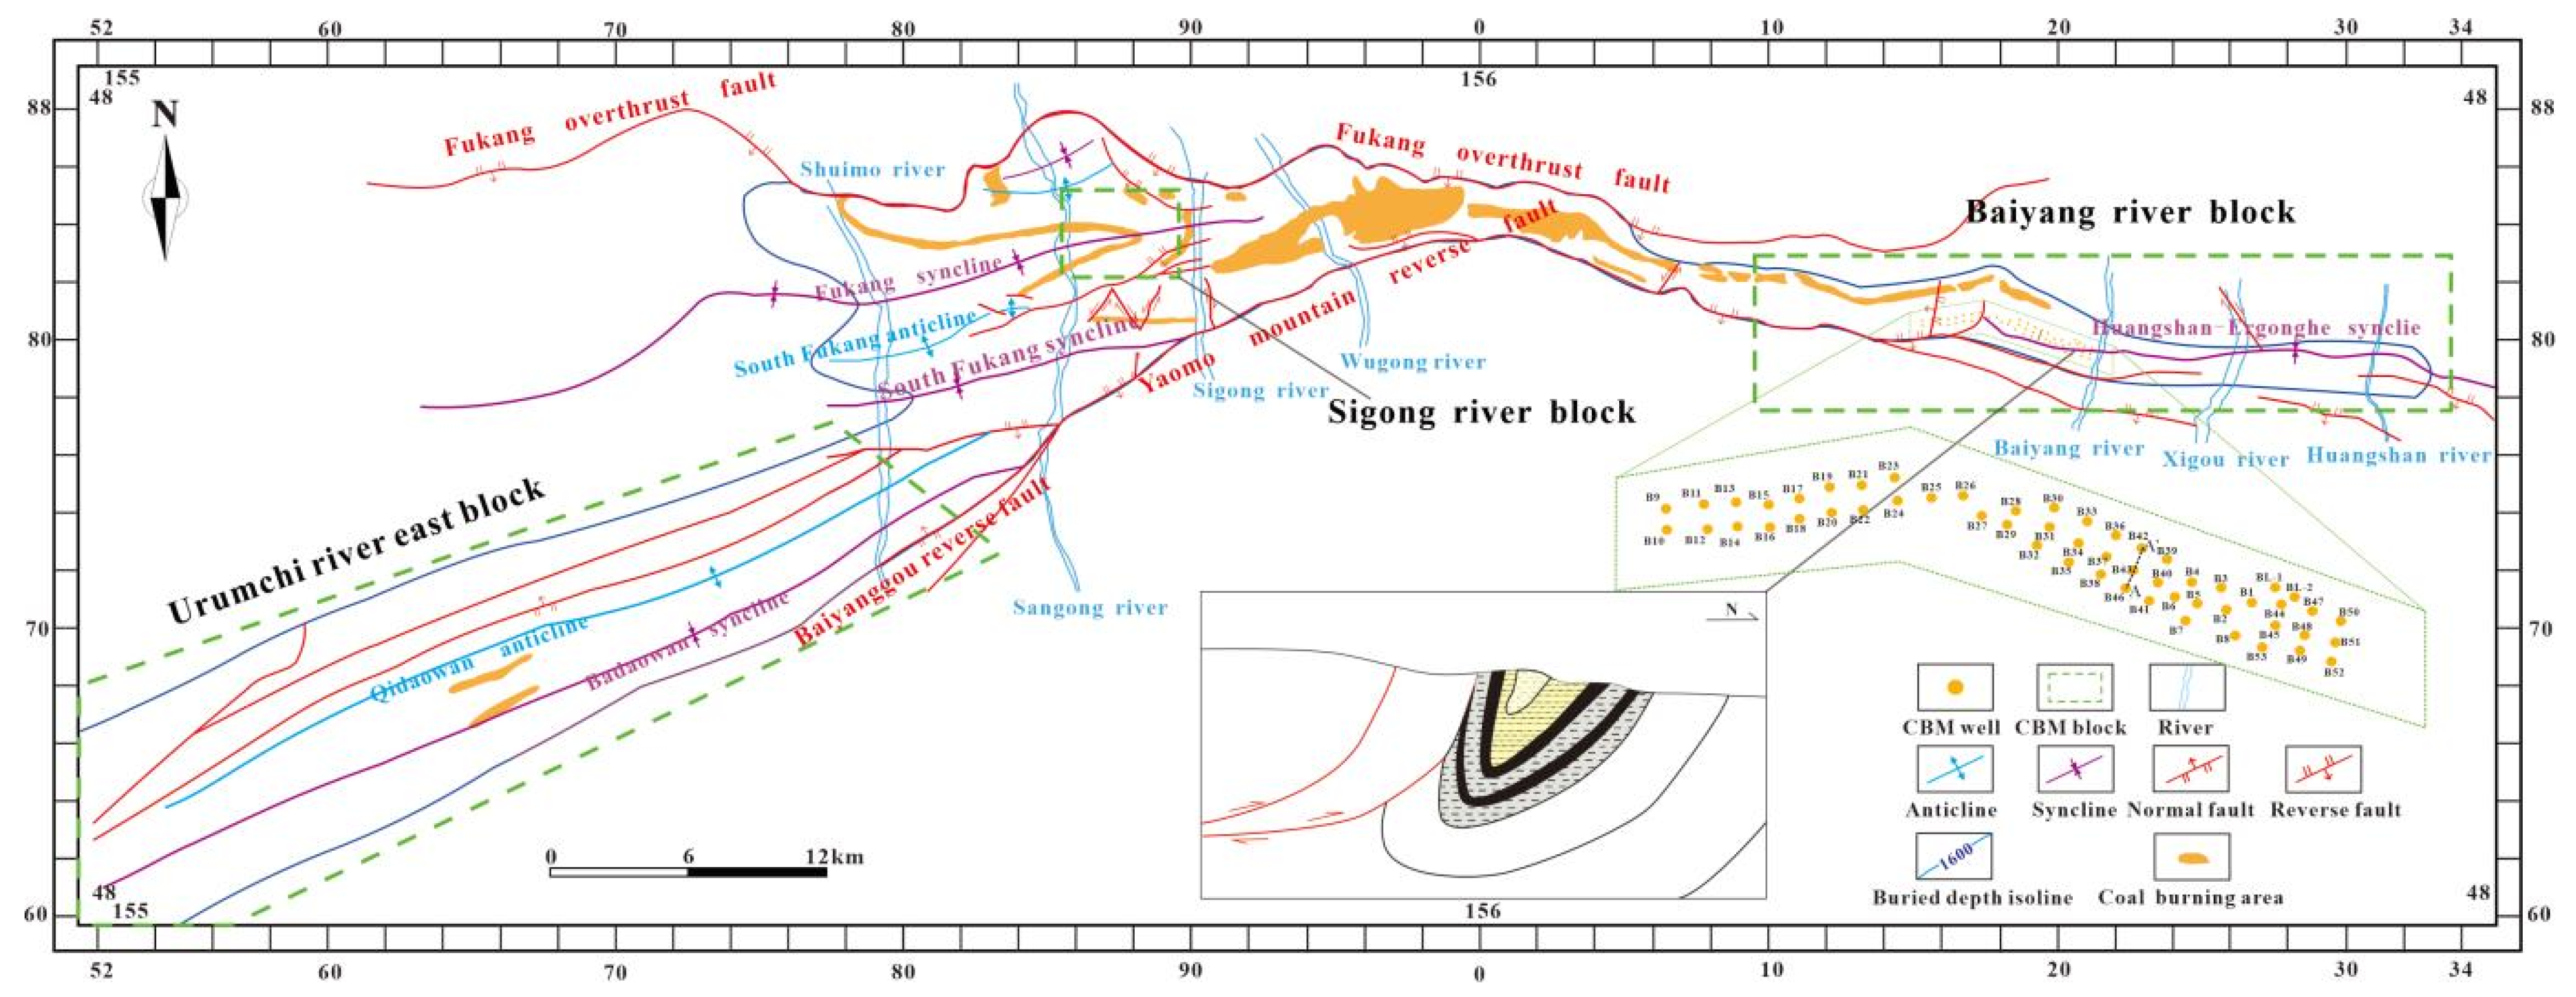
Figure 1. Structural location map of the research area.
Energies 16 08063 g001
Figure 2. Comprehensive stratigraphic histogram of coal-bearing strata in the south of the Junggar Basin. “#” representing the coal seam number.
Energies 16 08063 g002
Figure 3. CBM well location map in the BYR block.
Energies 16 08063 g003
Figure 4. Contour map of gas (a) and water (b) production.
Energies 16 08063 g004
Figure 5. Typical drainage curves of three types of wells in the BYR block. (a) Type I; (b) Type II; (c) Type III.
Energies 16 08063 g005
Figure 6. Piper trilinear diagram of hydrochemical compositions in coal seam water in the BYR block.
Energies 16 08063 g006
Figure 11. Statistical diagram of the proportions of different co-production coal seam numbers in the study area (a); gas production distribution histogram of different co-production coal seam numbers (b).
Energies 16 08063 g011
Figure 12. Relationship between ion composition and average daily gas production (a); relationship between average daily water production and TDSs (b); relationship between productivity response index δ* and average daily gas production (c). The dashed lines represent the trend line of the data points.
Energies 16 08063 g012
Figure 13. Relationship between isotopic composition and the average daily gas and water production. (a) Relationship between δ18O-H2O and average daily gas production; (b) relationship between δD-H2O and average daily gas production; (c) relationship between δ18O-H2O and average daily water production; (d) relationship between δD-H2O and average daily water production. The red dots represent the data in Table 2, the dashed lines represent the trend line of the data points.
Energies 16 08063 g013
Table 1. Geochemical characteristics of coal seam water produced in BYR block. “\” indicates that the data is not available.
NumberCBM Well NumberBurial Depth (m)Cations (mg/L)Anions (mg/L)TDSs
(mg/L)
pHIsotope Composition of H2O
K+Na+Ca+Mg2+Cl SO 4 2 HCO3 CO 3 2 δD (VSMOW, ‰)δ18O (VSMOW, ‰)
1B1\\50902421.913709.6111,300017,8007.5−103.9−12.3
2B10852.844.2563854.728.8241010.311,090019,2767.75−116.2−17.8
3B12911.914.9719250.229.72773914,577024,6467.74−111.1−14.9
4B14\\638050.137.7365096.110,900021,1007.29−117.4−12.0
5B16\\686040.138.9372096.112,000022,8007.5−116.8−12.3
6B18\\690050.136.5392019711,700022,8007.24−120.2−13.4
7B21742.781.8458261.731275815.27765015,2957.31−113.9−13.9
8B22890.076.0750448.736.94310913,725025,7107.62−118.7−14.3
9B23740.040.641633820.3274114.86695013,7127.16−117.4−14.9
10B24\\569044.143.831204810,000019,0007.26−115.1−13.3
11B26751.025.8318319.89.1416065764944010,3647.31−114.9−14.9
12B27822.945.7645747.729.4351414.111,823021,9307.38−115.8−15.2
13B32\\758040.131.643609.6112,900024,9007.5−120.6−13.7
14B34761.461.3428722.623.426900.097032014,1167.77−108.9−14.5
15B35942.278.3689236.123.632770.0913,338023,6457.76−112.1−14.6
16B42602.924.3281059.221.419750.094185090757.31−103.1−13.7
17B43760.0\352056.126.7188038.46360011,9007.18−98.4−12.2
18B44567.919.3154948.17.943901693657058416.88−106.1−13.6
19B46970.4149.066124127.623790.0914,558023,7668.02−119.5−14.8
20B68\\75101013.4197028.816,600026,1007.88−139.4−13.3
21B69984.4328.074327.567.44189822.517,508027,2037.52−119.6−15.6
22B77990.0200.0729117.816.7189912.516,884013,1527.9−114.9−15.3
23B791150.575.6350741.48310763548012026,3217.15−113.2−14.5
24B9806.448.1483024.47.9718930.099651016,4557.54−120.4−14.4
25BZ1765.9215.0524319.116.217700.0911,575018,8397.9−129.2−9.3
Table 2. Production capacity characteristics of coal seams in the BYR block. “#” representing the coal seam number.
WellBurial Depth (m)Thickness (m)Producing LayersAverage Daily Gas Production (m3/d)Average Daily Water Production (m3/d)Permeability
(mD)
B26751.04139#, 41#, 42#4761170.824
B27822.943.95939#, 41#, 42#69348\
B42602.932.73439#, 41#, 42#23010\
B43760.055.98439#, 41#, 42#108140.913
B44567.910.9239#, 41#228151.35
B45731.821.97939#, 41#2672\
B46970.442.93139#, 41#, 42#39550.12
B721152.87.99344#1632\
B77990.01141#, 42#21379\
B791150.51441#, 42#65270.069
B9806.447.98442#, 44#1618\
BL-2806.0\42#159920.334
Disclaimer/Publisher’s Note: The statements, opinions and data contained in all publications are solely those of the individual author(s) and contributor(s) and not of MDPI and/or the editor(s). MDPI and/or the editor(s) disclaim responsibility for any injury to people or property resulting from any ideas, methods, instructions or products referred to in the content.