Article

Renewable Energy Transition Task Solution for the Oil Countries Using Scenario-Driven Fuzzy Multiple-Criteria Decision-Making Models: The Case of Azerbaijan

1
Department of Economics and Management, Khazar University, 41 Mahsati Str., Baku AZ1096, Azerbaijan
2
BA Programs, Azerbaijan State Oil and Industrial University, 20 Azadliq Ave., Baku AZ1010, Azerbaijan
*
Author to whom correspondence should be addressed.
Energies 2023, 16(24), 8068; https://doi.org/10.3390/en16248068
Submission received: 18 October 2023 / Revised: 7 December 2023 / Accepted: 13 December 2023 / Published: 14 December 2023
(This article belongs to the Section C: Energy Economics and Policy)

Abstract

:
The renewable energy transition of oil- and gas-producing countries has specific peculiarities due to the ambivalent position of these countries in the global energy market, both as producers and consumers of energy resources. This task becomes even more challenging when the share of oil and gas in the country’s GDP is very high. These circumstances pose serious challenges for long-term energy policy development and require compromising decisions to better align the existing and newly created energy policies of the country. The scale, scope, and pace of changes in the transition process must be well balanced, considering the increasing pressure of economic and environmental factors. The objective of this paper is to develop models that allow the selection of the most appropriate scenario for renewable energy transition in an oil- and gas-producing country. The distinguishing feature of the proposed model is that alternatives in the decision matrix are presented as scenarios, composed of a set of energy resources and the level of their use. Linguistic descriptions of the alternative scenarios are formalized in the form of fuzzy statements. For the problem solution, four different Multiple-Criteria Decision-Making (MCDM) methods were used: the fuzzy simple additive weighting (F-SAW) method, the distance-based fuzzy TOPSIS method (Technique of Order Preference Similarity to the Ideal Solution), the ratio-analysis-based fuzzy MOORA method (Multi-Objective Optimization Model Based on the Ratio Analysis), and the fuzzy multi-criteria optimization and compromise solution method VIKOR (Serbian: VIekriterijumsko Kompromisno Rangiranje). This approach is illustrated using the example of the energy sector of Azerbaijan. The recommended solution for the country involves increasing natural gas (NG) moderately, maintaining hydro, and increasing solar notably and wind moderately.

1. Introduction

Increased energy production and environmental deterioration, related to economic growth, are creating a set of interrelated issues for society and development policymakers. The most challenging issues are caused by increased energy consumption and production and their negative influence on the natural environment. Despite globally accepted sustainable development and green energy policies, the implementation of these policies requires long-term, continued efforts and contributions from each country. This is a challenging task, and no unified, generally accepted solution exists for all economic parties. Countries involved in this process have different backgrounds and development histories. Some of them are only consumers of energy resources, while others are producing, consuming, and selling energy resources.
Countries producing and exporting energy resources significantly differ in economic power and the share of energy resources in the GDP. The range of variations is quite large—from oil rent being 0.4% of the GDP for the UK (natural gas rents at 0.17% of the GDP, and total natural resource rents at 0.59% of the GDP) up to 53% for Iraq (natural gas rents at 0.65% of the GDP, and total natural resource rents at 43.4% of the GDP), and 56% for Libya (natural gas rents at 4.58% of the GDP, and total natural resource rents at 61% of the GDP). A small share allows for the relatively swift replacement of traditional energy resources with renewables. However, in the case of a large share, a country needs significant and long-lasting efforts for energy resource replacement. The issue is that in oil-rich countries, energy resources are not only used for generating electricity but are also the main export item and the primary source of hard currency for the country [1].
During the transition period, policy developers must align the current energy policy, the desired policy, and the steps to transition from the current state to the desired one. The transition to a renewable-based energy system is not a one-step process, especially for countries with a high share of oil and gas in their GDP. Addressing the complexities inherent in the transition requires the development of special models and pre-scenarios before creating detailed long-term scenarios and policies. To find a justified solution to the task, it is necessary to analyze approaches for selecting renewables and designing scenarios.
The solution to the renewable energy transition task requires an analysis of multiple alternatives considering a set of contradictory and conflicting beneficial and cost criteria, often in conditions of partial uncertainty. To address this task, various Multiple-Criteria Decision-Making (MCDM) methods have been used.
In some cases, researchers face situations where statistics describing the implementation of renewable energy technologies are limited and non-representative. In such instances, fuzzy models that rely on experts’ knowledge can help compensate for the lack and deficiency of statistical data. Traditionally, models used in the energy sector have been based on precise and exact data, with a primary focus on the efficiency of solutions. However, in areas without well-established decision-making approaches or with limited experience, decision-makers often have to deal with vague information expressed in linguistic form.
Due to the complexity and importance of the task, this paper employs four methods from different groups (distance-based, ratio-analysis-based, and value/utility-function-based) of MCDM techniques, namely, two distance-based methods (fuzzy TOPSIS and VIKOR), one ratio-analysis-based method (fuzzy MOORA), and one value/utility-function-based method (fuzzy SAW) [2]. An important feature of the selected methods is the proven methodology for evaluating each alternative based on input fuzzy data using direct calculations without defuzzification. The methods used have proven their effectiveness in multiple applications in the energy sector and other areas.
This study encompassed stages involving discussions with experts regarding the development of transition scenarios, the definition and evaluation of criteria, the aggregation of expert opinions using various approaches, calculations employing different types of MCDM techniques, the analysis of the obtained results, and conclusion.
The main objective of our research is to identify an optimal and sustainable scenario for energy transition in Azerbaijan based on the application of the scenario approach, fuzzy models, and methods. As Azerbaijan heavily relies on non-renewable energy sources, such as oil and gas, this study aims to contribute to the sustainable economic development of the country by proposing feasible strategies for shifting towards renewable energy sources. Considering the growing interest in research on energy transition in fossil-fuel-exporting countries [3,4,5,6] and addressing the gap in the existing literature regarding transition task models in Azerbaijan’s context, this research seeks to offer valuable insights and recommendations. This study’s results can support policymakers, industries, and other stakeholders in making well-informed decisions to promote renewable energy adoption while considering the unique challenges posed by the country’s dual role as an energy producer and consumer in the global market.
Section 2 presents a literature overview of works regarding energy transition tasks, approaches of multiple-criteria decision-making, and the formalization of uncertainty in energy source selections. The operations on fuzzy numbers, aggregation methods of expert opinions, and calculation techniques with the fuzzy-information-based TOPSIS, MOORA, VIKOR, and SAW methods are presented in Section 3. Section 4 contains a description of the transition scenario development and the calculations based on fuzzy methods presented in Section 3. Section 5 contains a discussion of key ideas of the proposed approach and ideas about selected alternatives. This study ends with common conclusions about the necessity of a rational balance between renewables and conventional energy sources and the advantages of the suggested approach.

2. Literature Review

Energy transition, the most important issue of sustainable development, is a complex, country-oriented task that is difficult to formalize with traditional approaches [7]. The selection of a relevant approach for renewable energy transition is inherently a Multiple-Criteria Decision-Making task for the energy sector, and several tools have been developed and utilized for such problems.
In [8,9], detailed reviews of MCDM methods’ applications (crisp and fuzzy) for energy policy-making are presented. These papers offer comprehensive explanations of the methods and examples related to the selection of traditional and renewable energy resources.
For energy policy development, planning, and the selection of renewables in various countries, different combinations of MCDM are employed. Fuzzy AHP (Analytic Hierarchy Process) and fuzzy TOPSIS are utilized for selecting energy alternatives [10]. This combination is used for the selection of renewable energy sources (RES) in Turkey [11,12,13]. The selection of RES based on the application of AHP is carried out in Saudi Arabia and Jordan [14,15]. Various approaches, such as the use and combination of AHP and QFD (Quality Function Deployment) [16]; SWOT analysis, AHP, and FTOPSIS [17]; interpretive structural modeling (ISM), benefits, opportunities, costs, and risks (BOCR), and fuzzy analytic network process (FANP) [18]; and Delphi analysis, AHP, and FTOPSIS [19], are also employed to address RES-related problems.
A comparative analysis was conducted in [20] to rank the renewable energy sources (RES) in Taiwan. The analysis involved the application of the Weighted Sum Method (WSM), VIKOR (Serbian: VIekriterijumsko Kompromisno Rangiranje, meaning Multicriteria Optimization and Compromise Solution), TOPSIS, and ELECTRE (French: Élimination et Choix Traduisant la Réalité, meaning Elimination and Choice Translating Reality).
Fuzzy models provide a suitable framework for representing the main ideas of decision-makers in a way that is convenient for them. These models allow decision-makers to efficiently utilize their accumulated experience and knowledge in solving strategic and emerging operational tasks in the field of renewable energy.
In [21], a multiple-criteria approach, extending the fuzzy TOPSIS method, was used to achieve the 2030 renewable energy targets in European member states. In Serbia, the fuzzy AHP method was applied to assess the potential of renewable energy sources for electricity generation [22]. The approaches presented in [21,22,23,24] differ in the models used, the categories and number of criteria applied, the number of alternatives analyzed, and their specific applications.
Fuzzy TOPSIS has been widely used for decision-making in the energy sector [8,25,26], including solutions related to renewables [25,27,28]. The method has been used as stand-alone or in combination with other methods [19,29].
Fuzzy VIKOR is also one of the actively used decision-making methods in the energy sector [30,31,32]. Renewable-related tasks in China, India, Iran, and Turkey are also solved by using the fuzzy VIKOR technique [33,34,35,36].
In recent years, the use of the MOORA method has increased for the solution of various tasks [37]. In the energy sector, fuzzy MOORA is utilized for the ranking of G7 countries according to energy center selection performance [38,39]. For sustainability-oriented tasks, combinations of methods have been used, such as fuzzy MOORA and fuzzy AHP [40]; fuzzy MOORA and fuzzy DEMATEL (Decision-Making Trial and Evaluation Laboratory) [41]; and fuzzy Shannon Entropy, MOORA, VIKOR, EDAS (Evaluation Based on Distance from Average Solution), and ARAS (Additive Ratio Assessment) [42]. Furthermore, for evaluating wastewater treatment technologies, fuzzy SWARA (Stepwise Weight Assessment Ratio Analysis) was used to define criteria weights, and then ranking was implemented using fuzzy MOORA. Finally, the results were validated with F-TOPSIS [43].
The fourth fuzzy method, Simple Additive Weighting, was chosen because of its simplicity, effectiveness, and relative prevalence of use. According to [44], SAW belongs to the 20 most cited methods in the “ScienceDirect” database. Fuzzy extensions of the Simple Additive Weighting method have been successfully used to solve various selection problems [45,46].
Indeed, the studies mentioned earlier highlight the significance of Multiple-Criteria Decision-Making (MCDM) methods in tackling the complex and multifaceted challenges of transitioning to renewable energy sources. These methods play a crucial role in making informed decisions for sustainable energy planning and policy development.
Determining the weights of criteria for decision making is one of the important stages of Multiple-Criteria Decision-Making. Various approaches have been described in the literature, such as using AHP (with crisp and fuzzy approaches) [10,11,12,13], and the entropy-based approach [20,25]. A renewable selection model for Indonesia was developed in [23], based on fuzzy AHP (Analytic Hierarchy Process) and a new procedure for aggregating experts’ judgments, including a procedure of pairwise comparison and aggregation of experts’ comparison matrices in a single matrix via the similarity aggregation method (SAM) [47]. Modified SAM was successfully applied to address the investment problem of offshore wind farms [48].
The abovementioned papers demonstrate the effectiveness of the fuzzy approach in formalizing uncertainty in decision making within the energy sector. Additionally, there are alternative approaches to formalizing uncertainty, such as intuitionistic, grey [49], hypersoft set, and Z-numbers. For instance, in Malaysia, the intuitionistic fuzzy AHP method was proposed for sustainable energy planning [24]. Paper [50] presents the results of the application of the Z-numbers and Z-extension of the TOPSIS method for the selection of renewables in economic regions with diverse conditions and high uncertainty in the case of Azerbaijan. The selection of hydrogen generation technologies employed the intuitionistic hypersoft set methodology with the VIKOR method [51]. Trapezoidal intuitionistic fuzzy linguistic number-based VIKOR was used for the renewable energy technology (RET) selection problem [52].
In summary, fuzzy models serve as valuable tools in situations where traditional statistical data are lacking or uncertain, enabling effective decision making in the realm of renewable energy. They provide a means to harness expert knowledge and subjective input to make meaningful strides in sustainable energy planning and policy implementation.
From this point of view, our study contributes significantly to the literature by addressing a specific research gap in the context of renewable energy transition for oil- and gas-producing countries. This study introduces a novel approach employing scenario-driven fuzzy Multiple-Criteria Decision-Making (MCDM) models, specifically tailored to the challenges faced by nations like Azerbaijan which have a substantial share of fossil fuels in their GDP. By incorporating fuzzy statements and utilizing methods with direct calculations with fuzzy values, this study fills a void in the literature, providing a nuanced and context-specific methodology.

3. Methodology

The flowchart of the research process is presented in Figure 1.

3.1. Fuzzy Numbers and Operations on Fuzzy Numbers

In conditions of imprecise information, the triangular fuzzy numbers (TFN) have been successfully used for the solution of the applied decision-making problems [53].
A membership function μ M x : R 0 , 1 of a triangular fuzzy number M ~ = l , m , u , where l, m, and u are lower, modal, and upper values of the support of M ~ , is equal to
μ M x = x l m l ,   x l , m , u x u m ,   x m ,   u , 0                     o t h e r w i s e
The Formulas (2)–(7) describe basic TFN calculation operations and operators:
M 1 ~     M 2 ~ = l 1 ,   m 1 , u 1 l 2 ,   m 2 , u 2 = l 1 + l 2 ,   m 1 + m 2 ,   u 1 + u 2
M 1 ~ M 2 ~ = l 1 ,   m 1 , u 1 l 2 ,   m 2 , u 2 = l 1 u 2 ,   m 1 m 2 ,   u 1 l 2
M 1 ~     M 2 ~ = l 1 ,   m 1 , u 1 l 2 ,   m 2 , u 2 = l 1 l 2 ,   m 1 m 2 ,   u 1 u 2
  I n v e r s e   M ~ = l ,   m ,   u 1 1 u , 1 m , 1 l
Max i M i ~ = ( max i l i , max i m i ,     max i u i )
Min i M i ~ = ( min i l i , min i m i ,   min i u i )

3.2. Aggregation of Opinions in MCDM Tasks

In most cases, the MCDM model development and solution are based on information provided by a group of experts. The construction of the model and solution requires the aggregation of the experts’ opinions. Conventional and fuzzy information provided by experts can be aggregated by applying various approaches. In this paper, we are using similarity- and average-value-based approaches.

3.2.1. Similarity Aggregation Method

The similarity aggregation method (SAM) allows the combination of subjective estimations expressed by fuzzy numbers (FN) [47]. This method means that experts reach a consensus through panels and the common intersection of the triangle (trapezoidal) assessments is analyzed. If A ~ i and A ~ j are the assessments of two experts expressed by TFNs, then the agreement degree or similarity measure S A i ~ , A j ~ can be calculated as follows:
S A i ~ , A j ~   = x min μ A i ~   x ,   μ A j ~   x d x     x max μ A i ~   x ,   μ A j ~   x d x
An agreement matrix is constructed after the calculation of agreement degrees between n experts.
A M = 1 s 12 s 1 n s i j s n 1 1 S ij = S A i ~ , A j ~  
Next, the relative agreement degree (RAD) of expert Ei is calculated using the formulas below.
A E i     1 n 1 j = 1 j i n S i j
R A D i = A E i i = 1 n A E i
Then, the consensus degree coefficient (CDCi) of expert Ei is equal to RADi due to the fact that all experts have the same degree of importance. CDC is a measure for the estimation of the relative value of each expert assessment.
A ~ = i = 1 n C D C i * A ~ i

3.2.2. Average-Value-Based Approach

If the decision group has N members, then the importance of the criteria and the evaluation of alternatives concerning each criterion can be calculated according to the formulas below [52].
a i j ~ = 1 N ( a ~ i j 1 ( + ) a ~ i j 2 ( + ) ( + ) a ~ i j N )
w i j ~ = 1 N ( w ~ i j 1 ( + ) w ~ i j 2 ( + ) ( + ) w ~ i j N )

3.3. Fuzzy-Information-Based TOPSIS

Fuzzy-information-based TOPSIS requires the sequential performance of the following steps:
Step 1: Generation of the alternative scenarios relevant to potential energy policy options.
Step 2: Selection of the criteria.
Step 3: Categorizing criteria as benefit and cost criteria.
Step 4: Fuzzy-information- and alternative-scenario-based decision matrix composition.
Step 5: Defining weights.
Step 6: Normalization of the fuzzy decision matrix:
z ~ i j ° = l i j u j + ,   m i j u j + , u i j u j + ,       u j + = m a x i u i j   B e n e f i t   c r i t e r i a
z ~ i j ° = l j u i j ,   l j m i j ,   l j l i j   ,   l j = m i n i l i j     C o s t   c r i t e r i a
Step 7: Calculation of the weighted normalized decision matrix D ~ w ° = ϑ ~ i j
ϑ ~ i j = z ~ i j ° × w ~ j
Step 8: Determination of the fuzzy positive ideal solution A + and fuzzy negative ideal solution A .
A + = ϑ ~ 1 + , ϑ ~ 2 + ,   ,   ϑ ~ 8 +
A = ϑ ~ 1 , ϑ ~ 2 ,   ,   ϑ ~ 8
where ϑ ~ j + = ( 1,1 , 1 ) , ϑ ~ j = ( 0,0 , 0 ) , j = 1,…, 8
Step 9: Calculation of the distances of each solution from the fuzzy ideal positive and ideal negative solutions:
d i + = j = 1 n d ϑ ( ϑ ~ i j , ϑ ~ j + )
d i = j = 1 n d ϑ ( ϑ ~ i j , ϑ ~ j )
The distance between two fuzzy triangular numbers φ ~ 1 = l 1 , m 1 , u 1 a n d φ ~ 2 = l 2 , m 2 , u 2 can be calculated according to the following formula [54]:
d φ ~ 1 , φ ~ 2 = 1 3 ( ( l 1 l 2 ) 2 + m 1 m 2 2 + u 1 u 2 2 )  
Step 10: Calculation of the relative closeness δ i for each alternative:
δ i = d i d i + + d i
Step 11: Alternative ranking in accordance with the relative closeness δ i ; the best alternative has a higher closeness coefficient relative to a positive ideal solution.
Step 12: The best alternative selection according to higher priority.

3.4. Fuzzy-Information-Based MOORA

Fuzzy-information-based MOORA [55] has the same initial Steps 1–5, as the fuzzy TOPSIS approach.
Step 6. Vector normalization of the fuzzy decision matrix.
h q s l = a q s l q = 1 i ( a q s l ) 2 + ( a q s m ) 2 + ( a q s u ) 2
h q s m = a q s m q = 1 i ( a q s l ) 2 + ( a q s m ) 2 + ( a q s u ) 2
h q s u = a q s u q = 1 i ( a q s l ) 2 + ( a q s m ) 2 + ( a q s u ) 2
where a q s l , a q s m , a q s u —lower, middle, and upper values of the support of DM elements, i.e., the fuzzy value of qth alternative with respect to sth criteria.
Step 7. Weighted normalized fuzzy decision matrix according to Formula (13).
Step 8. For each alternative, the overall ratings of benefit and cost criteria are defined.
Step 9: The overall ratings of beneficial and non-beneficial criteria for each alternative are calculated in this step.
The overall rating (lower, middle, and upper values of the support) of an alternative for beneficial criteria is determined by the following equations.
z q + l = s = 1 n ϑ q s l                             |         s       S m a x
z q + m = s = 1 n ϑ q s m                             |         s       S m a x
z q + u = s = 1 n ϑ q s u                             |         s       S m a x
The overall rating of an alternative for cost criteria is determined by the following equations.
z q l = s = 1 n ϑ q s l                             |         s       S m i n
z q m = s = 1 n ϑ q s m                             |         s       S m i n
z q u = s = 1 n ϑ q s u                             |         s       S m i n
Step 10: Determination of the overall performance index (Si) according to the following formula.
Z q z q + ,   z q = 1 3 ( z q + l z q l ) 2 + ( z q + m z q m ) 2 + ( z q + u z q u ) 2
Step 11: Arrange alternatives according to the value of the overall performance indices. The alternative with the highest index is the best.

3.5. Fuzzy-Information-Based VIKOR

Fuzzy-information-based VIKOR [56] has the same initial Steps 1–5 as the fuzzy TOPSIS approach, and here we only present a description of subsequent steps.
Step 6. Definition of the positive ideal value and the nadir value [56].
If the criterion is beneficial, the positive ideal value (PIV) ( x ~ * ) and nadir value (NV) (   x ~ ° ) can be defined using the expressions:
x ~ j * = M a x i   x ~ i j                     i   = 1 ,   2 ,   ,   n b
x ~ j ° = M i n i   x ~ i j
If the criterion is non-beneficial, the PIV ( x ~ * ) and NV ( x ~ ° ) can be defined utilizing the expressions:
x ~ j * = M i n i   x ~ i j                     i   = 1 ,   2 ,   ,   n c
x ~ j ° = M a x i   x ~ i j
where j = 1, 2, …, m (number of alternatives) and nb and nc are number of beneficial and cost (non-beneficial) criteria.
Step 7. Calculation of the normalized DM.
According to the PIV and NV, a normalized DM (NDM) can be defined using the formulas:
d ~ i j = ( f ~ j * f ~ i j ) / ( r j * l j ° )   ( benefit   criteria )
d ~ i j = ( f ~ i j f ~ j * ) / ( r j ° l j * )   ( cost   criteria )
Here:
  x ~ j * = ( l j * , m j * , r j * )     PIV
x ~ j ° = l j ° , m j ° , r j °     NV
Step 8. Calculation of weighted NDM by multiplying the normalized decision matrix and vector of weights.
Step 9. Determine the values S ~ i and R ~ i .
The values S ~ i and R ~ i can be calculated using the expressions:
If R ~ i = ( R i l , R i m , R i r ) and s ~ i = ( s i l , s i m , s i r )
S ~ i   = j = 1 J ( w ~ j d ~ i j )
R ~ i   = max j ( w ~ j d ~ i j )
Step 10. Calculate the VIKOR index (Q).
The value of Q is determined using the formula:
If Q ~ i = ( Q i l , Q i m , Q i r ) then
Q ~ i = v s ~ i s ~ * s ° r s * l 1 v R ~ i R ~ * R   ° r R * l
Here:
s ~ * = min i s ~ i
s ° r = max i s i r
R ~ * = min i R ~ i
R ° r = max i R i r
The variable v representing the maximum group utility is equal to 0.5 in this study.
Step 11. Defuzzification of S ~ , R ~ and Q ~ .
If A ~ = l ,   m ,   u is a TrFN, then the defuzzified value of A ~ can be defined as follows:
C r i s p A ~ = 2 m + l + u 4
Step 12. Proposing a compromise solution
Downward ordering of alternatives according on the defuzzified values of R, S, and Q. Suggest the compromise solution based on two conditions:
Condition 1.
Acceptable advantage. When Q ( A ( 2 ) ) Q ( A 1 ) 1 / ( n 1 ) . Here A ( 1 ) and A ( 2 ) are the alternatives with first and second positions, respectively (based on value of Q), and n is the number of alternatives.
Condition 2.
Acceptable stability in decision making. The alternative A ( 1 ) must also be the best ranked by S or/and R.
If one of the conditions is not met, then a set of compromise solutions is suggested. This set includes the following:
Solution 1.
If the 1st condition is not met, then alternatives A 1 , A 2 , , A M ; Alternative A M is defined according to the expression— Q A M Q A 1 < 1 / ( m 1 ) for maximum M (the positions of these alternatives are ‘‘in closeness’’).
Solution 2.
If only the 2nd condition is not met, then alternatives A 1 and A 2 .
Solution 3.
If neither the 1st nor the 2nd condition is met, then an alternative with the minimum Q value will be selected as the best.

3.6. Fuzzy-Information-Based SAW

Fuzzy-information-based SAW [57] has the same initial Steps 1–5—decision matrix composition and normalization, determinations of weights, and calculation of weighted normalized DM—as the fuzzy TOPSIS approach.
Step 6. Calculate the total fuzzy score of each alternative.
F i ~ = j = 1 n a ~ i j
Here:
a ~ i j —normalized weighted fuzzy value of i-th alternative concerning j-th criterion;
n—number of criteria.
Step 7. Comparison of total fuzzy scores of each alternative.
The fuzzy scores of alternatives calculated in Step 6 are transformed into crisp scores using Formula (28).
Step 8. Ranking of alternatives
In this step, rank alternatives according to the value of the crisp score of each alternative. The alternative with the highest score is the best.

4. Results

4.1. Application for Energy Policy Scenario Development

Azerbaijan is an oil- and gas-producing country, and it has been increasing its natural gas exports over the years. The oil and gas sector contributes 46.6% to the country’s GDP (SCI, 2021) [58]. In 2021, oil rents accounted for 20.1% of its GDP, while the share of natural gas rents and total natural resource rents in the GDP was 8.6% and 29.9%, respectively (World Development Indicators, 2021) [59].
At the current consumption levels, the country has reserves of natural gas that can last for about a century. However, considering that the global natural gas consumption increased by 4.8% in 2021, it is unrealistic to expect an accelerated decrease in global natural gas production and consumption over the next century. Therefore, hydrocarbon-energy-producing and exporting countries, aiming to gradually replace environmentally unfriendly energy resources with green resources in their energy policy, must analyze and evaluate various scenarios for adjusting the energy sources mix.
Azerbaijan has a high potential for renewable energy sources, estimated at 27,000 MW, including 3000 MW of wind energy, 23,000 MW of solar energy, 380 MW of bioenergy potential, and 520 MW of mountain rivers [60]. Currently, its energy supply (consumption) amounts to 17,566.6 thousand TOE (Tons of Oil Equivalent) in 2021. Out of this, only 1.3% comes from total renewable energy supply, with 225.1 thousand TOE (109.8 thousand TOE from hydropower, 102.6 thousand TOE from biomass and waste, 7.9 thousand TOE from wind power, and 4.8 thousand TOE from solar (photovoltaic) power). The respective shares of hydropower, biomass and waste, wind power, and solar power in the country’s total energy consumption are 0.6%, 0.6%, 0.1%, and 0.03% (SCI, 2021) [61].
On the path toward energy transition, what are the most effective and sustainable scenarios for transitioning Azerbaijan’s energy sector from non-renewable to renewable sources? How can the application of MCDM models, particularly the fuzzy TOPSIS and fuzzy MOORA methods, aid in the decision-making process? To answer these questions, we first need to construct a standard decision matrix based on a set of single alternatives, which must then be transformed into a decision matrix based on a set of energy policy adjustment scenarios.
The alternative scenario composition process in the case of Azerbaijan is based on the following assumptions:
  • Over the next decades, Azerbaijan will maintain or increase natural gas production due to its relatively lesser influence on the environment and its high export potential.
  • Rising domestic and foreign demand for electricity will be offset by renewables.
  • There are significant differences in the capacity of the available renewables in the country.
Renewables available in the country include solar, wind, hydro, and bioenergy. Due to the limited capacity of the bioresources, in this paper, we are analyzing the use of natural gas (NG), solar (S), wind (W), and hydro (H) sources. If the resource is used at the same level, we are not adding a letter indicating the intensity of the resource use. Three types of changes for resource use are introduced: D—decrease, I—increase, K—keep at the same level. The degree of changes has been evaluated as notable (N), moderate (M), and trivial (T).
The expression “<NG-K, H-K, S-NI, W-MI>” describes an alternative scenario based on the introduced abbreviations.
A1—“Keep on the same level natural gas and hydro, increase solar notably and wind moderately”, or in a concise manner, “Maintain natural gas and hydro, increase solar notably and wind moderately”.
Alternative scenarios can be described as follows:
A1—<NG-K, H-K, S-NI, W-MI>, “Maintain NG and hydro, increase solar notably and wind moderately”;
A2—<NG-K, H-K, S-MI, W-NI>, “Maintain NG and hydro, increase solar moderately and wind notably”;
A3—<NG-K, H-K, W-NI>, “Maintain NG and hydro, increase wind notably”;
A4—<NG-K, H-K, S-MI>, “Maintain NG and hydro, increase solar moderately”;
A5—<NG-K, H-K, S-NI>, “Maintain NG and hydro, increase solar notably”;
A6—<NG-MI, H-K, S-NI>, “Increase NG moderately, maintain hydro, and increase solar notably”;
A7—<NG-MI, H-K, S-NI, WM>, “Increase NG moderately, maintain hydro, increase solar notably and wind moderately”;
A8—<NG-MI, H-K, S-NI, WNI>, “Increase NG moderately, maintain hydro, increase solar and wind notably”;
A9—<NG-MI, H-K, S-MI, WNI>, “Increase NG moderately, maintain hydro, increase solar moderately and wind notably”.
To facilitate discussions, experts with specialized knowledge in economics, energy economics, and policy, as well as natural resource management, each possessing over 10 years of general experience in their respective subject areas, were engaged to define and evaluate decision-making criteria within the framework of the ongoing study.
After literature analysis and discussion with experts, the following decision-making criteria were selected and used: Government policy and regulation (C1), Social acceptance (C2), Labor impact (C3), Cost efficiency (C4), Spillover effects (C5), Technology efficiency and reliability (C6), Resource availability (C7), and Environmental impact (C8).
Criteria C1, C2, C3, C5, C6, and C7 are beneficial criteria, whereas C4 and C8 are cost (non-beneficial) criteria.
Criterion C1 evaluates government policy and regulations concerning various energy resource development. In the case of Azerbaijan, the government has actively supported renewable development, with a target of achieving 30% renewables in energy production by 2030. At the same time, the government plans to use the released volume of natural gas for export. Criterion C2 evaluates the social acceptance of the policy. Given the positive impact of renewables on environmental protection, in Azerbaijan, the attitude of society to renewable development is generally positive. Criterion C3 evaluates the influence of energy transition on the labor market. In our case, the influence of energy transition is positive, and energy transition provides additional jobs. Criterion C4 allows us to compare scenarios from a cost-efficiency standpoint. Criterion C5 evaluates scenarios from a spillover effect standpoint. In this paper, we will discuss such effects as science, education, and technology development, the development of the regions, environment protection, and so on. Criterion C6 takes into consideration the level of technology efficiency and reliability. Criterion C7 estimates scenarios from the standpoint of resource availability. In Azerbaijan, the capacities of natural gas, wind, and solar resources are different, but several times they exceed the current level of use. In the case of hydro, we have additional capacities available for the construction of small hydro stations. Criterion C8 evaluates scenarios from an environmental impact standpoint. The impact varies for different energy resources.
Taking into consideration the multidimensional nature of the scenario alternatives, a group of experts carried out group discussions on each alternative and developed a consensus-based decision matrix. The elements of the matrix were linguistically evaluated according to the values provided in Table 1.
For a study group of seven experts’ opinions, each expert linguistically evaluated alternative scenarios concerning the criteria and presented individual decision matrices. In Table 2, as an example, the decision matrices composed by Expert 1 and Expert 7 are presented.
Using Table 1, the linguistic decision matrices were transformed into fuzzy matrices (Table 3 and Table 4).
For further calculations, the matrices composed by the experts were aggregated by using the average approach and the similarity method. The results of the aggregation are presented in Table 5.
The criteria have a different degree of importance for decision making. The experts estimated the degree of importance of each criterion. The linguistic estimates provided by the experts were transformed into fuzzy numbers and then the aggregated fuzzy estimates (weights) were determined. The expert estimates are presented in Table 6.
The opinions of the expert group on criteria importance were aggregated by applying the SAM approach and average-based approach. The aggregated weights of the criteria are presented in Table 7.

4.2. Fuzzy TOPSIS Calculations

Fuzzy TOPSIS calculations were carried out according to the steps outlined in Section 3.3. After calculating the distances from ideal solutions and the relative closeness of each alternative scenario, the rankings for SAM-based and average-based fuzzy aggregation approaches were obtained. These rankings are presented in Table 8.

4.3. Fuzzy MOORA Calculations

Fuzzy MOORA calculations were carried out according to the steps outlined in Section 3.4. After calculating the overall performance indexes for each alternative, the rankings for the SAM-based and average-based fuzzy aggregation approaches were obtained and are presented in Table 9.

4.4. Fuzzy VIKOR Calculations

The calculations of fuzzy VIKOR were performed according to the steps outlined in Section 3.5. After calculating the values of R, S, and Q for each alternative, the results for the SAM and average-based fuzzy aggregation approaches were obtained and are presented in Table 10.
According to the methodology of the fuzzy VIKOR, the solution with the smallest value of Q (A9) does not have an acceptable advantage over the next alternative (A7 for SAM or A8 for the average). Therefore, a set of acceptable alternatives is selected that satisfies the condition specified in Solution 1 (Section 3.5). Based on the data from Table 10, two sets of alternatives are possible:
A2, A6, A7, A8, A9—for the average-approach-based aggregated fuzzy data
A1, A2, A6, A7, A8, A9—for the SAM-approach-based aggregated fuzzy data

4.5. Fuzzy SAW Calculations

The results of fuzzy SAW calculations, conducted according to the stage outlined in Section 3.6, are presented in Table 11. The table presents the results of calculations based on fuzzy data, aggregated using the abovementioned approaches.

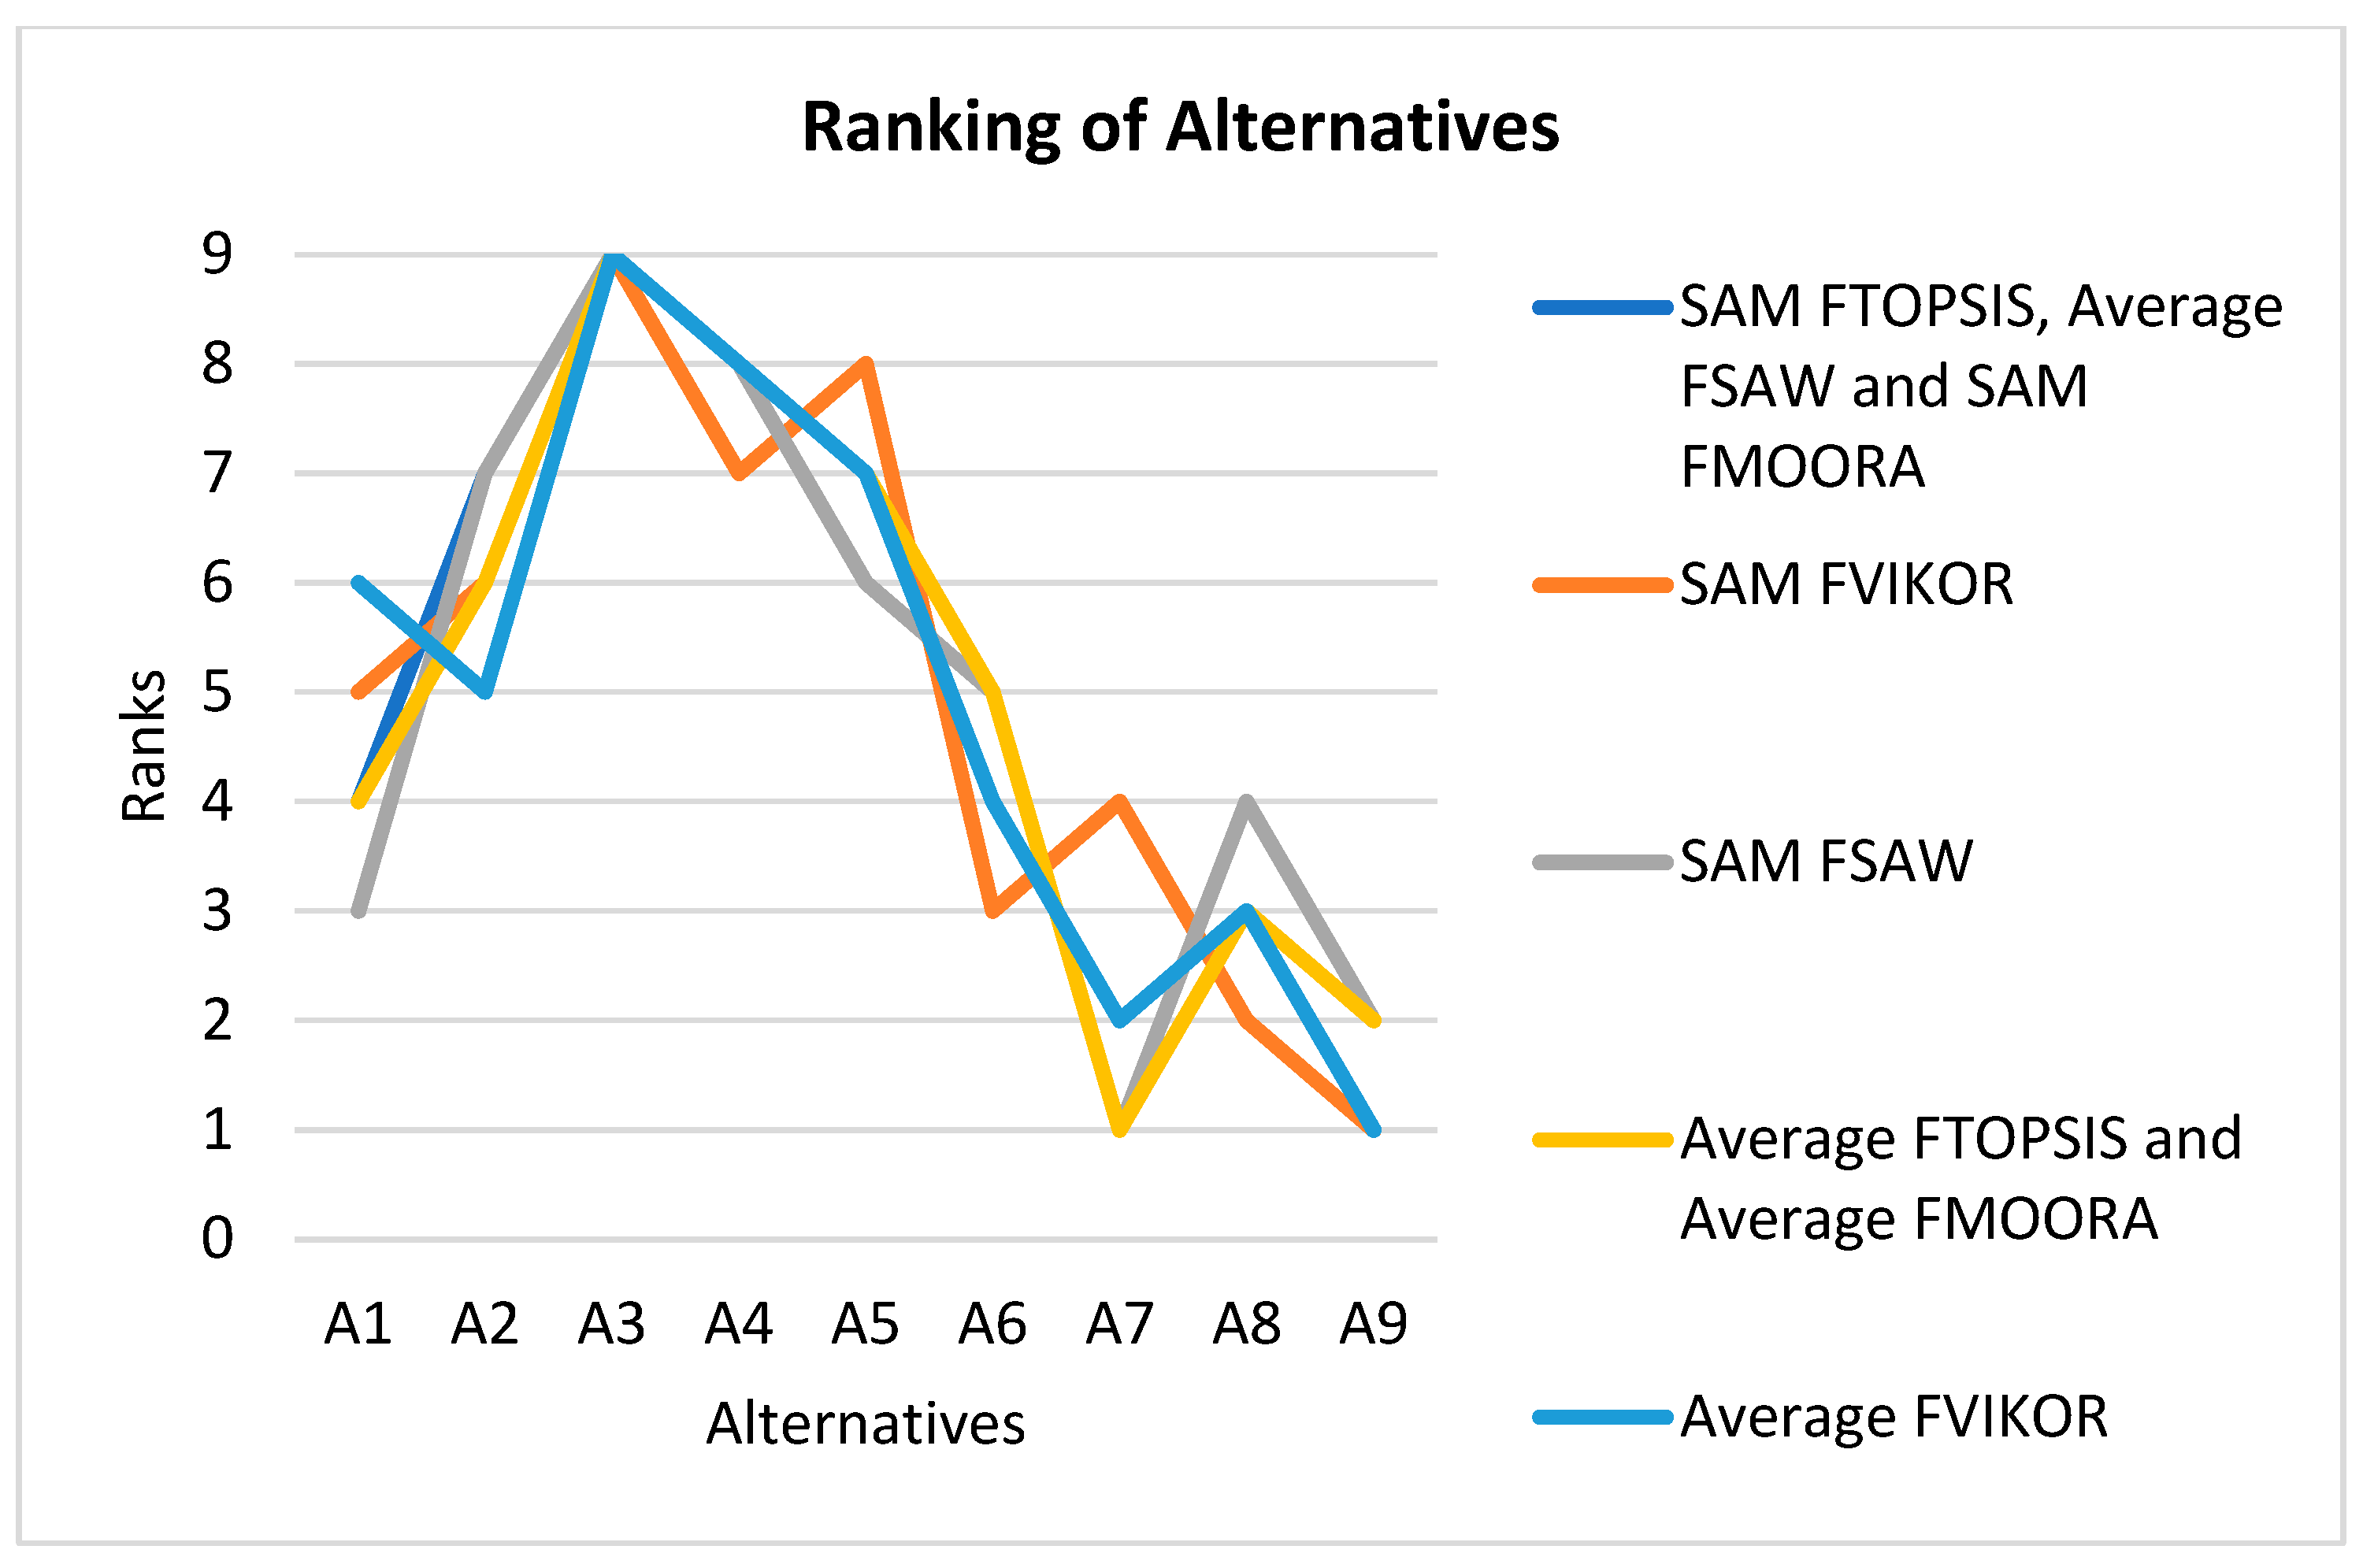
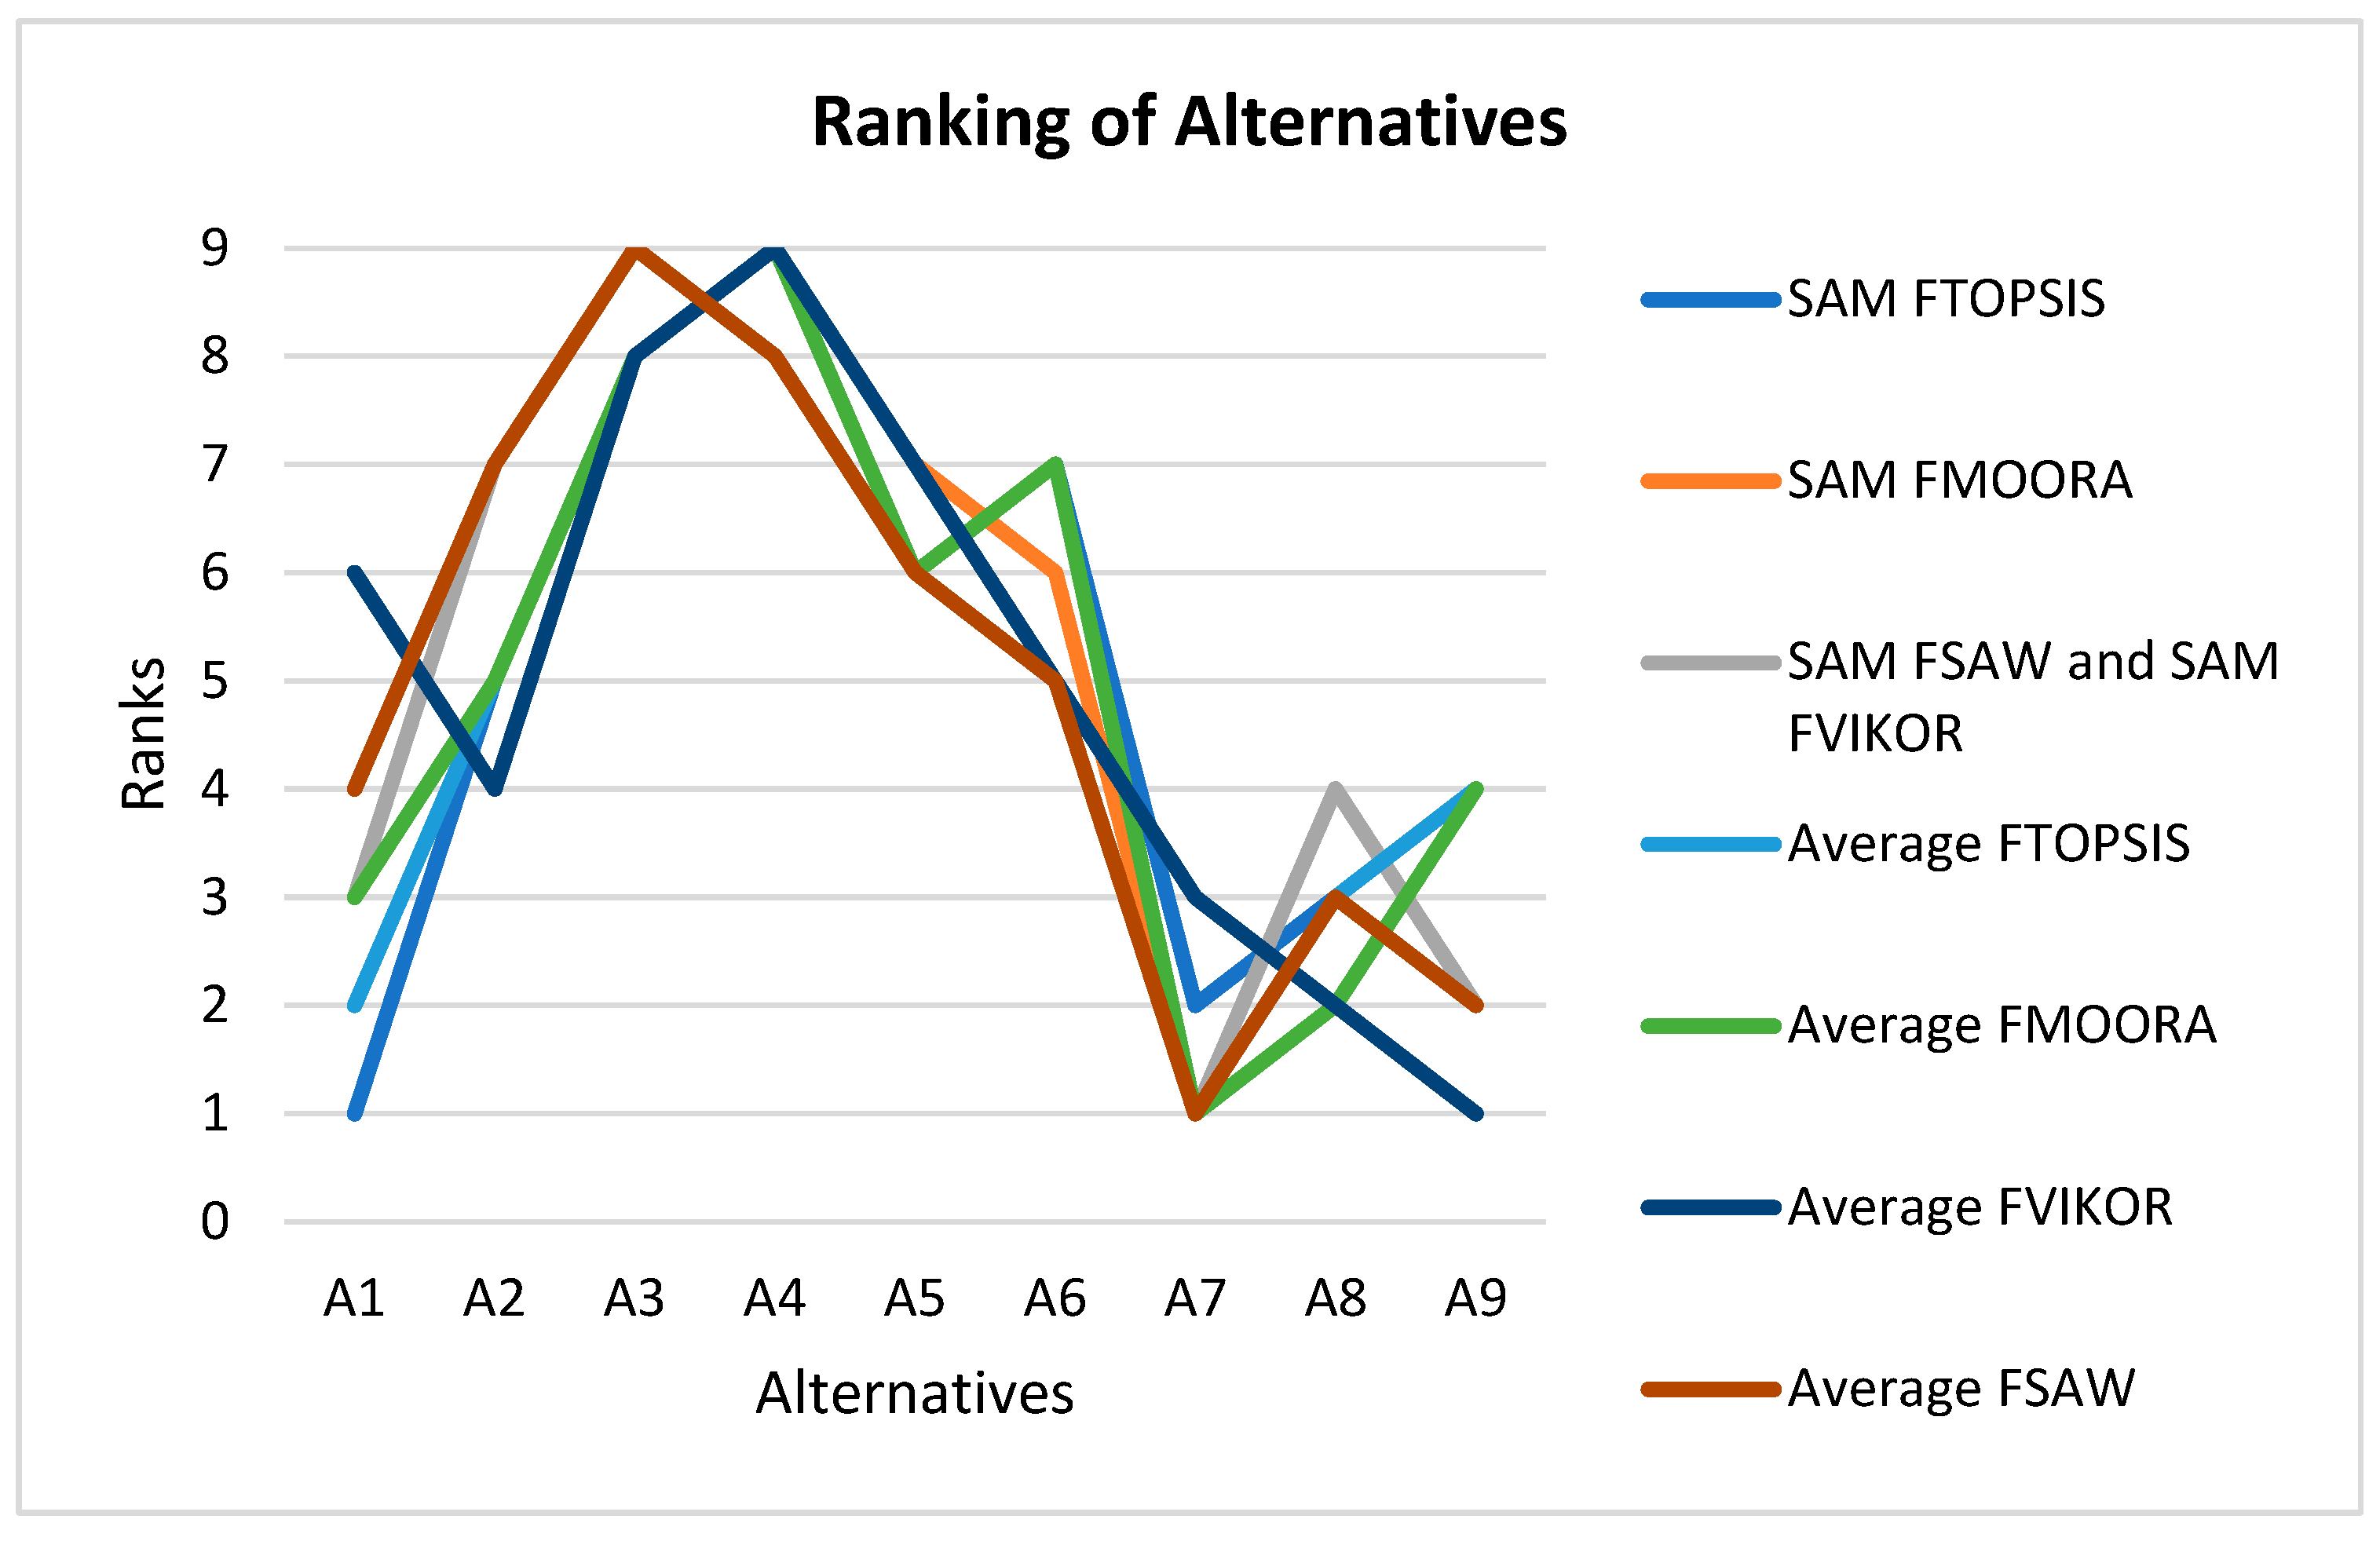
4.6. Sensitivity Analysis

For illustrative purposes, the results of the problem solution, obtained by applying fuzzy TOPSIS, fuzzy MOORA, fuzzy SAW, and fuzzy VIKOR, are presented in graphical form in Figure 2. As seen from the graph, the alternative scenarios based on the fuzzy MCDM model for the oil country renewable energy transition task show low sensitivity with respect to the solution and aggregation (weighting) methods used.
According to the problem solution results, alternative A7 is the best one among the solutions of all models, followed by alternatives A9, A8, and A1. Changes in ranking do not exceed one unit.
Since fuzzy VIKOR did not give an unambiguous answer about the best alternative, but suggested a compromise set of alternatives, the graph shows alternatives relative to the values of Q.
Next, to check the stability of the solution when changing the importance of the weights, a sensitivity analysis was carried out. It should be noted that the use of two approaches to the aggregation of expert assessments led to the fact that the presented models operated with different weights.
To provide a final confirmation of decisions, it was decided to assign equal weight to all criteria. The calculation results for all eight approaches are presented in Table 12.
The common trend of results shown in Table 12 is presented in graphical form in Figure 3.
As can be seen from the graph, the general trend did not undergo significant changes; the proposed approach demonstrated stability relative to the methods, aggregation approach used, and changing weights. Based on the results of solving the problem, alternative A7 is the best among the solutions of all models, followed by alternatives A9, A8, and A1. Rank changes are minor.

5. Discussion

In this paper, a new approach was developed for solving the task of renewable energy transition. The key idea of the proposed approach is to replace the single alternatives in the decision matrix with a set of energy policy adjustment scenarios. Given the subjectivity and imprecision inherent in the energy policy development process, the decision-making model is formalized using a fuzzy logic approach.
The task of ranking and selecting energy resources requires evaluating the alternatives based on multiple criteria. Considering the multiplicity of criteria, Multiple-Criteria Decision-Making (MCDM) models were developed. To enhance the reliability of the solution, four methods with different methodological foundations were applied: the distance-based fuzzy TOPSIS and VIKOR, the ratio-analysis-based fuzzy MOORA, and the value/utility-function-based fuzzy SAW method. All models utilized the same fuzzy decision matrix consisting of eight criteria and nine alternative scenarios. The differences in criteria importance were considered by using fuzzy weights based on experts’ opinions. The aggregation of these opinions was carried out using a similarity aggregation method and an average-value-based approach.
Four fuzzy models were developed for solving the renewable energy transition task in the context of the Azerbaijan energy sector. According to the results of the problem solution, alternative scenario A7 (moderate increase in natural gas, maintenance of hydro, notable increase in solar, and moderate increase in wind) consistently emerges as the best solution across all cases. Alternative scenario A9 (moderate increase in natural gas, maintenance of hydro, moderate increase in solar, and notable increase in wind) ranks second in three out of four cases, while alternative scenario A8 (moderate increase in natural gas, maintenance of hydro, notable increase in solar and wind) ranks third in three out of four cases.

6. Conclusions

Currently, nearly all countries that produce oil and natural gas are shifting towards using renewables for electricity generation. Azerbaijan is also following this trend. The extent and speed of this transition vary based on a country’s development level and the significance of oil and gas in its economy.
For Azerbaijan, given the importance of natural gas in its economy, it is advisable to develop an energy policy that strikes a balance between renewables and conventional energy sources. The approach suggested in the paper, which is based on alternative scenarios, enables the creation of such a balanced solution.
The example provided in this paper demonstrates the effectiveness of this approach and the fuzzy models employed to solve the problem. The flexibility of these models, thanks to alternative scenarios and fuzzy logic, allows for the formalization and combination of diverse opinions and ideas. This model is suitable for cases requiring a smooth transition and combinations of alternatives.
The proposed approach, along with the energy industry, can be successfully applied to other areas requiring the selection of a group of interchangeable resources with various characteristics and efficiencies. In such cases, the proposed model can be effectively utilized since choosing a combination of resources requires selecting a scenario for implementation. The scenario involves the use of several resources.
The main advantage of this method is its capability to evaluate a scenario comprising a group of resources (a set) while simultaneously ensuring the continuity of economic policy within the scenario. For instance, we are not merely selecting solar, wind, or hydro energy resources as a single renewable option; rather, we are focused on a rational combination of a set of energy resources. Consequently, this approach addresses sustainability, ensuring the crucial element of continuity in energy policy.
This approach also has its limitations. As the number of resources included in the scenario increases, the evaluation of the alternatives requires more effort from the experts. Experts can resolve this challenge by evaluating each resource within the scenario separately, with a subsequent aggregation of the estimates for obtaining the scenario’s overall estimate.
The practical significance of this study lies in the application of a systematic approach. Instead of analyzing a single resource that secures the top position in the ranking, this study evaluates a group of resources relevant to a particular country’s energy policy. Furthermore, within this resource group, the scenario approach allows for a wide range of variations in the resource utilization rate.

Author Contributions

Conceptualization, M.N. and J.M.; methodology, M.N. and A.N.; software, J.M.; validation, M.N., A.N. and J.M.; formal analysis, M.N., A.N. and J.M.; investigation, M.N. and J.M.; resources, M.N.; data curation, A.N.; writing—original draft preparation, M.N. and J.M.; writing—review and editing, J.M.; supervision, M.N.; project administration, J.M. All authors have read and agreed to the published version of the manuscript.

Funding

This research received no external funding.

Data Availability Statement

The information was acquired by analyzing the conditions of the regions and consulting with experts. The data are available upon request from the corresponding authors.

Conflicts of Interest

The authors declare no conflict of interest.

References

  1. The World Bank. The World Development Indicators. Available online: https://api.worldbank.org/v2/en/indicator/NY.GDP.TOTL.RT.ZS?downloadformat=excel (accessed on 1 August 2023).
  2. Gebre, S.L.; Cattrysse, D.; Alemayehu, E.; van Orshoven, J. Multi-criteria decision making methods to address rural land allocation problems: A systematic review. Int. Soil Water Conserv. Res. 2021, 9, 490–501. [Google Scholar] [CrossRef]
  3. Noorollahi, Y.; Lund, H.; Nielsen, S.; Thellufsen, J.Z. Energy transition in petroleum rich nations: Case study of Iran. Smart Energy 2021, 3, 100026. [Google Scholar] [CrossRef]
  4. Karanfil, F.; Omgba, L.D. The energy transition and export diversification in oil-dependent countries: The role of structural factors. Ecol. Econ. 2023, 204, 107681. [Google Scholar] [CrossRef]
  5. Espinoza, V.S.; Fontalvo, J.; Ramírez, P.; Martí-Herrero, J.; Mediavilla, M. Energy Transition Scenarios for Fossil Fuel Rich Developing Countries under Constraints on Oil Availability: The Case of Ecuador. Energies 2022, 15, 6938. [Google Scholar] [CrossRef]
  6. Fattouh, B. The Energy Transition & Adaptation Strategies for Oil Exporters. OPEC Technical Workshop. 2020. Available online: https://www.oxfordenergy.org/publications/the-energy-transition-adaptation-strategies-for-oil-exporters/ (accessed on 17 October 2023).
  7. Harichandan, S.; Kar, S.K.; Bansal, R.; Mishra, S.K.; Balathanigaimani, M.S.; Dash, M. Energy transition research: A bibliometric mapping of current findings and direction for future research. Clean. Prod. Lett. 2022, 3, 100026. [Google Scholar] [CrossRef]
  8. Kaya, I.; Çolak, M.; Terzi, F. A comprehensive review of fuzzy multi criteria decision making methodologies for energy policy making. Energy Strat. Rev. 2019, 24, 207–228. [Google Scholar] [CrossRef]
  9. Kaya, I.; Çolak, M.; Terzi, F. Use of MCDM techniques for energy policy and decision-making problems: A review. Int. J. Energy Res. 2018, 42, 2344–2372. [Google Scholar] [CrossRef]
  10. Afsordegan, A.; Sánchez, M.; Agell, N.; Zahedi, S.; Cremades, L.V. Decision making under uncertainty using a qualitative TOPSIS method for selecting sustainable energy alternatives. Int. J. Environ. Sci. Technol. 2016, 13, 1419–1432. [Google Scholar] [CrossRef]
  11. Toklu, M.C.; Taşkin, H. A Fuzzy Hybrid Decision Model for Renewable Energy Sources Selection. Int. J. Comput. Exp. Sci. Eng. 2018, 4, 6–10. [Google Scholar] [CrossRef]
  12. Çolak, M.; Kaya, I. Prioritization of renewable energy alternatives by using an integrated fuzzy MCDM model: A real case application for Turkey. Renew. Sustain. Energy Rev. 2017, 80, 840–853. [Google Scholar] [CrossRef]
  13. Erdogan, M.; Kaya, I. An integrated multi-criteria decision-making methodology based on type-2 fuzzy sets for selection among energy alternatives in Turkey. Iran. J. Fuzzy Syst. 2015, 12, 1–25. Available online: https://ijfs.usb.ac.ir/article_1839.html (accessed on 17 October 2023).
  14. Andejany, M. Ranking Renewable Energy Sources in Saudi Arabia. Int. J. Eng. Res. Technol. 2021, 14, 569–581. Available online: http://www.irphouse.com/ijert21/ijertv14n6_12.pdf (accessed on 14 September 2022).
  15. Shatnawi, N.; Abu-Qdais, H.; Qdais, F.A. Selecting renewable energy options: An application of multi-criteria decision making for Jordan. Sustain. Sci. Pract. Policy 2021, 17, 209–219. [Google Scholar] [CrossRef]
  16. Das, A.; Shabbiruddin. Renewable Energy Source Selection Using Analytical Hierarchy Process and Quality Function Deployment: A Case Study. In Proceedings of the 2016 Second International Conference on Science Technology Engineering and Management (ICONSTEM), Chennai, India, 30–31 March 2016. Available online: https://ieeexplore.ieee.org/document/7560966 (accessed on 17 October 2023).
  17. Ervural, B.C.; Zaim, S.; Demirel, O.F.; Aydin, Z.; Delen, D. An ANP and fuzzy TOPSIS-based SWOT analysis for Turkey’s energy planning. Renew. Sustain. Energy Rev. 2017, 82, 1538–1550. [Google Scholar] [CrossRef]
  18. Kang, H.; Hung, M.; Pearn, W.; Lee, A.; Kang, M. An Integrated Multi-Criteria Decision Making Model for Evaluating Wind Farm Performance. Energies 2011, 4, 2002–2026. [Google Scholar] [CrossRef]
  19. Solangi, Y.A.; Tan, Q.; Mirjat, N.H.; Valasai, G.D.; Khan, M.W.; Ikram, M. An Integrated Delphi-AHP and Fuzzy TOPSIS Approach toward Ranking and Selection of Renewable Energy Resources in Pakistan. Processes 2019, 7, 118. [Google Scholar] [CrossRef]
  20. Lee, H.C.; Chang, C.-T. Comparative analysis of MCDM methods for ranking renewable energy sources in Taiwan. Renew. Sustain. Energy Rev. 2018, 92, 883–896. [Google Scholar] [CrossRef]
  21. Papapostolou, A.; Karakosta, C.; Doukas, H. Analysis of policy scenarios for achieving renewable energy sources targets: A fuzzy TOPSIS approach. Energy Environ. 2017, 28, 88–109. Available online: https://www.jstor.org/stable/90006786 (accessed on 17 October 2023). [CrossRef]
  22. Pavlović, B.; Ivezić, D.; Živković, M. A multi-criteria approach for assessing the potential of renewable energy sources for electricity generation: Case Serbia. Energy Rep. 2021, 7, 8624–8632. [Google Scholar] [CrossRef]
  23. Tasri, A.; Susilawati, A. Selection among renewable energy alternatives based on a fuzzy analytic hierarchy process in Indonesia. Sustain. Energy Technol. Assess. 2014, 7, 34–44. [Google Scholar] [CrossRef]
  24. Abdullah, L.; Najib, L. Sustainable energy planning decision using the intuitionistic fuzzy analytic hierarchy process: Choosing energy technology in Malaysia. Int. J. Sustain. Energy 2016, 35, 360–377. [Google Scholar] [CrossRef]
  25. Sengül, Ü.; Eren, M.; Shiraz, S.; Gezder, V.; ¸Sengül, A. Fuzzy TOPSIS method for ranking renewable energy supply systems in Turkey. Renew. Energy 2015, 75, 617–625. [Google Scholar] [CrossRef]
  26. Tavana, M.; Shaabani, A.; Javier Santos-Arteaga, F.; Raeesi Vanani, I. A Review of Uncertain Decision-Making Methods in Energy Management Using Text Mining and Data Analytics. Energies 2020, 13, 3947. [Google Scholar] [CrossRef]
  27. Boran, F.E.; Boran, K.; Menlik, T. The Evaluation of Renewable Energy Technologies for Electricity Generation in Turkey Using Intuitionistic Fuzzy TOPSIS. Energy Sources Part B Econ. Plan. Policy 2012, 7, 81–90. [Google Scholar] [CrossRef]
  28. Rani, P.; Mishra, A.R.; Mardani, A.; Cavallaro, F.; Alrasheedi, M.; Alrashidi, A. A novel approach to extended fuzzy TOPSIS based on new divergence measures for renewable energy sources selection. J. Clean. Prod. 2020, 257, 120352. [Google Scholar] [CrossRef]
  29. Wang, C.-N.; Dang, T.-T.; Tibo, H.; Duong, D.-H. Assessing Renewable Energy Production Capabilities Using DEA Window and Fuzzy TOPSIS Model. Symmetry 2021, 13, 334. [Google Scholar] [CrossRef]
  30. Peleckis, K. Application of the Fuzzy VIKOR Method to Assess Concentration and Its Effects on Competition in the Energy Sector. Energies 2022, 15, 1349. [Google Scholar] [CrossRef]
  31. Taylan, O.; Alamoudi, R.; Kabli, M.; AlJifri, A.; Ramzi, F.; Herrera-Viedma, E. Assessment of Energy Systems Using Extended Fuzzy AHP, Fuzzy VIKOR, and TOPSIS Approaches to Manage Non-Cooperative Opinions. Sustainability 2020, 12, 2745. [Google Scholar] [CrossRef]
  32. Emovon, I. A fuzzy multi-criteria decision-making approach for power generation problem analysis. J. Eng. Sci. 2020, 7, E26–E31. [Google Scholar] [CrossRef]
  33. Wang, Y.; Guo, J.; Dai, J.; Chen, C. A Fuzzy VIKOR Approach for Renewable Energy Resources Selection in China. Rev. De La Fac. De Ing. 2016, 31, 62–77. Available online: https://scholar.archive.org/work/gw4ssgmtiraivgstdceo6qr3e4/access/wayback/http://revistadelafacultaddeingenieria.com/index.php/ingenieria/article/download/1149/1151 (accessed on 17 October 2023).
  34. Priyanka; Rajneesh. A Fuzzy VIKOR Model for Selection of Optimal Biomass Usage in India. In Proceedings of the 1st International Conference on Power Electronics, Intelligent Control and Energy Systems (ICPEICES) 2016 IEEE, Delhi, India, 4–6 July 2016; pp. 1–6. [Google Scholar] [CrossRef]
  35. Feylizadeh, M.R.; Dehghani, M.A. Priority Determination of the Renewable Energies Using Fuzzy Group VIKOR Method: Case Study Iran. In Proceedings of the International Conference on Industrial Engineering and Operations Management 2016, Kuala Lumpur, Malaysia, 8–10 March 2016; pp. 3281–3287. Available online: https://ieomsociety.org/ieom_2016/pdfs/235.pdf (accessed on 17 October 2023).
  36. Turgut, Z.K.; Tolga, A.Ç. Sustainable and Renewable Energy Power Plants Evaluation by Fuzzy VIKOR Technique. In Proceedings of the International MultiConference of Engineers and Computer Scientists 2017, IMECS 2017, Hong Kong, 15–17 March 2017; Volume II. Available online: https://www.iaeng.org/publication/IMECS2017/IMECS2017_pp774-779.pdf (accessed on 17 October 2023).
  37. Homayounfar, M.; Fadaei, M.; Gheibdoust, H.; Rezaee Kelidbari, H.R. A Systematic Literature Review on MOORA Methodologies and Applications. Iran. J. Oper. Res. 2022, 13, 164–183. Available online: http://iors.ir/journal/article-1-787-en.pdf (accessed on 17 October 2023).
  38. Yüksel, S.; Mikhaylov, A.; Khomyakova, L. Energy Center Selection in G7 Industry with Fuzzy MOORA. In Handbook of Research on Strategic Management for Current Energy Investments; IGI Global: Hershey, PA, USA, 2021. [Google Scholar] [CrossRef]
  39. Çelikbilek, Y.; Tuysuz, F. A Multi Criteria Analysis Approach by Using Fuzzy MOORA Technique: An Application to Renewable Energy Sources. In Proceedings of the November 2017 Conference: 4th International Conference on Pure and Applied Sciences: Renewable Energies (ICPAS 2017), İstanbul, Turkey, 23–25 November 2017; Available online: https://www.researchgate.net/publication/321309503 (accessed on 17 October 2023).
  40. Arslankaya, S.; ÇelikMiraç, T. Green supplier selection in steel door industry using fuzzy AHP and fuzzy Moora methods. Emerg. Mater. Res. 2021, 10, 357–369. [Google Scholar] [CrossRef]
  41. Khorshidi, M.; Erkayman, B.; Albayrak, Ö.; Kılıç, R.; Demir, H.I. Solar power plant location selection using integrated fuzzy DEMATEL and fuzzy MOORA method. Int. J. Ambient. Energy 2022, 43, 7400–7409. [Google Scholar] [CrossRef]
  42. Ramezanzade, M.; Karimi, H.; Almutairi, K.; Xuan, H.A.; Saebi, J.; Mostafaeipour, A.; Techato, K. Implementing MCDM Techniques for Ranking Renewable Energy Projects under Fuzzy Environment: A Case Study. Sustainability 2021, 13, 12858. [Google Scholar] [CrossRef]
  43. Attri, S.D.; Singh, S.; Dhar, A.; Powar, S. Multi-attribute sustainability assessment of wastewater treatment technologies using combined fuzzy multi-criteria decision-making techniques. J. Clean. Prod. 2022, 357, 131849. [Google Scholar] [CrossRef]
  44. Taherdoost, H.; Madanchian, M. Multi-Criteria Decision Making (MCDM) Methods and Concepts. Encyclopedia 2023, 3, 77–87. [Google Scholar] [CrossRef]
  45. Lazim Abdullah, L.; Zamri, N.; Goh, C.M. Application of Interval Type 2 Fuzzy SAW in Flood Control Project. Int. J. Adv. Soft Comput. Its Appl. 2019, 11, 124–137. Available online: https://www.i-csrs.org/Volumes/ijasca/8_p124-137_Application%20of%20Interval%20Type%202%20Fuzzy%20SAW%20in%20Flood%20Control%20Project.pdf (accessed on 17 October 2023).
  46. Lestari, P.F.I.; Prabowo, T.T.; Utomo, W.M. The Effectiveness of Fuzzy-SAW Method for the Selection of New Student Admissions in Vocational High School. Lett. Inf. Technol. Educ. (LITE) 2020, 3, 18–22. Available online: http://journal2.um.ac.id/index.php/lite/article/view/9727 (accessed on 17 October 2023). [CrossRef]
  47. Hsu, H.-M.; Chen, C.-T. Aggregation of fuzzy opinions under group decision making. Fuzzy Sets Syst. 1996, 79, 279–285. [Google Scholar]
  48. Ziemba, P. Multi-Criteria Fuzzy Evaluation of the Planned Offshore Wind Farm Investments in Poland. Energies 2021, 14, 978. [Google Scholar] [CrossRef]
  49. Wang, C.-N.; Kao, J.-C.; Wang, Y.-H.; Nguyen, V.T.; Nguyen, V.T.; Husain, S.T. A Multicriteria Decision-Making Model for the Selection of Suitable Renewable Energy Sources. Mathematics 2021, 9, 1318. [Google Scholar] [CrossRef]
  50. Nuriyev, M.; Mammadov, J.; Nuriyev, A.; Mammadov, J. Selection of Renewables for Economic Regions with Diverse Conditions: The Case of Azerbaijan. Sustainability 2022, 14, 12548. [Google Scholar] [CrossRef]
  51. Saqlain, M. Sustainable Hydrogen Production: A Decision-Making Approach Using VIKOR and Intuitionistic Hypersoft Sets. J. Intell. Manag. Decis. 2023, 2, 130–138. [Google Scholar] [CrossRef]
  52. Gupta, P.; Mehlawat, M.K.; Ahemad, F. Selection of renewable energy sources: A novel VIKOR approach in an intuitionistic fuzzy linguistic environment. Environ. Dev. Sustain. 2023, 25, 3429–3467. [Google Scholar] [CrossRef]
  53. Kaufmann, A.; Gupta, M.M. Introduction to Fuzzy Arithmetic: Theory and Applications; Van Nostrand Reinhold: New York, NY, USA, 1985. [Google Scholar]
  54. Chen, C.-T. Extensions of the TOPSIS for group decision-making under fuzzy environment. Fuzzy Sets Syst. 2000, 114, 1–9. [Google Scholar] [CrossRef]
  55. Siddiqui, Z.A.; Tyagi, K. A critical review on effort estimation techniques for service-oriented-architecture-based applications. Int. J. Comput. Appl. 2016, 38, 207–216. [Google Scholar] [CrossRef]
  56. Opricovic, S. Fuzzy VIKOR with an application to water resources planning. Expert Syst. Appl. 2011, 38, 12983–12990. [Google Scholar] [CrossRef]
  57. Zamani-Sabzi, H.; King, J.P.; Gard, C.C.; Abudu, S. Statistical and analytical comparison of multi-criteria decision-making techniques under fuzzy environment. Oper. Res. Perspect. 2016, 3, 92–117. [Google Scholar] [CrossRef]
  58. The State Statistical Committee of the Republic of Azerbaijan (SSC). GDP Production in the Section of Oil and Non-Oil of Economy. Available online: https://stat.gov.az/source/system_nat_accounts/en/007_1en.xls (accessed on 1 August 2023).
  59. The World Bank. The World Development Indicators. Available online: https://api.worldbank.org/v2/en/country/AZE?downloadformat=excel (accessed on 1 August 2023).
  60. Azerbaijan Renewable Energy Agency under the Ministry of Energy of the Republic of Azerbaijan. Potential of Renewable Energy Sources. Available online: https://area.gov.az/en/page/yasil-texnologiyalar/boem-potensiali (accessed on 1 August 2023).
  61. The State Statistical Committee of the Republic of Azerbaijan (SSC). Renewable Energy Supply, Thousand TOE. Available online: https://stat.gov.az/source/balance_fuel/en/001_5en.xls (accessed on 1 August 2023).
Figure 1. Research flowchart.
Energies 16 08068 g001
Figure 2. Comparison of the rankings, based on four different methods and different aggregation approaches.
Energies 16 08068 g002
Figure 3. Comparison of the rankings, based on four different methods and aggregation approaches, but with equally weighted criteria.
Energies 16 08068 g003
Table 1. Linguistic terms for alternatives and criteria evaluation.
AlternativeCriteria
Linguistic TermFuzzy ValueLinguistic TermFuzzy Value
Very Poor (VP)(0.0, 0.05, 0.2)Very Low (VL)(0.0, 0.05, 0.2)
Poor (P)(0.05, 0.2, 0.35)Low (L)(0.05, 0.2, 0.35)
Below Average (BA)(0.2, 0.35, 0.5)Medium Low (ML)(0.2, 0.35, 0.5)
Average (A)(0.35, 0.5, 0.65)Medium (M)(0.35, 0.5, 0.65)
Above Average (AA)(0.5, 0.65, 0.8)Medium High (MH)(0.5, 0.65, 0.8)
Good (G)(0.65, 0.8, 0.95High (H)(0.65, 0.8, 0.95)
Very Good (VG)(0.8, 1, 1)Very High (VH)(0.8, 1, 1)
Table 2. Alternative-scenario-based linguistic decision matrices.
Expert 1 Expert 7
EC1C2C3C4C5C6C7C8 C1C2C3C4C5C6C7C8
A1VGGGVGAGVGAA A1GVGVGGBAVGGG
A2VGGGGAGGAA A2GVGVGVGBAVGAAG
A3VGAAAAGAGBAAA A3GGGVGBAGPG
A4GABAABAGGG...A4AAAAAAAAPGAAVG
A5GGAAGAGVGG A5AAVGGGBAVGGVG
A6VGAAAAGAGVGAA A6GAAGGBAGGG
A7VGGGGAAAVGA A7AAVGVGGBAGGAA
A8VGGGGAAGVGAA A8GGVGVGAVGGG
A9VGGAAAAAGAAA A9GVGGGBAVGAAA
Table 3. Fuzzy decision matrix composed by Expert 1.
C1 C2 C3 C4 C5 C6 C7 C8
lmulmulmulmulmulmulmulmu
A10.8110.650.810.650.80.950.8110.350.50.650.650.80.950.8110.50.650.8
A20.8110.650.810.650.80.950.650.80.950.350.50.650.650.80.950.650.80.950.50.650.8
A30.8110.50.650.80.50.650.80.650.80.950.350.50.650.650.80.950.20.350.50.50.650.8
A40.650.80.950.350.50.70.20.350.50.50.650.80.20.350.50.650.80.950.650.80.950.650.80.95
A50.650.80.950.650.810.50.650.80.650.80.950.350.50.650.650.80.950.8110.650.80.95
A60.8110.50.650.80.50.650.80.650.80.950.350.50.650.650.80.950.8110.50.650.8
A70.8110.650.810.650.80.950.650.80.950.350.50.650.50.650.80.8110.350.50.65
A80.8110.650.810.650.80.950.650.80.950.50.650.80.650.80.950.8110.50.650.8
A90.8110.650.810.50.650.80.50.650.80.350.50.650.650.80.950.50.650.80.350.50.65
Table 4. Fuzzy decision matrix composed by Expert 7.
C1 C2 C3 C4 C5 C6 C7 C8
lmulmulmulmulmulmulmulmu
A10.650.80.950.8110.8110.650.80.950.20.350.50.8110.650.80.950.650.80.95
A20.650.80.950.8110.8110.8110.20.350.50.8110.50.650.80.650.80.95
A30.650.80.950.650.810.650.80.950.8110.20.350.50.650.80.950.050.20.350.650.80.95
A40.50.650.80.50.650.80.50.650.80.50.650.80.050.20.350.650.80.950.50.650.80.811
A50.50.650.80.8110.650.80.950.650.80.950.20.350.50.8110.650.80.950.811
A60.650.80.950.50.650.80.650.80.950.650.80.950.20.350.50.650.80.950.650.80.950.650.80.95
A70.50.650.80.8110.8110.650.80.950.20.350.50.650.80.950.650.80.950.50.650.8
A80.650.80.950.650.810.8110.8110.350.50.650.8110.650.80.950.650.80.95
A90.650.80.950.8110.650.80.950.650.80.950.20.350.50.8110.350.50.650.50.650.8
Table 5. Aggregated decision matrix.
Average-Approach-Based Aggregated Decision Matrix
C1C2C3C4C5C6C7C8
A10.650.810.930.650.810.930.620.790.880.710.880.970.320.470.620.680.850.940.680.840.960.500.650.80
A20.680.840.960.620.780.900.620.780.900.650.810.930.230,380.530.620.780.900.500.650.800.500.650.80
A30.680.850.940.500.650.800.500.650.800.650.820.910.290.440.590.560.710.860.170.320.470.470.620.77
A40.560.710.860.290.440.590.290.440.590.350.500.650.140.290.440.530.680.830.560.710.860.620.780.90
A50,620.780.900.650.820.910.440.590.740.560.710.860.260.410.560.620.780.900.650.810.930.650.820.91
A60.650.810.930.380.530.680.470.620.770.530.680.830.230.380.530.530.680.830.680.840.960.470.620.77
A70.650.820.910.650.820.910.650.820.910.560.710.860.320.470.620.500.650.800.650.810.930.380.530.68
A80.680.840.960.590.740.890.620.780.900.560.720.840.320.470.620.620.780.900.650.810.930.500.650.80
A90.680.850.940.620.780.900.500.650.800.470.620.770.290.440.590.650.820.910.440.590.740.320.470.62
SAM-approach-based aggregation
C1C2C3C4C5C6C7C8
A10.650.800.940.650.800.940.730.920.960.690.850.960.290.440.590.710.880.970.660.810.950.500.650.80
A20.660.810.950.590.740.880.590.750.890.650.800.940.210.360.510.590.740.880.500.650.800.500.650.80
A30.710.880.970.500.650.800.500.650.800.650.820.910.220.370.520.630.780.930.140.290.440.440.590.74
A40.540.690.840.220.370.520.220.370.520.350.500.650.160.310.460.560.710.860.540.690.840.590.740.88
A50.590.740.880.630.790.890.370.520.670.490.640.790.220.370.520.590.740.880.650.800.940.650.820.91
A60.650.800.940.410.560.710.440.590.740.560.710.860.210.360.510.560.710.860.660.810.950.440.590.74
A70.650.820.910.650.820.910.650.820.910.630.780.930.290.440.590.460.610.760.650.800.940.270.420.57
A8 0.660.810.950.600.750.900.590.740.880.520.670.810.290.440.590.590.740.880.650.800.940.500.650.80
A90.710.880.970.590.740.880.500.650.800.440.590.740.220.370.520.650.820.910.370.520.670.290.440.59
Table 6. Experts’ opinion on criteria importance.
CriterionExpertslmu
C1E10.811
E20.811
E30.650.80.95
E40.50.650.8
E50.650.81
E60.811
E70.650.80.95
C2E10.350.50.65
E20.20.30.5
E30.20.30.5
C8E10.811
E20.811
E30.811
E40.650.80.95
E50.811
E60.811
E70.811
Table 7. Aggregated weights of the criteria.
CriteriaSAM ApproachAverage-Based Approach
c10.7117330.8848380.9770760.680.850.95
c20.2897890.4397890.5897890.320.450.62
c30.0776320.2276320.3776320.230.380.53
c40.7559920.94132210.740.920.98
c50.20.350.50.20.350.5
c60.350.50.650.350.50.65
c70.7559920.94132210.740.920.98
c80.7935980.99146310.770.960.99
Table 8. Distances from ideal solutions, relative closeness of each alternative scenario, and rankings.
AlternativesA1A2A3A4A5A6A7A8A9
Fuzzy data aggregated using the SAM
approach
d i + 7.663287.9602688.5666228.4232477.963147.9690617.532027.6235187.604861
d i 6.9400156.6051445.9625046.2230816.5972826.6415297.1317246.9993747.142326
δ i 0.4752360.4534810.4103830.424890.4530970.454570.4863510.4786590.484318
Ranking469875132
Fuzzy data aggregated using an average-based approach d i + 7.9490768.3684838.8279328.6683828.2601358.2336687.8052827.9589977.946196
d i 6.67096.1886855.7019955.9695716.3220776.3798046.9656366.6904196.788799
δ i 0.4562870.425130.3924310.4078150.4335470.436570.4715780.4567020.460726
Ranking479865132
Table 9. Rankings for SAM-based and average-based weighting approaches.
AlternativesA1A2A3A4A5A6A7A8A9
SAM approach Z q z q + ,   z q 0.1055830.084430.0683220.068260.086770.0934930.1164370.1083020.107367
Ranking478965123
Average-based approach Z q z q + ,   z q 0.1091240.094830.074330.073170.093260.097430.1190370.1140540.115842
Ranking468975132
Table 10. Fuzzy VIKOR values R, S and Q for SAM-based and average-based weighting approaches.
AlternativesA1A2A3A4A5A6A7A8A9
SAM approach R 0.5340.4740.6010.510.590.3690.4490.3850.347
Ranking759682431
S 1.2421.6181.8491.8991.61.4191.0891.1830.985
Ranking478965231
Q 0.11750.11770.19820.15750.17330.05020.06350.03970.0049
Ranking569783421
Average-based approach R 0.5450.4590.5970.5030.5420.3190.3330.3410.298
Ranking859672341
S1.1721.3871.8971.9351.5091.3970.9911.0430.907
Ranking458976231
Q0.1430.120.2210.1810.1670.0560.0330.040.01
Ranking659874231
Table 11. Results of calculations of fuzzy SAW.
AlternativesA1A2A3A4A5A6A7A8A9
SAM approach Score 3.63683.3463.0583.23.433.453.773.6293.657
Ranking379865142
Average-based approachScore3.7993.5923.2053.3373.5983.6073.893.823.864
Ranking479865132
Table 12. Results of calculations with equally weighted criteria.
AlternativesA1A2A3A4A5A6A7A8A9
Fuzzy DM aggregated using the SAM
approach
TOPSIS δ i 0.7140.650.6040.5660.6440.6380.710.6940.683
Ranking158967234
MOORA
Z q z q + ,   z q
0.03410.02810.02490.02080.027230.02760.03430.03240.031
Ranking258976134
VIKOR (Q)3.6373.3463.0583.2003.4313.4553.7733.6283.657
Ranking379865142
SAW (FS)3.6373.3463.0583.2003.4313.4553.7733.6283.657
Ranking379865142
Fuzzy DM aggregated
using the average
approach
TOPSIS δ i 0.7200.6820.6200.5910.6750.6540.7240.7170.712
Ranking258967134
MOORA
Z q z q + ,   z q
0.0320.0280.0240.0200.0270.0260.0330.0320.031
Ranking358967124
VIKOR (Q)0.1280.1070.2150.2170.1520.1120.0650.0230.008
Ranking648975321
SAW (FS)3.7993.5923.2053.3373.5983.6073.8903.8213.864
Ranking479865132
Disclaimer/Publisher’s Note: The statements, opinions and data contained in all publications are solely those of the individual author(s) and contributor(s) and not of MDPI and/or the editor(s). MDPI and/or the editor(s) disclaim responsibility for any injury to people or property resulting from any ideas, methods, instructions or products referred to in the content.

