Article

Experimental Investigation of IOR Potential in Shale Oil Reservoirs by Surfactant and CO2 Injection: A Case Study in the Lucaogou Formation

1
Xinjiang Oilfield Company, PetroChina, Karamay 834000, China
2
State Key Laboratory of Oil and Gas Reservoir Geology and Exploitation, Chengdu University of Technology, Chengdu 610059, China
3
Department of Petroleum Engineering, China University of Petroleum-Beijing at Karamay, Karamay 834000, China
4
Unconventional Petroleum Research Institute, China University of Petroleum-Beijing, Beijing 102249, China
*
Authors to whom correspondence should be addressed.
Energies 2023, 16(24), 8085; https://doi.org/10.3390/en16248085
Submission received: 8 November 2023 / Revised: 30 November 2023 / Accepted: 14 December 2023 / Published: 15 December 2023

Abstract

:
The current oil recovery of the Lucaogou shale oil reservoir is predicted to be about 7.2%. It is crucial to explore improved oil recovery (IOR) technologies, and further experimental and field research needs to be conducted to study the complex mechanism. In this study, laboratory experiments were carried out to investigate the performance of one-step and multi-step depletion, CO2 huff-n-puff, and surfactant imbibition based on nuclear magnetic resonance (NMR). The sweep efficiencies were assessed via NMR imaging. In addition, hybrid methods of combining surfactant with CO2 huff-n-puff and the performance of injection sequence on oil recovery were investigated. The experimental results indicate that oil recoveries of depletion development at different initial pressures range from 4% to 11%. CO2 huff-n-puff has the highest oil recovery (30.45% and 40.70%), followed by surfactant imbibition (24.24% and 20.89%). Pore size distribution is an important factor. After three more cycles of surfactant imbibition and CO2 huff-n-puff, the oil recovery can be increased by 11.27% and 26.27%, respectively. Surfactant imbibition after CO2 huff-n-puff shows a viable method. Our study can provide guidance and theoretical support for shale oil development in the Lucaogou shale oil reservoir.

1. Introduction

In 2019, more than 60% of the crude oil production in the United States was tight oil [1]. And the shale oil resources were found one after another in Junggar basin, Ordos basin, Song Liao basin, etc., which also showed great potential in China [2,3,4]. The National Energy Administration (NEA) estimated that shale oil production was 3 million tons in 2022 and was 3.8-times as much as the production in 2018 [5]. However, shale formations have poor physical properties, leading to a rapid decrease in production and a low oil recovery. About 90% of oil from shale reservoirs is left in the subsurface. It is a huge challenge to obtain a high oil recovery in unconventional reservoirs in the long term.
Horizontal well and hydraulic fracturing significantly enhance the connectivity of reservoirs, which are the most common and important methods for shale oil production [6,7,8]. In the USA, the number of horizontal wells is over 15.3 × 10⁴ to ensure higher production [9]. In the first production stage, the main drive mechanism is the depletion drive due to the elastic energy of reservoirs. However, the cost of drilling new long horizontal wells is highly expensive, and the natural elastic energy of reservoirs will soon be consumed. The oil production from new horizontal wells still would not last for a long time. In the second production stage, pumping fluid is used to maintain reservoir pressure. It is necessary to seek other IOR methods, as a 1% increase in the oil recovery factor could yield huge returns [10]. Various physic-chemical methods, hydrodynamic methods, gas methods, thermal methods, or these combinations are explored to obtain the higher oil recovery as much as possible in the third production stage [11]. Some methods might be successfully used in conventional reservoirs but might not be suitable for unconventional ones, mainly because of their low porosity and permeability. In addition, unique pore structure and total organic carbon (TOC) content in shale reservoirs have an impact on the mobility of liquids [12]. In the last decade, various IOR methods in unconventional reservoirs were investigated without large-scale applications in oil fields [13,14]. Alfarge et al. [15] concluded that the most effective IOR methods in shale reservoirs are gas injection and surfactant imbibition.
Gas continuous flooding and huff-n-puff, such as CO2, N2, or a mixture of gases, have been widely investigated by many researchers [16,17]. Compared with other gas types and injection modes, CO2 huff-n-puff has received great attention in IOR methods, as CO2 can dissolve easily in oil and has a lower miscibility pressure [18,19,20]. In addition, experimental results showed CO2 huff-n-puff exhibited a greater performance compared to continuous injection, with a potential variance of up to 32.46% [21]. CO2 huff-n-puff comprises three phases: injection phase, soaking phase, and production phase. Molecular diffusion, reductions in oil viscosity, oil swelling, etc., are the governing mechanisms of the CO2 huff-n-puff process [22]. When CO2 is injected and then the production well is shut, CO2 will diffuse from fractures into matrix pores. Then, CO2 will dissolve in the oil, causing oil swelling and reducing the viscosity. Following the reopening of the well, the blend of CO2 and crude oil within the formation matrix is displaced toward the fracture and, subsequently, migrates to the production well through the fracture. The field-scale test of CO2 huff-n-puff in Morgan County, Tennessee, showed that the production rate was 8-times higher than that by conventional production methods [23]. In addition, miscibility of the CO2 plays an important role in the success of the CO2 huff-n-puff process, which is related to the minimum miscibility pressure (MMP). The interfacial tension almost disappears, and oil recovery is largely improved under the miscibility condition [24]. However, the results of CO2 injection are not great all the time, being affected by the distinctive physicochemical characteristics of fluids and rocks, as well as the interactions between them [25].
Surfactants, including anionic, cationic, and nonionic, all possess the capability to enhance oil recovery by altering wettability, lowering the interfacial tension (IFT) by orders (1–3) of magnitude, and preventing asphaltene precipitation [26,27]. The wettability of many shale reservoirs is mixed-wet and oil-wet, causing a low primary recovery. The interactions between surfactant molecules and rock surfaces can change the wettability of the reservoir from oil-wet to water-wet. On this basis, water can be easily imbibed into the pore space, resulting in oil expulsion. Alvarez and Schechter [28] reported that using surfactants can increase oil by 40% more than water for Bakken shale samples. In recent years, some scholars have combined surfactants with gas huff-n-puff to further improve oil recovery. Zhang et al. [29] reported that an additional 10% oil recovery was produced by surfactant-assisted CO2 huff-n-puff. Li et al. [30] reported the influence of injection sequence on swept area and oil recovery. Injecting surfactant solution first showed the best oil recovery for core samples from the Shengli oil field. When selecting proper surfactants, temperature, salinity, pressure, oil composition, and rock mineralogy should be carefully considered to avoid damaging reservoirs [31].
The Middle Permian Lucaogou Formation (P2l) in Jimser Sag, Junggar Basin, is multisource, fine-grained mixed sediments deposited in a terrestrial salty lake environment, which is good for shale oil generation [32,33,34]. The proven resources of shale oil are over one billion tons [35]. Since it was first recovered in 2011, horizontal wells and multi-stage hydraulic fracturing methods have been mainly used to ensure high production [36]. The oil production rate declined by more than 80% within the first year due to highly heterogeneous and poor physicochemical properties, and oil recovery is predicted to be about 7.2% by depletion development [37]. It is crucial to seek other suitable IOR methods. To date, some physicochemical and technological foundations have been tested in various geological and field conditions. However, the influence of CO2 and surfactants on residual oil in various types of reservoirs is intricate and diverse. Numerous facets of this phenomenon remain incompletely explored, necessitating further investigation and clarification for the mechanism of oil recovery. Thus, there is a compelling requirement for additional experimental and field research grounded in contemporary scientific principles to advance our understanding of this intricate mechanism in the oil reservoir before a pilot test.
In this study, to investigate the performance and mechanism of different IOR techniques for the specific shale oil formations in the Jimsar sag, multiple strategies are prepared and compared. One-step and multi-step depletion considering different initial pressures, CO2 huff-n-puff, and surfactant imbibition was conducted. Cumulative oil recovery in different cycles was measured via NMR. And the sweep area and efficiency of CO2 huff-n-puff and surfactant imbibition were shown through NMR imaging. In addition, a hybrid method of combining surfactant with CO2 huff-n-puff was tested, and the performance of the injection sequence on oil recovery was discussed. Our study of this research can provide guidance and a technical reference for guiding field tests in the Lucaogou shale oil reservoir.

2. Methodology

2.1. Experimental Materials

2.1.1. Core Samples

The experimental shale samples were collected from the upper and lower sweet points in the Lucaogou Formation. The helium gas porosity and permeability of all core samples were measured using the pulse decay method. As shown in Table 1, seven samples have similar porosity and permeability, with 2.6 cm in length and 2.5 cm in diameter. Sample S9 is tighter and has lower porosity and permeability. X1 (a, b, c) was selected for depletion production, X3 for CO2 huff-n-puff, X2 for surfactant imbibition, S70 for CO2 huff-n-puff and surfactant imbibition, and S9 for surfactant imbibition and CO2 huff-n-puff.

2.1.2. Surfactant

Surfactants can reduce the interfacial tension, thereby reducing the seepage resistance of crude oil and improving the fluidity of crude oil. Before surfactant imbibition, twenty different types and concentrations of surfactants were prepared to filter the most effective surfactant for Jimsar shale oil. And IFT and wettability tests were conducted. The interfacial tension test instrument is a Spinning Drop Tensiometer from KRÜSS company. The surfactant solution was prepared with simulated formation water, which has 4564.3 mg/L bicarbonate, 4537.95 mg/L chloride, 174.51 mg/L sulfate radical, 12.32 mg/L calcium, 7.47 mg/L magnesium, and 4719.9 mg/L potassium and sodium. Formation water salinity is 14,016.46 mg/L. The oil used for the IFT test was dehydrated crude oil from J25 well, which has high viscosity. The test results of interfacial tension between different surfactant liquid and Jimsar crude oil show that IFTs are all high. The IFT results of 0.2% AES, 0.1% DPS-2 are 0.384, and 0.361 mN/m, respectively, which are relatively great (Table 2).
Based on the IFT results, a contact angle measuring instrument (kruss-bro-dsa25) was used to test the performance of surfactant to change rock wettability through pendant-drop method. The 0.2% AES solution can reduce the contact angle of the hydrophilic core sample from 63.9° to 37.6°, and the hydrophilicity is then enhanced (Table 3). And it can make the sample change from lipophilic to hydrophilic. The contact angle is reduced from 115° to 52.7°. However, the 0.1% DPS-2 solution did not change the wettability effectively. Considering all the test results, 0.2% AES surfactant sample was chosen. It can effectively reduce the IFT and contact angle of rock, enhance the hydrophilicity of rock, and even turn lipophilicity into hydrophilicity.

2.2. Experimental Methods

As shown in Figure 1, NMR online displacement system (SPEC-035) was utilized to observe shifts in fluid distribution within the different core samples throughout various cycles. In the NMR experiment, the capacity of hydrogen protons within a porous medium to recover their original state following exposure to a magnetic field sequence can be quantified. The fluid used for rock saturation is hydride, e.g., water and crude oil. For oil-saturated samples, the change in T2 spectrum represents the change in crude oil in pores. The oil used in this study is dead shale oil. Previous slim-tube test indicated that the minimum miscible pressure (MMP) of the crude oil used in this study is 24.28 MPa, which is much lower than the initial and current reservoir pressures [38].
T2 relation in porous media is dominated by surface relaxation (T2S).
1 T 2 1 T 2 S = ρ 2 S V
where ρ 2 is the surface relaxation rate (µm/ms), and S/V is the surface–volume ratio (µm−1).
T2S depends on the frequency of collisions between protons and the rock surface, which is related to pore radius. Equation (1) can be reformulated as:
1 T 2 = ρ 2 F S r
where r is the pore radius (µm) and the values of F S are related to the pore shapes and are usually 2 or 3.
So, the calculation for pore radius is as follows:
r = 2 ρ 2 T 2
Based on the MIP data, ρ 2 is calibrated and then T2 distribution can be used to quantitatively characterize the pore size.
In addition, the total signal amplitude of T2 spectrum reflects the hydrogen content in crude oil. The content of oil in rock can be expressed by the area of a T2 spectrum:
m 0 = S ( T 2 )
where m0 is the content of oil in the rocks, and S(T2) is a function of the area of the T2 spectrum.
When the oil in porous media is produced, T2 spectrum changes correspondingly. Then, the change in oil is [18]:
m = m 0 m 1 = S 0 T 2 S 1 ( T 2 )
The oil recovery η can be expressed by this change:
η = m m 0 × 100 % = S 0 T 2 S 1 ( T 2 ) S 0 T 2
On this basis, the oil recovery in different scales of pores can be evaluated by the change in T2 spectrum imaging. In addition to NMR relaxation analysis, 2D and 3D imaging analysis can also be performed online. NMR imaging technique can reveal the fluid flow in experimental samples. The brighter areas of the image represent more oil. When oil in the core samples is produced, the color changes correspondingly. Thus, the efficiency of CO2 and surfactant at different cycles can be assessed by the change of color in NMR imaging.

2.3. Experimental Procedure

Prior to the experiment, all shale samples underwent a soaking process in a mixed solution of toluene and methanol to remove oil and salt. Next, all samples were saturated with dead oil for 30 days at 30 MPa and 45 °C. The NMR signals of the oil-saturated shale samples were measured at least two times. The number of scans is 64, with 4000 MS waiting time (TW), 6000 echo number (NECH), and 0.2 MS echo time (TE).
The procedures of one-step and multi-step depletion development are shown as follows:
(1)
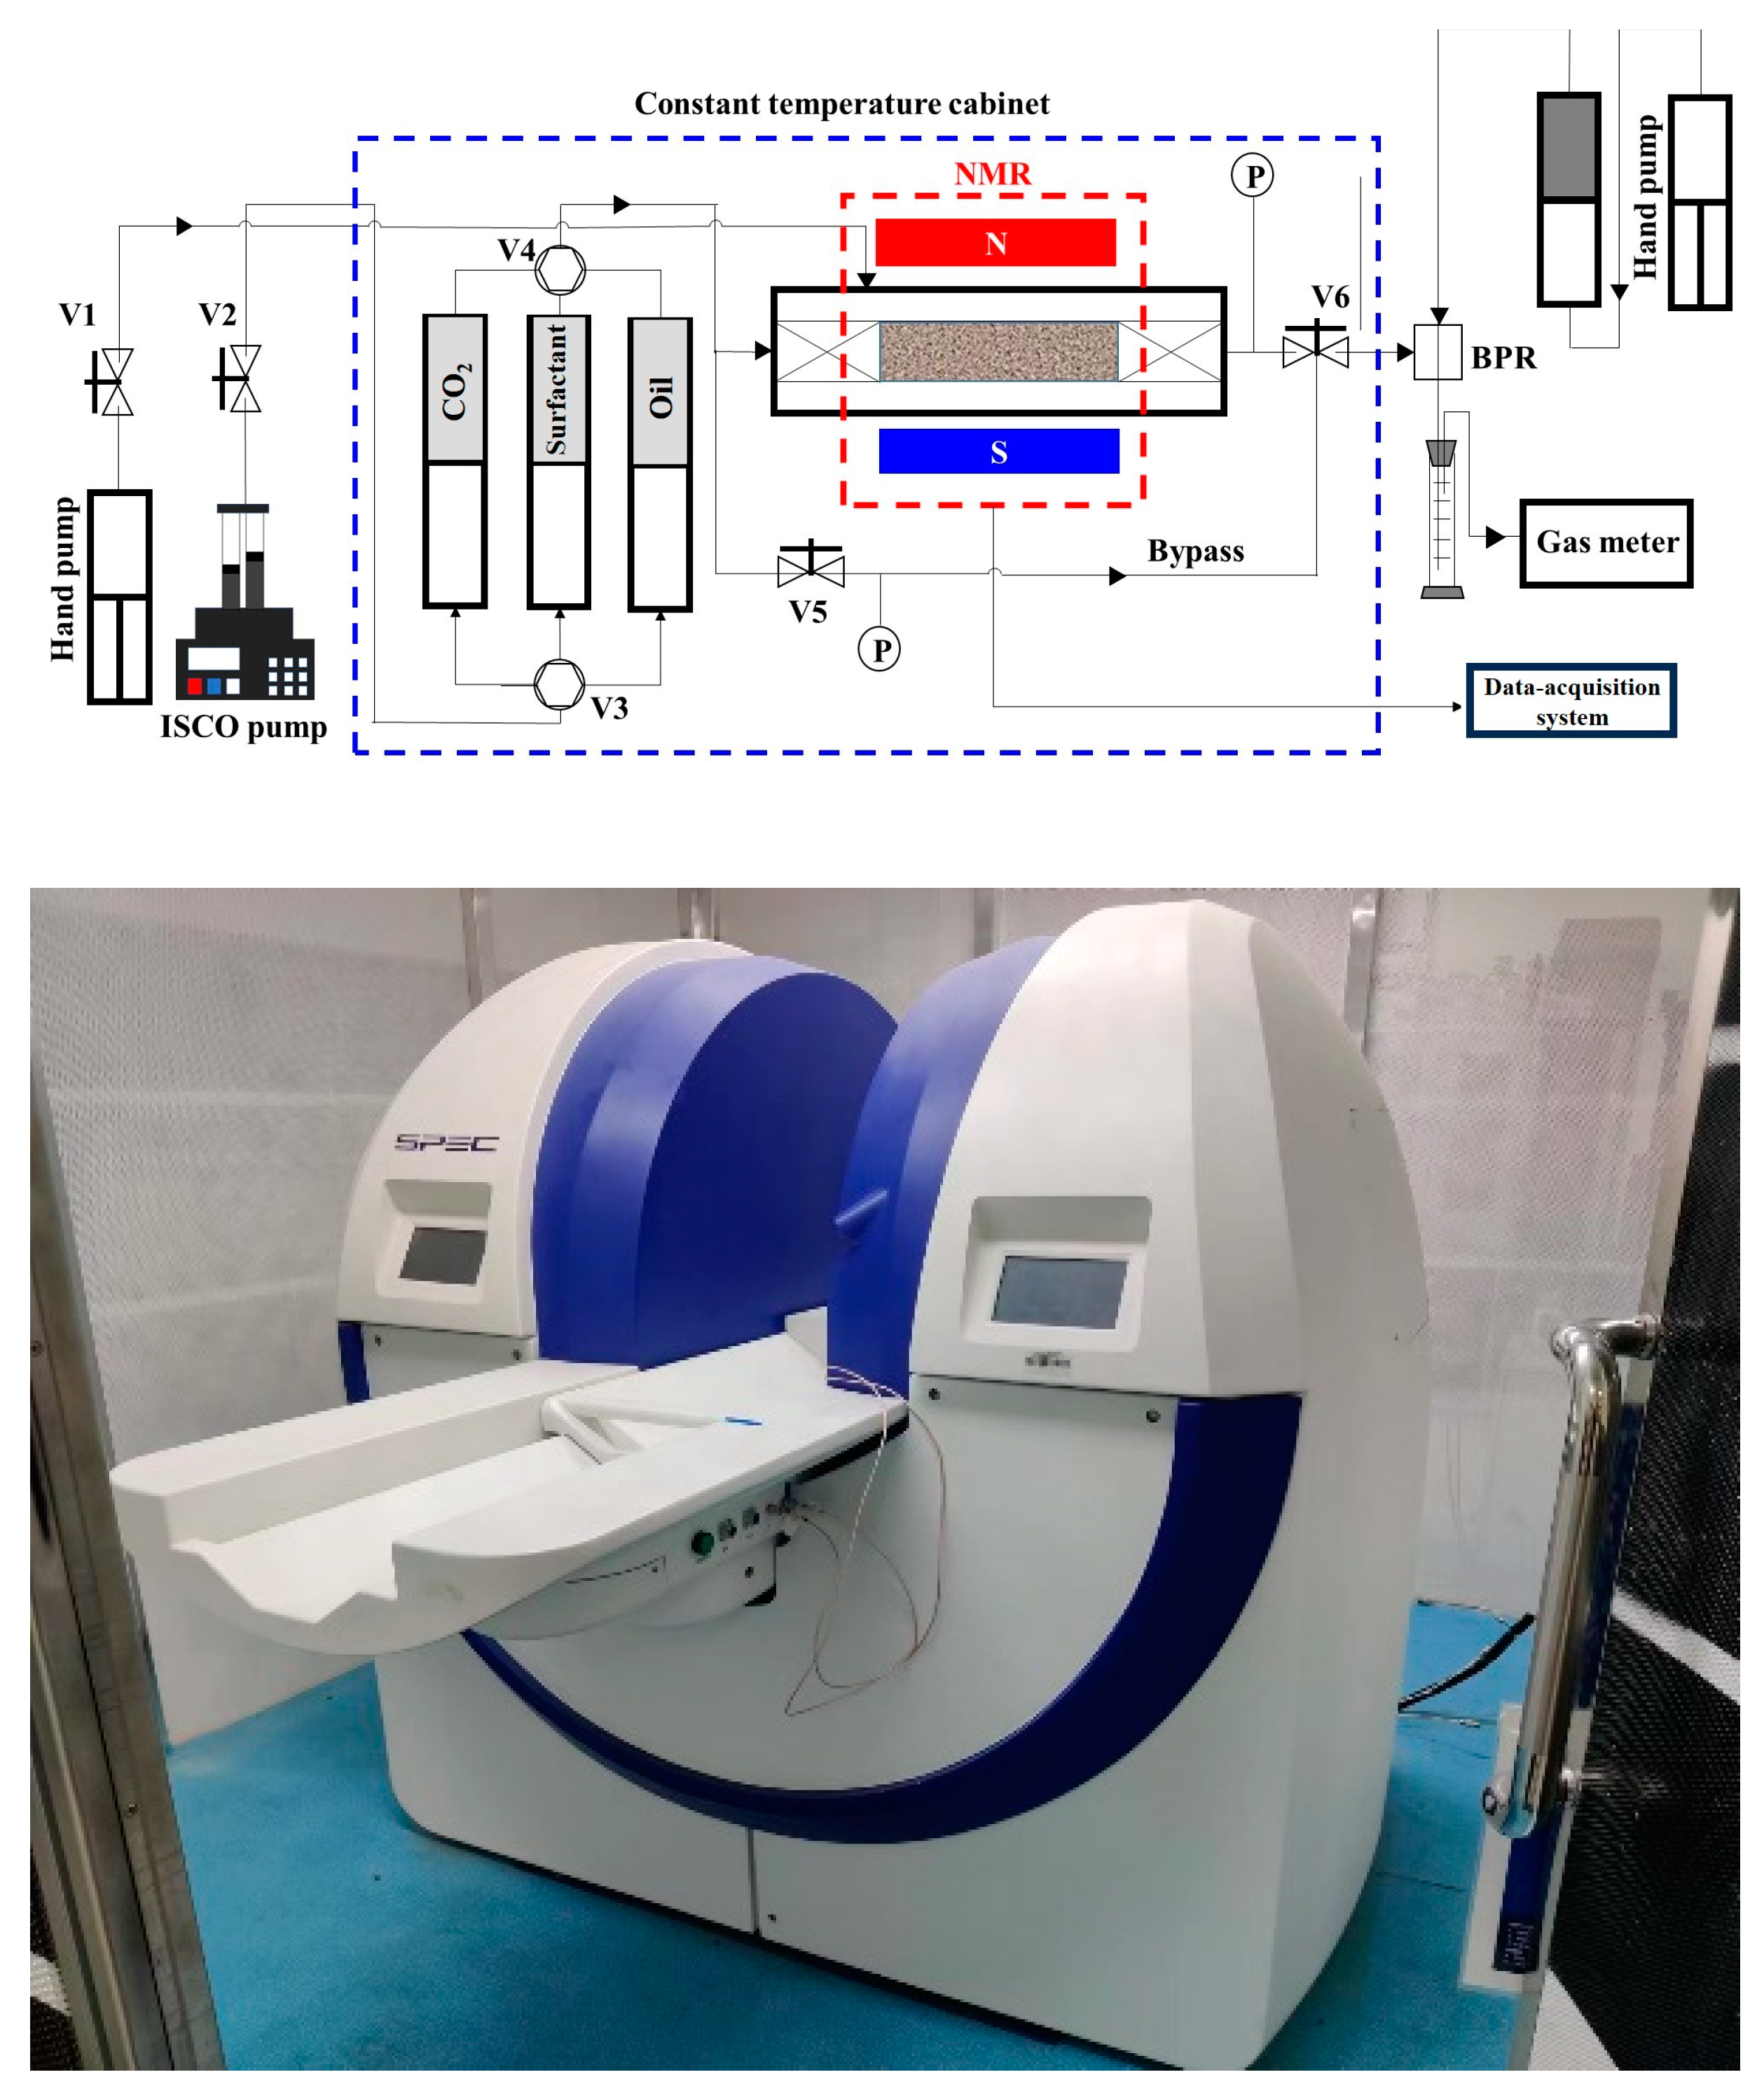
The sample was placed into a core holder. The outlet end of the core holder was connected with the back-pressure valve. And the core pore pressure is increased to 15 MPa by pump under the condition of formation temperature.
(2)
For one-step depletion development, the outlet pressure of the core was reduced to atmospheric pressure at one time, and the T2 spectrum of samples was tested by the NMR online displacement system.
(3)
For multi-step depletion development, the pressure was reduced by one-third at a time until the outlet pressure was reduced to atmospheric pressure. Each stage was maintained for 30 min.
(4)
When the core sample was replaced, the pressure changed to 20 MPa and 30 MPa, respectively. Steps (2) and (3) were repeated to analyze the influence of different reservoir pressure on one-step depletion development.
The procedures of CO2 huff-n-puff and surfactant imbibition are as follows:
(5)
Under the condition of reservoir temperature, the core pore pressure is controlled to 20 MPa. Further, 0.2 PV of supercritical CO2 was injected by a high-pressure constant speed pump for X3 and S70. The injection rate of CO2 was 0.05 mL/min, and 0.2% AES surfactant was injected for X2 and S9. Then, the pressure was sustained for a duration of two hours.
(6)
The injection port was opened. After the oil in the rocks was no longer produced, the NMR T2 signals were measured. The NMR imaging of X2 and X3 was measured.
(7)
Procedures (1) and (2) were repeated. NMR T2 and imaging signals were measured in different cycles. This experiment comprised a total of four cycles.
(8)
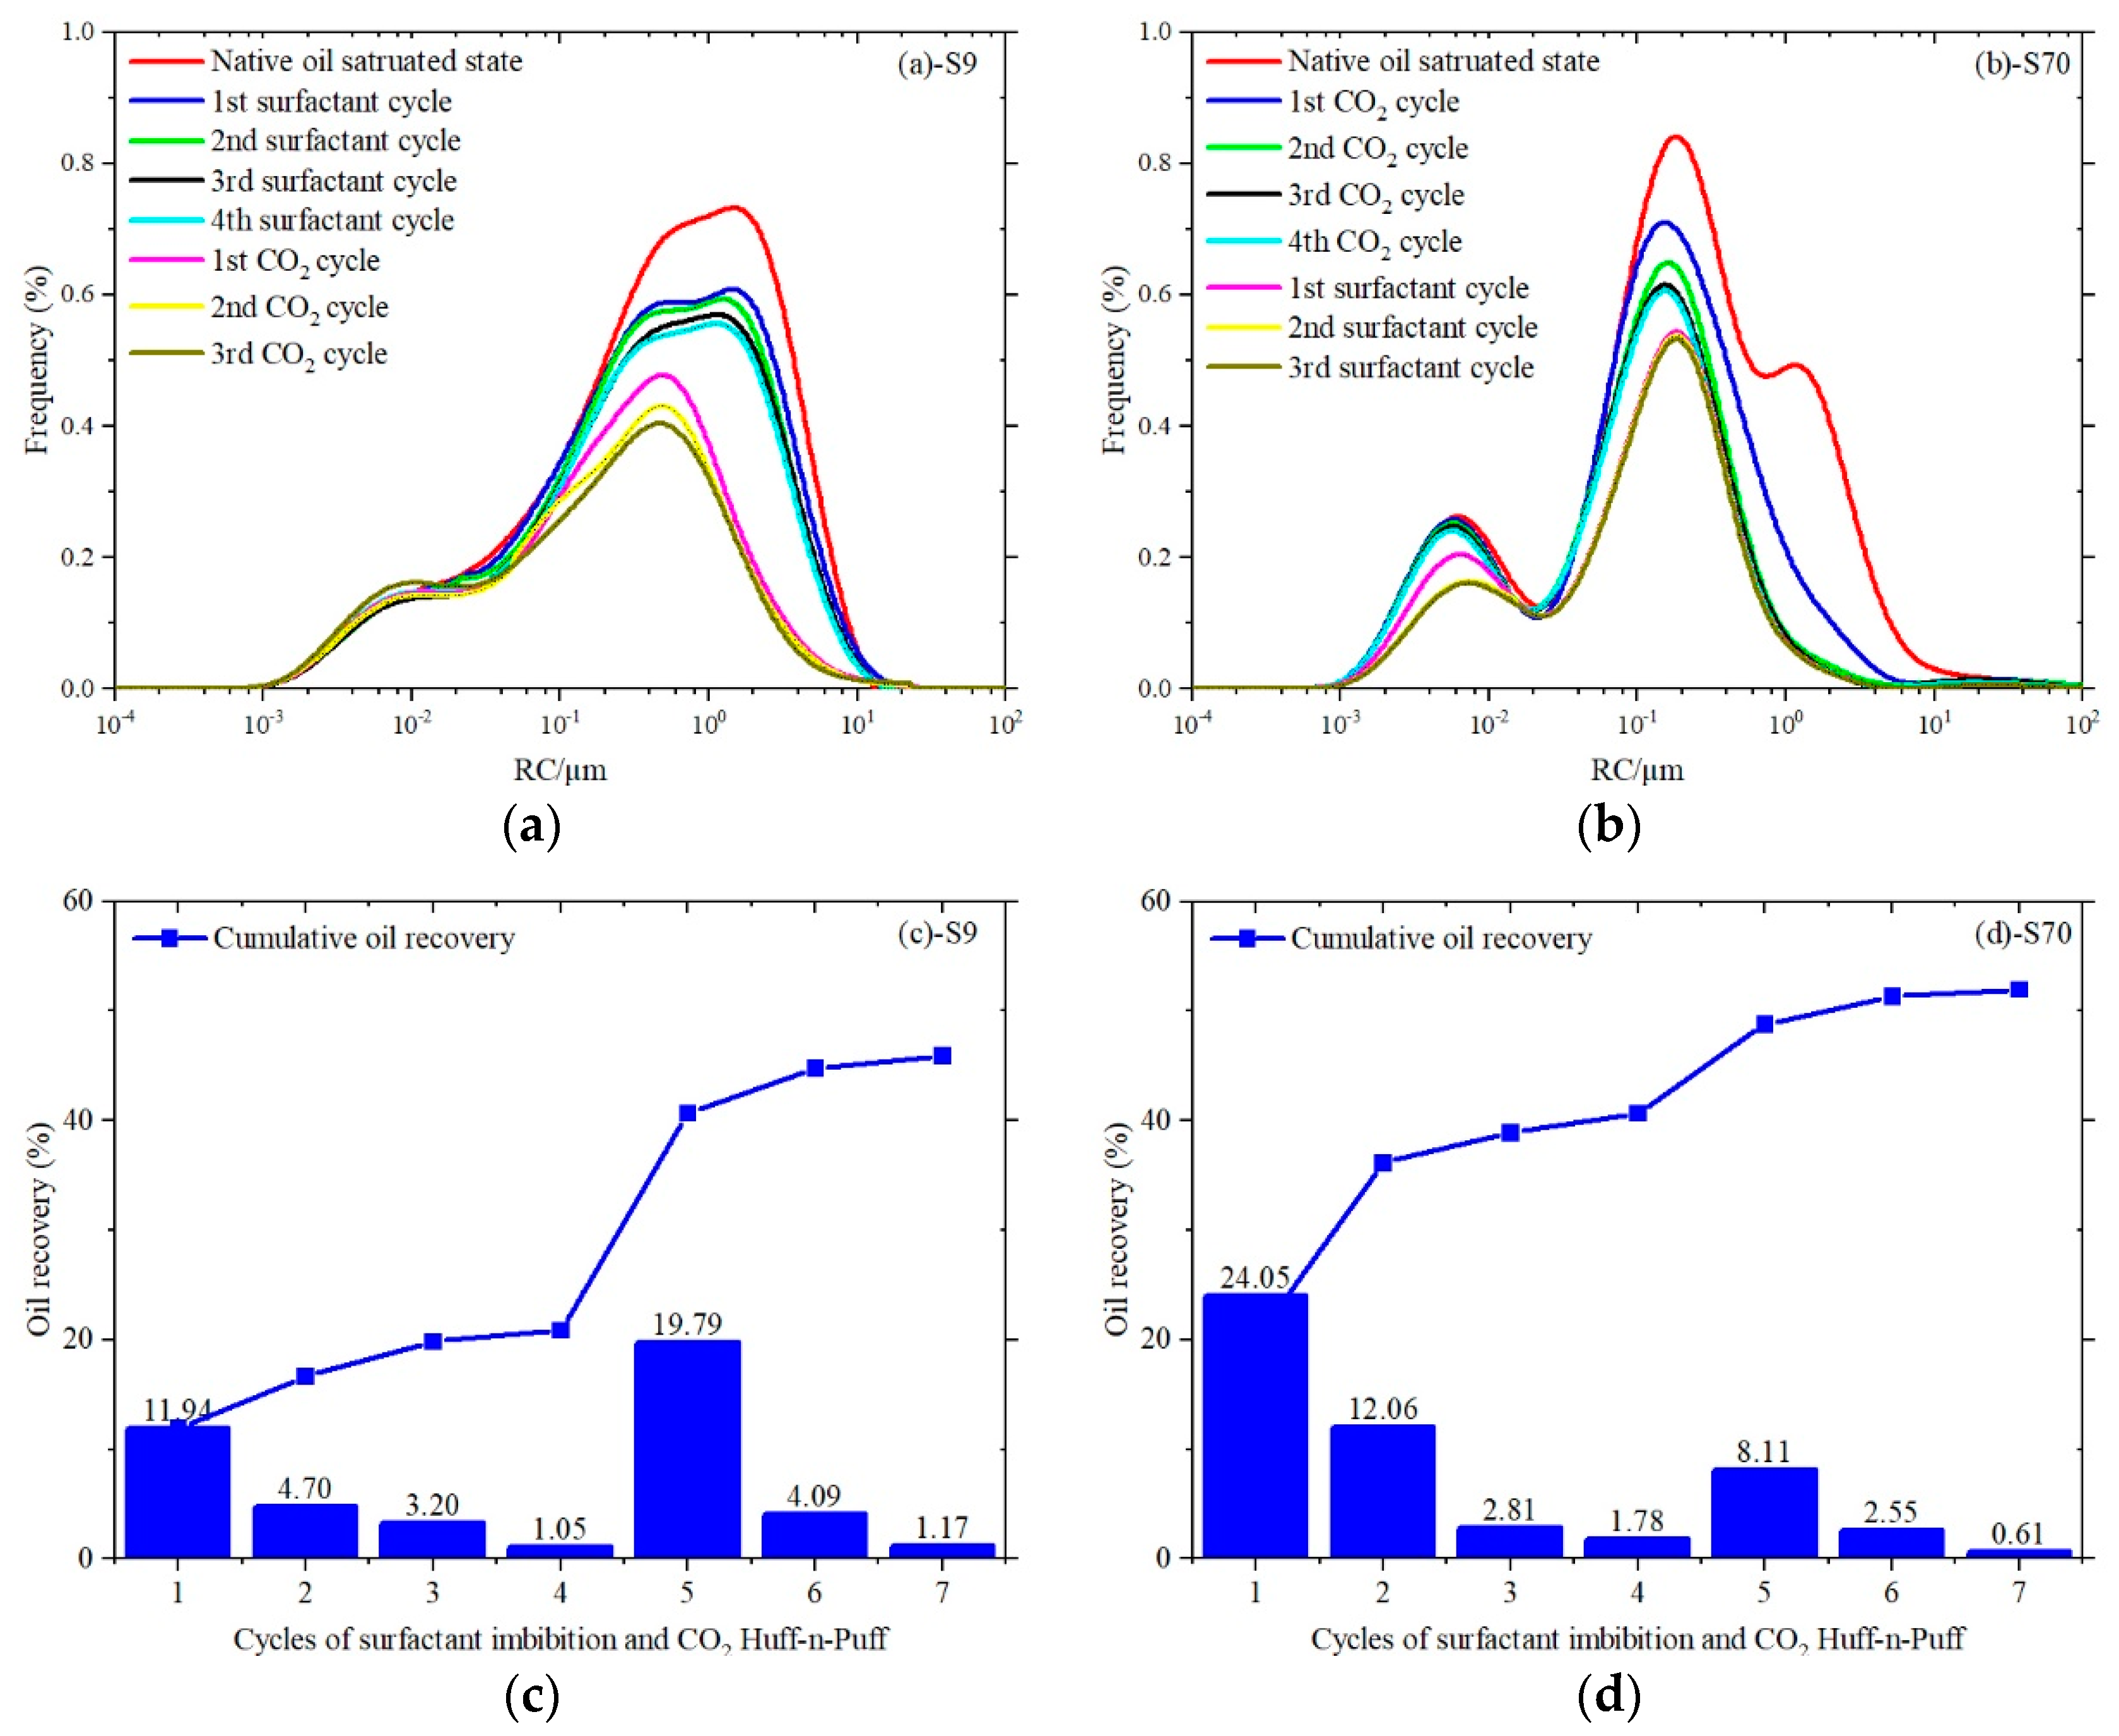
After four stages of CO2 huff-n-puff for S70, three more cycles of surfactant imbibition were conducted. And for S9, three more cycles of CO2 huff-n-puff were conducted.

3. Results and Discussion

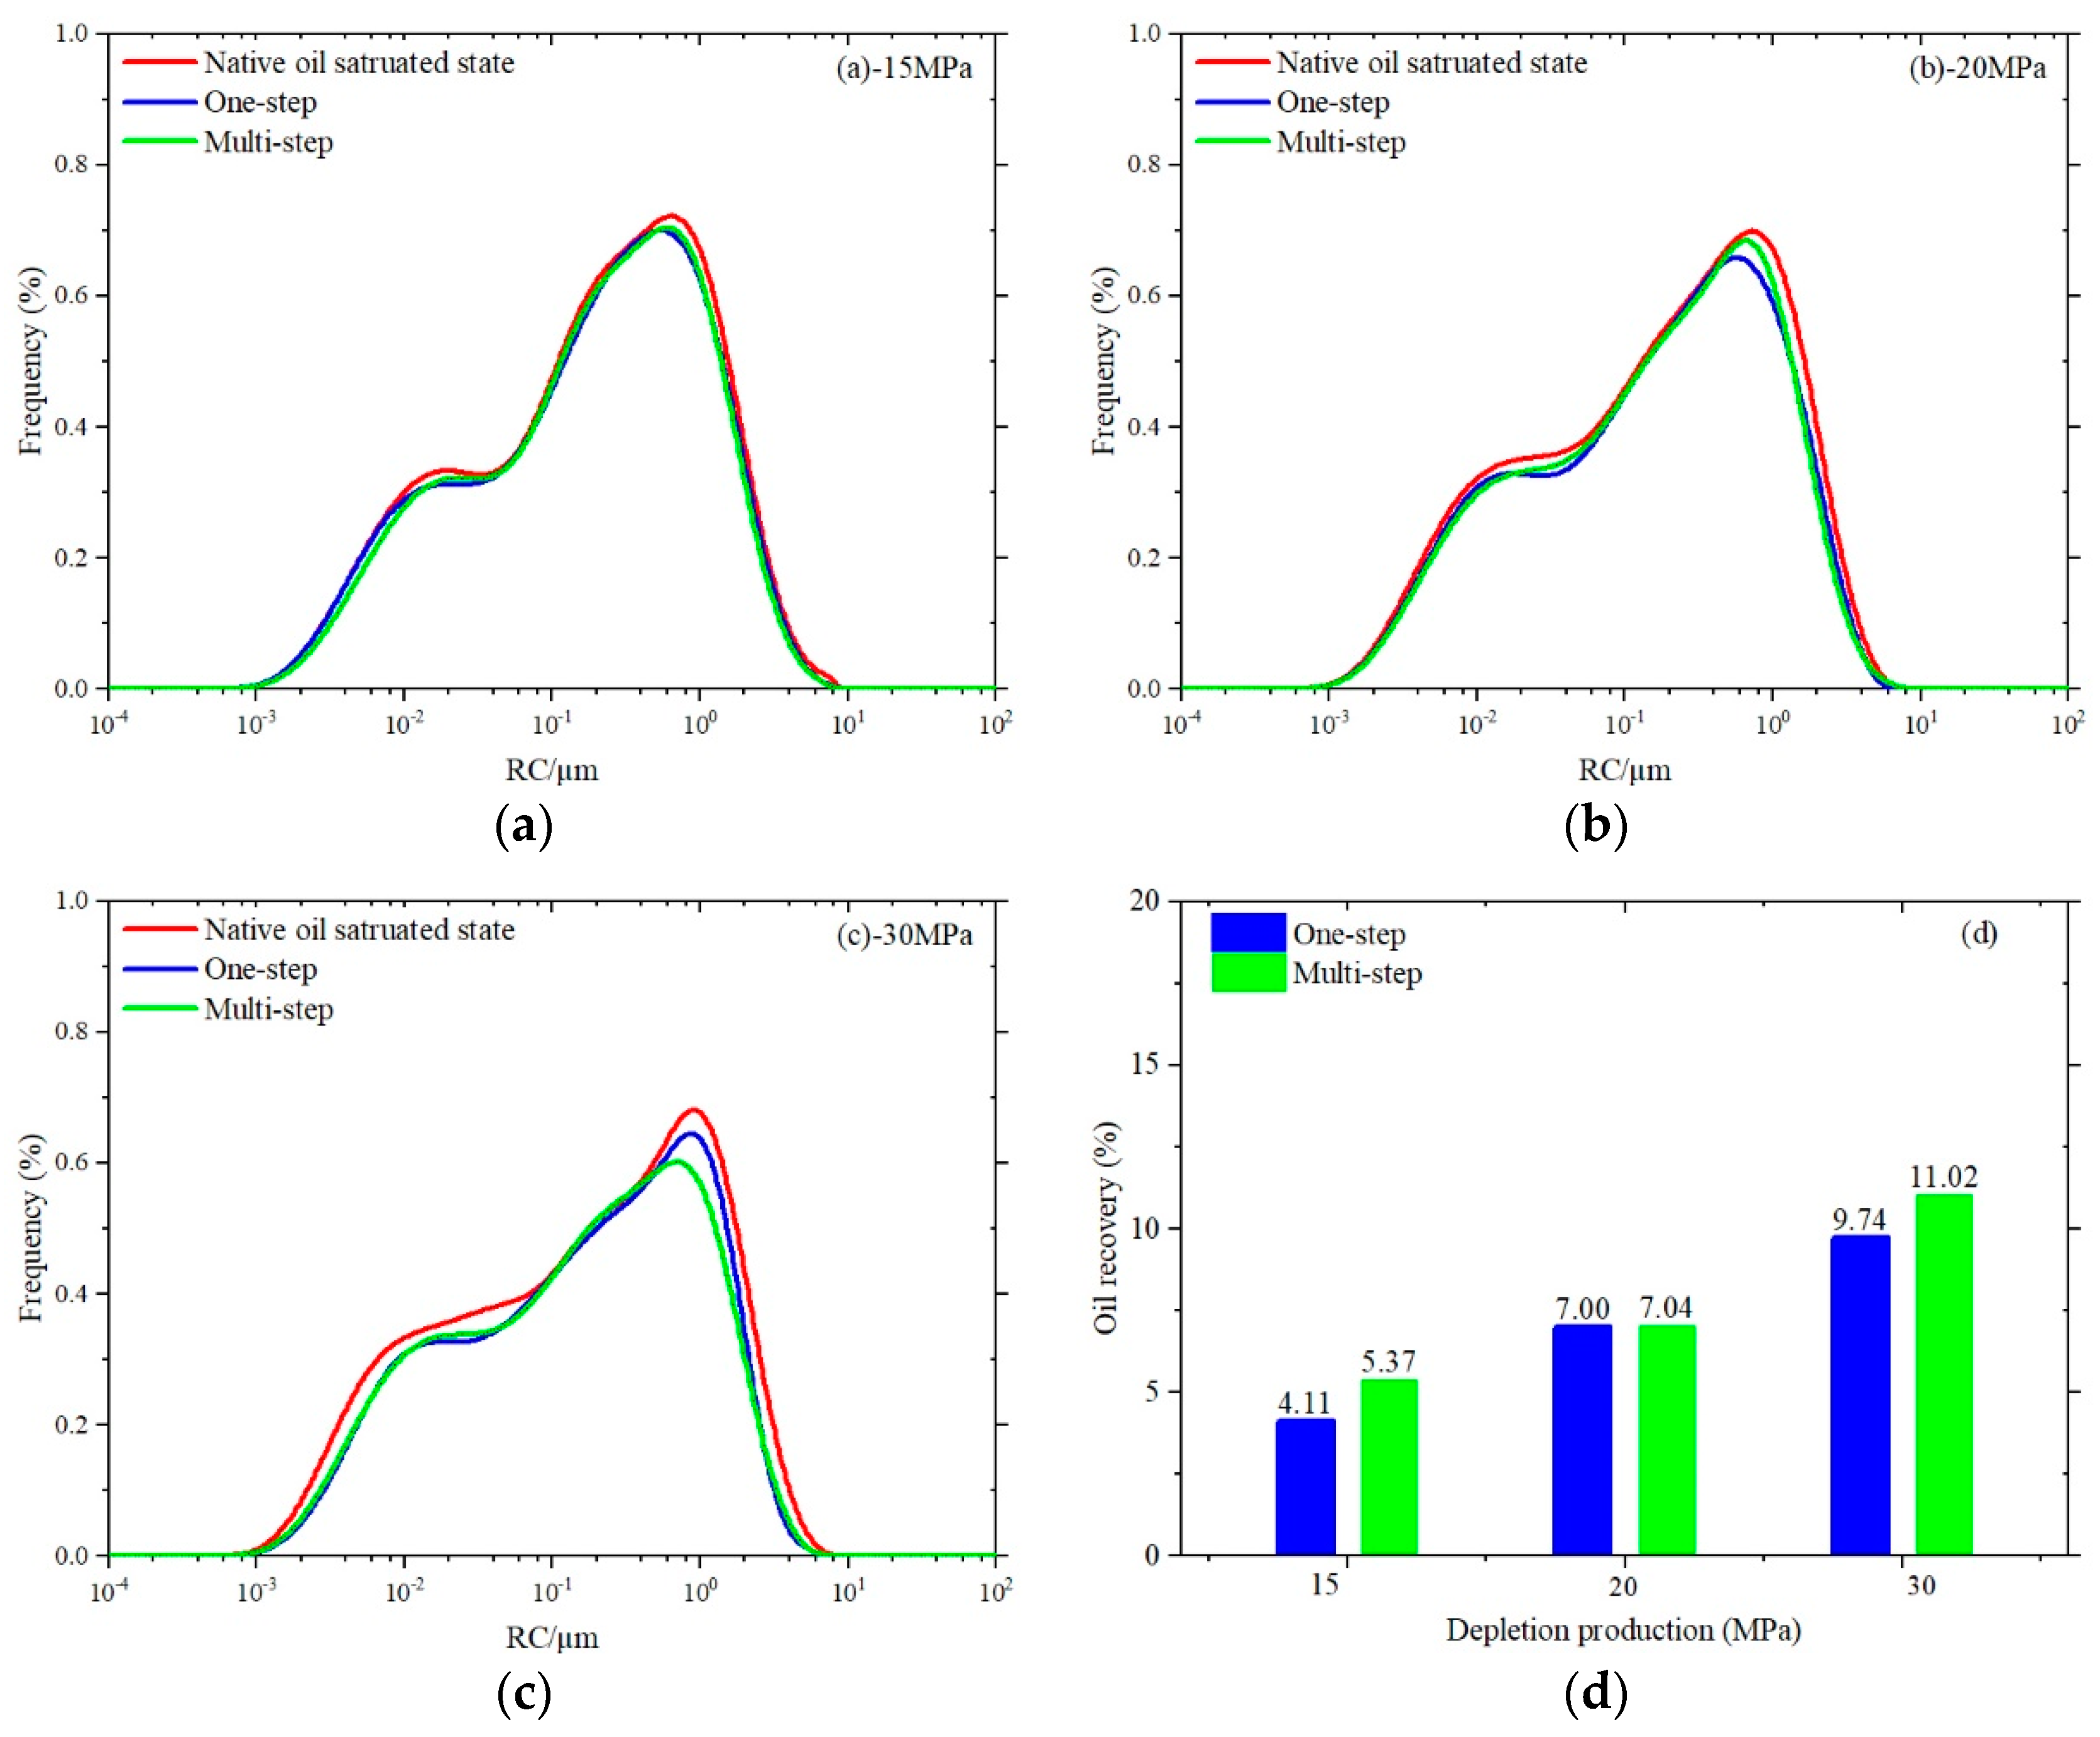
3.1. Performance of One-Step and Multi-Step Depletion

The rational use of elastic energy plays an important role in high development for shale oil reservoirs. In the absence of sufficient energy supplementation, elastic energy is the main power source of shale oil seepage. Higher reservoir pressure will strengthen the seepage capacity of oil. During the depletion development, the one-step depletion development method that greatly reduces the bottom hole flowing pressure and the multi-step depletion development method that gradually reduces the bottom hole flowing pressure will affect the shale oil recovery and the lower limit of pore sizes. Figure 2 shows the oil recovery at different depletion production strategies. The ultimate oil recoveries for 15 MPa, 20 MPa, and 30 MPa one-step depletion production are 4.11%, 7.0%, and 9.74%, respectively. When the pressures are 15 and 20 MPa, the oil in the small pores is almost unaffected, and the recovered oil is mainly produced from the large pores. Until the pressure reaches 30 MPa, oil in each scale’s pores has obvious degrees of utilization. This indicates that shale oil in small pores begins to flow only when the depletion pressure reaches a high value. And the degree of oil change in the large hole is greater with the increase in pressure. Compared with one-step depletion production, multi-step depletion production significantly improved shale oil recovery. The ultimate oil recoveries for 15 MPa, 20 MPa, and 30 MPa multi-step depletion production are 5.37%, 7.04%, and 11.02%, respectively. The oil recovery rate at the same pressure is increased by 1.26%, 0.04%, and 1.28%, respectively. And the pressure required for oil to flow is lower. When the pressure is only 15 MPa, the oil in different scale pores slightly decreases. The extent of the decline is even more pronounced at 20 and 30 MPa. This suggests that it is important to maintain the high reservoir pressure for oil production.

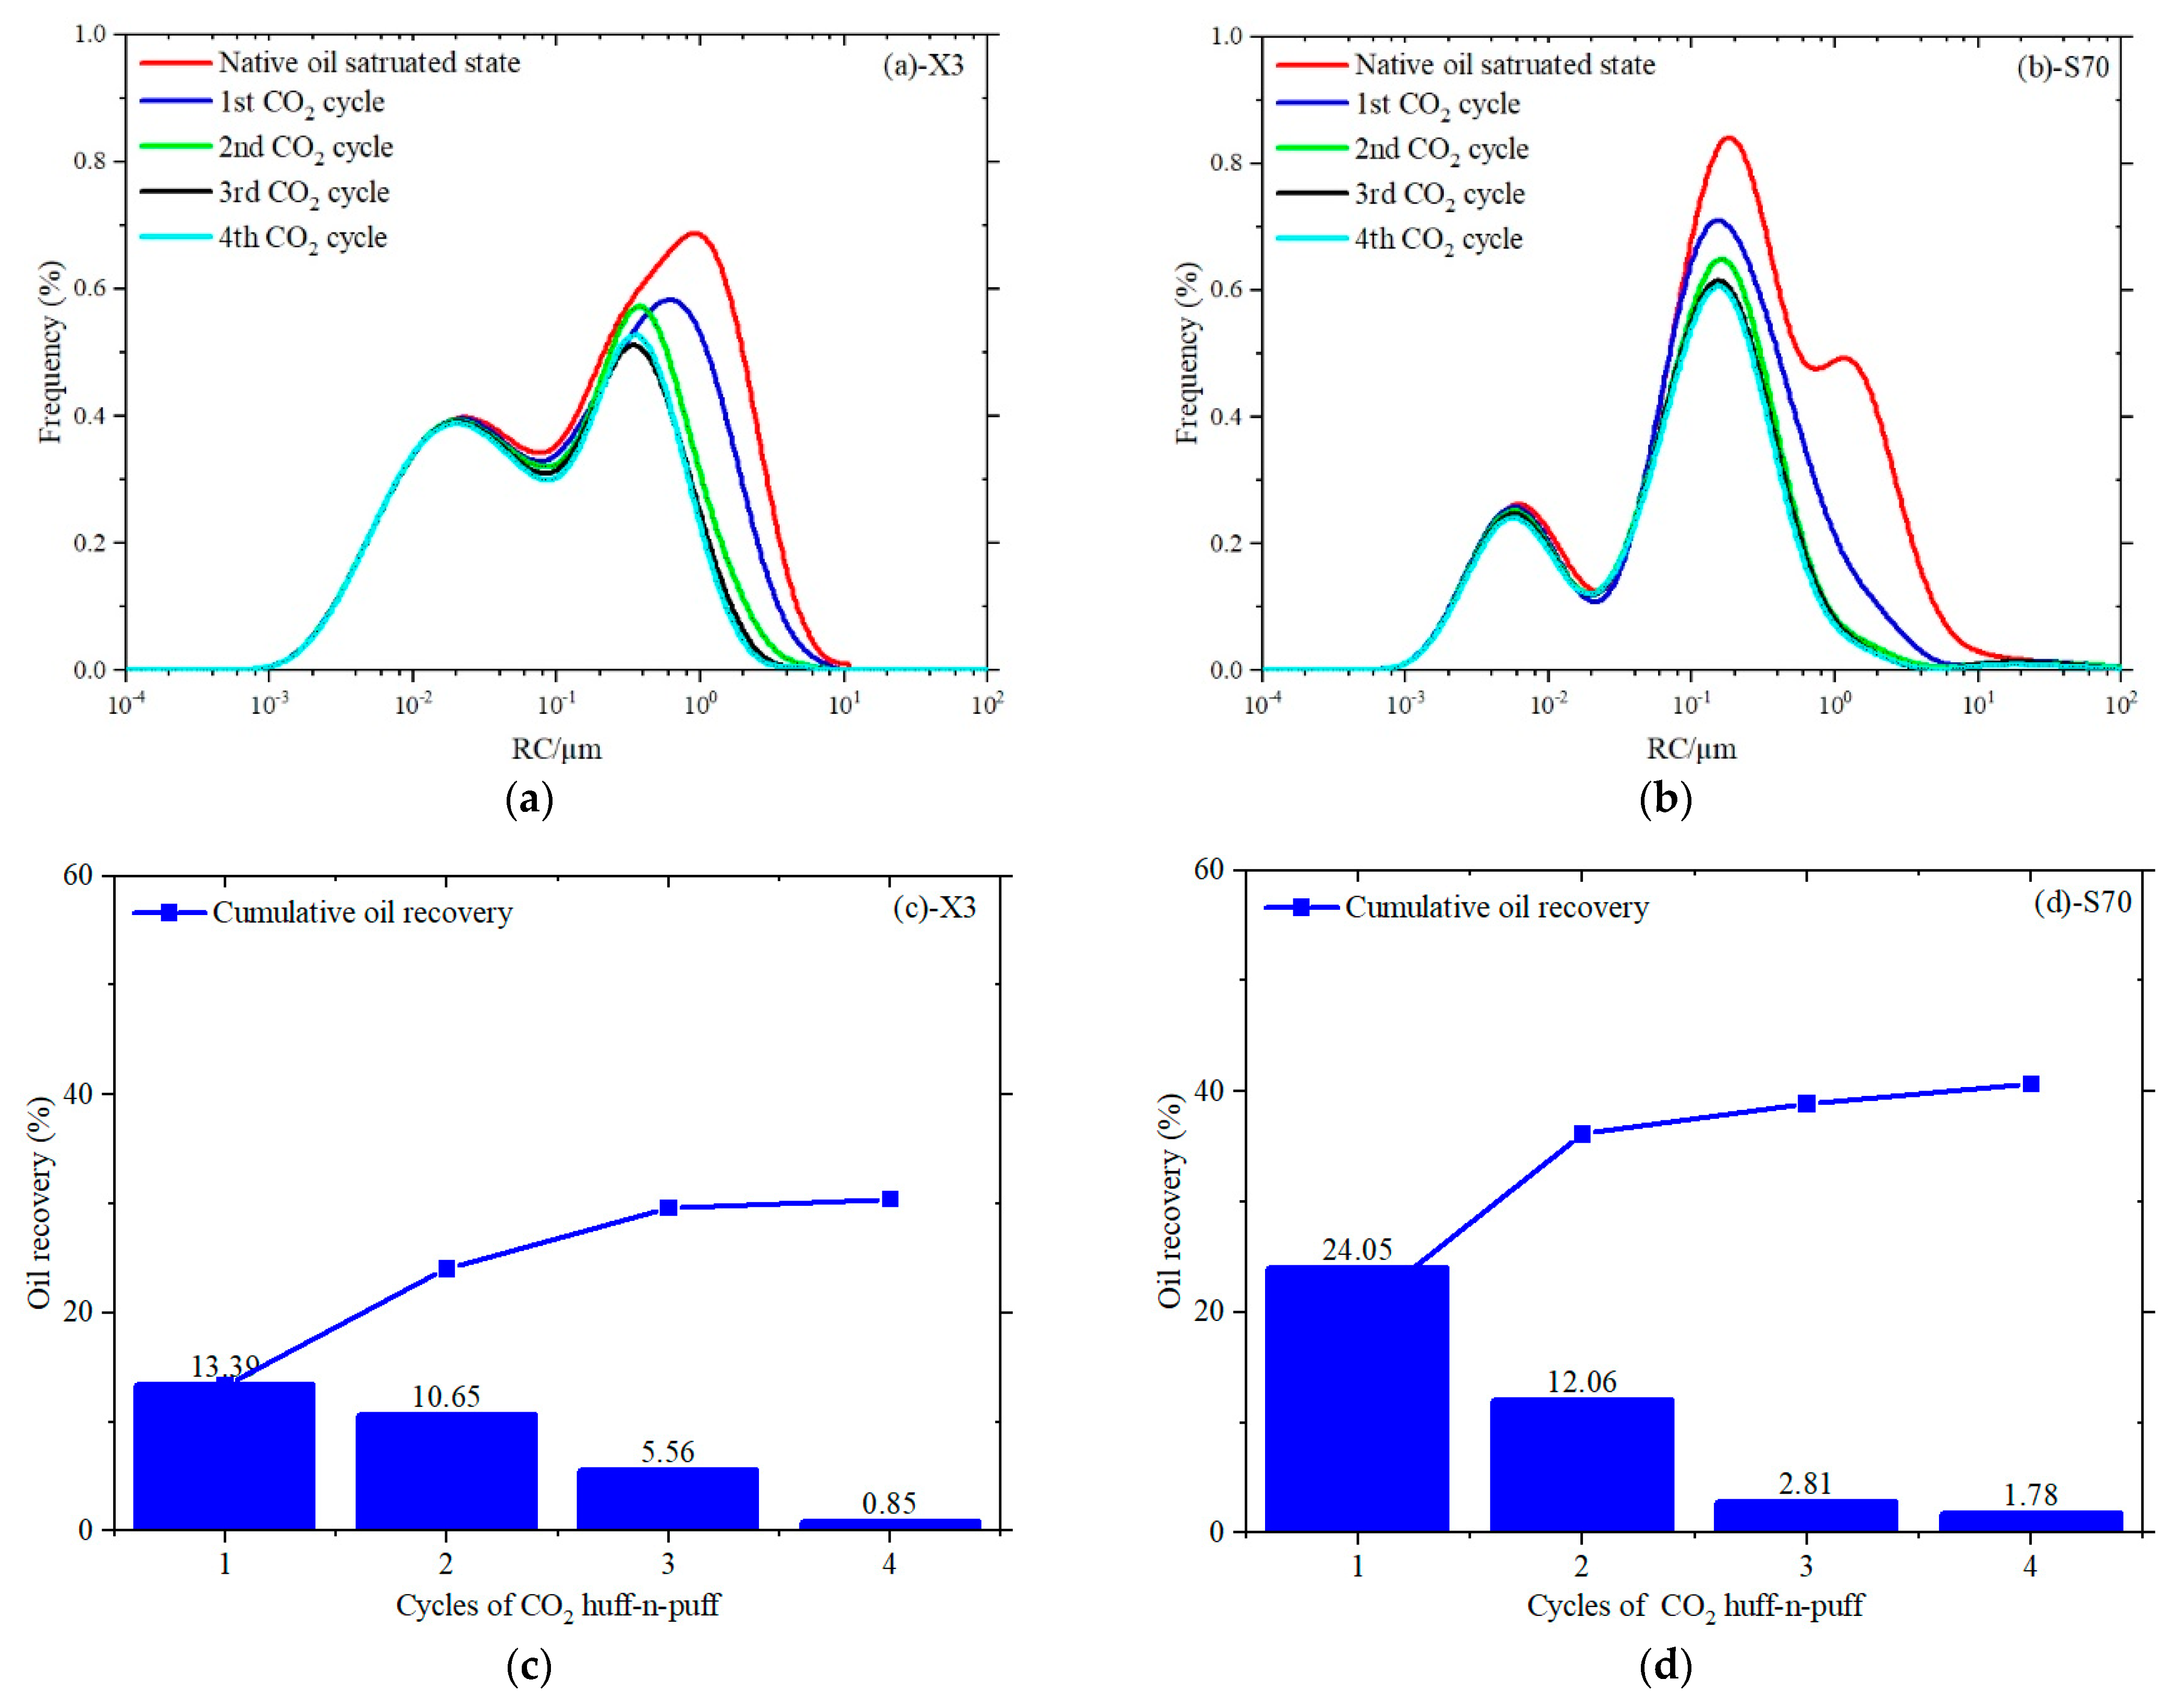
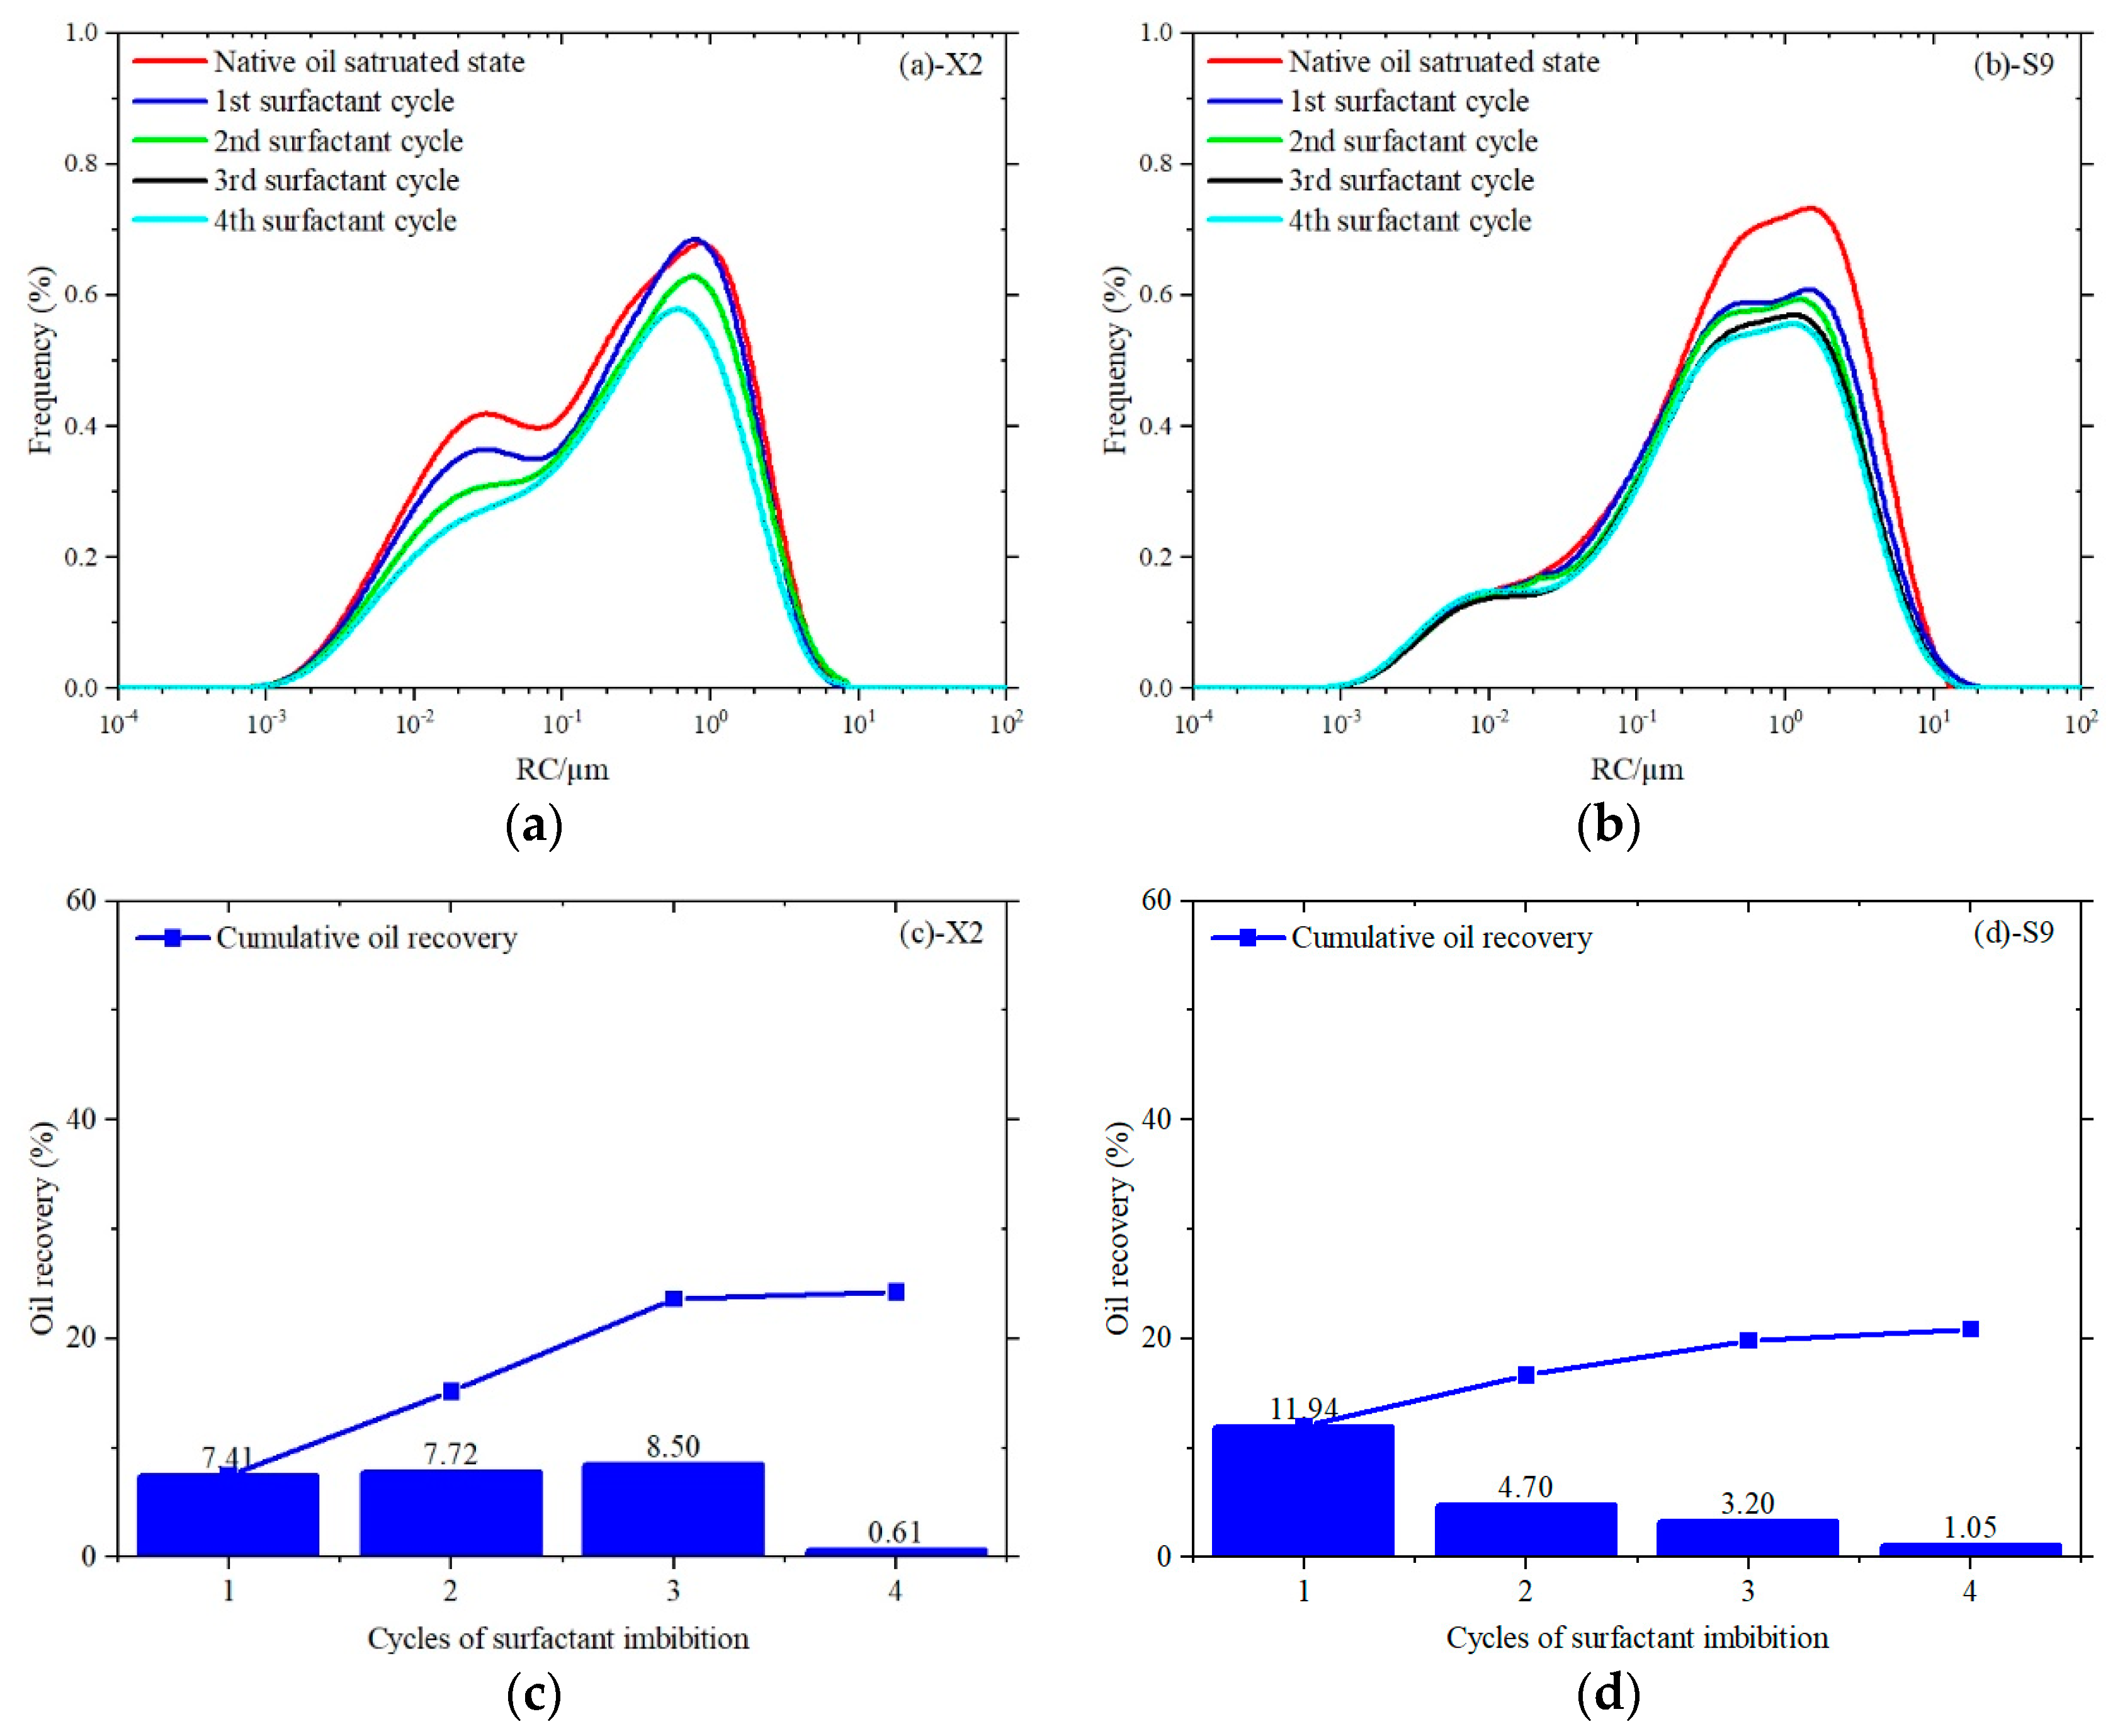
3.2. Performance of CO2 Huff-n-Puff and Surfactant Imbibition

CO2 is injected into the formation to maintain or recover the formation pressure. At the same time, when CO2 dissolves in crude oil, crude oil will be expanded and the viscosity of oil will decrease, thereby improving crude oil fluidity. Figure 3 shows the production performance of CO2 huff-n-puff in different cycles. The ultimate oil recoveries of X3 and S70 samples are 30.45% and 40.70%, respectively. With the increase in huff-n-puff cycles, the ultimate oil recovery also rises. However, only in the first two cycles, the cumulative oil recoveries significantly increase. The initial three cycles account for about 97% and 98% of the total. Beyond three cycles of CO2 huff-n-puff, the extra oil recoveries achieved through an increased number of huff-n-puff cycles amount to only 0.85% and 1.78%. This suggests that two or three cycles of CO2 huff-n-puff should be sufficient in shale oil reservoirs.
Although X3 and S70 samples have similar porosity and permeability, their ultimate oil recovery still differs by 10%, indicating that porosity and permeability are not the dominant factors. This circumstance could arise from the intricacies of pore structure, mineral composition, and other factors. Pore structure and TOC content in shale have an impact on the mobility of liquids due to the adsorption capacity [12], possibly causing this difference. The recovered oil from X3 and S70 samples is mainly produced from pores that are greater than 0.1 μm. Oil in the small pores is hardly produced. The S70 sample shows a triple peak, which means more large pores are developed, as shown in Figure 3. Therefore, pore size distribution plays an important role in CO2 huff-n-puff. It is important to conduct more experiments before the CO2 huff-n-puff pilot test.
AES anionic surfactant is used in this experiment, which has the ability to establish a monolayer on the rock surface via hydrophobic interactions with the lipophilic tails of the adsorbed crude oil components, resulting in a modification of wettability. Figure 4 shows the production performance of surfactant imbibition in different cycles. The ultimate oil recoveries of X2 and S9 samples are 24.24% and 20.89%. Unlike the CO2 huff-n-puff results, surfactants exhibit a broader range of pore sizes in production. The oil in different pores has a different degree of utilization with the different cycles of surfactant imbibition. The main reason is that the surfactant displaces the crude oil from small pores to large pores by imbibition during the soaking process, and then crude oil in large pores is extracted under the action of high−pressure difference during the flowback process. Greater oil production is obtained from the small pores. Like the CO2 huff-n-puff results, the initial three cycles account for about 97% and 95% of the total, which shows that only three cycles of surfactant should be enough.
The results indicate that the oil recovery of X2 sample is less than that of the S9 sample during the initial two cycles and is more than that of the S9 sample during the third and fourth surfactant cycles because more large pores are developed in the S9 sample due to the pore size distribution. After the first surfactant imbibition, oil in the large pores is mainly produced, showing higher oil recovery. However, the degree of oil recovery improvement decreases in later cycles. Small pores are mainly developed in the X2 sample due to the pore size distribution. Oil in the X2 sample can be obviously produced in each cycle. This result shows that more oil is easily produced from the large pores. As oil is produced from large pores, the degree of oil recovery improvement with cycles decreases. After the first surfactant cycle, the oil recovery improvement depends on small pores, as shown in Figure 4. Pore size distribution is also an important factor for surfactant imbibition. In addition, when the wettability of the reservoir is changed from oil−wet to water−wet by the interaction of surfactant, water can be easily imbibed into the pore space, resulting in oil expulsion. According to the wettability tests shown in Table 3, the degree of the change in wettability for different rock samples is different by the 0.2% AES surfactant solution. The ability of the surfactant plays a role in the performance of surfactant imbibition, which is carefully considered before experimental and field research.

3.3. Performance of Combination CO2 with Surfactant

The results of the first CO2 injection with those of the first surfactant injection are shown in Figure 5. The S9 sample was carried out by injecting surfactant solution first, and the S70 sample was conducted by injecting CO2 first. During the surfactant imbibition process for the S9 sample, the primary extraction of oil occurs predominantly from larger pores with 20.89% oil recovery. After three more cycles of CO2 huff-n-puff, the final oil recovery rate was 47.16%, which represents an increase of 26.27%. These results show that combining a surfactant with the CO2 huff-n-puff approach could represent a viable method for enhancing oil recovery. Similarly, for the S70 sample, although up to 40.7% oil has been produced during the CO2 huff-n-puff process, an additional 11.27% oil can still be extracted during the surfactant imbibition process. Throughout all experiments, CO2 huff-n-puff shows better potential for enhanced oil recovery than surfactant imbibition. After the fourth cycle of huff-n-puff, the difference in recovery between S9 and S70 is 19.81%. However, the difference in ultimate recovery is only 4.81% due to three more cycles of CO2 huff-n-puff in S9. Consequently, the effect of CO2 on a specific oil reservoir needs more attention when choosing a suitable huff-n-puff method. Surfactant imbibition after CO2 huff-n-puff is the greater IOR method for Lucaogou formation.

3.4. Contribution of Different Scale Pores

The shale samples were categorized into four types based on their pore sizes: P < 0.1 μm, 0.1 μm < P < 1 μm, 1 μm < P < 10 μm and P > 10 μm. Table 4 illustrates the contribution of varying pore sizes to oil recovery through different IOR methods. The total oil recovery of the samples involves summing up the recovery factors for different size ranges: P < 0.1 μm, 0.1 μm < P < 1 μm, 1 μm < P < 10 μm, and P > 10 μm. For the X3 sample, only 4% oil production is from pores less than 0.1 μm. The contribution of crude oil in the pores less than 0.1 μm to the oil recovery by CO2 huff-n-puff is very small: 0.1 μm is the lower−limit CO2 huff-n-puff. When compared to CO2 huff-n-puff, the surfactant has a wider production range of pore sizes. Surfactant imbibition for enhanced oil recovery extends beyond merely targeting large pores; it also effectively recovers the remaining oil in pores smaller than 0.1 μm. Especially for the X2 sample, over 47% oil production is from pores less than 0.1 μm. The effect of surfactant by spontaneous imbibition plays an important role in enhancing oil recovery, which can improve the lower limit of pore size. The lower limit of surfactant−assisted CO2 huff-n-puff is 0.05 μm. Although one-step and multi-step depletion have similar production ranges, the ultimate oil recovery is far less than other methods.

3.5. Sweep Area and Efficiency of CO2 and Surfactant

It has been noted that surfactant has a wider production range of pore sizes, and the oil in the pores less than 0.1 μm is recovered. However, the improved oil recovery of surfactant imbibition is not greater than that of CO2 huff-n-puff. This suggests that the efficiency of the two methods is different. The NMR images are shown in Figure 6 to explore the sweep area and efficiency of CO2 and surfactant at different cycles. The color signal in the images signifies the distribution of oil within the cores, with red areas indicating higher oil content. This can be employed to assess shale oil recovery by comparing saturated oil core images with images captured at various time points.
Figure 6a shows the changes in oil in the X3 sample at different cycles of CO2 huff-n-puff. It can be seen that the change in oil in the first stage is very clear, and a clear interface is found in the middle of the X3 sample. Oil in the upper part of the X3 sample was mainly produced in this cycle. The reason for this phenomenon may be the heterogeneity of the rock. CO2 has good miscibility with crude oil and can significantly reduce the viscosity of crude oil. In addition, it can greatly expand the volume of crude oil and increase the formation pressure. It means CO2 is only effective when it comes into contact with crude oil. CO2 is dissolved in crude oil through the slow diffusion of molecules. However, due to the heterogeneity, the upper part of the X3 sample has better seepage capacity than that of the lower part, meaning that the crude oil in the lower part cannot be effectively produced in a short time. Until the second stage, the change in oil in the whole X3 sample is obvious, showing higher efficiency. This suggests that CO2 huff-n-puff needs enough time to let CO2 diffuse into most pores or fractures. In the third and fourth cycles of CO2 huff-n-puff, this change is barely noticeable, and the interface disappears. This change in NMR images is consistent with the above. Two or three stages of CO2 huff-n-puff should be sufficient for shale formations.
Figure 6b shows the changes in oil in the X2 sample at different cycles of surfactant imbibition. The images show that the change in oil in the first stage is not obvious, and a clear interface is not found in the middle of the X2 sample. Oil in the whole X2 sample was partly produced. With the increase cycles, the produced oil increased but was limited. After the fourth cycle of surfactant imbibition, the X2 sample still retains a high oil saturation. Although the range of oil−water displacement is wide after surfactant injection, the effect of the flowback stage is limited.
Although both CO2 and surfactant can replenish elastic energy, due to the relatively low compressibility of the liquid, the elastic energy that can be released is relatively limited, and the release speed is also very rapid, resulting in limited recovery. CO2 has the advantage of maintaining formation pressure.

4. Conclusions

It is crucial to understand the complex IOR mechanisms and evaluate their potential in a specific oil reservoir. In this study, different IOR methods, including one-step and multi-step depletion production different initial pressures, CO2 huff-n-puff, surfactant imbibition, and combining CO2 with surfactant, were conducted to select the most suitable one for Lucaogou Formation in the Jimsar sag. Although the properties of rock samples used in this study are different from those in various regions of the world, the experimental methods, designs, and findings from this study can be considered. The primary discoveries from this research are outlined below:
(1)
The ultimate oil recoveries for 15 MPa, 20 MPa, and 30 MPa one-step depletion production are 4.11%, 7.0%, and 9.74%, respectively. And for multi-step depletion production, the oil recovery rate at the same pressure is increased by 1.26%, 0.04%, and 1.28%, respectively. Higher initial pressure shows higher oil recovery. And multi-step depletion production can improve the degree of oil utilization in different pores.
(2)
The ultimate oil recoveries of the X3 and S70 samples are 30.45% and 40.70% by CO2 huff-n-puff. Two or three cycles of CO2 injection should be sufficient for shale formations. Pore size distribution is an important factor for CO2 huff-n-puff. Oil in large pores is mainly produced. The ultimate oil recoveries of the X2 and S9 samples are 24.24% and 20.89% by surfactant imbibition. Pore size distribution is also an important factor for surfactant imbibition. And surfactant has a wider production range of pore sizes than CO2 huff-n-puff.
(3)
Combining the surfactant with the gas huff-n-puff approach can represent a viable method for enhancing oil recovery. After three more cycles of surfactant imbibition and CO2 huff-n-puff, the ultimate recovery rate can be increased by 11.27% and 26.27%, respectively. We should pay more attention to the effect of CO2 on a specific oil reservoir. Surfactant imbibition after CO2 huff-n-puff is the greater IOR.
(4)
The NMR imaging results show that the sweep area and efficiency of CO2 huff-n-puff are larger. Oil utilization is different in the first two cycles by CO2 huff-n-puff due to the heterogeneity. In the third and fourth cycles, the degree of oil utilization is barely noticeable. Oil in the whole X2 sample was partly produced by surfactant imbibition. The effect of the flowback stage is limited.

Author Contributions

Investigation, writing—original draft and data curation, Y.S.; resources, C.X.; writing—original draft preparation, H.W. and H.L.; writing—review and editing, C.H., J.Q. and B.W.; project administration, Y.L.; data curation, Z.S. All authors have read and agreed to the published version of the manuscript.

Funding

This research was funded by the Science Foundation Project of Sichuan Province (No. 2022NSFSC1048), Strategic Cooperation Technology Project of CNPC (ZLZX2020-01-08), and the Chengdu University of Technology 2023 Young and Middle-aged Backbone Teachers Development Funding Program (NO. 10912-SJGG2023-09121). The authors would also like to thank the reviewers and editors whose critical comments are very helpful in preparing this article.

Data Availability Statement

Data are contained within the article.

Acknowledgments

The authors wish to acknowledge the financial supports. We would like to express our appreciation to the other members of the laboratory for help provided in experiments and language editing.

Conflicts of Interest

The authors declare no conflict of interest.

Nomenclature

AESSodium Alcohol Ether Sulphate
BS−12Dodecyl dimethyl betaine
BS−18Octadecyl dimethyl betaine
DPS−2Dimethyldithioformamide propylsolfonic acid sodium
KPSKaramay petroleum sulfonate
OPAlkylphenol polyoxyethylene
IFTInterfacial tension
IORImproved oil recovery
MIPMercury intrusion porosimetry
NMRNuclear magnetic resonance
NEANational Energy Administration
TOCTotal organic carbon
F S Pore shape factor
m 0 Content of oil in the rocks
m Change of oil
η Oil recovery
ρ 2 surface relaxation rate (µm/ms)
rPore radius (µm)
S(T2)Function of the area of the T2 spectrum
S/Vsurface–volume ratio (µm−1)
T 2 S surface relaxation

References

  1. Energy Information Administration. U.S. Energy Facts—Energy Explained; 2019. Available online: https://www.eia.gov/energyexplained/?page=us_energy_home (accessed on 17 May 2019).
  2. Zhi, D.M.; Song, Y.; He, W.J.; Jia, X.Y.; Zhou, Y.; Huang, L.L. Geological Characteristics, Resource Potential and Exploration Direction of Shale Oil in Middle−Lower Permian, Junggar Basin. Xinjiang Pet. Geol. 2019, 40, 389–402. [Google Scholar]
  3. Ang Li, A.; Zhang, L.Y.; Yang, J.G.; Li, S.C.; Fei, X.; Yao, Y.L.; Huang, Y.M.; Liu, N. Study on Anisotropic Petrophysical Modeling of Shale: A Case Study of Shale Oil in Qingshankou Formation in Sanzhao Sag, Songliao Basin, China. Geofluids 2023, 2023, 6236986. [Google Scholar] [CrossRef]
  4. Hou, L.H.; Luo, X.; Lin, S.H.; Li, Y.X.; Zhang, L.J. Assessment of recoverable oil and gas resources by in−situ conversion of shale−Case study of extracting the Chang 73 shale in the Ordos Basin. Pet. Sci. 2022, 19, 441–458. [Google Scholar] [CrossRef]
  5. National Energy Administration. Ten Landmark Achievements in National Oil and Gas Exploration and Development in 2022. Available online: http://www.nea.gov.cn/2023−01/20/c_1310692197.htm (accessed on 20 January 2023).
  6. Toshev, S.; Rakhimov, B. Well production increased when drilling horizontal wells. J. Phys. Conf. Ser. 2022, 2388, 012171. [Google Scholar] [CrossRef]
  7. Liu, W.; Liu, H.; Wang, S.L.; Dong, K.X. A multi−fracture balanced extension control method for horizontal wells in anisotropic shale. Eng. Fract. Mech. 2023, 281, 109102. [Google Scholar] [CrossRef]
  8. Zhang, Y.J.; Yan, L.; Ge, H.K.; Liu, S.; Zhou, D.S. Experimental Study on Connection Characteristics of Rough Fractures Induced by Multi−Stage Hydraulic Fracturing in Tight Reservoirs. Energies 2022, 15, 2377. [Google Scholar] [CrossRef]
  9. U.S. Energy Information Administration. Drilling Productivity Report. Available online: https://www.eia.gov/petroleum/drilling (accessed on 16 August 2021).
  10. Hawthorne, S.B.; Gorecki, C.D.; Sorensen, J.A.; Steadman, E.N.; Harju, J.A.; Melzer, S. Hydrocarbon Mobilization Mechanisms from Upper, Middle, and Lower Bakken Reservoir Rocks Exposed to CO2. In SPE Unconventional Resources Conference Canada; OnePetro: Richardson, TX, USA, 2013. [Google Scholar] [CrossRef]
  11. Malozyomov, B.V.; Martyushev, N.V.; Kukartsev, V.V. Overview of Methods for Enhanced Oil Recovery from Conventional and Unconventional Reservoirs. Energies 2023, 16, 4907. [Google Scholar] [CrossRef]
  12. Tian, H.; He, K.; Huangfu, Y.H.; Liao, F.R.; Wang, X.M.; Zhang, S.C. Oil content and mobility in a shale reservoir in Songliao Basin, Northeast China: Insights from combined solvent extraction and NMR methods. Fuel 2024, 357, 129678. [Google Scholar] [CrossRef]
  13. Zhu, D.; Li, B.F.; Zheng, L.; Lei, W.S.; Li, B.L.; Li, Z.M. Effects of CO2 and surfactants on the interface characteristics and imbibition process in low−permeability heavy oil reservoirs. Colloids Surf. A Physicochem. Eng. Asp. 2023, 657, 130538. [Google Scholar] [CrossRef]
  14. Alfarge, D.; Wei, M.Z.; Bai, B.J. CO2-EOR mechanisms in huff-n-puff operations in shale oil reservoirs based on history matching results. Fuel 2018, 226, 112–120. [Google Scholar] [CrossRef]
  15. Alfarge, D.; Wei, M.; Bai, B. Factors affecting CO2−EOR in shale−oil reservoirs: Numerical simulation study and pilot tests. Energy Fuel 2017, 31, 8462–8480. [Google Scholar] [CrossRef]
  16. Wan, T.; Zhang, J.; Jing, Z.Y. Experimental evaluation of enhanced shale oil recovery in pore scale by CO2 in Jimusar reservoir. J. Pet. Sci. Eng. 2022, 208, 109730. [Google Scholar] [CrossRef]
  17. Ahmadi, M.A.; Pouladi, B.; Barghi, T. Numerical modeling of CO2 injection scenarios in petroleum reservoirs: Application to CO2 sequestration and EOR. J. Nat. Gas Sci. Eng. 2016, 30, 38–49. [Google Scholar] [CrossRef]
  18. Zhu, J.H.; Chen, J.B.; Wang, X.M.; Fan, L.Y.; Nie, X.R. Experimental Investigation on the Characteristic Mobilization and Remaining Oil Distribution under CO2 Huff-n-puff of Chang 7 Continental Shale Oil. Energies 2021, 14, 2782. [Google Scholar] [CrossRef]
  19. Li, L.; Wang, C.W.; Li, D.S. Experimental investigation of shale oil recovery from Qianjiang core samples by the CO2 huff-n-puff EOR method. RSC Adv. 2019, 9, 28857–28869. [Google Scholar] [CrossRef] [PubMed]
  20. Mahzari, P.; Oelkers, E.; Mitchell, T.; Jones, A. An Improved Understanding about CO2 EOR and CO2 Storage in Liquid−Rich Shale Reservoirs. In Proceedings of the 81st EAGE Conference and Exhibition, London, UK, 3–6 June 2019; SPE: Kuala Lumpur, Malaysia, 2019. [Google Scholar]
  21. Alharthy, N.; Teklu, T.; Kazemi, H.; Graves, R.; Hawthorne, S. Enhanced oil recovery in liquid–rich shale reservoirs: Laboratory to field. SPE Reserv. Eval. Eng. 2022, 21, 137–159. [Google Scholar] [CrossRef]
  22. Chico, S.; Liu, N.; Shaibu, R.; Ahmed, A. A Technical Review of CO2 for Enhanced Oil Recovery in Unconventional Oil Reservoirs. Geoenergy Sci. Eng. 2023, 221, 111185. [Google Scholar] [CrossRef]
  23. Sanchez−Rivera, D.; Mohanty, K.; Balhoff, M. Reservoir simulation and optimization of Huff−and−Puff operations in the Bakken Shale. Fuel 2015, 147, 82–94. [Google Scholar] [CrossRef]
  24. Abouzar, C.; Abbas, H.; David, A.W. Estimation of minimum miscibility pressure of varied gas compositions and reservoir crude oil over a wide range of conditions using an artificial neural network model. Adv. Geo Energy Res. 2019, 3, 52–66. [Google Scholar] [CrossRef]
  25. Altawati, F.; Sheng, J.; Emadi, H. Investigating Effects of Water on Shale Oil Formation by Using Cyclic Gas Injection Technique−An Experimental Study. In Proceedings of the 54th U.S. Rock Mechanics/Geomechanics Symposium, Golden, CO, USA, 28 June–1 July 2020. [Google Scholar]
  26. Zeng, T.Z.; Miller, C.S.; Mohanty, K.K. Combination of a chemical blend with CO2 huff-n-puff for enhanced oil recovery in oil shales. J. Pet. Sci. Eng. 2020, 194, 107546. [Google Scholar] [CrossRef]
  27. Gupta, I.; Rai, C.S.; Sondergeld, C.H. Impact of Surfactants on Hydrocarbon Mobility in Shales. SPE Reserv. Eval. Eng. 2020, 23, 1105–1117. [Google Scholar] [CrossRef]
  28. Alvarez, J.O.; Schechter, D.S. Altering wettability in Bakken shale by surfactant additives and potential of improving oil recovery during injection of completion fluids. In Proceedings of the SPE Improved Oil Recovery Conference, Tulsa, OK, USA, 11–13 April 2016. SPE−179688−MS. [Google Scholar] [CrossRef]
  29. Zhang, F.; Adel, L.A.; Park, K.H.; Saputra, I.W.R.; Schechter, D.S. Enhanced oil recovery in unconventional liquid reservoir using a combination of CO2 Huff-n-Puff and surfactant−assisted spontaneous imbibition. In Proceedings of the SPE Annual Technical Conference and Exhibition, Dallas, TX, USA, 24–26 September 2018. [Google Scholar]
  30. Li, B.F.; Zhang, Q.L.; Li, S.Y.; Li, Z.M. Enhanced heavy oil recovery via surfactant−assisted CO2 huff-n-puff processes. J. Pet. Sci. Eng. 2017, 159, 25–34. [Google Scholar] [CrossRef]
  31. Negin, C.; Ali, S.; Xie, Q. Most Common Surfactants Employed in Chemical Enhanced Oil Recovery. Petroleum 2016, 3, 197–211. [Google Scholar] [CrossRef]
  32. Zha, X.J.; Lai, F.Q.; Gao, X.B.; Gao, Y.; Jiang, N.; Luo, L. Characteristics and Genetic Mechanism of Pore Throat Structure of Shale Oil Reservoir in Saline Lake—A Case Study of Shale Oil of the Lucaogou Formation in Jimsar Sag, Junggar Basin. Energies 2021, 14, 8450. [Google Scholar] [CrossRef]
  33. Ding, X.J.; Qu, J.X.; Imin, A.; Zha, M.; Su, Y.; Jiang, Z.F. Organic matter origin and accumulation in tuffaceous shale of the lower Permian Lucaogou Formation, Jimsar Sag. J. Pet. Sci. Eng. 2019, 179, 696–706. [Google Scholar] [CrossRef]
  34. Meng, Z.Y.; Liu, Y.Q.; Jiao, X.; Ma, L.T.; Zhou, D.W.; Li, H. Petrological and organic geochemical characteristics of the Permian Lucaogou Formation in the Jimsar Sag, Junggar Basin, NW China: Implications on the relationship between hydrocarbon accumulation and volcanic−hydrothermal activities. J. Pet. Sci. Eng. 2022, 210, 110078. [Google Scholar] [CrossRef]
  35. Gao, Y.; Ye, Y.P.; He, J.X.; Qian, G.B.; Qin, J.H.; Li, Y.Y. Development practice of continental shale oil in Jimsar sag in the Junggar Basin. China Pet. Explor. 2020, 25, 133–141. [Google Scholar]
  36. Que, Z.; Lu, B.; Shi, Z.S.; Dong, D.Z.; Wang, H.Y.; Zhou, J. Residual accumulation and resource assessment of shale oil from the Permian Lucaogou Formation in Jimusar Sag. Nat. Gas Geosci. 2016, 27, 1817–1827. [Google Scholar]
  37. Yao, Z.H.; Qin, J.H.; Gao, Y.; Chen, C.; Liu, Z.P.; Zhang, X.G. Variations of Physical Properties of Shale Oil in Jimsar Sag, Junggar Basin. Xinjiang Pet. Geol. 2022, 43, 72–79. [Google Scholar]
  38. Shi, Y.; Wu, B.; Wang, H.; Li, Y.; Liu, Z.; Xu, C.; Qin, J.; Li, Y.; Song, Z.; Liu, H. Insights into CO2 huff-n-puff mechanisms from laboratory experiment and single-well pilot test in the Lucaogou tight oil reservoir, Jimsar sag, China. Geoenergy Sci. Eng. 2024, 232, 212456. [Google Scholar] [CrossRef]
Figure 1. NMR online displacement system.
Energies 16 08085 g001
Figure 2. The performance of shale oil under depletion production. (a) Comparison of 15 MPa one-step and multi-step depletion production. (b) Comparison of 20 MPa one-step and multi-step depletion production. (c) Comparison of 30 MPa one-step and multi-step depletion production. (d) Comparison of the oil recovery by one-step and multi-step depletion production at different initial pressures.
Energies 16 08085 g002
Figure 3. The performance of CO2 huff-n-puff. (a) X3 sample. (b) S70 sample. Oil recovery at different cycles. (c) X3 sample. (d) S70 sample.
Energies 16 08085 g003
Figure 4. The performance of surfactant imbibition. (a) X2 sample. (b) S9 sample. The cumulative oil recovery at different cycles. (c) X2 sample. (d) S9 sample.
Energies 16 08085 g004
Figure 5. The performance of varied injection sequences. (a) S9 sample. (b) S70 sample. The cumulative oil recovery at different cycles. (c) S9 sample. (d) S70 sample.
Energies 16 08085 g005
Figure 6. (a) The NMR images of oil saturated X3 sample at different CO2 huff-n-puff cycles. (b) The NMR images of oil saturated X2 sample at different surfactant imbibition cycles.
Energies 16 08085 g006
Table 1. List of core samples’ physical properties and purposes.
SampleLength
(cm)
Diameter
(cm)
Porosity
(%)
Permeability
(mD)
Experiment
X1a2.62.515.10.6515 MPa depletion
X1b2.42.515.00.6120 MPa depletion
X1c2.52.515.50.7330 MPa depletion
X32.62.515.20.68CO2 huff-n-puff
S702.62.516.80.67CO2 huff-n-puff + surfactant imbibition
X22.62.615.20.69surfactant imbibition
S92.52.512.80.12surfactant imbibition + CO2 huff-n-puff
Table 2. IFT tests of different surfactants.
NumberSurfactant TypeIFT
(mN/m)
NumberSurfactant TypeIFT
(mN/m)
10.1% OP2.408110.1% binary KPS1.081
20.2% OP0.500120.2% binary KPS0.674
30.1% AES0.788130.1% nonionic16.149
40.2% AES0.385140.2% nonionic12.501
50.1% BS-122.922150.1% anion0.345
60.2% BS-123.149160.2% anion0.549
70.1% BS-180.402170.1% BS-18 + 0.1% AES0.179
80.2% BS-180.420180.1% BS-18 + 0.05% AES0.045
90.1% DPS-20.361190.2% BS-18 + 0.1% AES0.287
100.2% DPS-20.403200.2% BS-18 + 0.05% AES0.281
Table 3. Wettability tests of number 4 (0.2% AES) and 9 (0.1% DPS-2).
SampleFormation Water0.2% AES0.1% DPS-2
Contact AngleWettabilityContact AngleWettabilityContact AngleWettability
163.9°water wet37.6°water wet34.1°water wet
245.7°water wet76.0°water wet107.8°oil wet
3115.0°oil wet52.7°water wet126.6°oil wet
4106.6°oil wet31.0°water wet160.6°oil wet
Table 4. Contribution of varying pore sizes to oil recovery through different IOR methods.
IOR MethodPore Size (μm)Ultimate Oil Recovery (%)Lower Limit
P < 0.10.1 < P < 11 < P < 10P > 10of Pore Size (μm)
One-step depletion (30 MPa)4.641.293.810.009.740.05
Multi-step depletion (30 MPa)2.923.164.930.0011.010.05
CO2 huff-n-puff (X3)1.4211.4817.530.0330.450.10
Surfactant imbibition (X2)11.596.715.940.0024.240.05
CO2 huff-n-puff + Surfactant imbibition (S70)3.0021.3915.940.9451.970.05
8.202.750.100.00
Surfactant imbibition + CO2 huff-n-puff (S9)1.727.7211.440.0147.160.05
0.1510.4715.600.05
Disclaimer/Publisher’s Note: The statements, opinions and data contained in all publications are solely those of the individual author(s) and contributor(s) and not of MDPI and/or the editor(s). MDPI and/or the editor(s) disclaim responsibility for any injury to people or property resulting from any ideas, methods, instructions or products referred to in the content.

