Article

Pressure Drop Characteristics of Subcooled Water in a Hypervapotron under High and Non-Uniform Heat Fluxes

1
School of Energy and Power Engineering, North China University of Water Resources and Electric Power, Zhengzhou 450045, China
2
School of Information Engineering, North China University of Water Resources and Electric Power, Zhengzhou 450045, China
3
State Key Laboratory of Eco-Hydraulics in Northwest Arid Region, Xi’an University of Technology, Xi’an 710048, China
*
Author to whom correspondence should be addressed.
Energies 2023, 16(24), 8121; https://doi.org/10.3390/en16248121
Submission received: 5 November 2023 / Revised: 13 December 2023 / Accepted: 15 December 2023 / Published: 18 December 2023
(This article belongs to the Section J: Thermal Management)

Abstract

:
To study the pressure drop characteristics of hypervapotron, which was designed as a water-cooling structure in the divertor dome of the fusion reactor, the pressure drop tests of subcooled water were carried out in a vertically upward hypervapotron. To simulate the one-side radiant heating condition in the engineering application, the non-uniform heat fluxes were obtained by using the off-center electrically heating method. The system parameters were as follows: mass flux G = 2000–5000 kg·m−2·s−1, inlet pressure p = 2–4 MPa, and equivalent one-side radiating heat flux qe = 0–5 MW·m−2. The effects of the parameters on the pressure drop were discussed in detail. It was observed that in the single-phase (SP) region, the pressure drop was little influenced by the inlet fluid temperature (Tb,in). However, in the subcooled boiling region, the pressure drop increased rapidly with the increasing Tb,in. A higher G leads to a high pressure drop. In the SP region, the influence of p on the pressure drop is not obvious, and the pressure drop decreased with the increasing qe. The test data are used to evaluate the typical pressure drop correlation, and the results show that none of these correlations can predict the pressure drop well under the test conditions. Therefore, a new pressure drop correlation is proposed for subcooled water in a hypervapotron under high and non-uniform heat fluxes. The new correlation has a high prediction accuracy for the test data, and the mean relative error (MRE) and root mean square error (RMSE) are 0.72% and 4.33%, respectively. The test results have a reference value for the design of the water-cooling structure of the diverter.

1. Introduction

Controlled nuclear fusion technology is one of the most promising ways to completely solve human energy problems. The International Thermonuclear Experimental Reactor (ITER) is the most famous tokamak device in the world. The hypervapotron was designed as the water-cooling structure for the dome of the ITER divertor, which is subjected to the impact of high-temperature plasma, the maximum unilateral radiant heat flux is 5 MW/m2. Under the condition of unilateral radiation heating, the inner wall of the side with higher heat flux is covered with a transverse ribbed sheet structure. In the high-speed flow, part of the fluid will briefly stay in the groove between the fins and be heated by the wall until gasification, and the bubbles formed will be carried away by the cooling water and condensed and disappeared. This heat transfer method is different from the common SP convection heat transfer or subcooled boiling heat transfer, and can delay the heat transfer deterioration and increase the critical heat flux (CHF) value. This ensures that the wall temperature of the dome does not exceed the maximum bearing value of the material under extremely high heat fluxes. Accordingly, the pressure drop characteristics of the fluid in the hypervapotron will become very complicated [1,2,3,4,5].
In previous studies on hypervapotrons, the main focus is on the onset of nucleate boiling (ONB), heat transfer enhancement [6,7], CHF [8], and fatigue life prediction [9,10], but the flow pressure drop is less studied.
Youchison et al. [11,12] conducted flow heat transfer tests on hypervapotron with different channel heights (3.4~7 mm) under conditions of pressure ranging from 0.5 to 7 MPa and inlet fluid temperature ranging from 20 to 230 °C. The pressure drop data are compared with the Baxi pressure drop correlation and the classical circular tube pressure drop correlation, and the results show that the test data are higher than the pressure drop curve in the circular tube, but lower than the pressure drop curve predicted by the Baxi correlation. In addition, the higher the height of the passage section, the closer the pressure drop coefficient is to that of the circular tube, and the smaller the height, the closer the pressure drop coefficient is to that of the Baxi correlation.
Escourbiac [13] tested two groups of typical hypervapotrons, and the test section was pulsed with a plasma beam with a heat flux of 25 MW·m−2 and a single heating cycle time of 10 s for 1000 cycles. The results show that the structure can withstand the heat flow of 25 MW·m−2 without heat transfer deterioration at the surface temperature of 1500 °C and without exceeding the allowable stress range of the material.
Falter [14] et al. measured the pressure drop characteristics of two hypervapotrons, in which the local pressure drop effect of the inlet and outlet section was excluded as far as possible. The size of the teeth in the two structures is the same, the width of the teeth is 3 mm, the height of the teeth is 4 mm, and the spacing of the teeth is 6 mm. However, in one type, the teeth contact the side wall directly, and in the other type, there is a groove between the teeth and the side wall. The results show that this form of sawtooth does not significantly increase pressure drop compared to smooth channels. In addition, the thermal stress results of the material show that the hypervapotron with the sawtooth directly in contact with the side wall has a longer life under the heat flux range of ITER.
Lim J H et al. [15] experimentally studied the ONB of a one-side heated hypervapotron channel under the conditions of a pressure of 0.1–1 MPa, a mass flow rate of 0.071–0.284 kg∙s−1, a heat flux of up to 10.7 MW∙m−2, and an inlet fluid temperature of 40–140 °C. The results show that the ONB heat flux of hypervapotron improve 186% compared with the flat channel. The vortex secondary flow induced by the fin structure played an important role.
The hypervapotron is a special structure, which is covered with grooves perpendicular to the flow direction on one side of the channel. A short stay of the fluid in the grooves will produce a large number of bubbles, which are carried away by the water flow to form subcooled boiling flow. On the other side of the channel is a flat surface, and the subcooled water is completely in a single-phase flow state. The pressure drop characteristics of the hypervapotron are determined by these two flow states, which are different from that of a single-phase flow and a subcooled boiling flow.
Both single-phase heated flow and subcooled boiling flow have been studied in depth, and many pressure drop correlations have been proposed. However, the correlation of flow pressure drop in hypervapotrons with high heat flux on one side has not been reported.
Baxi [16] compared the pressure drop characteristics and CHF of spiral tapes and hypervapotron, and summarized the previous pressure drop test results of hypervapotron. An adiabatic friction pressure drop empirical correlation was proposed as follows:
f HV = 0.613 R e 0.2
where fHV is the adiabatic friction pressure drop coefficient of the hypervapotron, and Re is the Reynolds number of the bulk fluid. The correlation is based on more diverse test data with a wide range of operating conditions, and has a certain reliability.
In experimental studies, high-energy electron beam gun radiation heating is commonly used, but this heating method has many disadvantages, such as high cost, a complex heating system, and low measurement accuracy of heat flux, and so on. In addition, there are many problems such as an incomplete flow and heat transfer mechanism, a complex phase transformation process, and a complex geometrical flow path. Therefore, more experimental research and new heating methods are still needed to study the pressure drop characteristics of the hypervapotron.
In this paper, the off-center electrically heating method was used to obtain the non-uniform high heat fluxes under unilateral radiation heating. The pressure drop characteristics of subcooled water in a heated hypervapotron are experimentally studied, the influence of system parameters on the flow pressure drop is analyzed, and a pressure drop correlation for the heated flow in the hypervapotron was proposed. The research results of this paper will help to further understand the pressure drop problem in hypervapotrons under non-uniform high heat flux, and also provide a certain engineering reference for the flow pressure drop problem of the water-cooled heat exchange structure of the diverter dome in ITER and other fusion reactors.

2. Experimental Descriptions

2.1. Test Loop

The tests on pressure drop characteristics of subcooled water in a hypervapotron were carried out with a high-pressure vapor-liquid two-phase flow test system. The schematic of the test loop is shown in Figure 1. The deionized water in the water tank was pumped into the pipelines via a plunger pump, the maximum operating pressure of which was 38 MPa. The water flowed through a filter to remove solid impurities. Then, part of the water flowed back into the tank via a bypass valve, and the rest part flowed into the tube side of the heat exchanger through the main valve and a mass flowmeter. After being heated by the high-temperature fluid in the shell side of heat exchanger, the water flowed into the preheater, and then entered the test section, where the pressure drop characteristics were investigated. Finally, the hot fluid flowing out the hypervapotron was set back to the water tank after it was cooled by a heat exchanger and condenser. Inside the blue pipes, flows either unheated fluid or fluid that has been heated and completely cooled. Flowing in the yellow pipes is the fluid that has been heated once or the fluid that has been cooled once after being fully heated. Flowing through the orange pipes is fluid that has been thoroughly heated and not cooled. The green pipes represent the cooling circuit.

2.2. Test Section

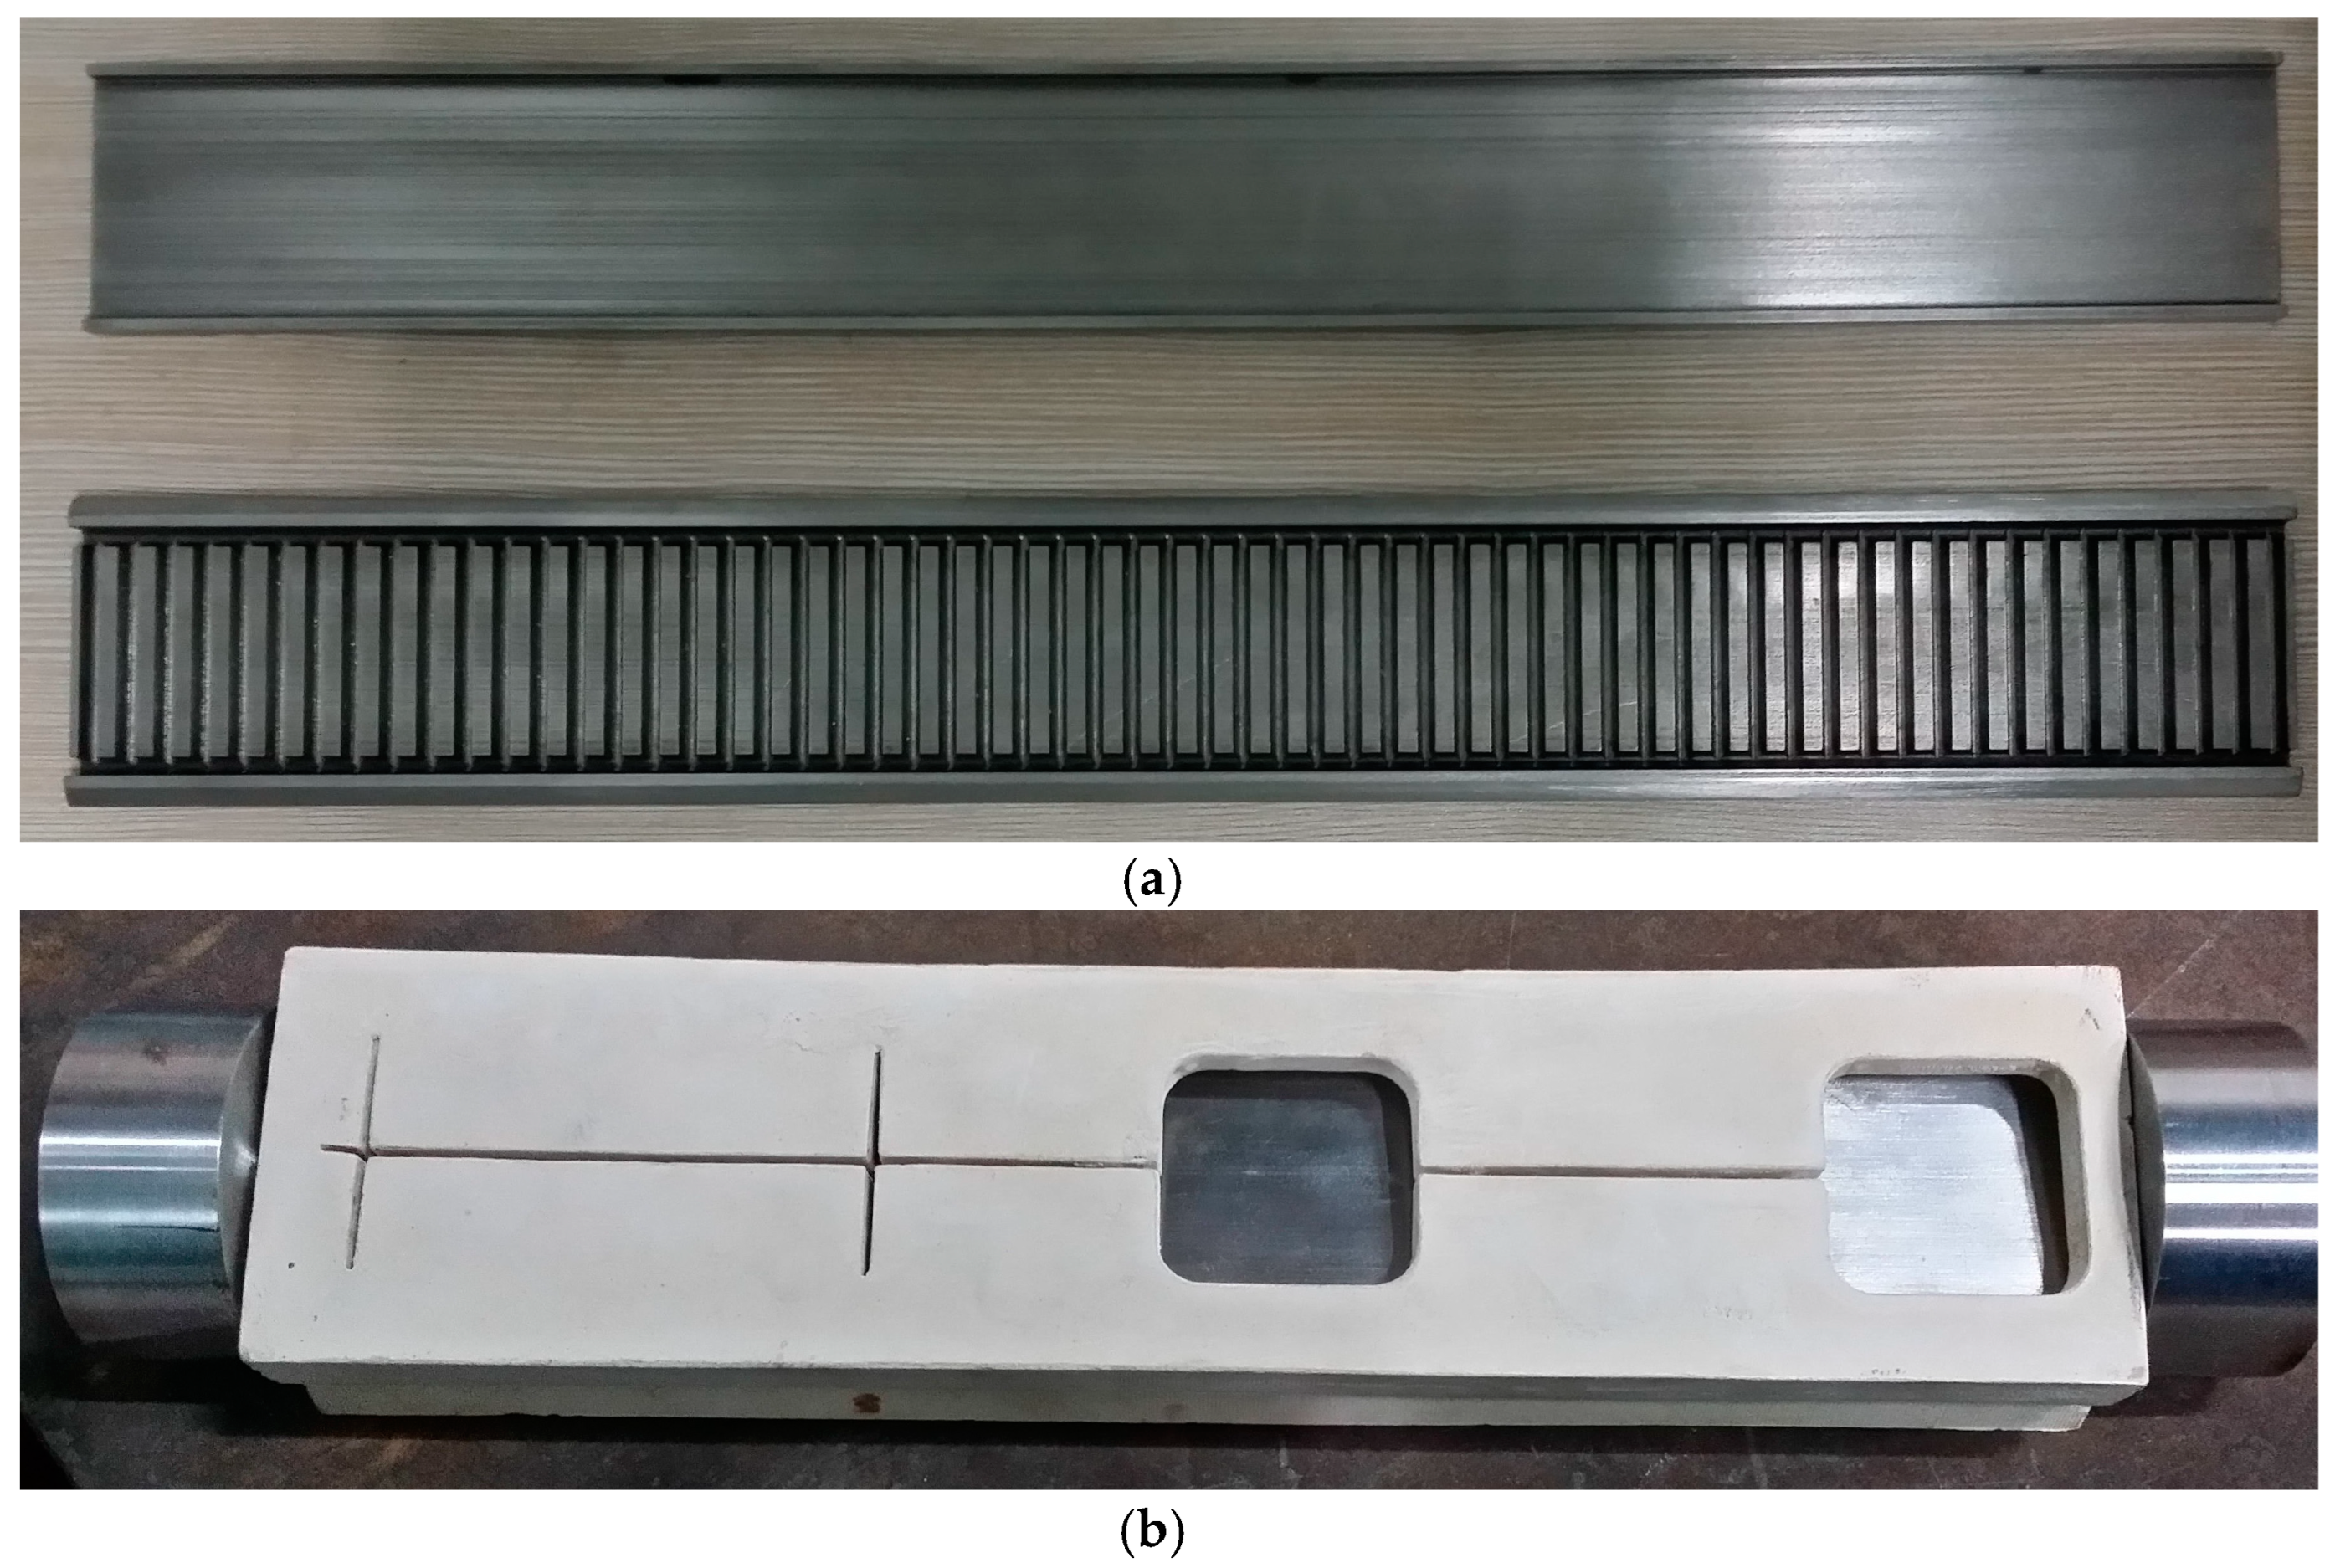
Figure 2 shows the photos of the test section, in which heated water flowed vertically upward through the hypervapotron channel. In traditional heating methods [17,18,19], such as using cartridge heaters or tubular electric heaters, it is difficult to assess the heat loss of the test section without thermal insulation foam, and a systematic error of the effective heating power would be generated by the thermocouples. Moreover, the accuracies of the heating power and wall temperature are also difficult to guarantee by using infrared cameras to measure the surface temperature fields of the hypervapotron. Therefore, an off-center heating method was used in the tests to simulate the unilateral radiant heating condition of the dome in the ITER divertor. The AC power supply with a maximum power of 250 kW is connected to the copper plate at both ends of the test section, and the effective heating length is 290 mm. The output voltage and current of the transformer can be adjusted in three levels: 25 V/10,000 A, 50 V/5000 A, and 100 V/2500 A. According to the calculation results of impedance matching, in this test, the transformer should select the gear 25 V/10,000 A.
Since the preset system pressure is p = 2.7–3.7 MPa, and the thin-wall side thickness of the hypervapotron is only 0.5 mm, they would inevitably be compressed and deformed without measures be taken. To this end, we add a 321 stainless steel shell to the outside of the test section and tighten it with bolts to prevent deformation. However, the insulating problem also should be solved. We designed an insulating structure made of a high aluminum ceramic material between the hypervapotron and the 321 stainless steel shell. The ceramic insulating structure and the 321 stainless steel shell are both provided with a slit and rectangular window, through which the thermocouple wires can be penetrated. If necessary, the high-temperature infrared thermometer can also be used to measure the thick-wall temperature of the hypervapotron through the rectangular window.
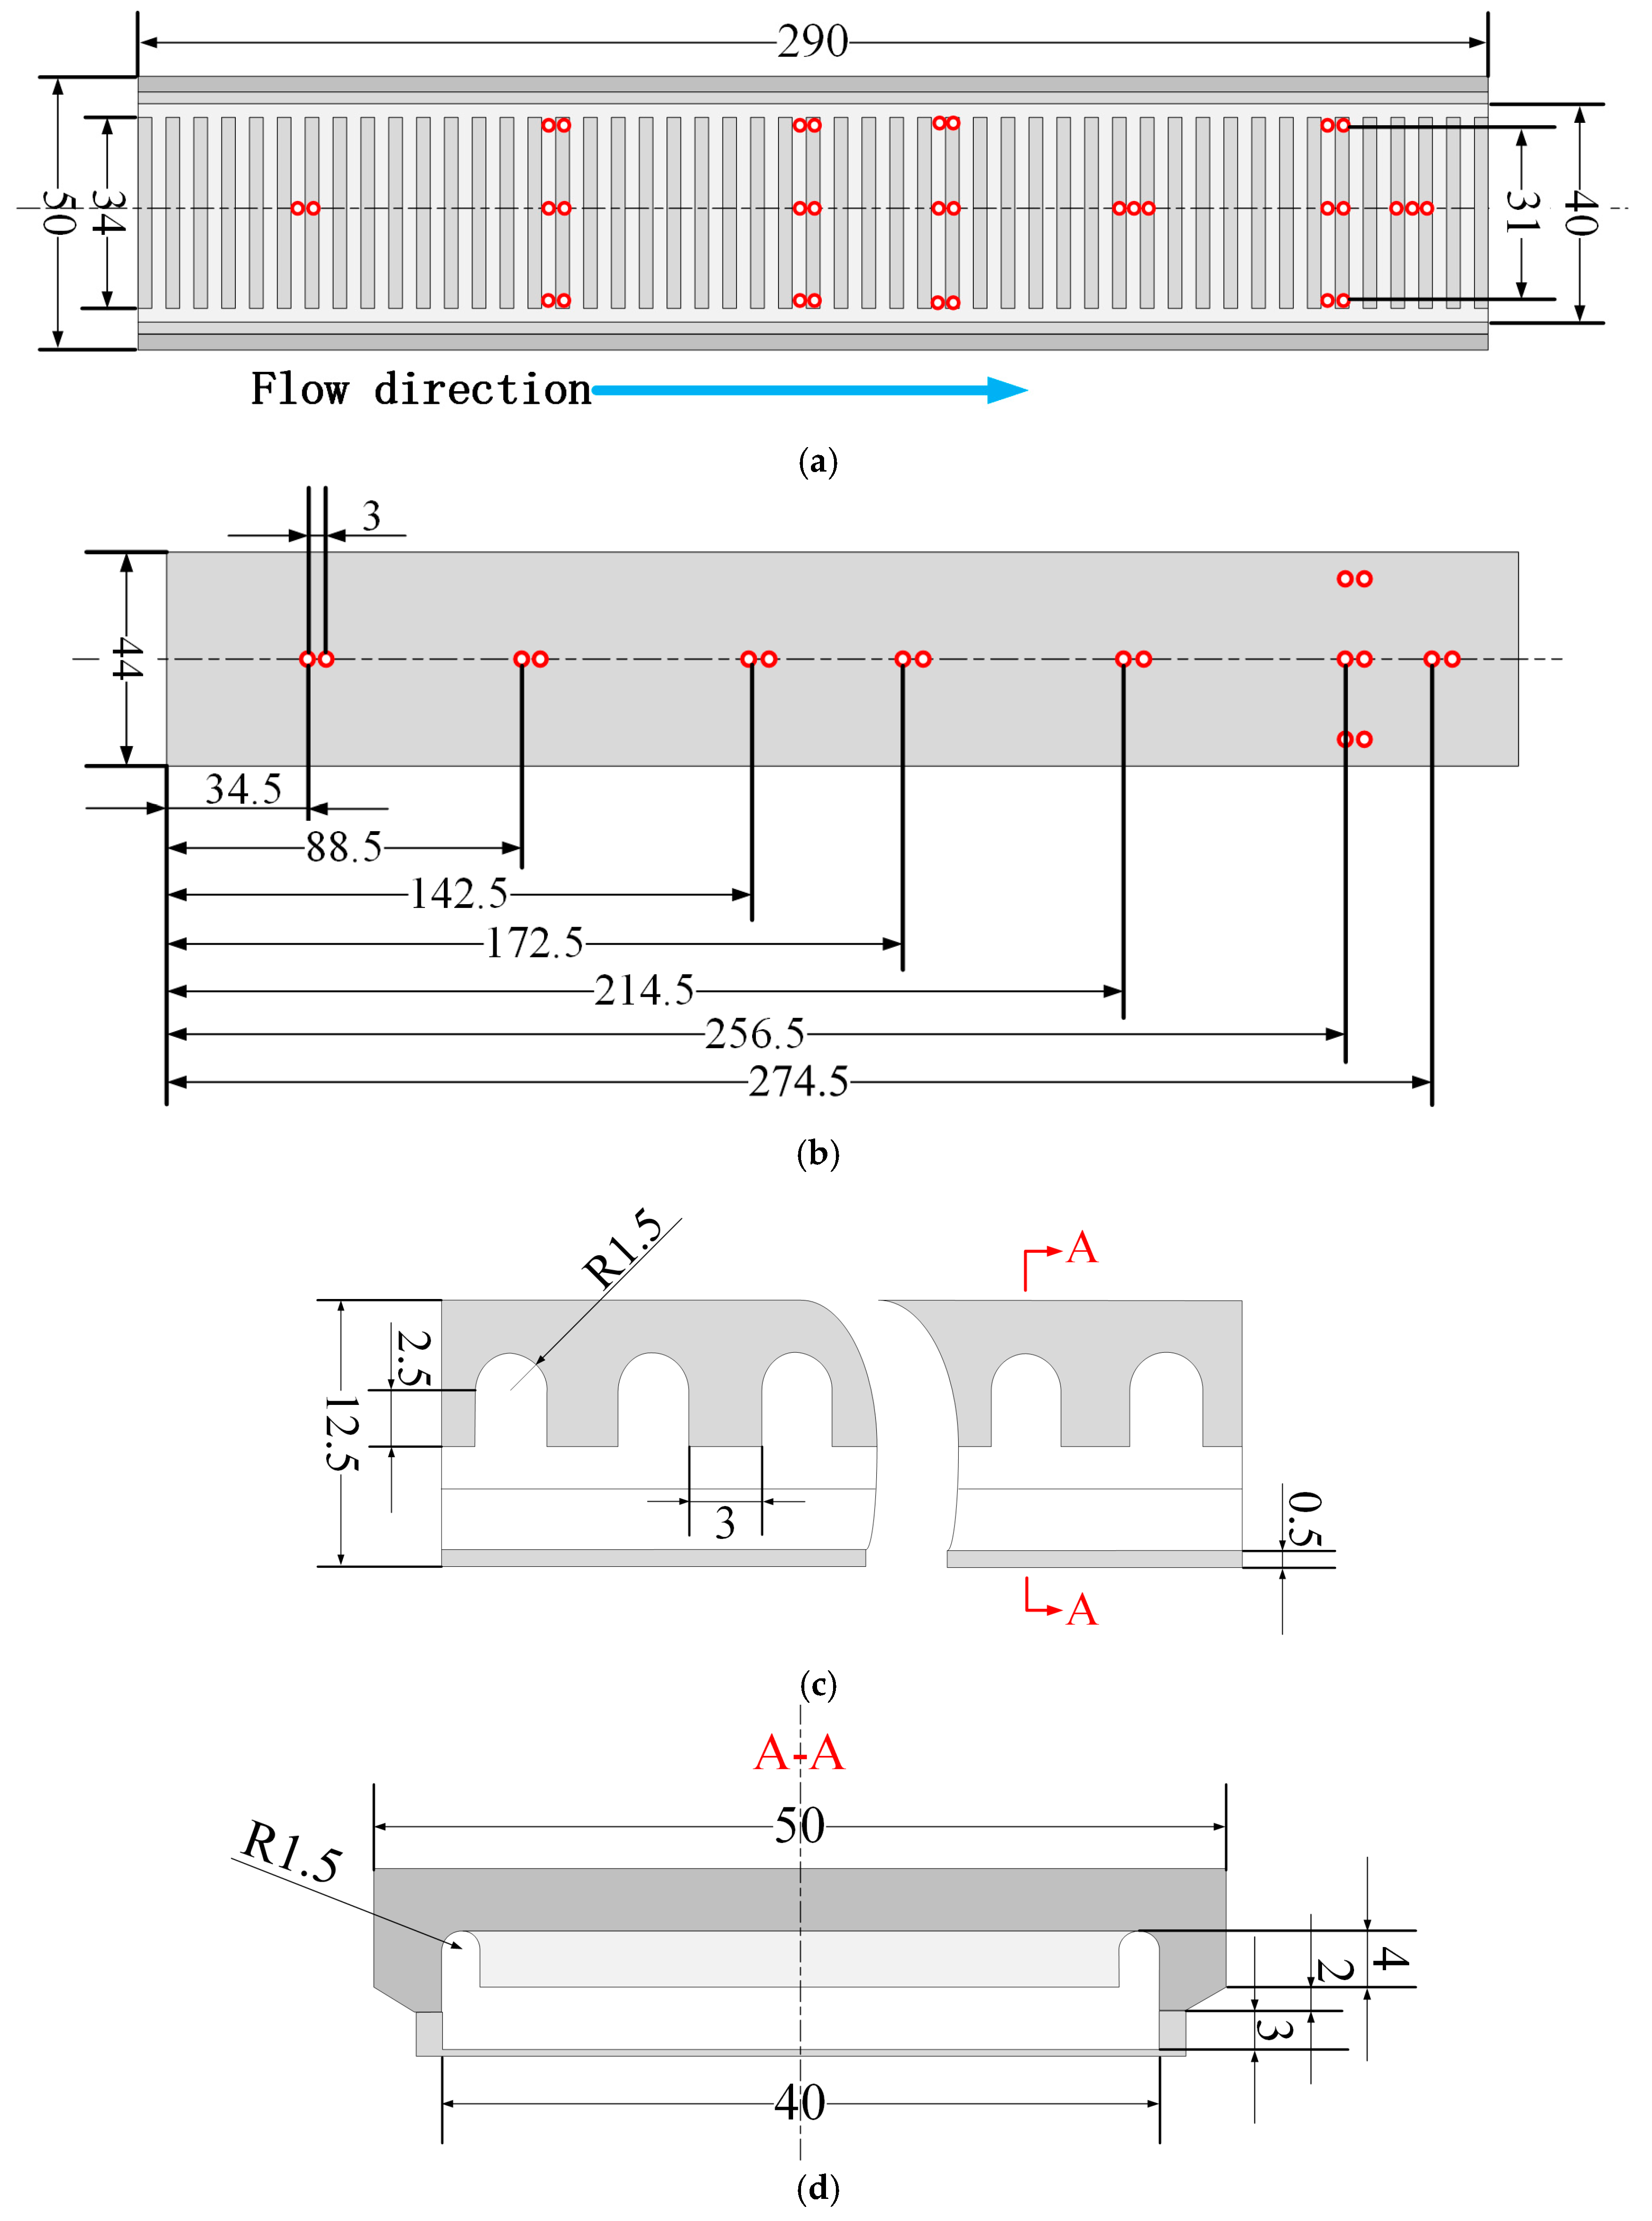
The geometric structure and dimension of the test section (made of 321 stainless steel) are shown in Figure 3. The outer wall temperature (Two) was measured by a φ0.2 mm nickel-chromium-nickel-silicon thermocouple, and the positions of 51 temperature measurement points were marked by red circles. The inlet and outlet fluid temperature (Tin, Tout) of the test section was measured by T-sheathed thermocouples, the mass flux (G) was measured by a Coriolis mass flowmeter, the inlet pressure (p) and the inlet and outlet pressure difference (∆pmea) were measured by a Rosemount 3051 pressure sensor and differential pressure sensor, respectively. All measurement signals are collected by the IMP3595 distributed acquisition system.

2.3. Experimental Conditions

The pressure drop tests were conducted over a wide parameter variation range. Table 1 shows the experimental conditions.

2.4. Data Reduction

In the tests, the calculated parameters were obtained from the original measured data by using the following equations, through which the experimental results would be analyzed more easily. All fluid properties are evaluated from the NIST table [20] for the bulk temperature unless otherwise indicated.
In the investigations of fusion reactor engineering, researchers paid more attention to the total flow pressure drop of the cooling structure, but paid less attention to the specific distribution of the pressure drop along the flow direction. In this test, only the pressure drop between the inlet and outlet of the test section was measured, and the measured value was expressed by ∆pmea. There is a short distance between the inlet and outlet of the test section and the pressure measuring point, but because there is no diameter change at the connection between the test section and the inlet/outlet stable sections, the local pressure drop can be ignored. ∆pmea is calculated by
Δ p mea = Δ p + Δ p g + Δ p f , in + Δ p f , out
where ∆p is the pressure drop of the test section (the sum of the pressure drop due to friction and acceleration); ∆pg is the gravitational pressure drop; ∆pf,in and ∆pf,out are the frictional pressure drop of the inlet and outlet adiabatic sections, respectively.
Since the gas content of the bulk fluid is very low in the working conditions of this test, ∆pg can be approximately given as
Δ p g = ρ l g ( L in + L eff + L out )
where Leff is the effective heating length of the test section; Lin and Lout are the distances from the inlet and outlet pressure measuring points to the inlet and outlet, respectively.
The hydraulic diameter of the cooling channel is evaluated as
D h = 4 A F P w
where AF is the flowing area of the cooling channel, Pw is the wetting perimeter.
The mass flux is calculated by
G = M A F
where M is the mass flow.
The equivalent one-side radiating heat flux of the hypervapotron is defined as
q e = Q A t = k U I W t L h
where Q is the applied power, At is the outer surface area of the thick wall, k is the thermal efficiency, U is the voltage drop, I is the current, Wt = 0.05 m is the width of the thick wall, Lh = 0.29 m is the heated length of the test section.
The frictional pressure drop of the inlet adiabatic section is evaluated as
Δ p ad , in = f ad , in L in D h G 2 2 ρ in
The frictional pressure drop of the outlet adiabatic section is evaluated as
Δ p ad , out = f ad , out L out D h G 2 2 ρ out
where ρin and ρout are the average density of the bulk fluid in the inlet and outlet adiabatic section, respectively, fad,in and fad,out are the frictional pressure drop coefficients of inlet and outlet adiabatic sections, respectively, which are calculated by the Blasius equation as follows:
f ad = 0.3164 R e 0.25
The pressure drop coefficient of the test section is defined as
f = Δ p D h L eff 2 ρ G 2
where ρ is the average density of the bulk fluid in the test section.
For the convenience of discussion, the pressure drop ratio r is defined as the ratio of the pressure drop of the two-phase flow to the adiabatic pressure drop of the pure liquid phase under the same working conditions, namely:
r = Δ p Δ p ad
In the SP region, r = 1; In the subcooled boiling region, r > 1.

2.5. Heat Balance Test

In order to reduce heat loss and ensure the measurement accuracy of the thermocouple, the test section is wrapped with thermal insulation foam. Before the formal pressure drop test starts, the heat balance test is carried out on the test part according to the principle of heat balance to evaluate the heat loss of the test section. According to the results of the heat balance test, the thermal efficiency of the test system is calculated as follows:
k = M ( H out H in ) Q × 100 %
where Hin and Hout are the enthalpy values of the inlet and outlet bulk fluid, respectively; Q = UI is the heating power of the test section. In this experiment, the value of k under different working conditions is stable in the range of 93%~97%, and the value of k is approximately 95% for the convenience of research.
The mean heat transfer coefficient of the thick wall is evaluated as:
h t = q t T wt T b
where qt is the average heat flux of the thick wall, Twt is the mean inner surface temperature of the thick wall, and Tb is the bulk temperature. The calculation method of Twt is introduced in reference [21] in detail.

2.6. Uncertainty Analysis

According to the uncertainty analysis method in experimental measurement proposed by Cole and Steele [22], if the expression of dependent variable Y is composed of several independent variables Xi, then the expression of relative uncertainty of Y is calculated as:
δ Y Y = 1 Y i = 1 N Y X i δ X i 2 1 / 2
The uncertainties of the main parameters in this test are shown in Table 2.

3. Effect of System Parameters

In the pressure drop tests, all steady-state data were collected for given values of G, p, q, and Tin. The influence of these parameters on ∆p is discussed in this section.

3.1. Typical Working Condition

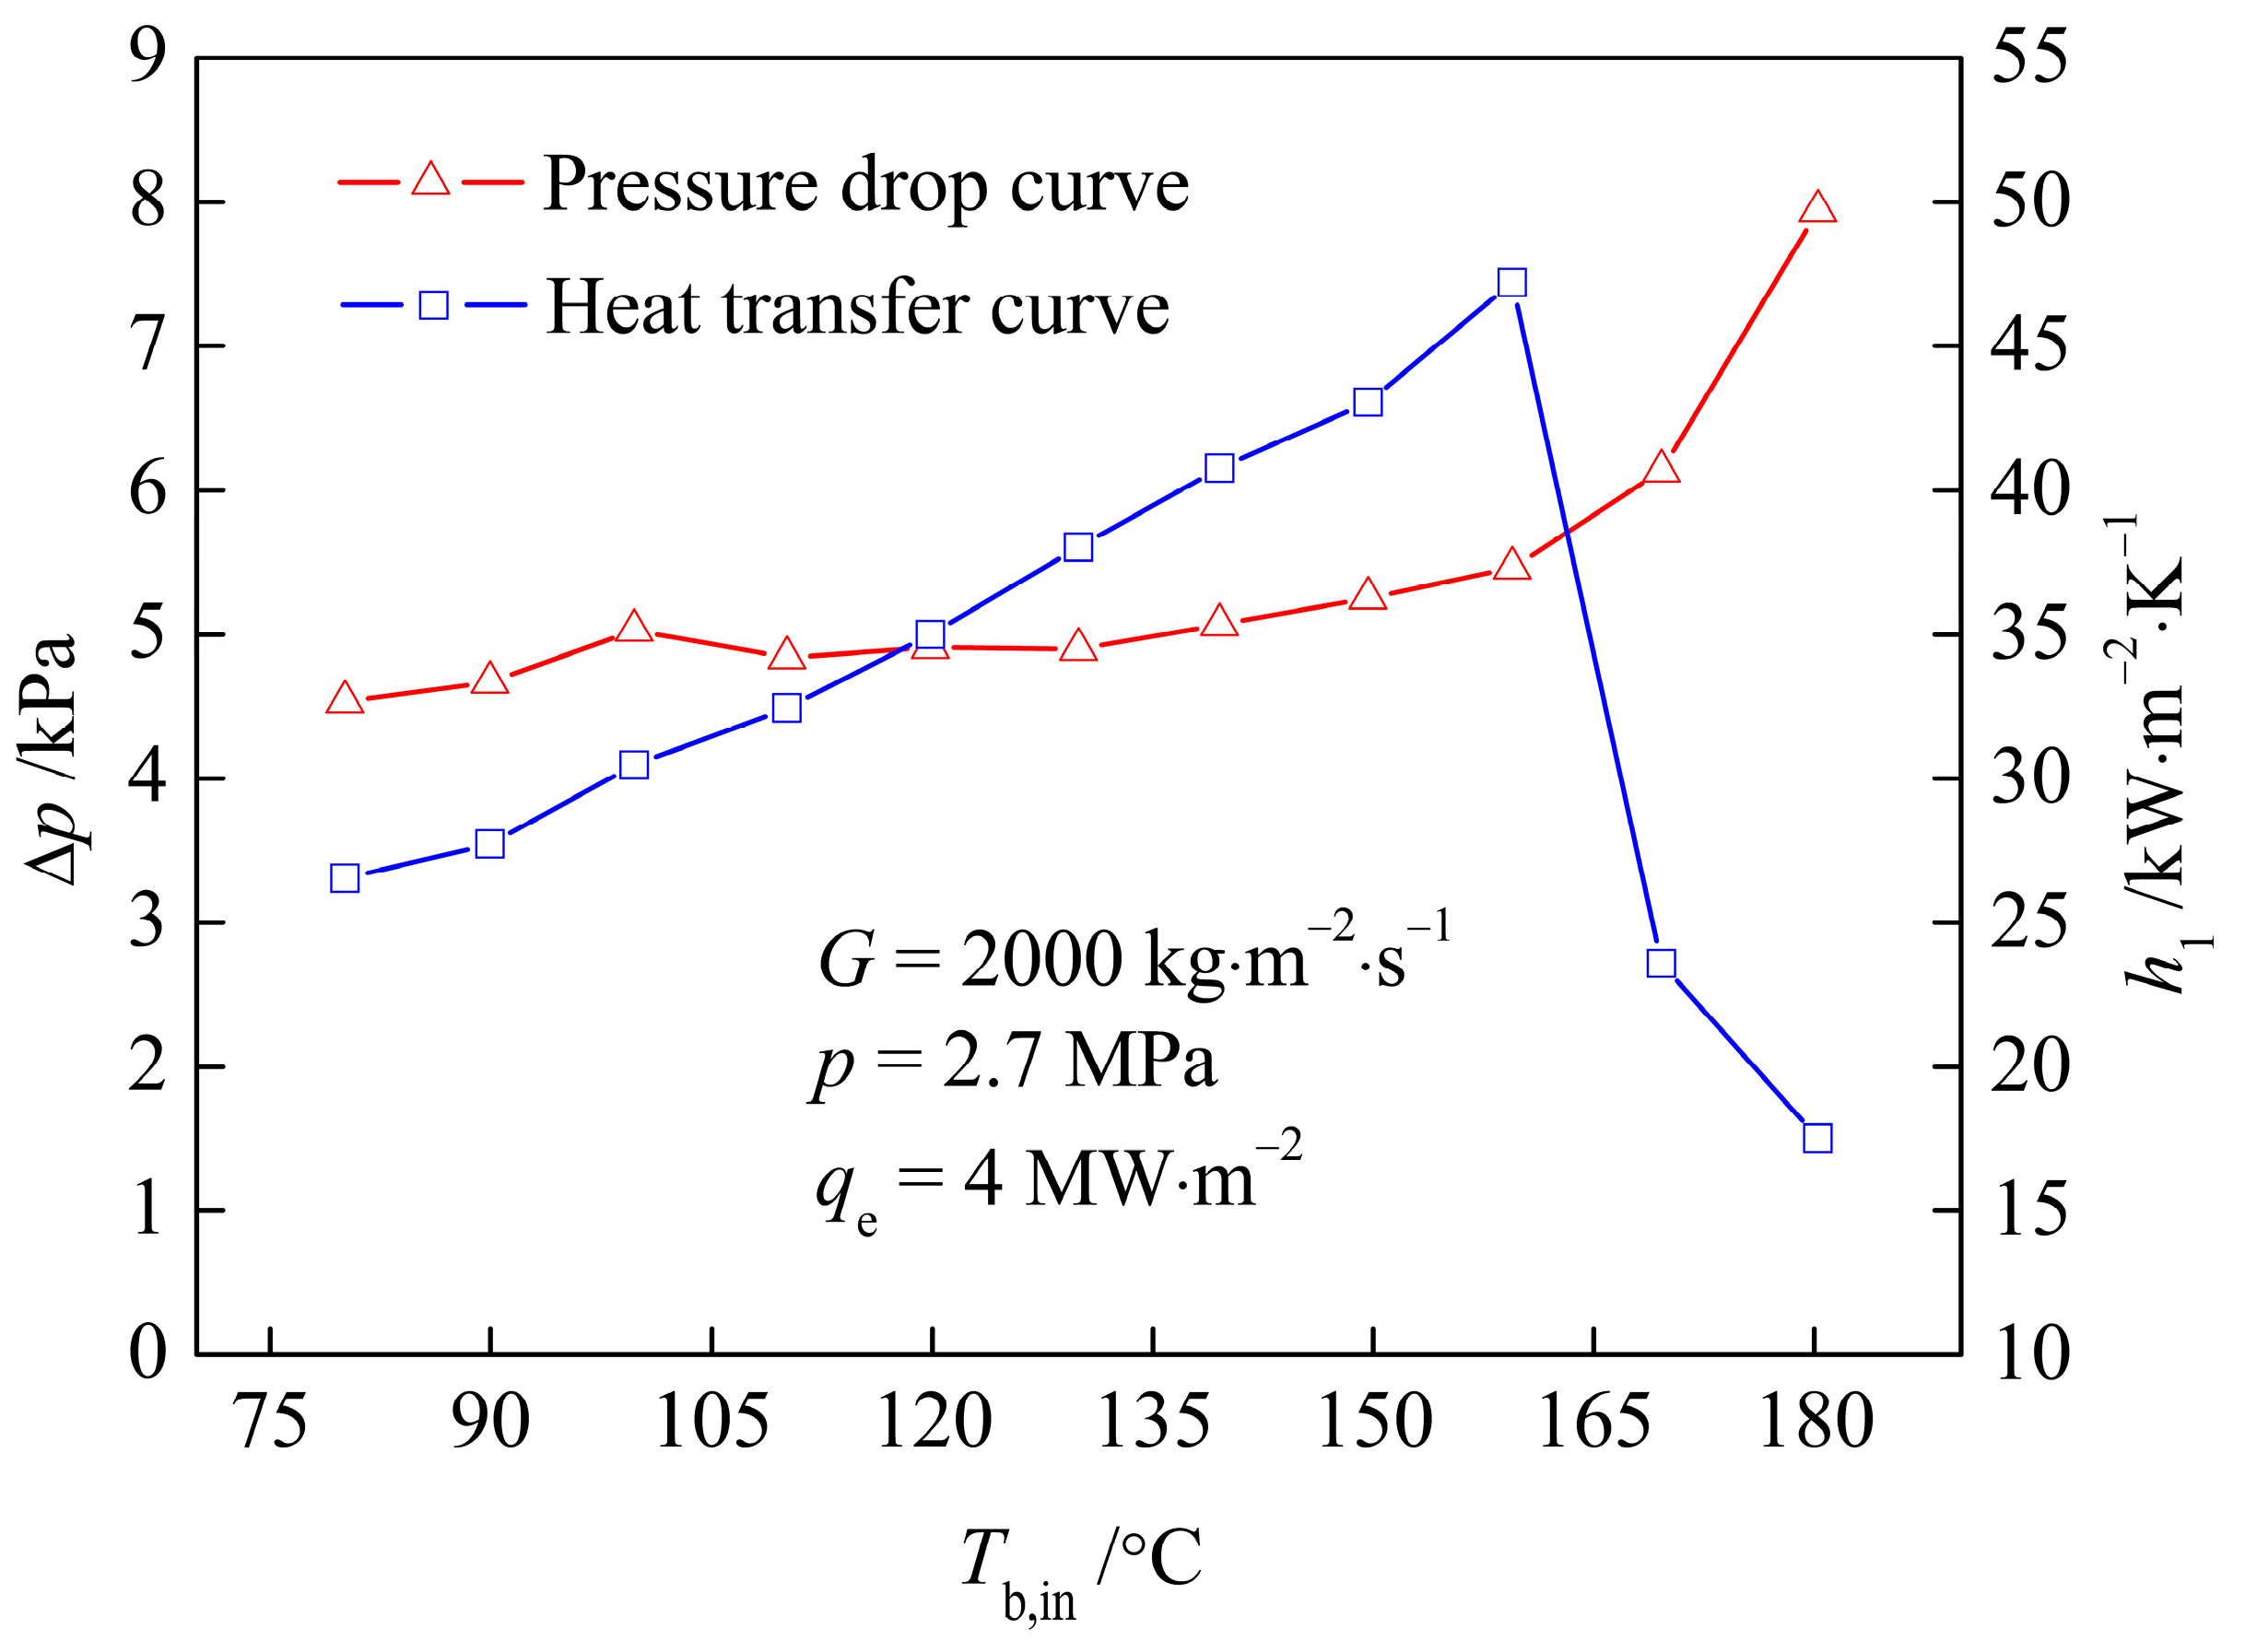
Under the working conditions of G = 2000 kg·m−2·s−1, p = 2.7 MPa, qe = 4 MW·m−2, the changes in ∆p and h1 with the bulk temperature for the inlet of test section (Tb,in) are shown in Figure 4. It can be seen that when Tb,in ≥ 160 °C, p increased sharply and h1 decreased significantly, indicating that the fluid deviated from nucleate boiling. When Tb,in < 160 °C, the pressure drop and heat transfer curves gradually increase with the increase in Tb,in, the slope does not change obviously, which shows that the CHF is reached in the test section before the fully developed subcooled boiling region. Due to the particularity of the structure of the hypervapotron, even if the bulk fluid is in a SP liquid state, bubbles would be generated in the groove on the thick-walled side because the fluid cannot flow away immediately.

3.2. Effect of Pressure

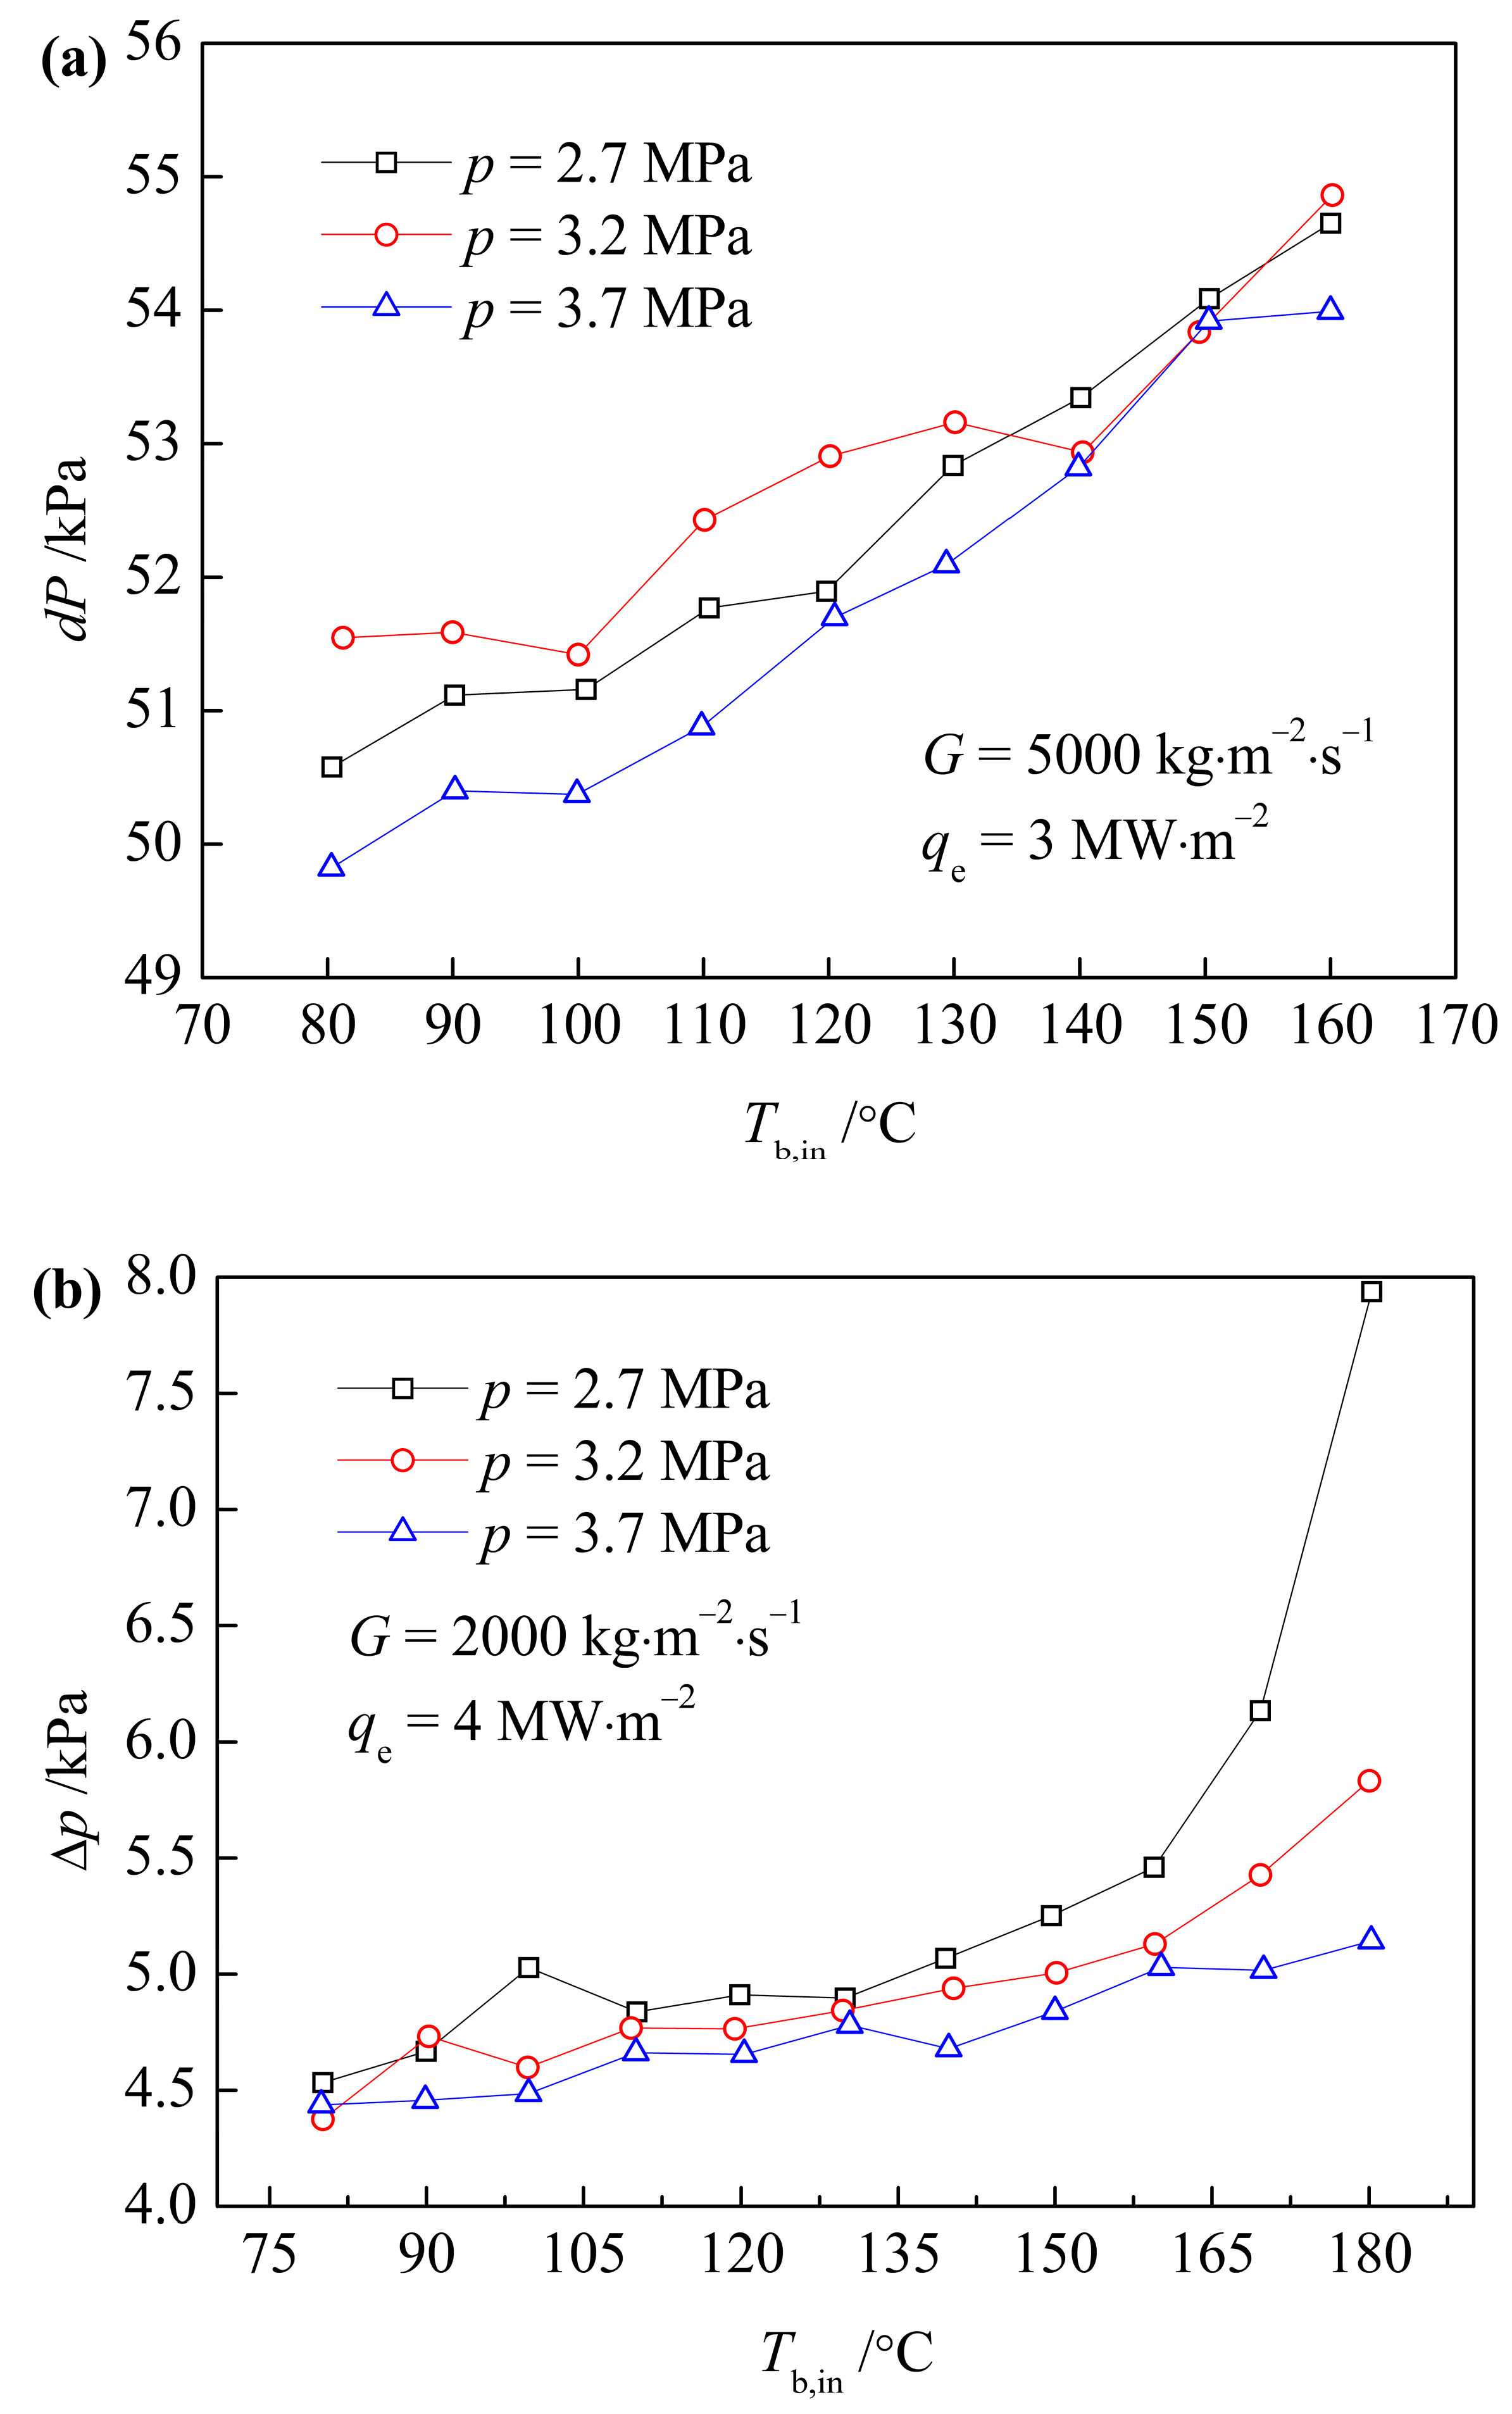
In the pressure range of p = 2.7~3.7 MPa, under the SP condition of G = 5000 kg·m−2·s−1 and qe = 3 MW·m−2 and the subcooled flow boiling condition of G = 2000 kg·m−2·s−1 and qe = 4 MW·m−2, the ∆p changes with Tb,in as shown in Figure 5a,b, respectively. It can be seen that under the SP condition, the ∆p does not change with p obviously. Under the subcooled boiling condition, when Tb,in ≤ 140 °C, the ∆p does not change with p obviously. When Tb,in > 140 °C, it can be seen that under the same Tb,in, a smaller p leads to a higher ∆p. The slope of the ∆p curve for p = 3.7 MPa has no obvious change all the time; the slope of the ∆p curve for p = 3.2 MPa begins to increase when Tb,in = 160 °C, which is because the partially boiling (PB) region is entered, and the bubbles generated by the thick wall surface increase significantly, resulting in the increase in the ∆p. The slope of the ∆p curve for P = 2.7 MPa begins to increase gradually when Tb,in > 140 °C, which is because the PB region is entered, and when Tb,in > 160 °C, it begins to increase sharply, which is when the first type of heat transfer deterioration occurs, that is a departure from nucleate boiling, which leads to a rapid increase in the bubbles, thus making the ∆p soar. To sum up, for the subcooled boiling condition, under the same Tb,in, the lower the pressure, the greater the thermodynamic dryness, the smaller the subcooling, the stronger the nucleate boiling, the more bubbles produced, so the greater the pressure drop.

3.3. Effect of Mass Flux

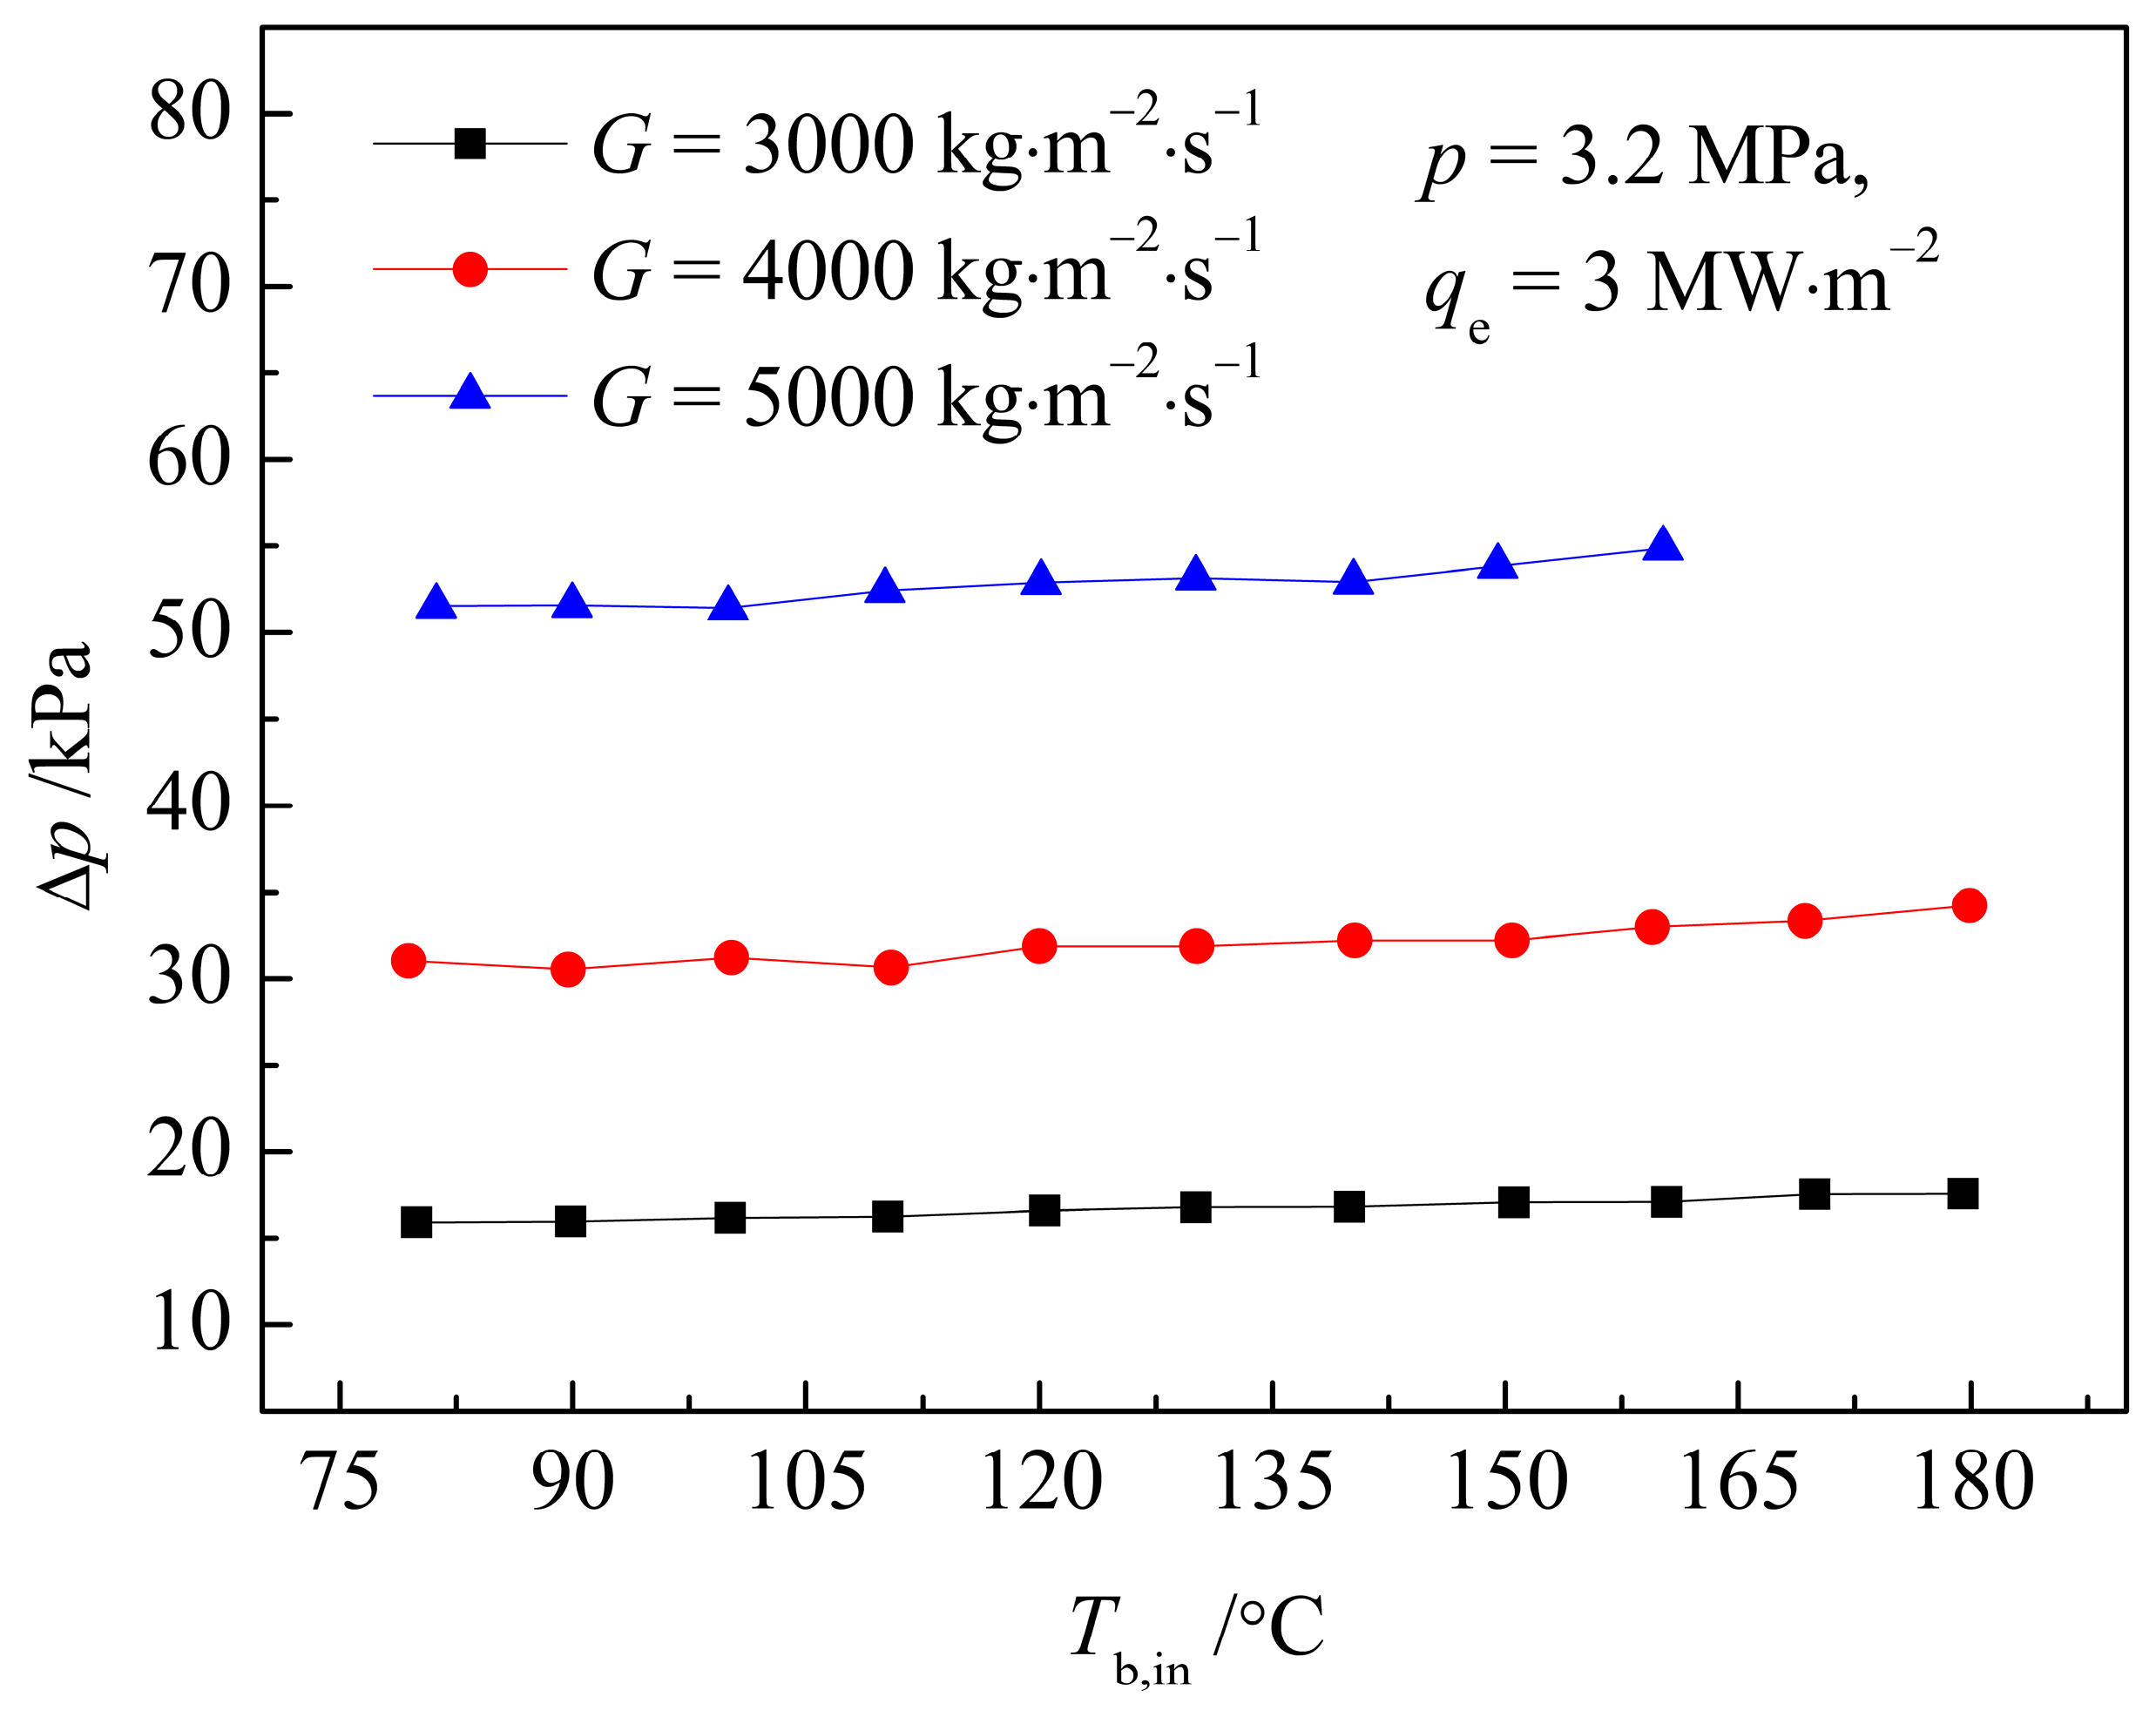
Under the working conditions of G = 3000~5000 kg·m−2·s−1, p = 3.2 MPa, qe = 5 MW·m−2, the variation in ∆p with Tb,in is shown in Figure 6. It can be seen that ∆p increases slightly with the increase in Tb,in, but the increasing trend is not obvious, and a higher G leads to a greater ∆p. Combined with the heat transfer curve in reference [13], it can be seen that although the fluid near the thick wall has entered the subcooled boiling region, the fluid near the thin wall is still in a SP region due to the lower local heat flux. The contribution of the pressure drop on the thick-walled side with the increase in Tb,in in the ∆p curve is small.

3.4. Effect of Heat Flux

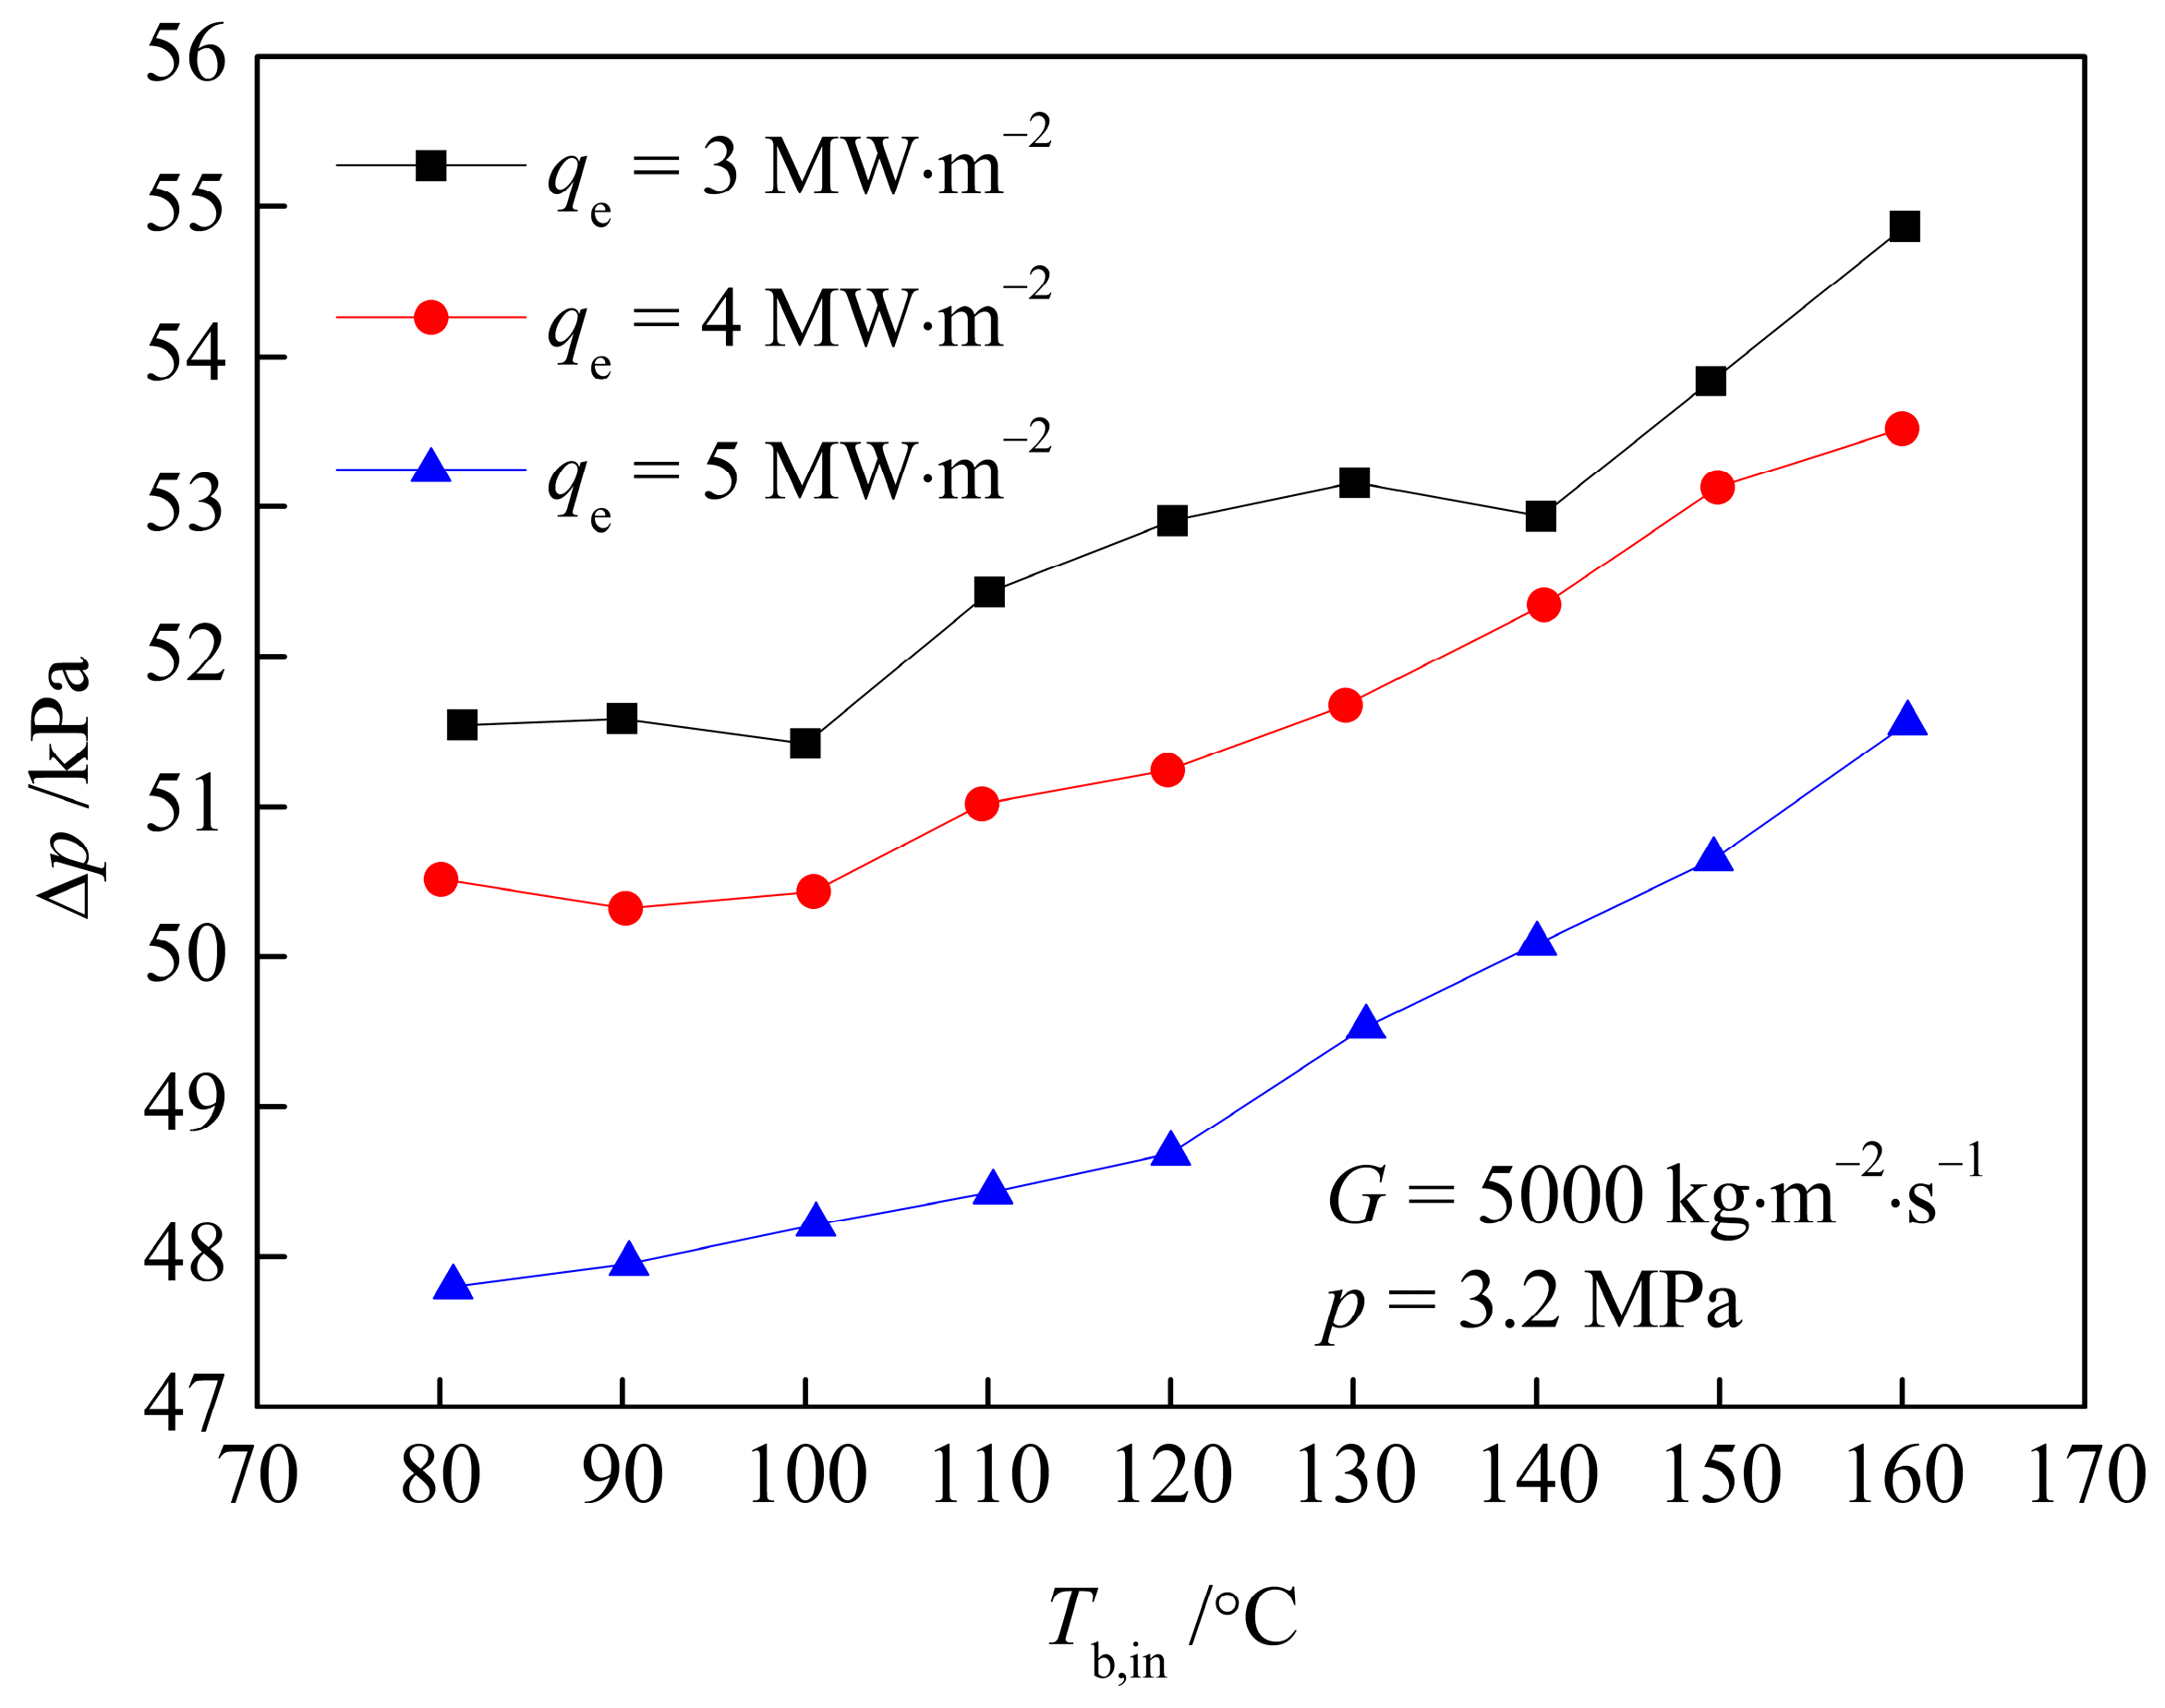
Under the working conditions of G = 5000 kg·m−2·s−1, p = 3.2 MPa, qe = 3~5 MW·m−2, the ∆p changes with Tb,in as shown in Figure 7. It can be seen that under the SP condition, a lower heat flux leads to a higher ∆p. This is because the lower the heat flux, the lower the wall temperature and fluid temperature, and the higher the dynamic viscosity, so the ∆p is higher.

4. Evaluation and Analysis of Pressure Drop Correlations

Researchers have conducted detailed studies on SP adiabatic flow and heated flow under conventional conditions, established relatively complete theoretical models, and summarized many empirical correlations as shown in Table 3. However, the experimental research for the pressure drop of the hypervapotron is rarely involved. In addition, under high and non-uniform heat fluxes, due to the large temperature difference in heat transfer, the fluid temperature gradient is also large, and the uneven circumferential heating caused by the unilateral heating condition, the influence of density gradient and dynamic viscosity gradient caused by it on ∆p is more complex, so it is necessary to conduct special experimental research and analysis on the pressure drop of the hypervapotron under high and non-uniform heat fluxes.
These correlations generally express the pressure drop coefficient ratio (f/fad) under heated and adiabatic conditions in the form of the exponent of the density ratio (ρw/ρb) and dynamic viscosity ratio (ηw/ηb) between the wall-side fluid and the bulk fluid. That is as follows:
f f ad = ( ρ w ρ b ) m ( η w η b ) n
In the correlation, the power exponent m and n are empirical constants, and the values of m and n will be different under different working conditions. The fad in equation (15) is measured at zero qe.
Figure 8 shows a comparison of the experimental data for the hypervapotron in this test with the calculated values using a series of SP pressure drop correlations for the circular tube. It can be seen that the experimental value of (f/fad) in this experiment is much higher than the predicted value of each correlation. This is consistent with expectations, because even if the bulk fluid is in the SP region, the thick-walled lateral finned structure will cause the coolant to stay in the groove for a short time, which will be heated by the high-temperature thick wall to produce bubbles. Therefore, the flow mechanism of SP pressure drop cannot be simply applied to the hypervapotron.
Subcooled boiling flow has also been studied in depth, and many pressure drop correlations have been proposed [26,30,31,32,33]. The forms of subcooled boiling pressure drop correlations are different, but most of them contain r.
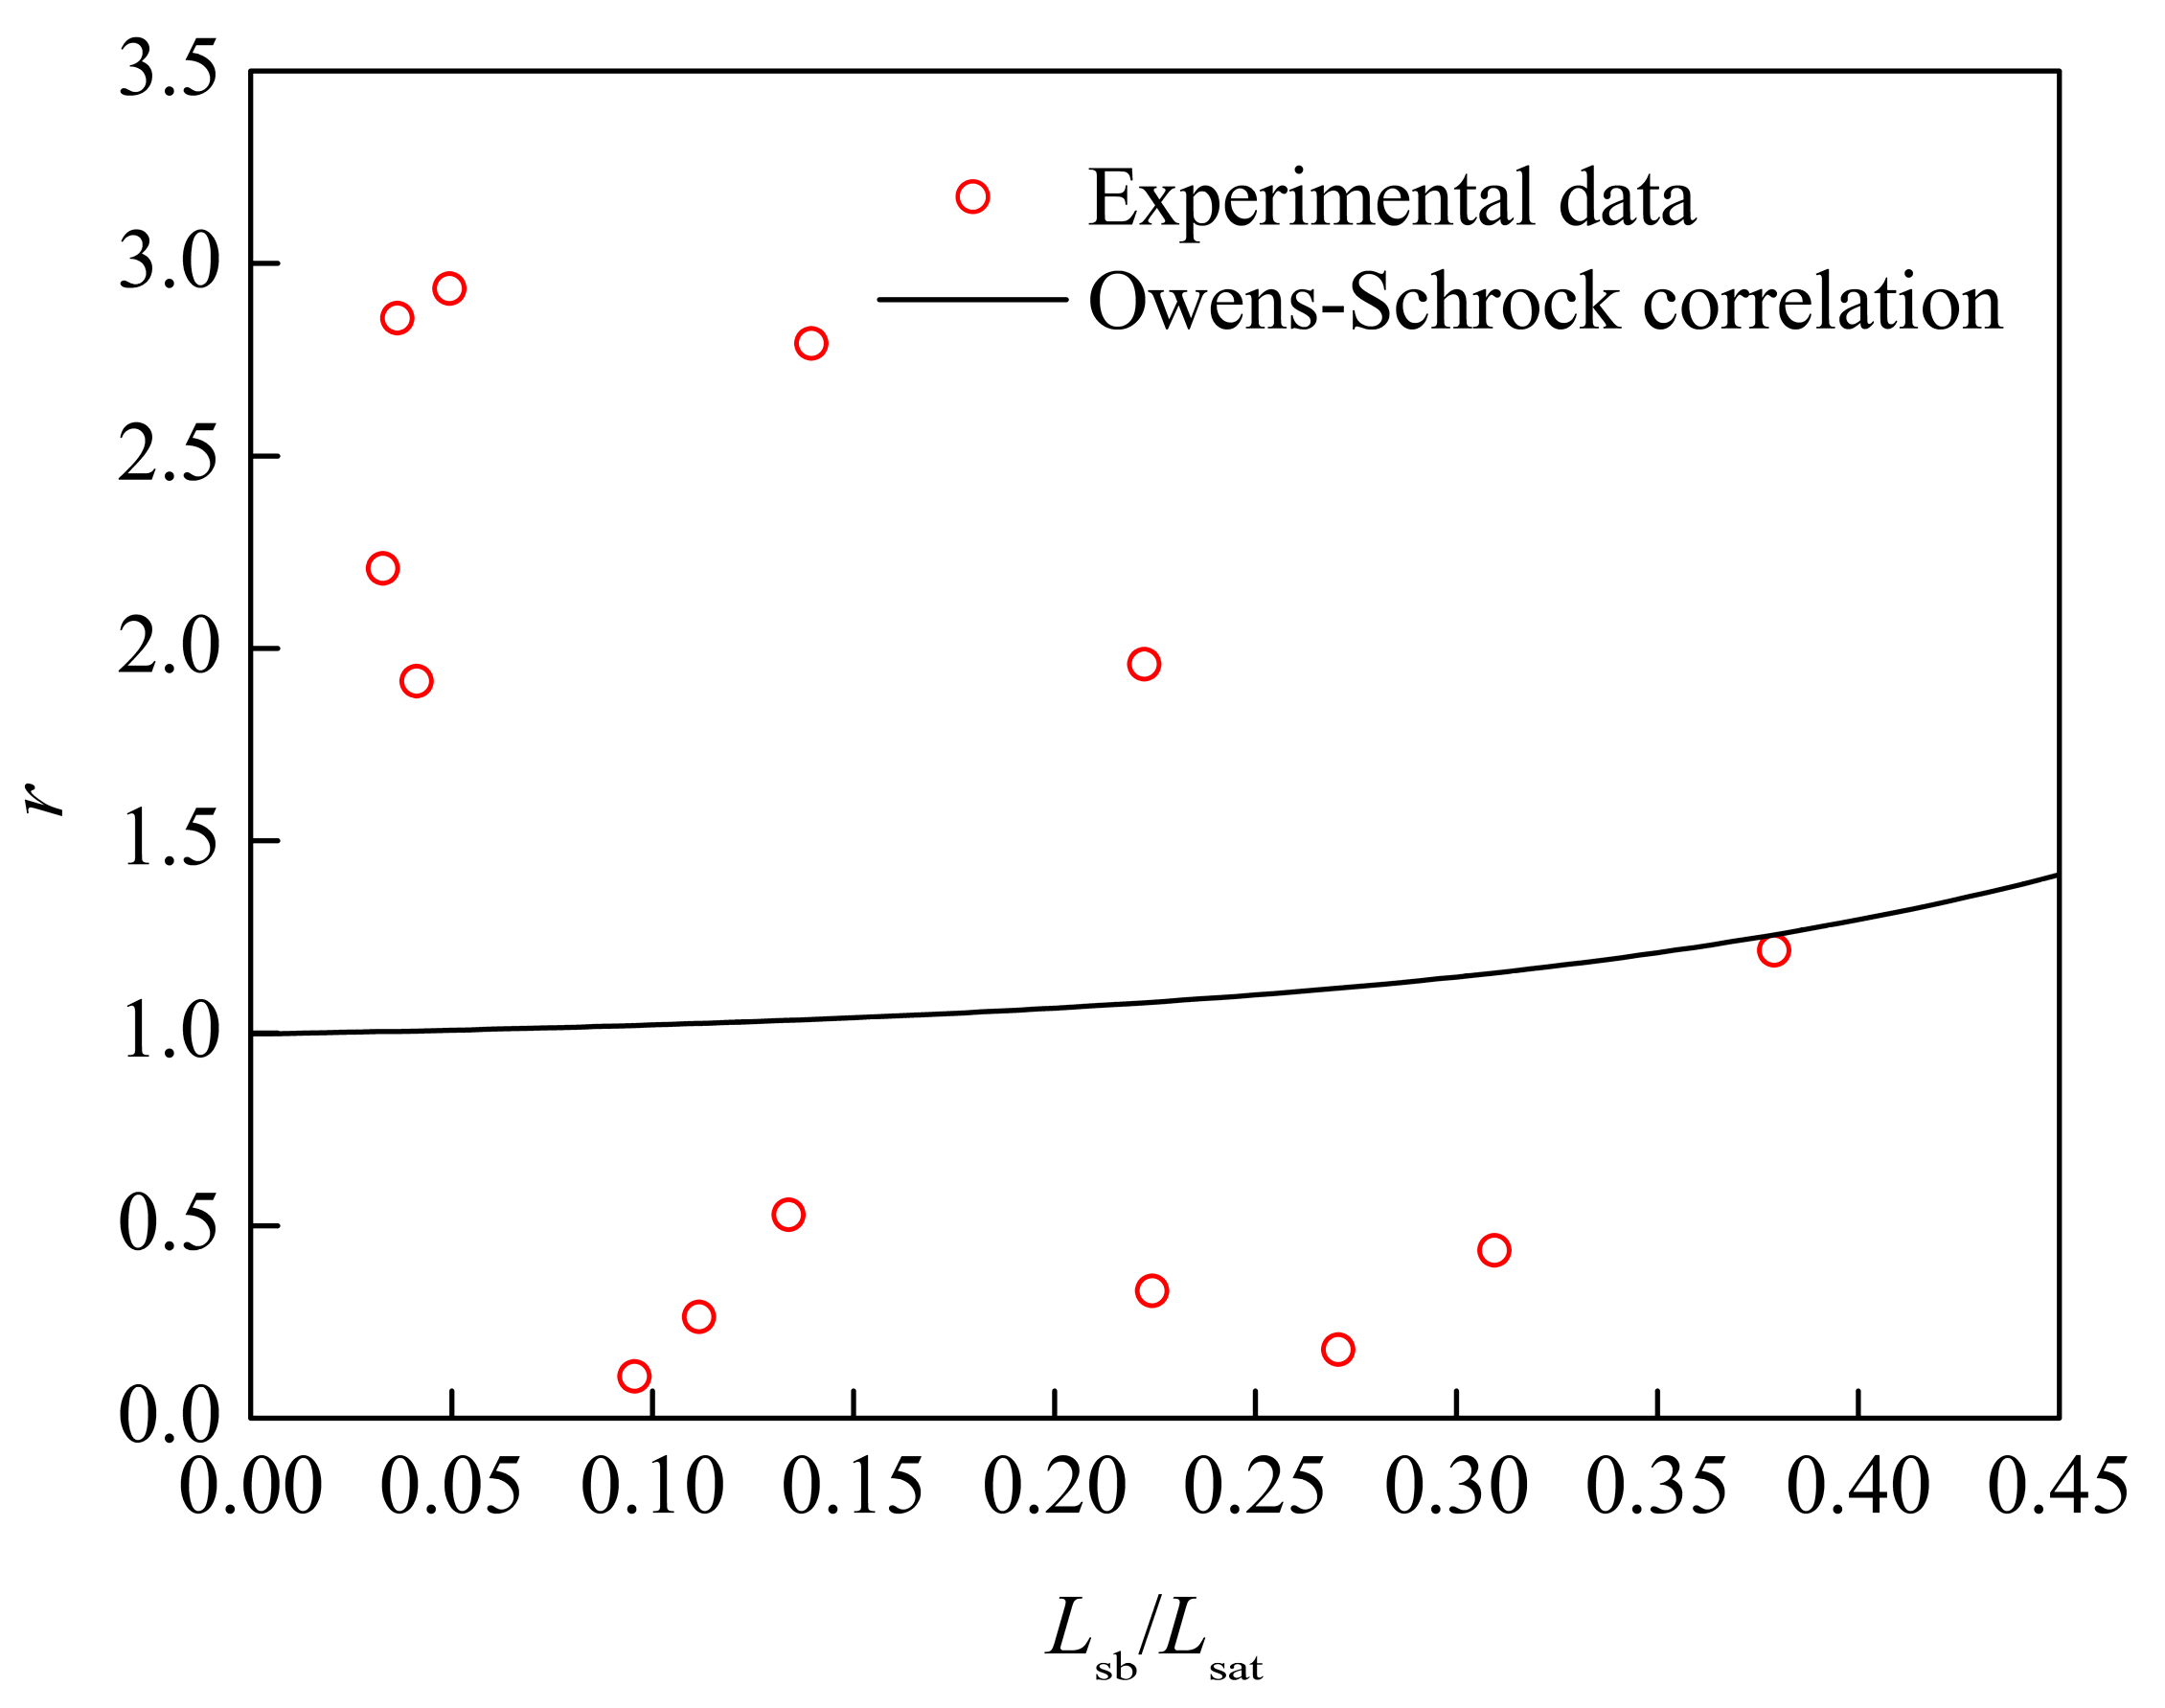
Yan Jianguo et al. [34] used the Owens–Schrock correlation [28] to predict the subcooled boiling pressure drop in circular channels under the condition of low and medium characteristic length ratios (Lsb/Lsat), and the expression is as follows:
r = 0.97 + 0.028 exp ( 6.13 L sb L sat )
where Lsb is the length from the location of incipient boiling to the tube exit, and Lsat is the length from the location of incipient boiling in the test tube to the location where the fluid would reach a saturated state.
Figure 9 shows the comparison of the test data in this experiment and the predicted values of the Owens–Schrock correlation for subcooled boiling pressure drop. However, it can be seen that the predicted values do not fit the pressure drop data well, and the relative error of most data is more than 50%. The possible reasons are as follows: (1) the structure of the hypervapotron is different from that of the straight channel, the local pressure drop caused by the grooves in the hypervapotron channel is much larger than that of the straight channel.; (2) the pressure range applicable to the Owens–Schrock correlation is 0.34~2.76 MPa, which is lower than 2.7~3.7 MPa for this experiment; (3) the flow pressure drop on the thin-wall side of the hypervapotron is an SP pressure drop, while on the thick-wall side, it is a subcooled boiling pressure drop, which influence each other and have a complex flow mechanism. This is a comprehensive flow, which is different to an SP flow and a subcooled boiling flow.
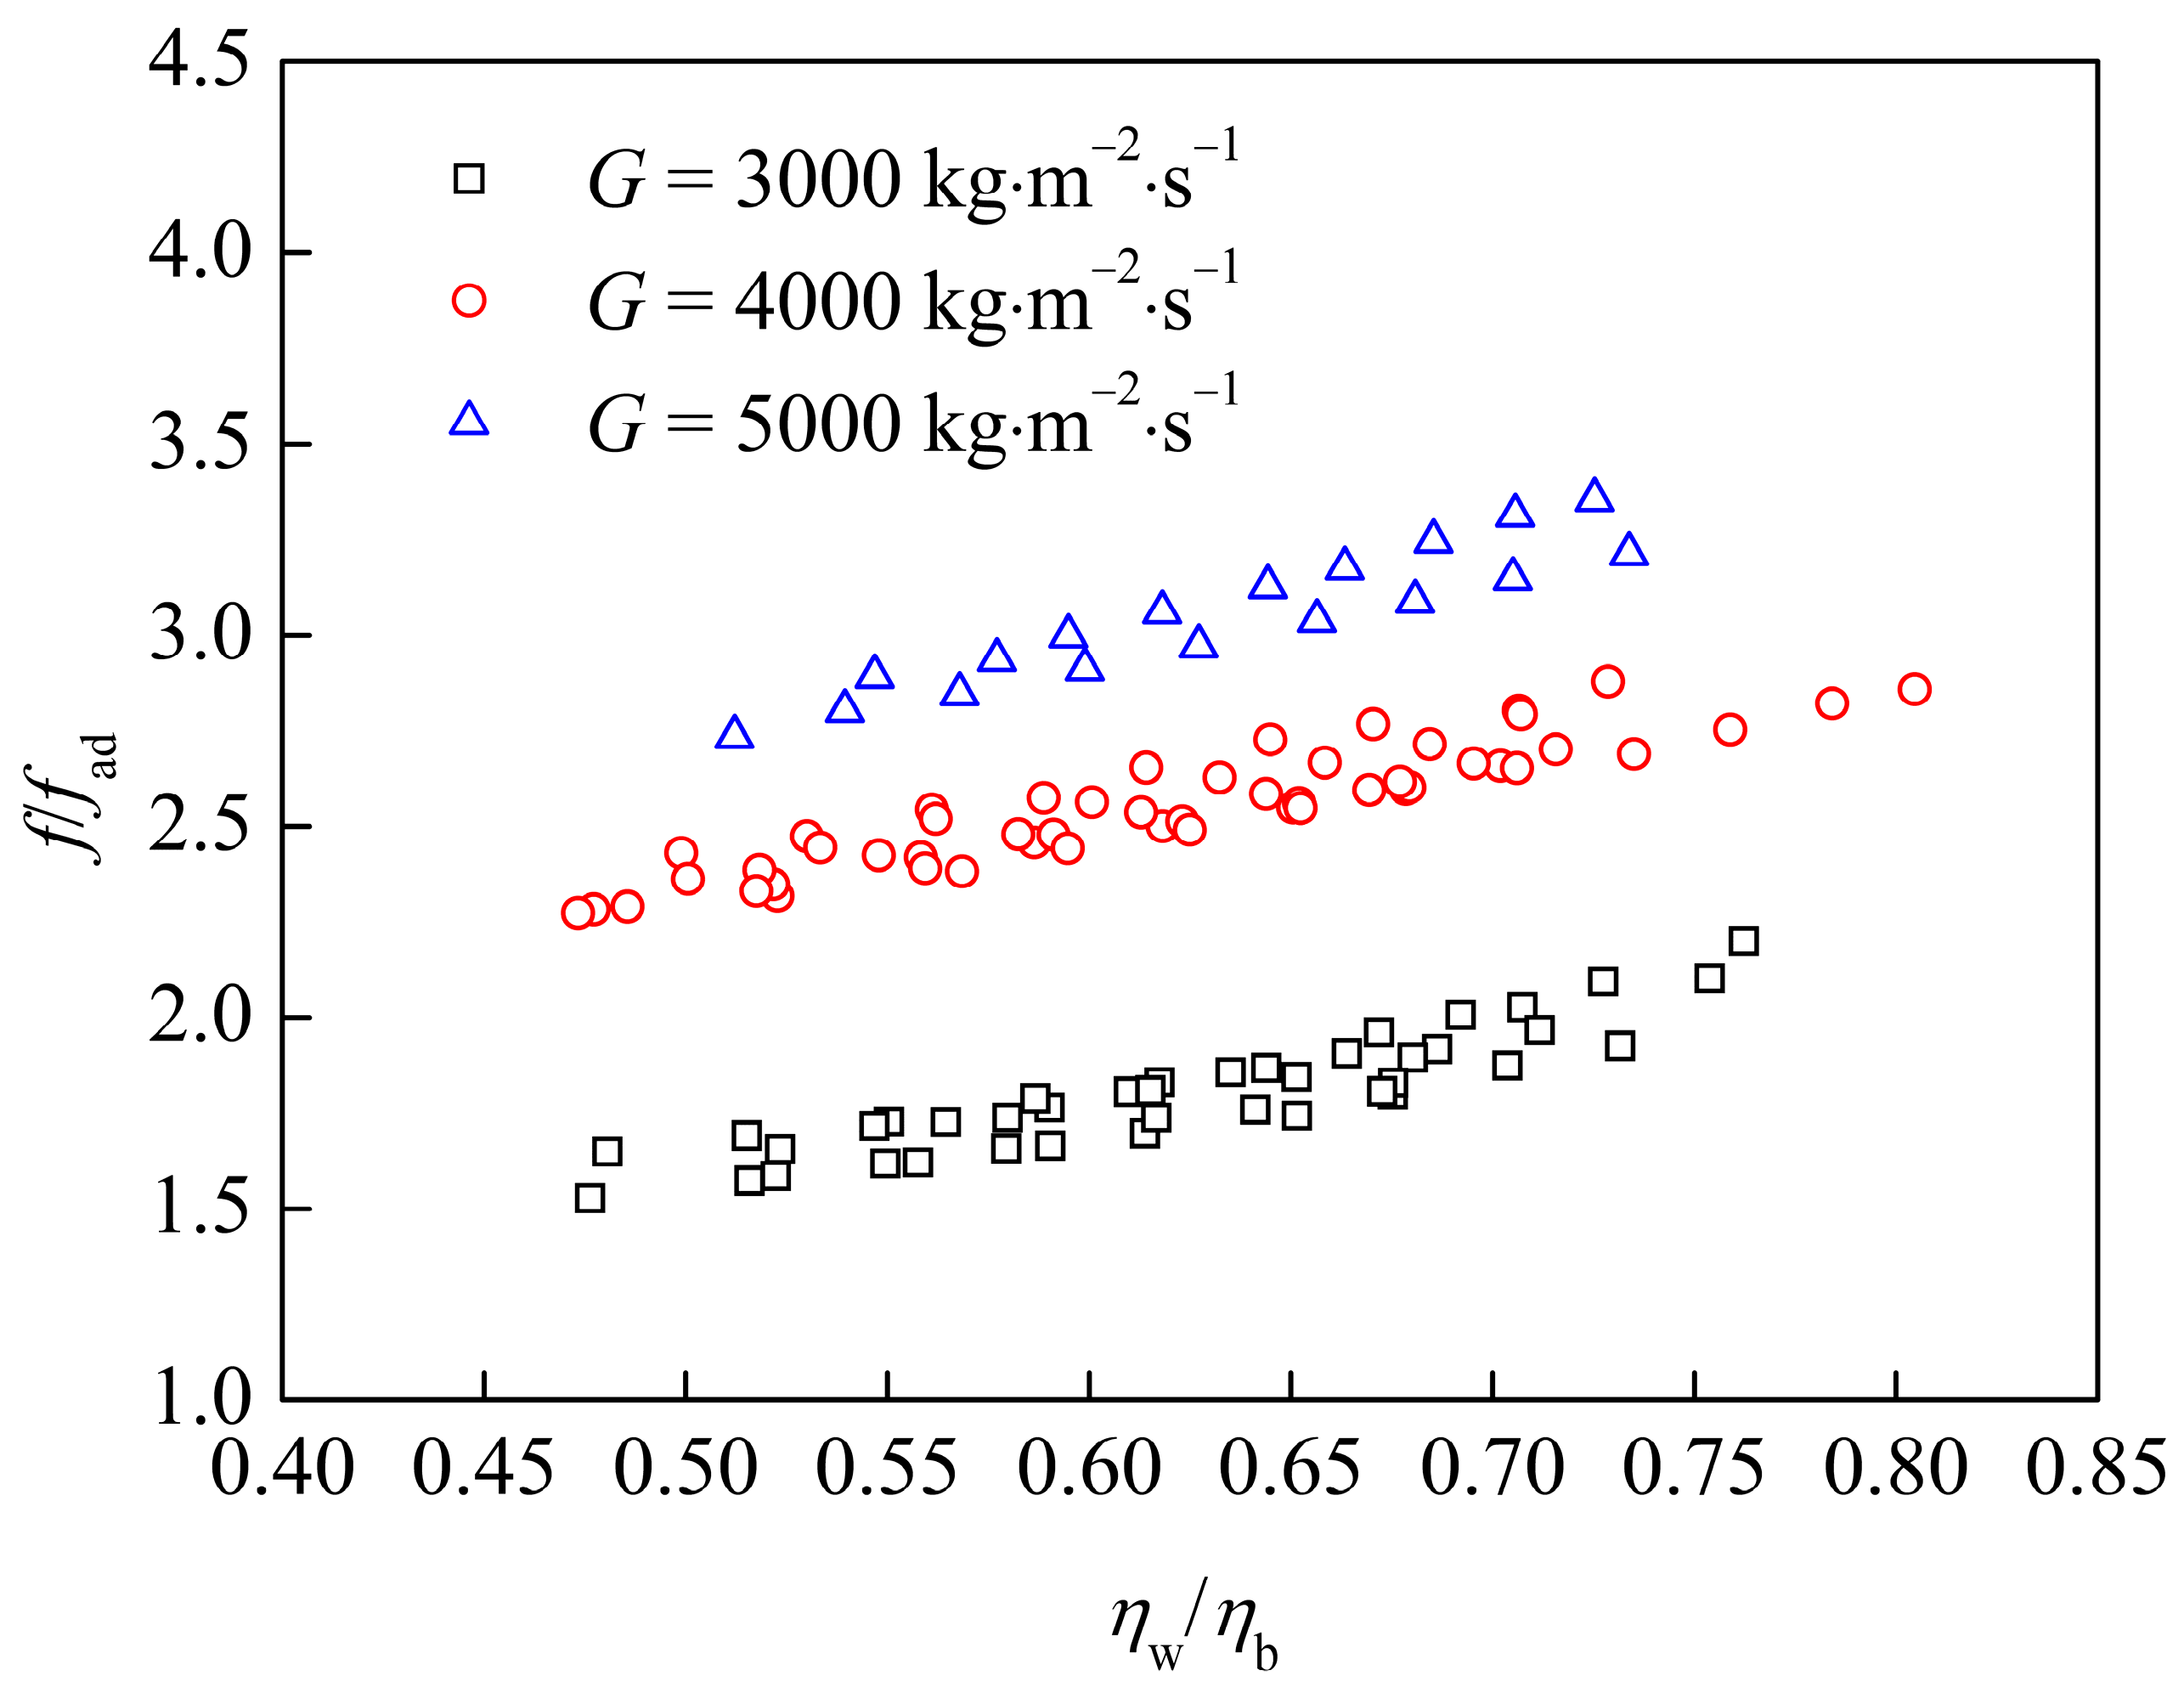
In Figure 8, the pressure drop coefficient ratio is divided into three distinct regions. Through observation and analysis, it can be seen that the three regions are divided by different mass fluxes. As shown in Figure 10, a higher mass flux leads to a larger pressure drop coefficient ratio. At the same mass flux, the pressure drop coefficient ratio (f/fad) increases linearly with the increase in the dynamic viscosity ratio (ηw/ηb).
According to the above analysis, it is considered that the pressure drop correlation for the hypervapotron can be fitted as Equation (17), where G = j·G0, the reference mass flow velocity G0 = 1000 kg·m−2·s−1, and j is a dimensionless parameter. The heat flux affects the viscosity of the fluid by affecting its local temperature. Therefore, in Equation (17), the viscosity ratio already includes the effect of heat flux.
f f ad = 0.44 j 1.16 + 1.74 ( η w η b ) 3.95
Figure 11a,b show the relative error of the new pressure drop correlation for the hypervapotron proposed in this paper and its distribution along different pressure drop ratios (f/fad), respectively. It can be seen that Equation (17) has a high precision, all data points fall within the relative error range of ±10%, and they are evenly distributed on both sides of the zero-error line. The MRE and RMSE of the new correlation are 0.72% and 4.33%, respectively.
It is worth noting that the physical meanings of mass flux and dynamic viscosity ratio contained in Equation (17) are more related to SP pressure drop. As few of the pressure drop data for this experiment involved fully developed subcooled boiling regions, the physical quantities closely related to boiling heat transfer were not included in the fitting of the correlation, which is applicable to the SP region and the PB region. In addition, although the prediction performance of the new pressure drop correlation for the hypervapotron proposed in this paper is excellent, due to the particularity of its structure, it needs to be carefully evaluated before being used for structures with different geometrical and surface parameters.

5. Conclusions

The experimental study on pressure drop of subcooled water in hypervapotron designed for the dome of the divertor in ITER is carried out. The pressure drop of the test section with the parameters range of G = 2000–5000 kg·m−2·s−1, qe = 2~5 MW·m−2, p = 2–4 MPa, Tin = 80~180 °C is analyzed, and the following conclusions can be drawn:
(1)
The pressure drop in the hypervapotron is different from that in the ordinary straight channel. Because the thick-walled side of the hypervapotron is densely covered with a transverse fin structure, even the bulk fluid is in a SP state, and there will be fluid heated to generate bubbles in the grooves of the thick-wall side. Meanwhile, the fluid near the thin-wall side is pure liquid phase. Therefore, as Tb,in rises, it may lead to the increase in bubbles on the thick-wall side and the increase in ∆p; while the dynamic viscosity of the fluid near the thin-wall side decreases and ∆p decreases. From the pressure drop curve, ∆p rises with the increasing Tb,in, which indicates that under the working conditions of this test, the increasing effect of the thick-wall side is greater than the weakening effect of the thin-wall side on the pressure drop in the process of Tb,in rises.
(2)
The ∆p curve can be divided into an SP region and a subcooled boiling region. In the SP region, ∆p does not change significantly with Tb,in; while in the subcooled boiling region, especially in the fully developed subcooled boiling region with a low subcooling degree, ∆p increase rapidly with the increase in Tb,in. It should be noted that since the thin-wall side is always in a SP flow state under the operating conditions of this test, even if the thick-wall side has entered the subcooled boiling region, the ∆p curve does not increase rapidly. With the further increase in the thermodynamic dryness, the slope of the ∆p curve will increase significantly.
(3)
In terms of the influence of system parameters, in the SP region, the influence of p on ∆p is not obvious, but under the condition of lower pressure, it will enter the subcooled boiling region earlier, and the ∆p curve will first start to rise; a higher G leads to a greater ∆p; in the SP region, a higher q leads to a smaller ∆p, because a higher q makes a higher wall temperature, which leads to a higher fluid temperature near the wall surface, so it creates a lower dynamic viscosity, and a smaller ∆p.
(4)
Through the analysis of the experimental data, a new pressure drop correlation for subcooled water in an unilateral heated hypervapotron under high heat fluxes and high mass fluxes is proposed. The new correlation has a high prediction accuracy for the test data, the MRE and RMSE are 0.72% and 4.33%, respectively. It can be used for the SP region and the PB region.

Author Contributions

Conceptualization, G.Z.; Methodology, G.Z.; Software, S.T.; Validation, G.M.; Writing—original draft, G.Z.; Writing—review & editing, G.M.; Supervision, J.Y. All authors have read and agreed to the published version of the manuscript.

Funding

The work is financially supported by the Science and Technology Project of Henan Province in China (No. 232102320226) and the Key Scientific Research Project of universities of Henan Province in China (No. 24A490001).

Data Availability Statement

The data presented in this study are available on request from the corresponding author. The data are not publicly available due to privacy.

Conflicts of Interest

The authors declare no conflict of interest.

Nomenclature

Aarea [m2]
AFflow area [m2]
Dhhydraulic diameter [m]
ffriction factor [-]
Gmass flux [kg·m−2·s−1]
hheat transfer coefficient [kw·m−2·K−1]
Henthalpy [kJ·kg−1]
Icurrent [A]
kthermal efficiency [%]
Llength [m]
Lhheated length of tube [m]
Mmass flow [kg·m−2·s−1]
ppressure [MPa]
ppressure drop [MPa]
Pwwetting perimeter [m]
qheat flux [kW·m−2]
Qpower [kW]
rpressure drop ratio [-]
ReReynolds number
Ttemperature [°C]
Uvoltage drop [V]
Wwidth [m]
η dynamic viscosity [Pa·s]
ρ density [kg·m−3]
Subscripts
adadiabatic
bbulk
eequivalent
calcalculated
expexperimental
effeffective
ffrictional
ggas
HVhypervapotron
iinside of the test section
ininlet of the test section
lliquid
meameasure
ooutside of the test section
outoutlet of the test section
satsaturation
sbsubcooled
tthick
tptwo-phase
wwall
Abbreviations
CHFcritical heat flux
ITERInternational Thermonuclear Experimental Reactor
MREmean relative error
ONBonset of nucleate boiling
PBpartially boiling
RMSEroot mean square error
SPsingle-phase

References

  1. Pascal-Ribot, S.; Saroli, A.F.; Grandotto, M.; Spitz, P.; Escourbiac, F. 3D numerical simulations of hypervapotron cooling concept. Fusion Eng. Des. 2007, 82, 1781–1785. [Google Scholar] [CrossRef]
  2. Chen, P.; Newell, T.A.; Jones, B.G. Heat transfer characteristics in subcooled flow boiling with hypervapotron. Ann. Nucl. Energy 2008, 35, 1159–1166. [Google Scholar] [CrossRef]
  3. Escourbiac, F.; Schlosser, J.; Merola, M.; Vastra, I.B. Experimental optimisation of a hypervapotron (R) concept for ITER plasma facing components. Fusion Eng. Des. 2003, 66–68, 301–304. [Google Scholar] [CrossRef]
  4. Hirai, T.; Bao, L.; Barabash, V.; Carrat, R.; Chappuis, P.; Eaton, R.; Edwards, P.; Escourbiac, F.; Gicquel, S.; Komarov, V.; et al. Hypervapotron heat sinks in ITER plasma-facing components—Process qualifications and production control toward series production. Fusion Eng. Des. 2023, 189, 113454. [Google Scholar] [CrossRef]
  5. Chen, Z.; Li, Q.; Peng, W.; Wei, R.; Wang, W.; Jiang, K.; Wang, J.; Pan, Z.; Xie, C.; Geng, X.; et al. Study of W/Cu flat-type mock-ups with novel hypervapotron cooling structure for CFETR divertor. Fusion Eng. Des. 2021, 172, 112919. [Google Scholar] [CrossRef]
  6. Lim, J.H.; Park, M. Forced convective and sub-cooled flow boiling heat transfer in a hypervapotron heat sink under one-side heating condition. Int. J. Heat Mass Transf. 2022, 186, 122523. [Google Scholar] [CrossRef]
  7. Lim, J.H.; Park, M. Effect of Hypervapotron Fin Angle on Subcooled Flow Boiling Heat Transfer Performance Under One-Side High-Heat Load Condition. Fusion Sci. Technol. Int. J. Am. Nucl. Soc. 2022, 78, 395–413. [Google Scholar] [CrossRef]
  8. Lim, J.H.; Park, M. Flow Boiling Burnout in a Hypervapotron Channel Under High Heat Flux and High Sub-Cooling Conditions. J. Fusion Energy 2022, 41, 4. [Google Scholar] [CrossRef]
  9. Chen, X.; Qin, S.; Wang, Q.; Cao, J. Fatigue life prediction of hypervapotron for CFETR divertor. Fusion Eng. Des. 2022, 174, 112985. [Google Scholar] [CrossRef]
  10. Cao, J.; Qin, S.; Wang, Q.; Chen, X.; Feng, X. Reliability research of hypervapotron under steady-state thermal load. Fusion Eng. Des. 2022, 180, 113191. [Google Scholar] [CrossRef]
  11. Youchison, D.L.; Ulrickson, M.A.; Bullock, J.H. Effects of hypervapotron geometry on thermalhydraulic performance. IEEE Trans. Plasma Sci. 2012, 40, 653–658. [Google Scholar] [CrossRef]
  12. Youchison, D.L.; Ulrickson, M.A.; Bullock, J.H. Thermalhydraulic optimization of hypervapotron geometries for first wall applications. In Proceedings of the 2011 IEEE/NPSS 24th Symposium on Fusion Engineering, Chicago, IL, USA, 26–30 June 2011. [Google Scholar] [CrossRef]
  13. Escourbiac, F.; Bobin-Vastra, I.; Kuznetsov, V.; Missirlian, M.; Schedler, B.; Schlosser, J. A mature industrial solution for ITER divertor plasma facing components: Hypervapotron cooling concept adapted to Tore Supra flat tile technology. Fusion Eng. Des. 2005, 75–79, 387–390. [Google Scholar] [CrossRef]
  14. Falter, H.D.; Thompson, E. Performance of hypervapotron beam-stopping elements at jet. Fusion Technol. 1996, 29, 584–595. [Google Scholar] [CrossRef]
  15. Lim, J.H.; Park, M.; Shin, S.M.; Chung, S.S. Exploring the onset of nucleate boiling with hypervapotron channel for tokamak cooling system application. Appl. Therm. Eng. 2022, 209, 118334. [Google Scholar] [CrossRef]
  16. Baxi, C.B. Comparison of swirl tube and hypervapotron for cooling of ITER divertor. In Proceedings of the 16th International Symposium on Fusion Engineering, Champaign, IL, USA, 30 September–5 October 1995; IEEE: Champaign, IL, USA, 1995; pp. 186–189. [Google Scholar]
  17. Cattadori, G.; Gaspari, G.P.; Celata, G.P.; Cumo, M.; Mariani, A.; Zummo, G. Hypervapotron technique in subcooled flow boiling CHF. Exp. Therm. Fluid Sci. 1993, 7, 230–240. [Google Scholar] [CrossRef]
  18. Chen, P.; Jones, B.G.; Newell, T.A. An Experimental Investigation of Sub-Cooled Flow Boiling in Hypervapotron Cooling Configuration. In Proceedings of the 12th International Conference on Nuclear Engineering, Arlington, VA, USA, 25–29 April 2004. [Google Scholar]
  19. Chen, P.; Wu, W.; Jones, B.G.; Newell, T.A. Heat Transfer for Subcooled Flow Boiling in Hypervapotron Configuration. Nucl. Technol. 2006, 164, 89–96. [Google Scholar] [CrossRef]
  20. Lemmon, E.; Huber, M.; Mclinden, M. NIST Standard Reference Database 23: Reference Fluid Thermodynamic and Transport Properties-REFPROP, Version 9.1; NIST: Gaithersburg, MD, USA, 2013.
  21. Zhu, G.; Bi, Q.; Yan, J.; Wang, T.; Zhao, J. Heat transfer characteristics of subcooled water in a hypervapotron under high mass fluxes and high heat fluxes. Int. J. Heat Mass Transf. 2019, 129, 580–590. [Google Scholar] [CrossRef]
  22. Coleman, H.W.; Steele, W.G. Engineering application of experimental uncertainty analysis. AIAA Journal 1995, 33, 1888–1896. [Google Scholar] [CrossRef]
  23. Celata, G.P.; Cumo, M.; Mariani, A. Experimental evaluation of the onset of subcooled flow boiling at high liquid velocity and subcooling. Int. J. Heat Mass Transf. 1997, 40, 2879–2885. [Google Scholar] [CrossRef]
  24. Hoffman, M.A.; Wong, C.F. Prediction of pressure drops in forced convection subcooled boiling water flows. Int. J. Heat Mass Transf. 1992, 35, 3291–3299. [Google Scholar] [CrossRef]
  25. Sieder, E.N.; Tate, G.E. Heat transfer and pressure drop of liquids in tubes. Ind. Eng. Chem. 1936, 28, 1429–1435. [Google Scholar] [CrossRef]
  26. Tong, W.; Bergles, A.E.; Jensen, M.K. Pressure drop with highly subcooled flow boiling in small-diameter tubes. Exp. Therm. Fluid Sci. 1997, 15, 202–212. [Google Scholar] [CrossRef]
  27. Tarasova, N.V.; Leontév, A.I. Hydraulic resistance during flow of water in heated pipes at supercritical pressures. High Temp. 1968, 6, 721–722. [Google Scholar]
  28. Owens, J.R.W.L.; Schrock, V.E. Local Pressure Gradients for Subcooled Boiling of Water in Vertical Tubes; ASME paper 60-WA-249; ASME: New York, NY, USA, 1960. [Google Scholar]
  29. Dormer, J.R.T.; Bergles, A.E. Pressure Drop with Surface Boiling in Small-Diameter Tubes; MIT Report, No.8767-31. Ph.D. Thesis, Massachusetts Institute of Technology, Cambridge, MA, USA, 1964. [Google Scholar]
  30. Baburajan, P.K.; Bisht, G.S.; Gupta, S.K.; Prabhu, S.V. Measurement of subcooled boiling pressure drop and local heat transfer coefficient in horizontal tube under LPLF conditions. Nucl. Eng. Des. 2013, 255, 169–179. [Google Scholar] [CrossRef]
  31. Kim, S.M.; Mudawar, I. Consolidated method to predicting pressure drop and heat transfer coefficient for both subcooled and saturated flow boiling in micro-channel heat sinks. Int. J. Heat Mass Transf. 2012, 55, 3720–3731. [Google Scholar] [CrossRef]
  32. Tarasova, N.V.; Leontiev, A.; Hlopushin, V.I.; Orlov, V.M. Pressure drop of boiling subcooled water and steam-water mixture flowing in heated channels. In Proceedings of the 3rd International Heat and Transfer Conference, Chicago, CA, USA, 7–12 August 1966; pp. 178–183. [Google Scholar]
  33. Hahne, E.; Spindler, K.; Skok, H. A new pressure drop correlation for subcooled flow boiling of refrigerants. Int. J. Heat Mass Transf. 1993, 36, 4267–4274. [Google Scholar] [CrossRef]
  34. Yan, J.; Guo, P.; Bi, Q.; Liu, Z.; Zhang, Q.; Yang, Z. Pressure drop for highly subcooled water flow boiling under high heat and mass fluxes. Appl. Therm. Eng. 2017, 124, 1061–1074. [Google Scholar] [CrossRef]
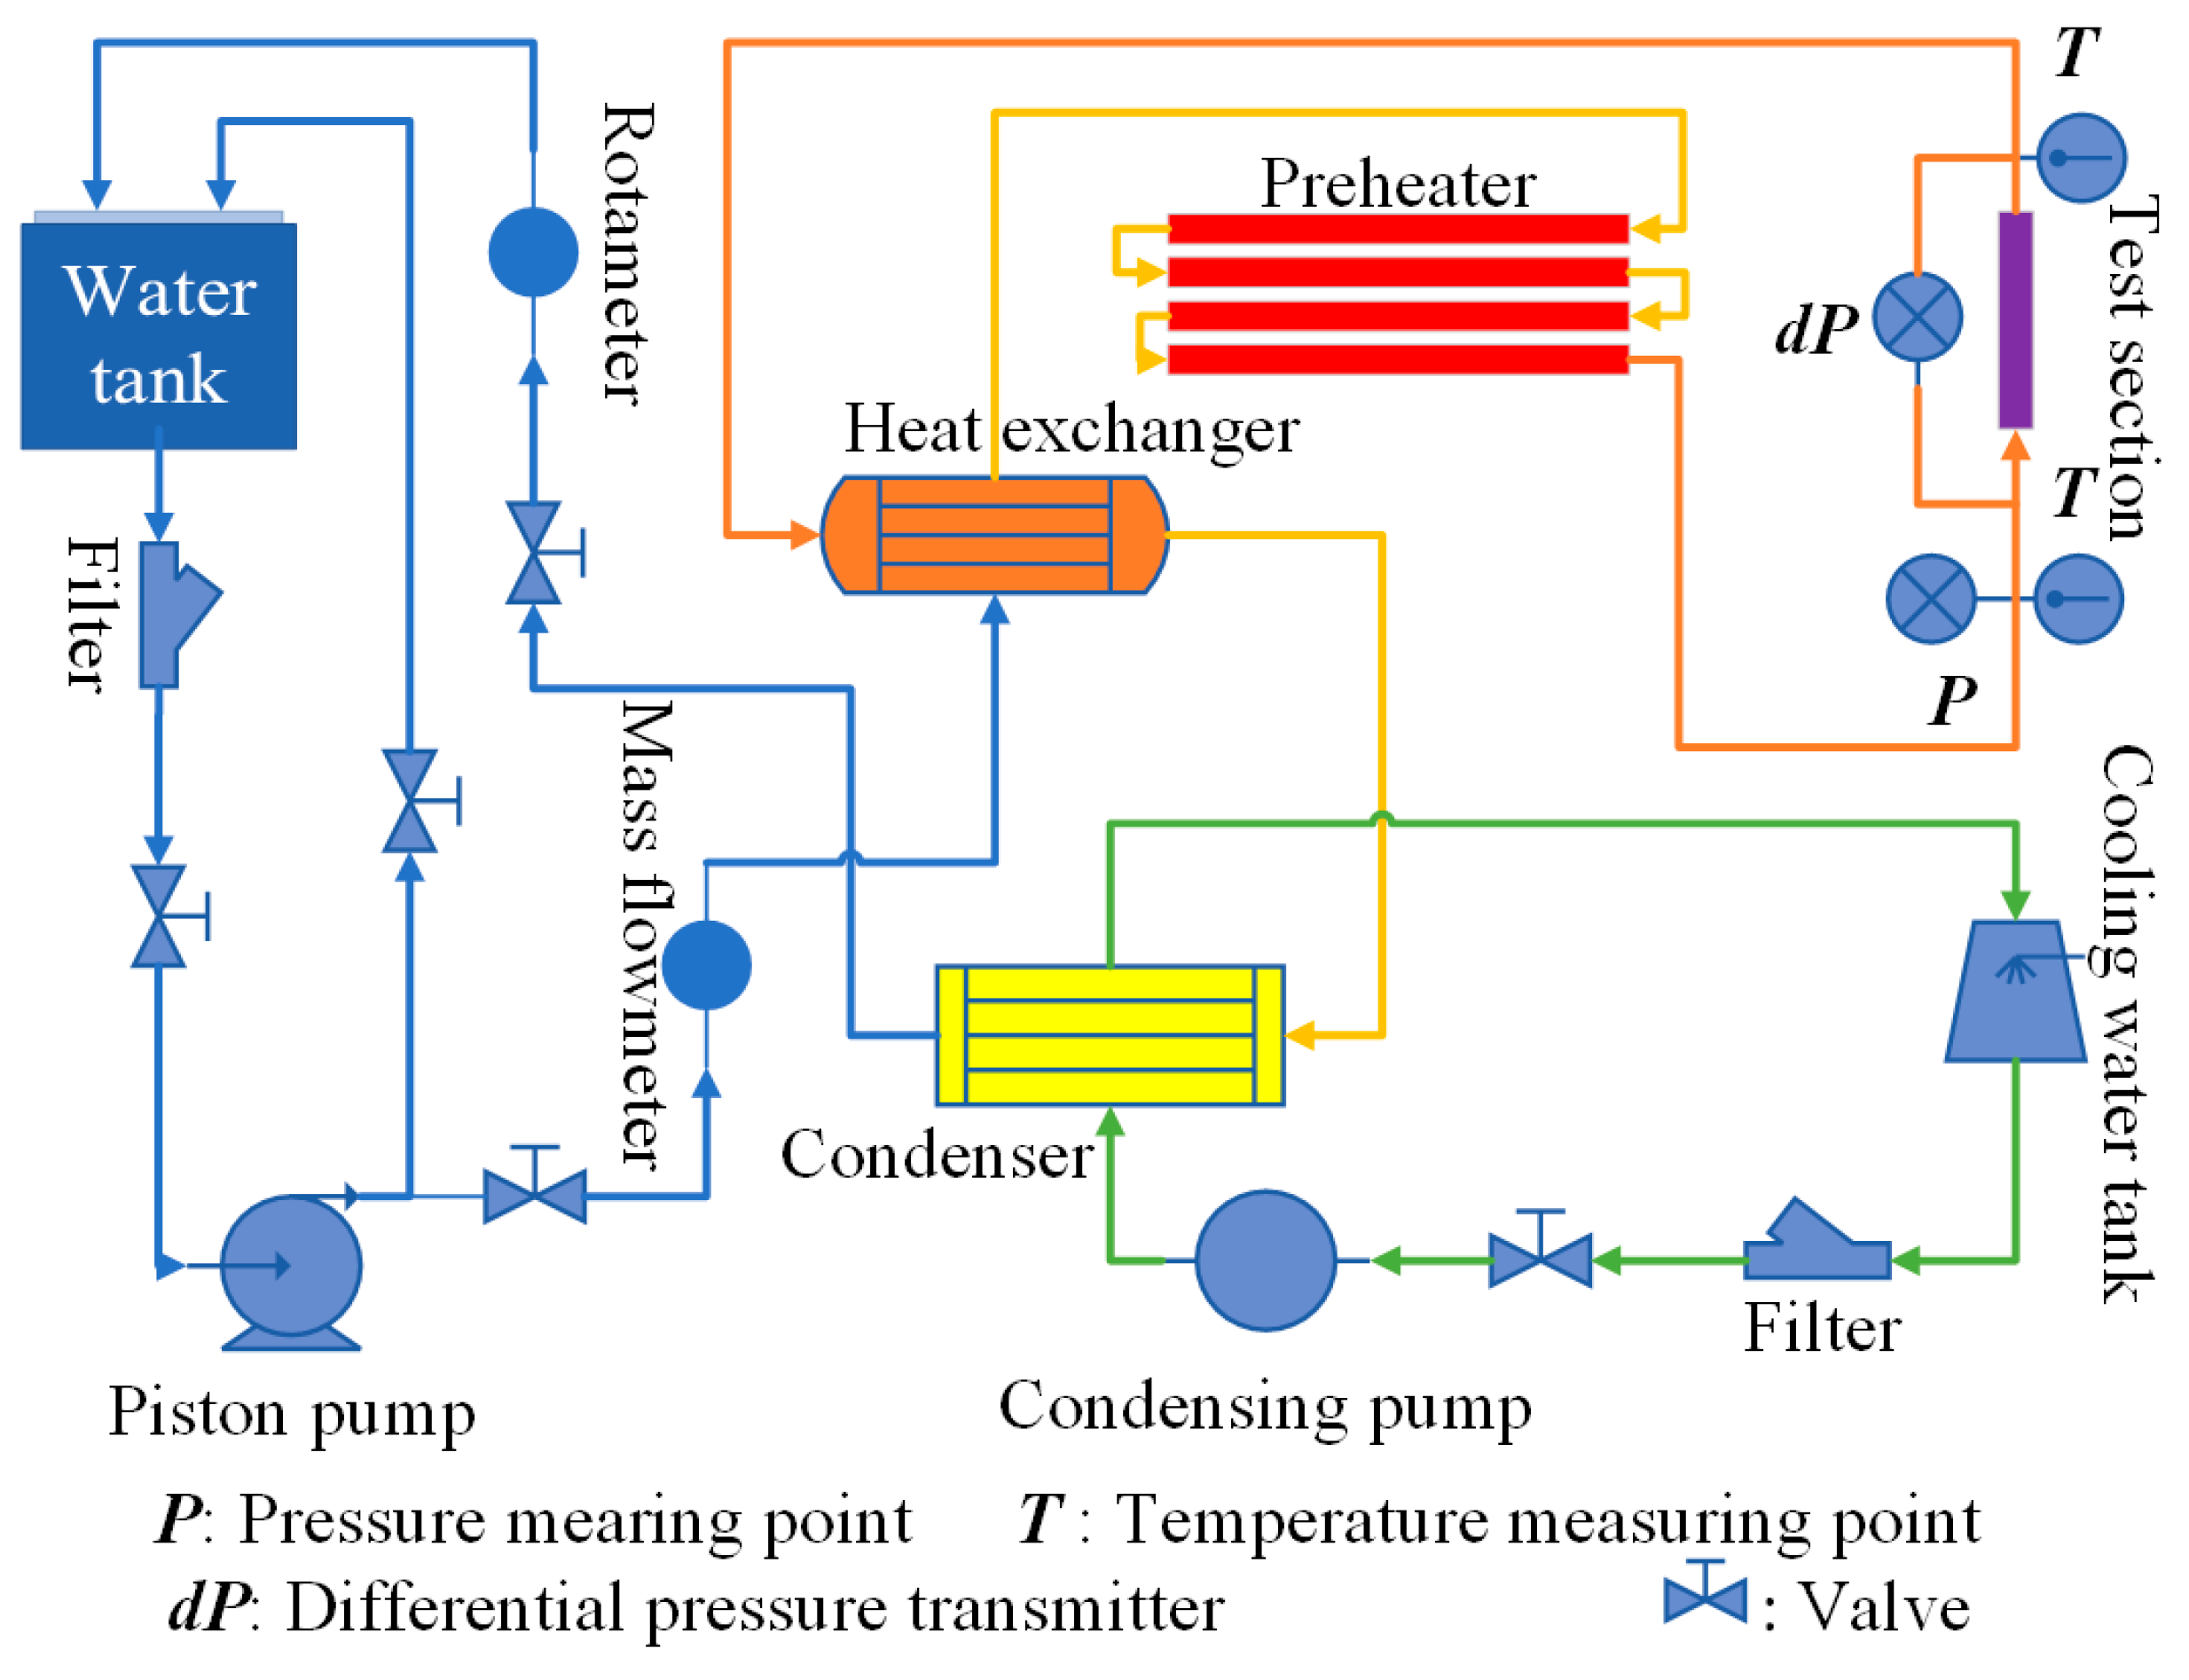
Figure 1. Schematic of the test loop.
Energies 16 08121 g001
Figure 2. Images of the test section. (a) Compositions of the test section. (b) General appearance of the test section.
Energies 16 08121 g002
Figure 3. Geometric structure and dimension of the test section. (a) The top-view without cover. (b) The top-view with cover. (c) The cross-section along the stream. (d) The cross-section perpendicular to the stream. (Red circles are temperature measuring positions).
Energies 16 08121 g003
Figure 4. The typical pressure drop curve and heat transfer curve.
Energies 16 08121 g004
Figure 5. Effect of pressure on pressure drop: (a) single-phase condition; (b) subcooled boiling condition.
Energies 16 08121 g005
Figure 6. Effect of mass flux on pressure drop.
Energies 16 08121 g006
Figure 7. Effect of heat flux on pressure drop.
Energies 16 08121 g007
Figure 8. Comparison of the experimental and predicted f/fad using the correlations for single-phase pressure drop [23,24,25,26,27,28,29].
Energies 16 08121 g008
Figure 9. Comparison of the experimental and predicted Φ2 using the Owens–Schrock correlation.
Energies 16 08121 g009
Figure 10. Effect of mass flux on f/fad.
Energies 16 08121 g010
Figure 11. Distribution of prediction error for the new pressure drop correlation of the hypervapotron in this paper: (a) f/fad (Calculated) vs. f/fad (Experimental); (b) Relative error vs. f/fad (Experimental).
Energies 16 08121 g011
Table 1. Experimental conditions of the pressure drop tests.
Experimental ConditionsCharacteristics
Test sectionHypervapotron
Material321 Stainless Steel
Heating modeElectrically heated
Effective flowing channel size40 mm × 7.29 mm
Effective heating length290 mm
Inlet pressure2.7–3.7 MPa
Mass flux2000–5000 kg·m−2·s−1
The effective radiating heat flux0–5 MW·m−2
Inlet bulk temperature40–230 °C
Table 2. Uncertainties of the main parameters in the test.
ParametersUnitsUncertainties (%)
PressureMPa±0.25
Mass fluxkg·m−2·s−1±0.25
Heat fluxMW·m−2±4.9
Fluid temperature°C±0.5
Outer wall temperature°C±0.4
Pressure dropkPa±5.5
Table 3. Empirical correlations for single-phase pressure drop of heated flow.
AuthorsCorrelationsP/MPaG/(kg∙m−2∙s−1)q/(MW∙m−2)
Celata [23]f/fad = (ηw/ηb)0.251~2.55000~10,000<14
Hoffman [24]f/fad = (ηw/ηb)0.30.2~2.82500~10,000<9.7
Sieder [25]f/fad = (ηw/ηb)0.14Not mentioned25~387<0.013
Tong [26]f/fad = (ηw/ηb)0.1630.4~1.625,000~45,000<80
Tarasova [27]f/fad = (ηw/ηb)0.2222.6~26.52000, 50000.58~1.32
Owens [28]f/fad = (ηw/ηb)0.40.34~2.761143~53220.675–4
Dormer [29]f/fad = (ηw/ηb)0.350.2~0.551500~15,000<17.35
Disclaimer/Publisher’s Note: The statements, opinions and data contained in all publications are solely those of the individual author(s) and contributor(s) and not of MDPI and/or the editor(s). MDPI and/or the editor(s) disclaim responsibility for any injury to people or property resulting from any ideas, methods, instructions or products referred to in the content.