
Oxygen Reduction at PtNi Alloys in Direct Methanol Fuel Cells—Electrode Development and Characterization

 ,
,  ,
, 
Abstract
1. Introduction
2. Materials and Methods
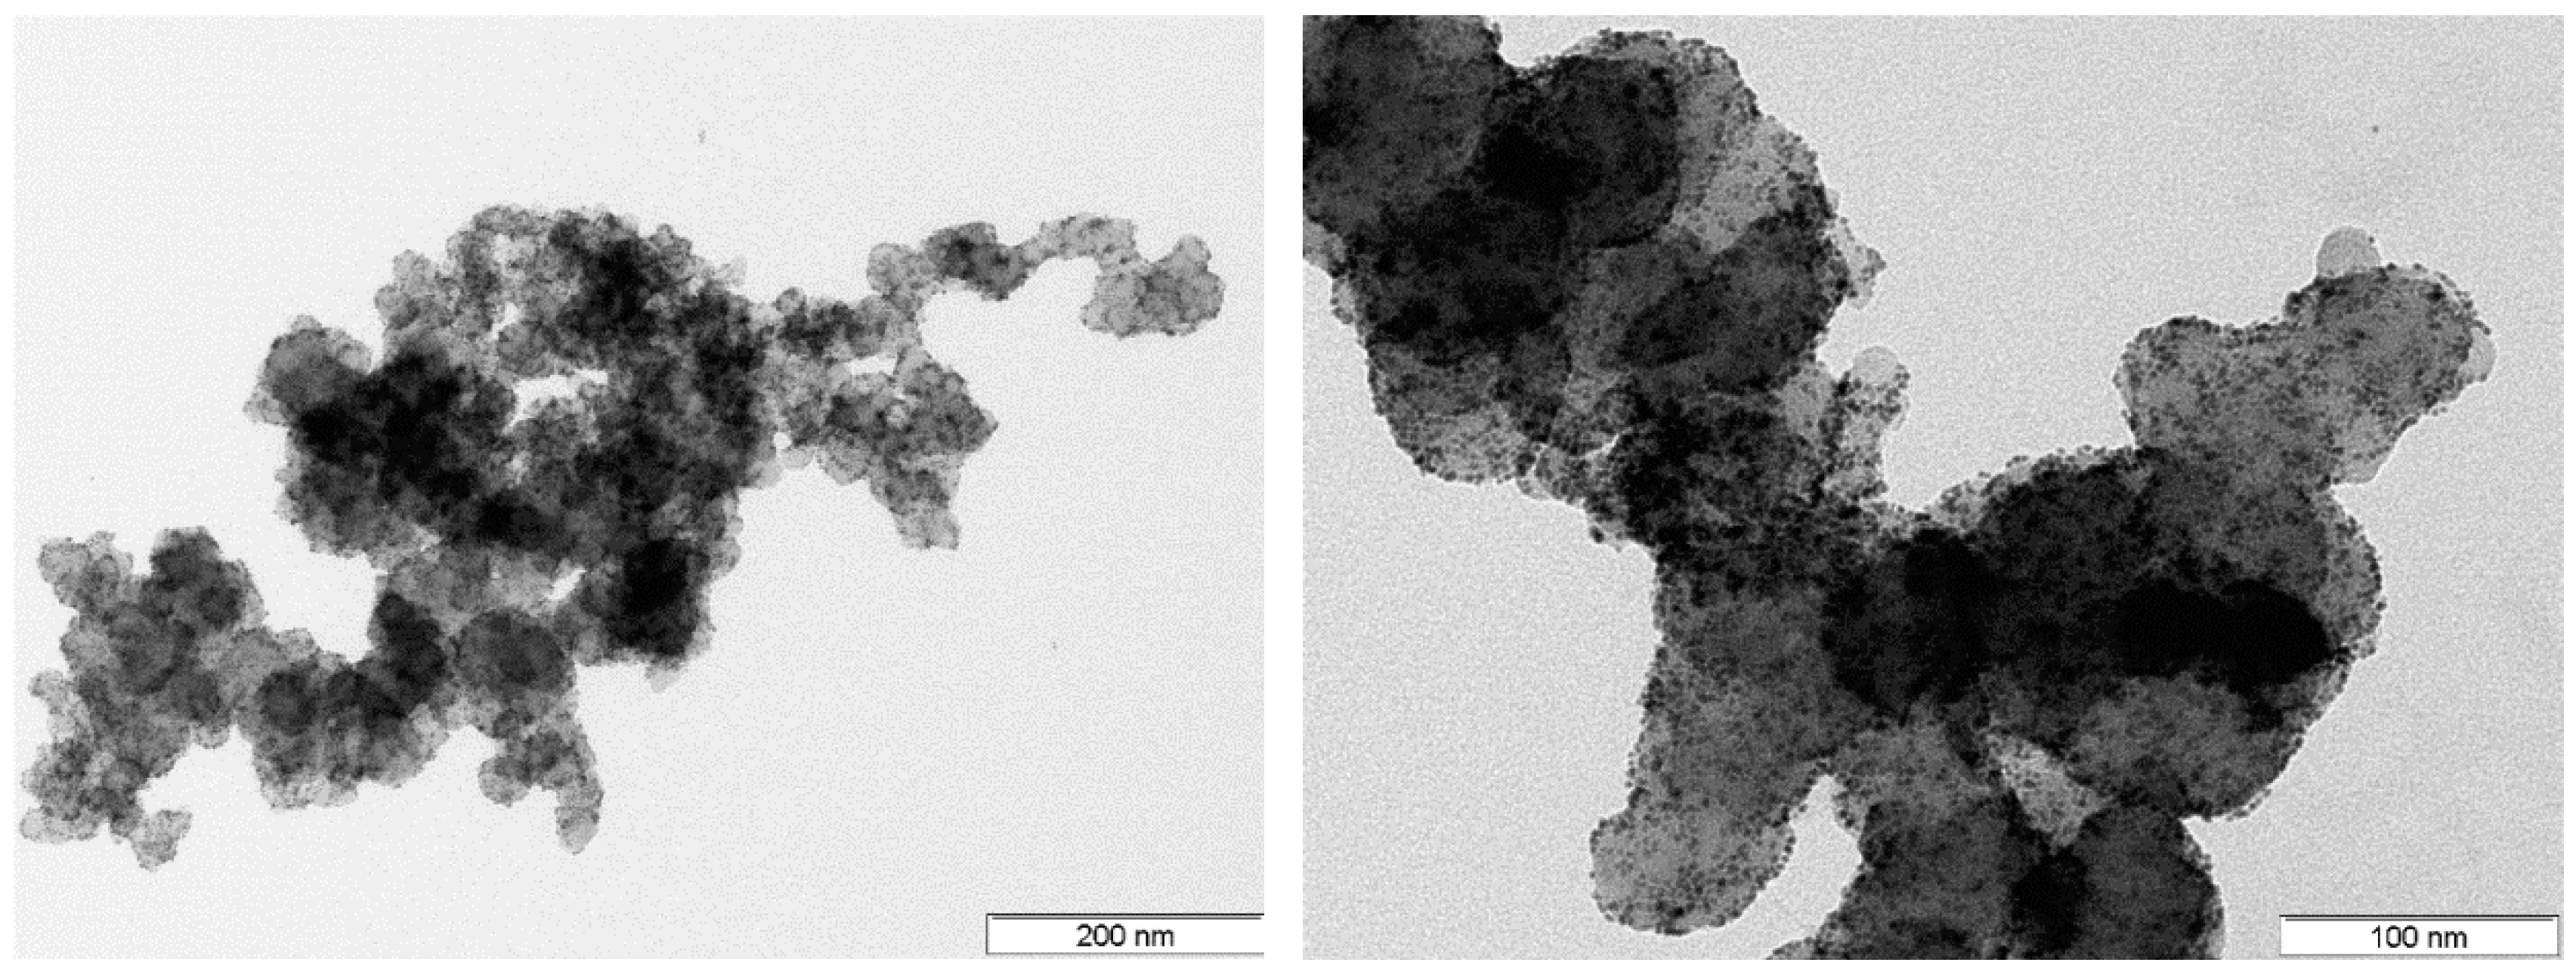
2.1. Materials, Chemicals, and Catalyst Synthesis
2.2. Preparation and Fabrication
2.3. Characterization Methodes
3. Results
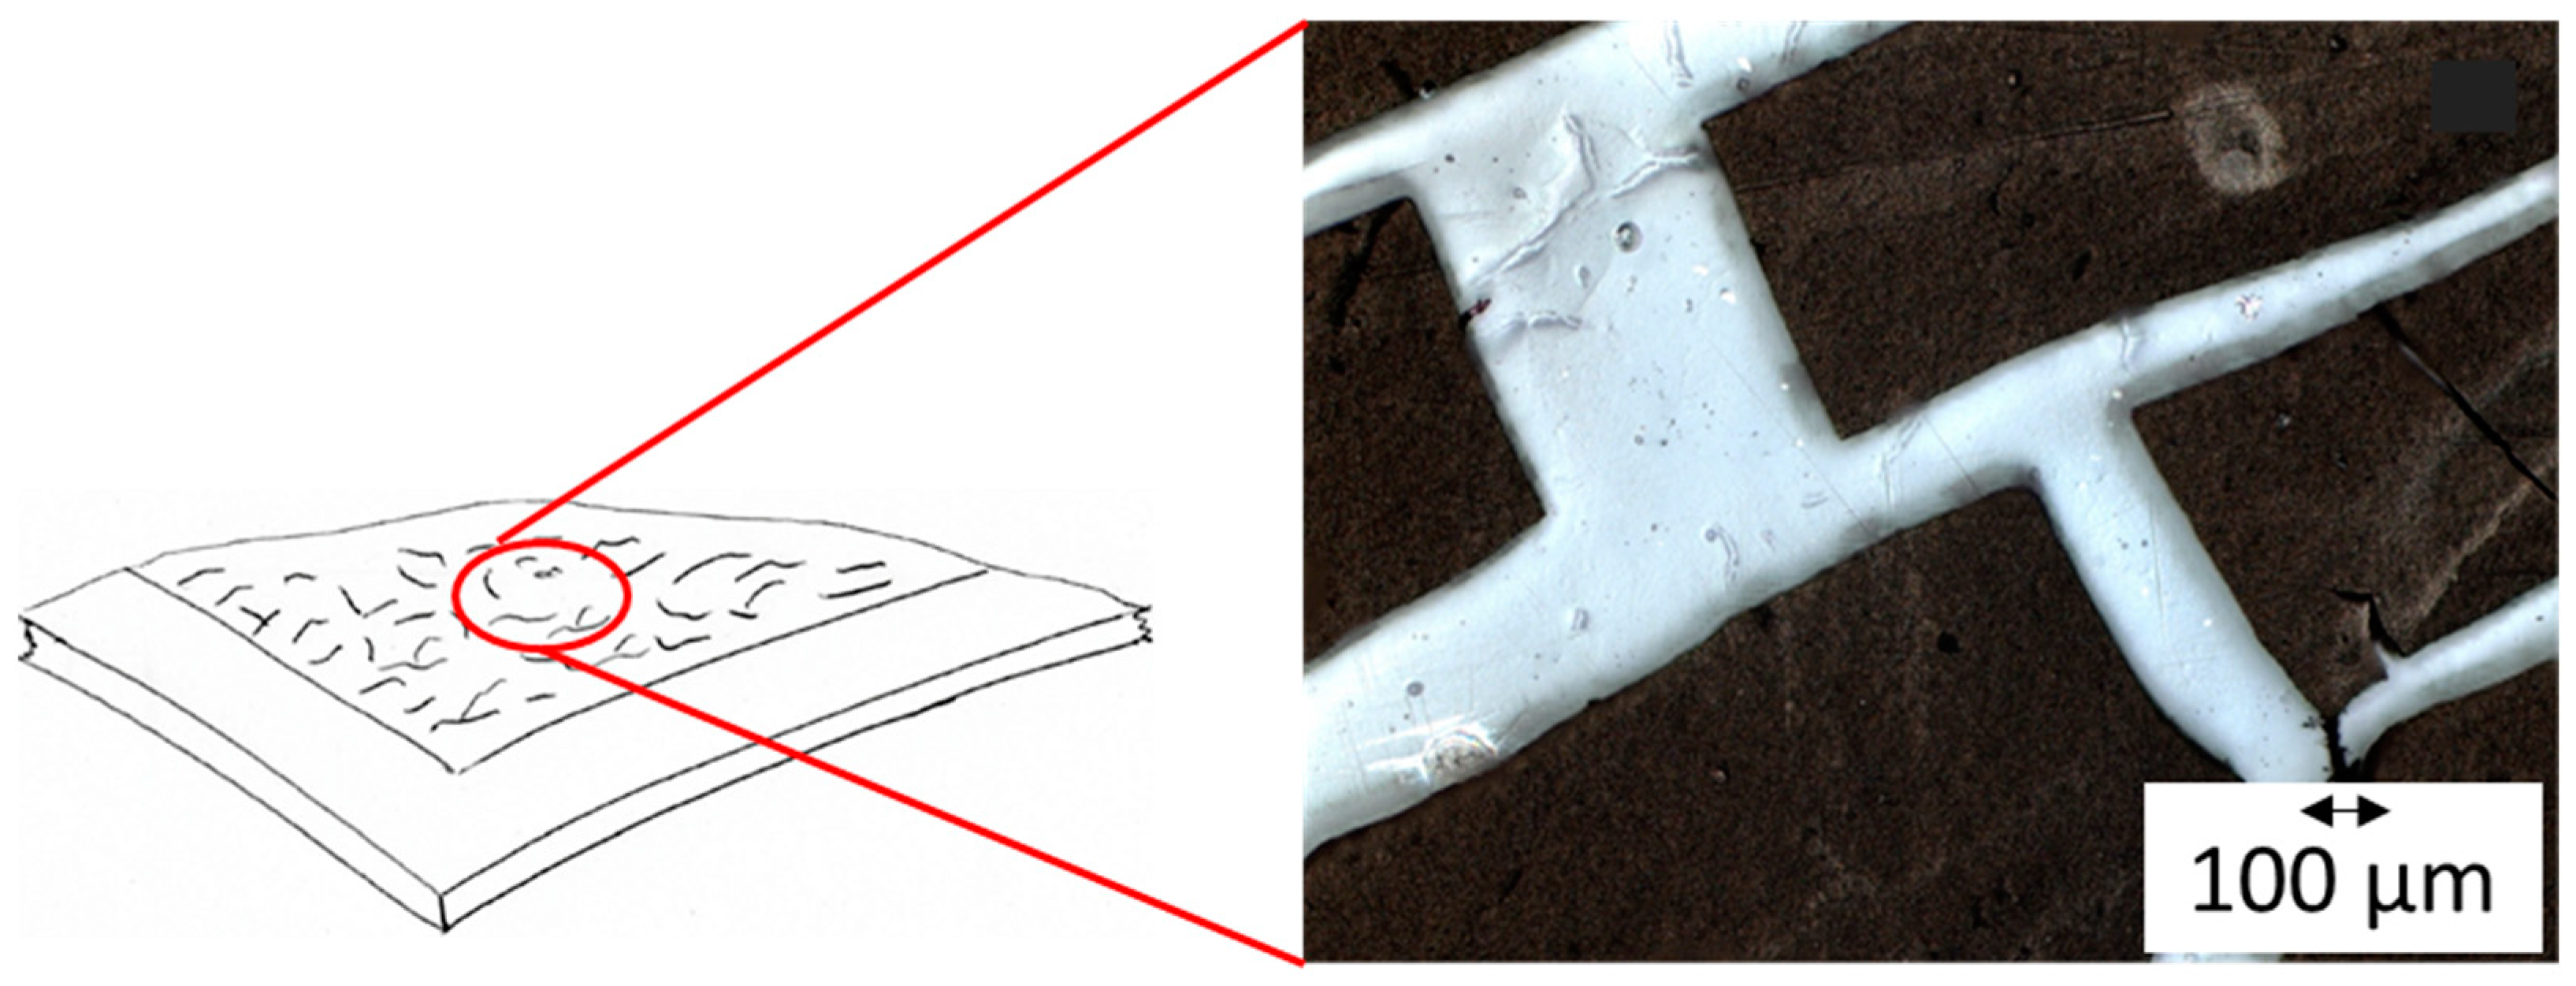
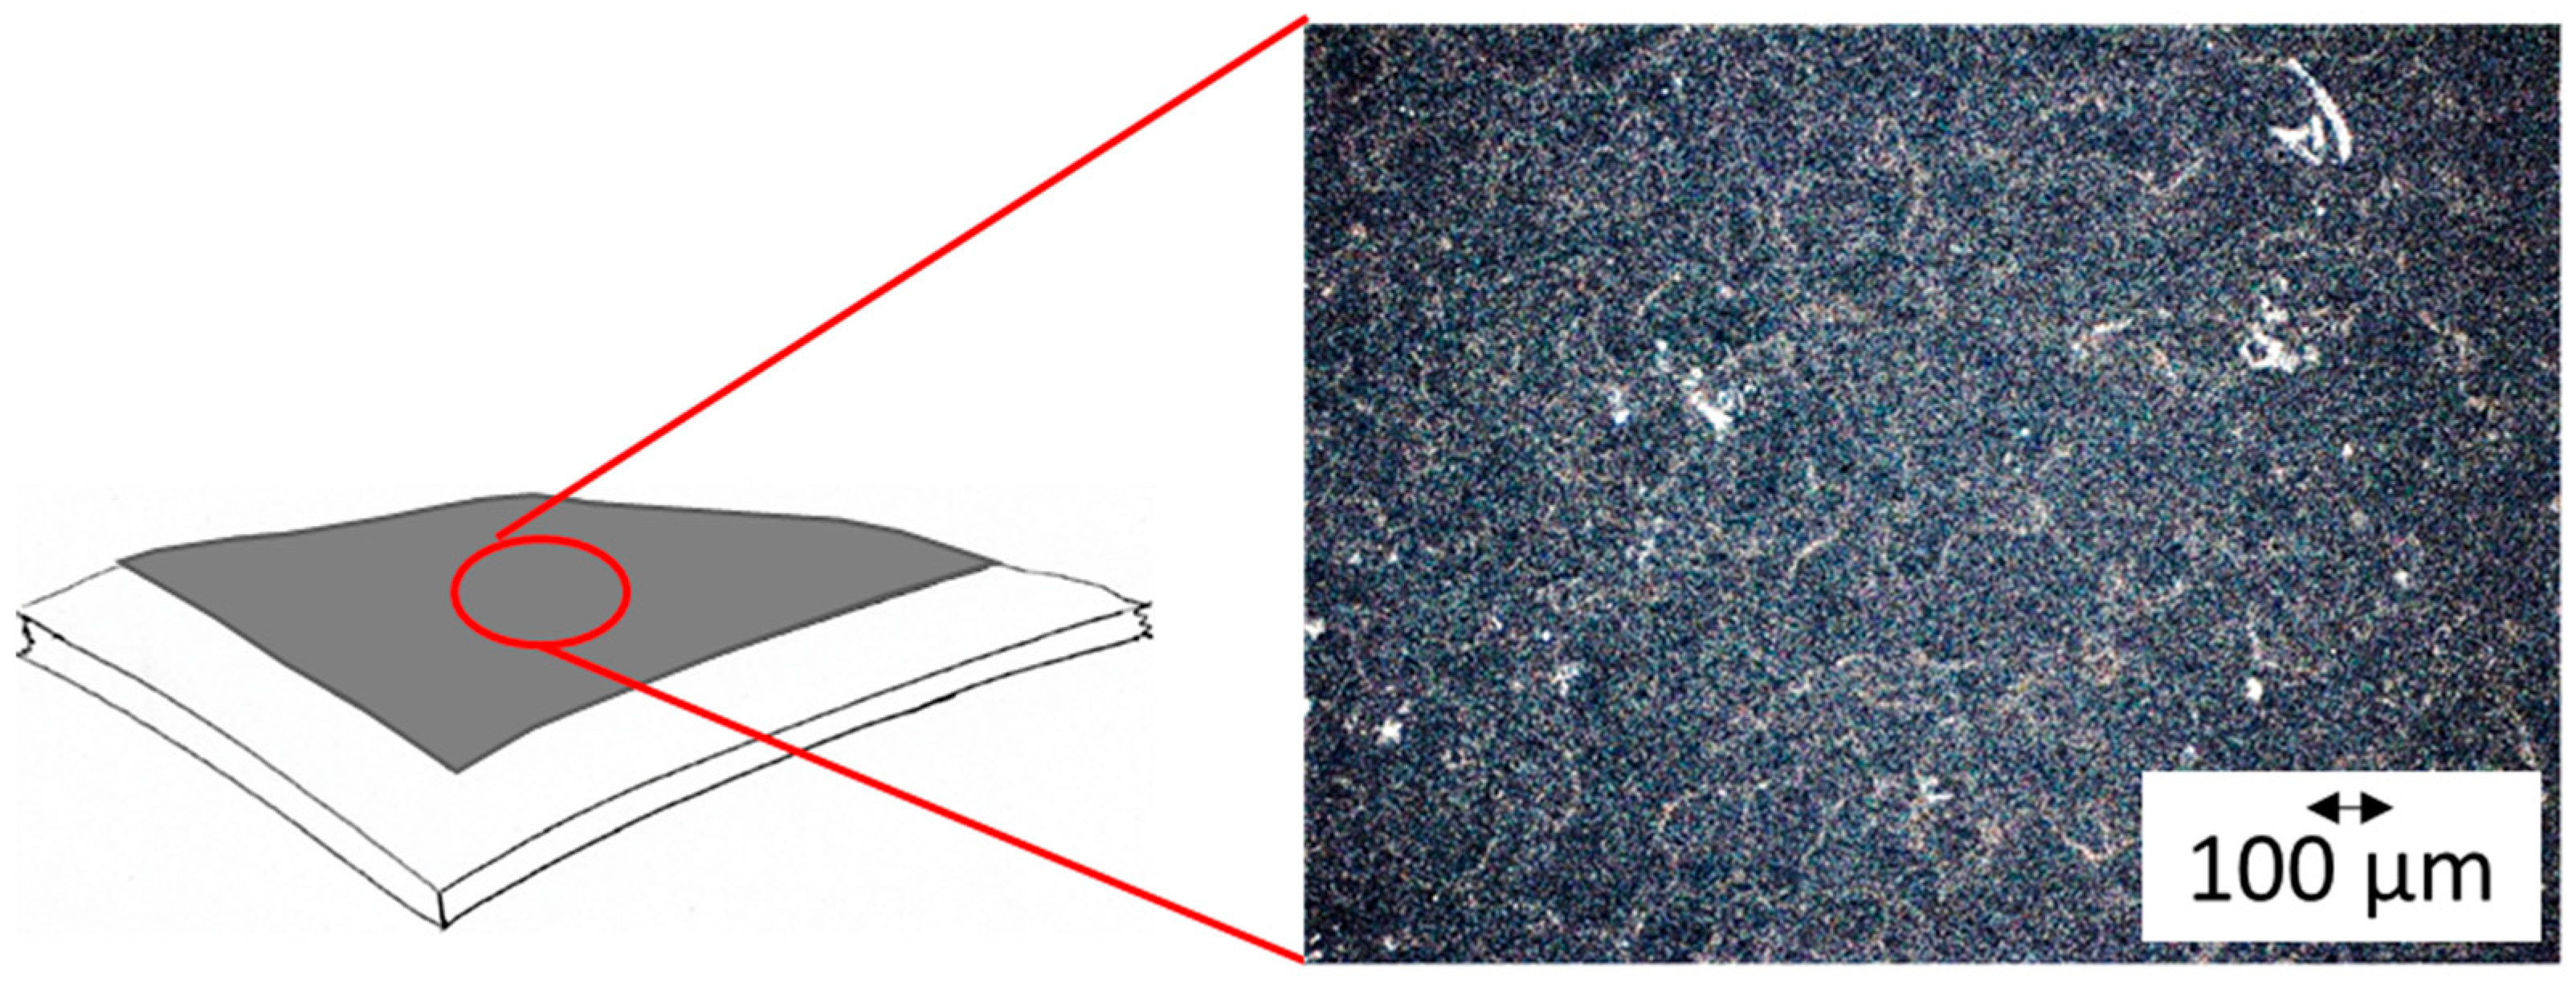
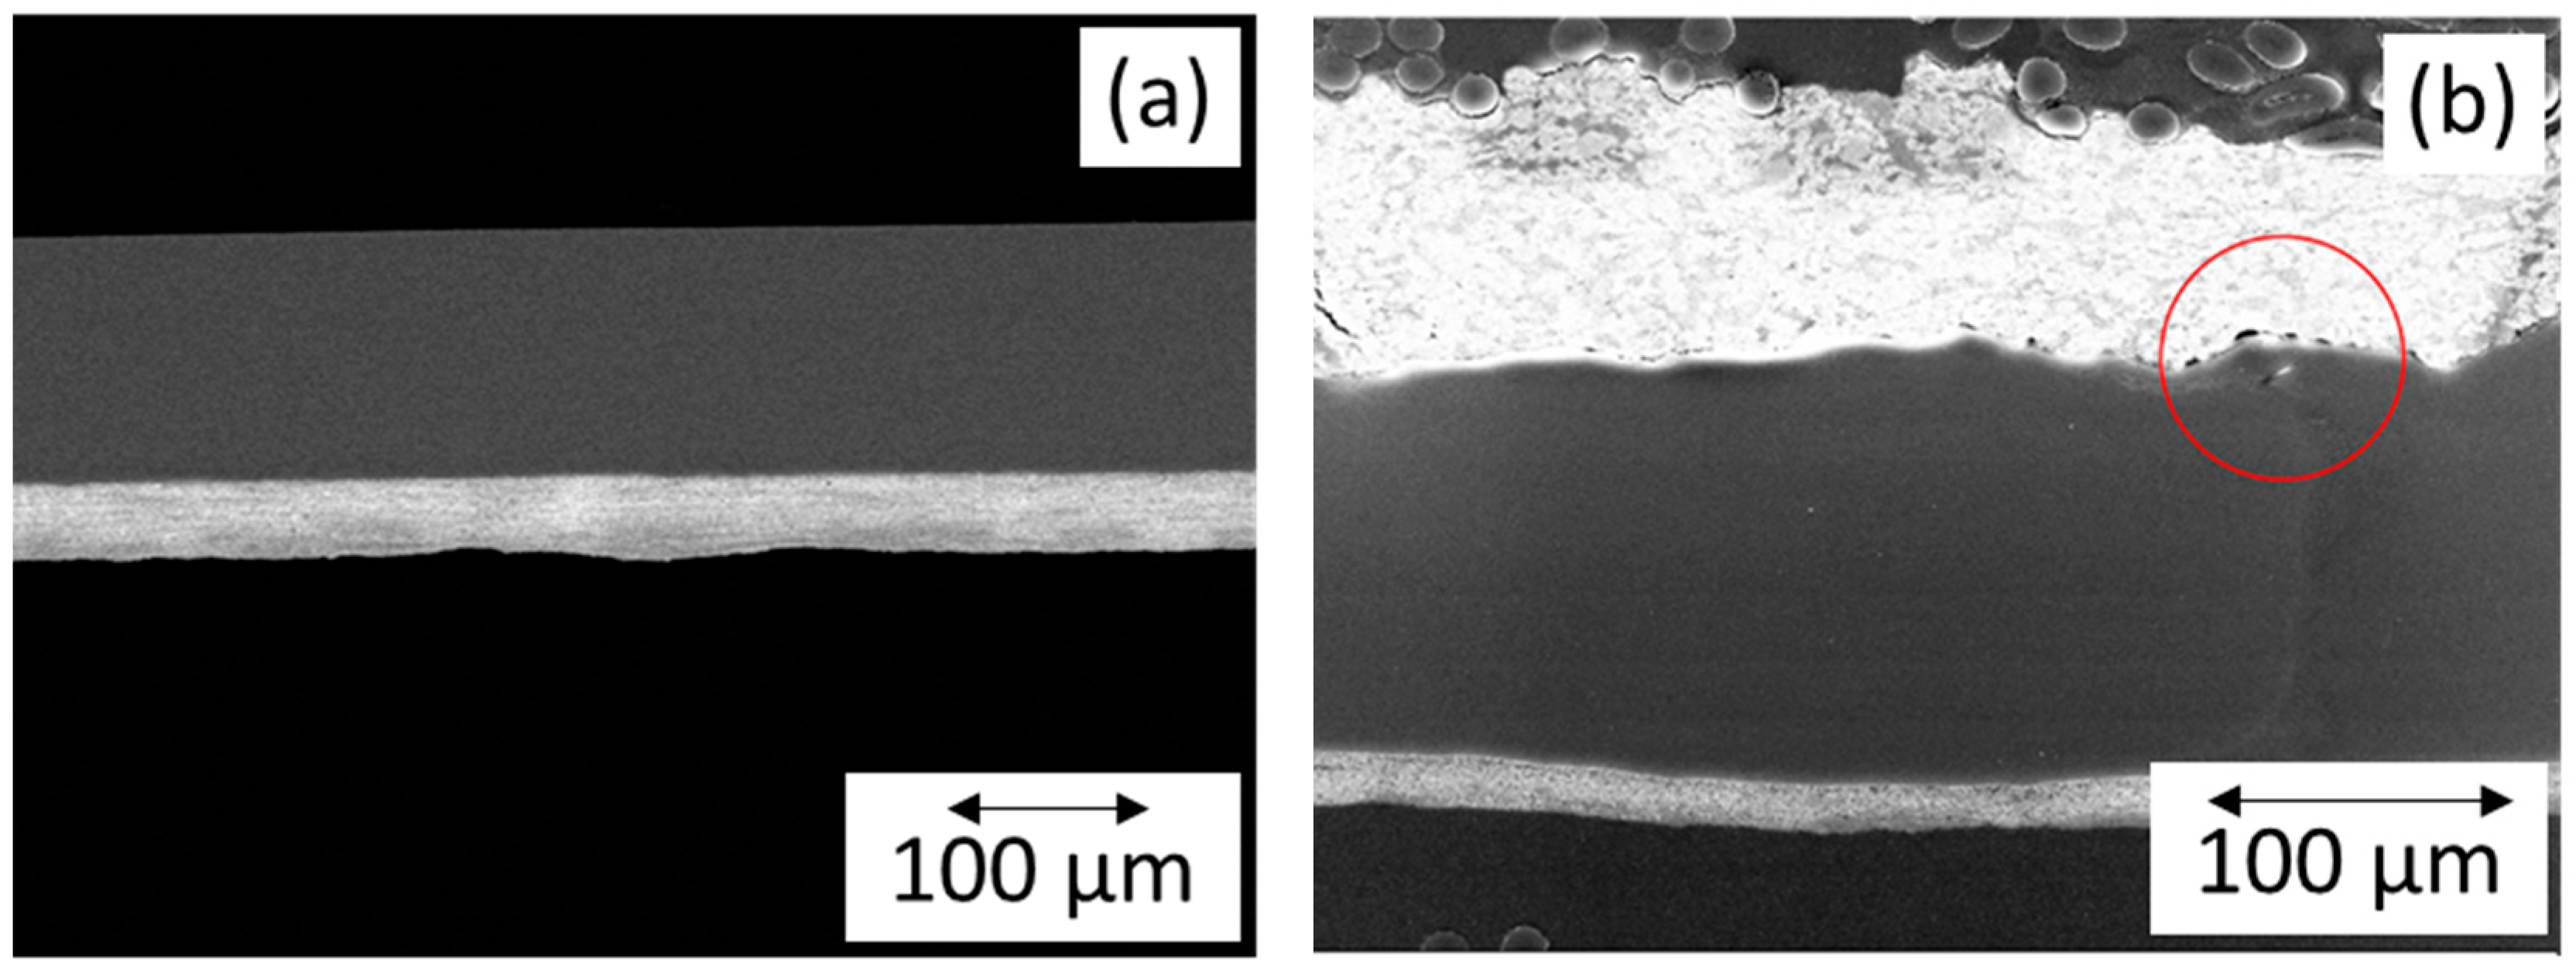
3.1. Fabrication Method
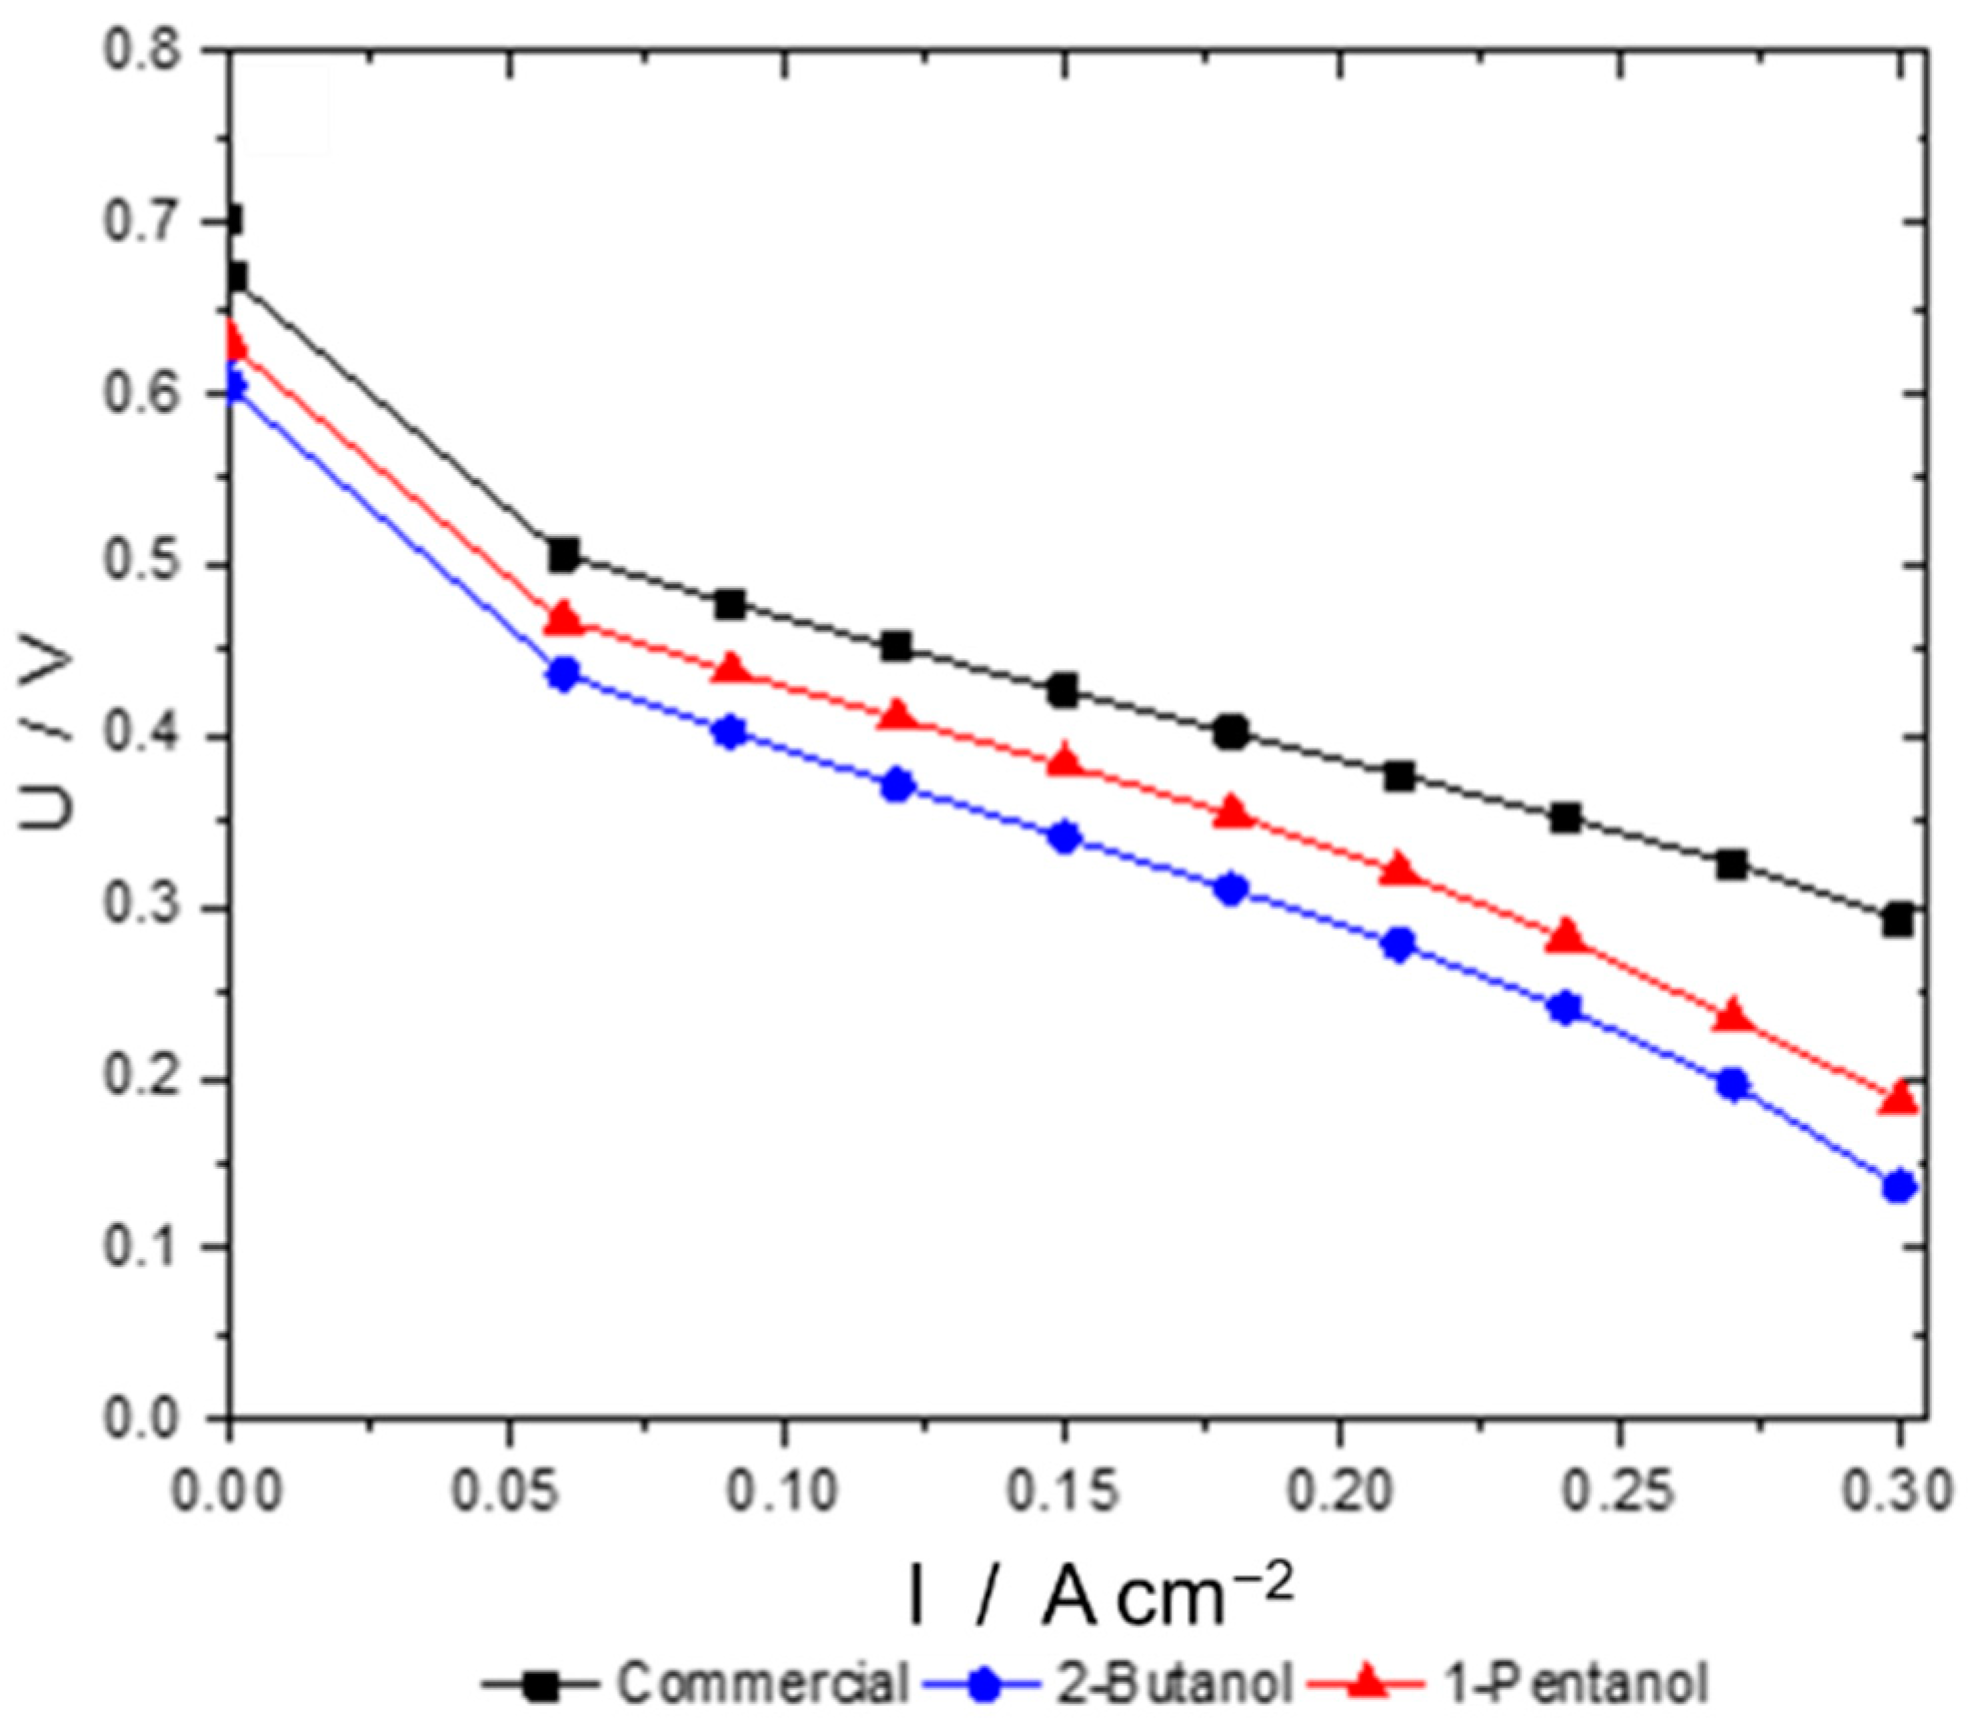
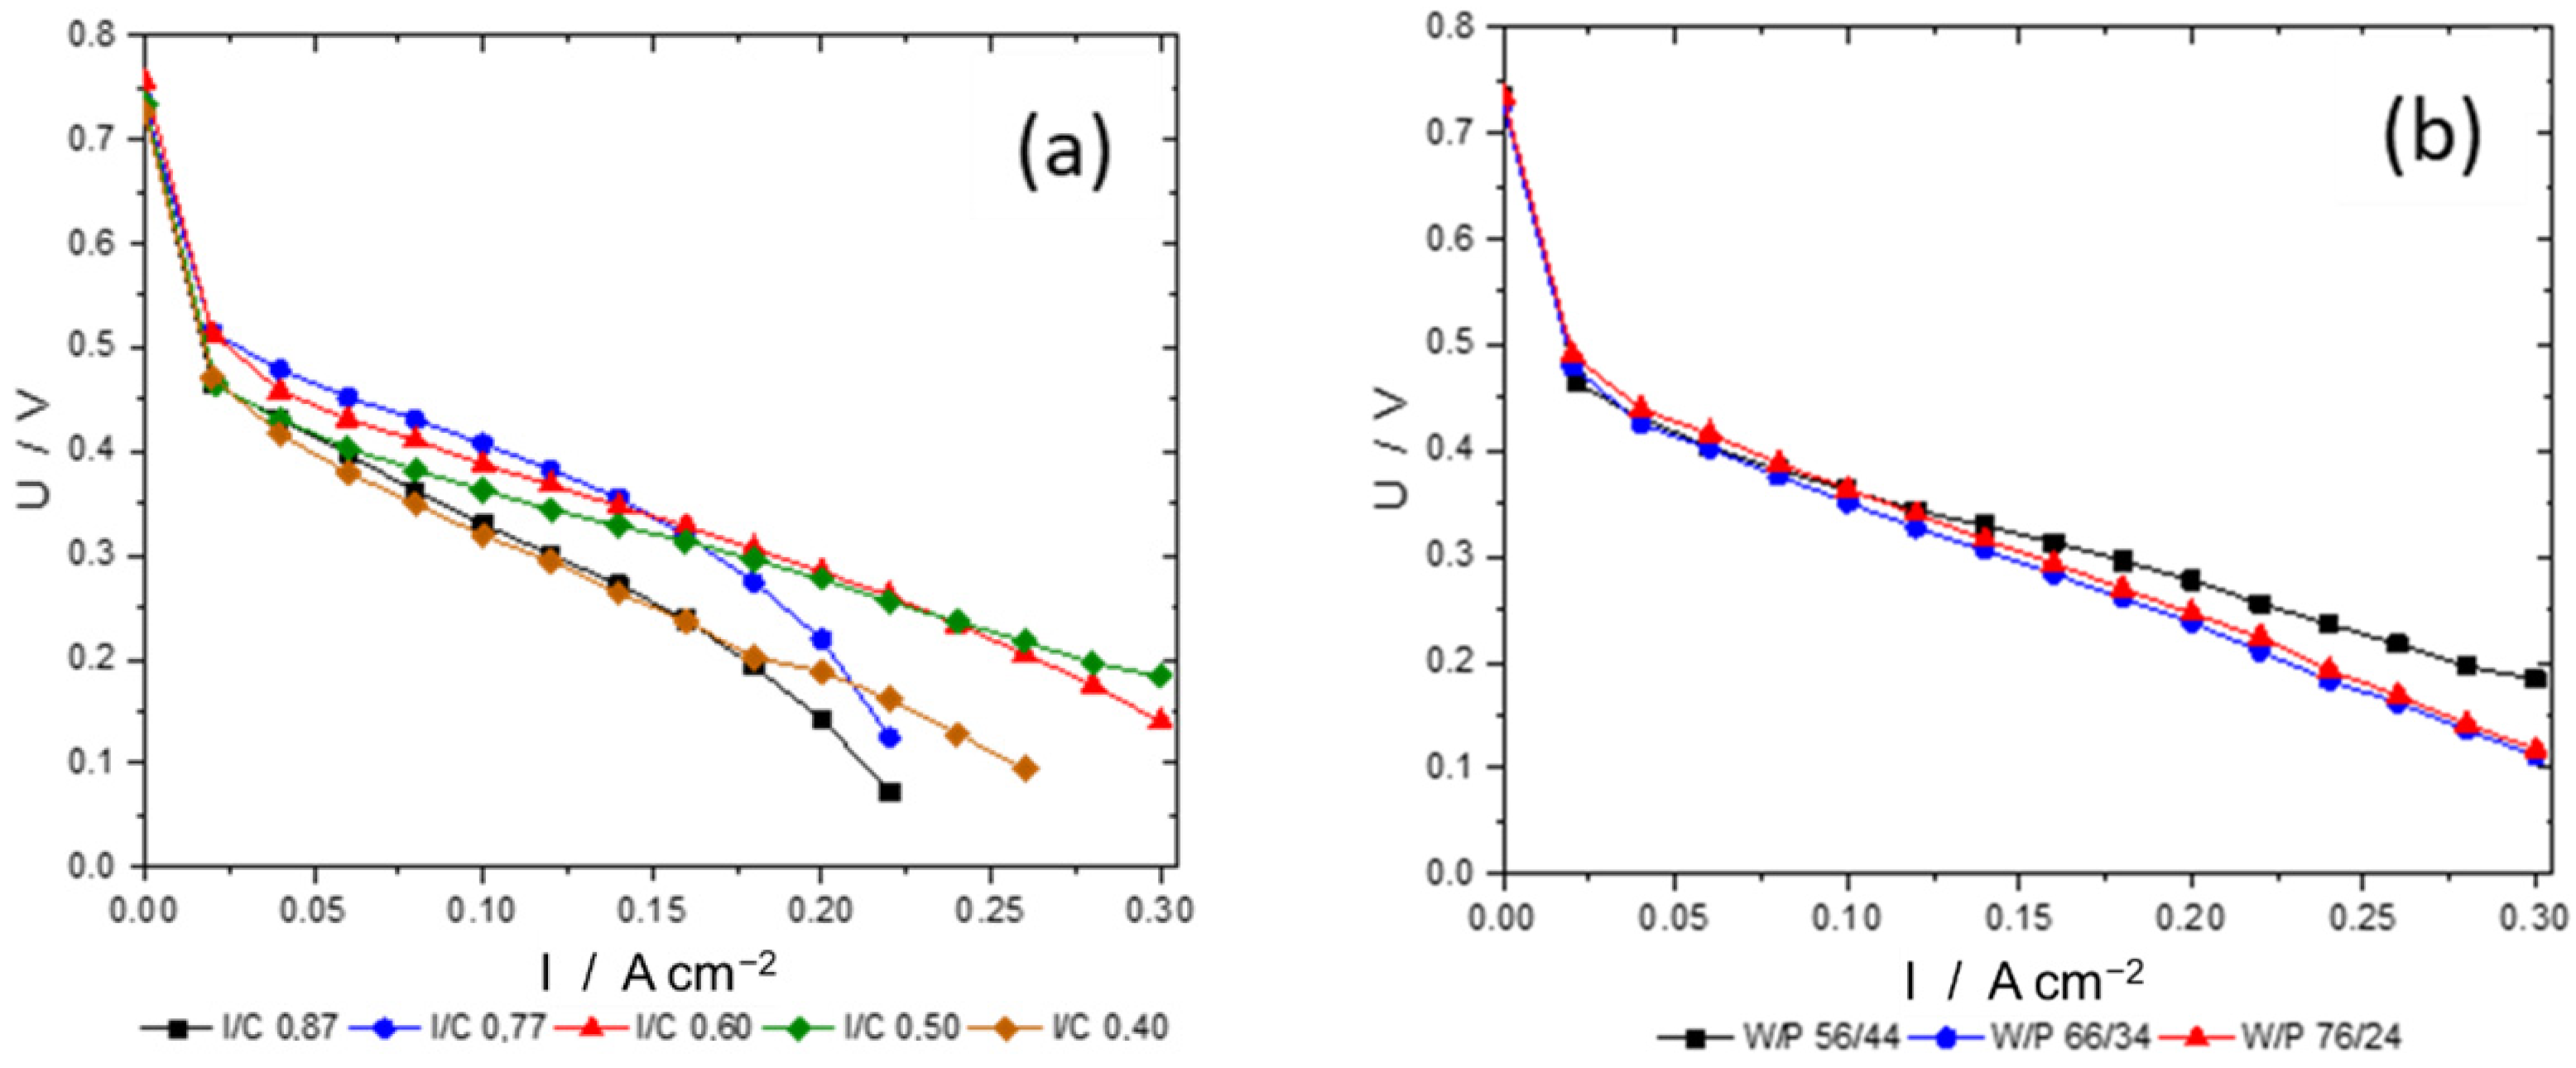
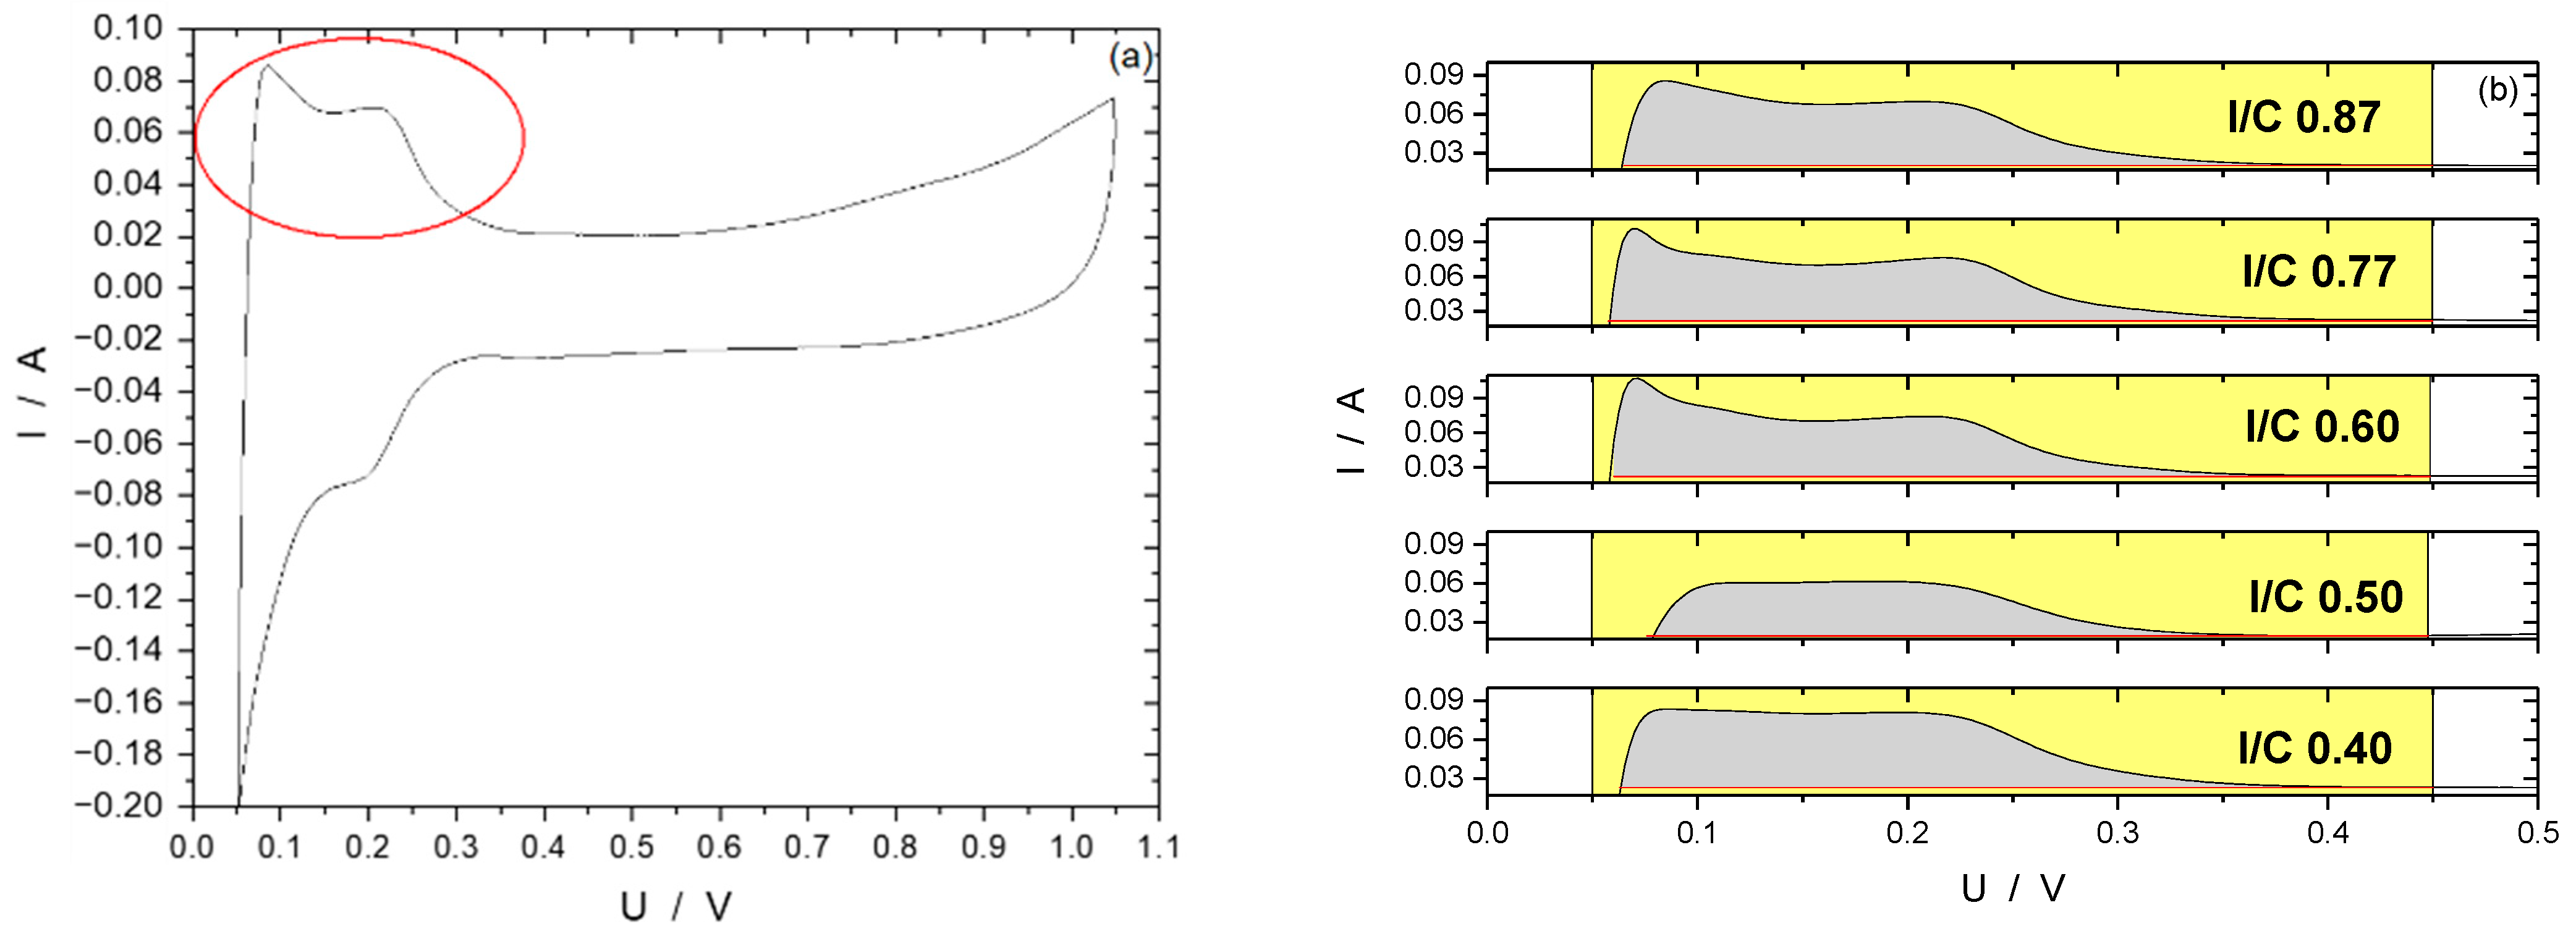
3.2. Ink Preparation and Optimization of Spray-Coated Electrodes
- (a)
- The ionomer-to-carbon ratio (I/C);
- (b)
- The water-to-propanol ratio (W/P);
- (c)
- Catalyst loadings.
- Catalytically active sites are covered by the ionomer, leading to an inhomogeneous oxygen distribution within the catalyst layer [43].
- As these ink formulations have high ionomer contents, they also bind permeated water and the water resulting from the oxygen reduction reaction to a higher degree, which leads to a detrimental water management at the micropores at the cathode electrode and, again, there is an inhomogeneous oxygen distribution within the electrode.
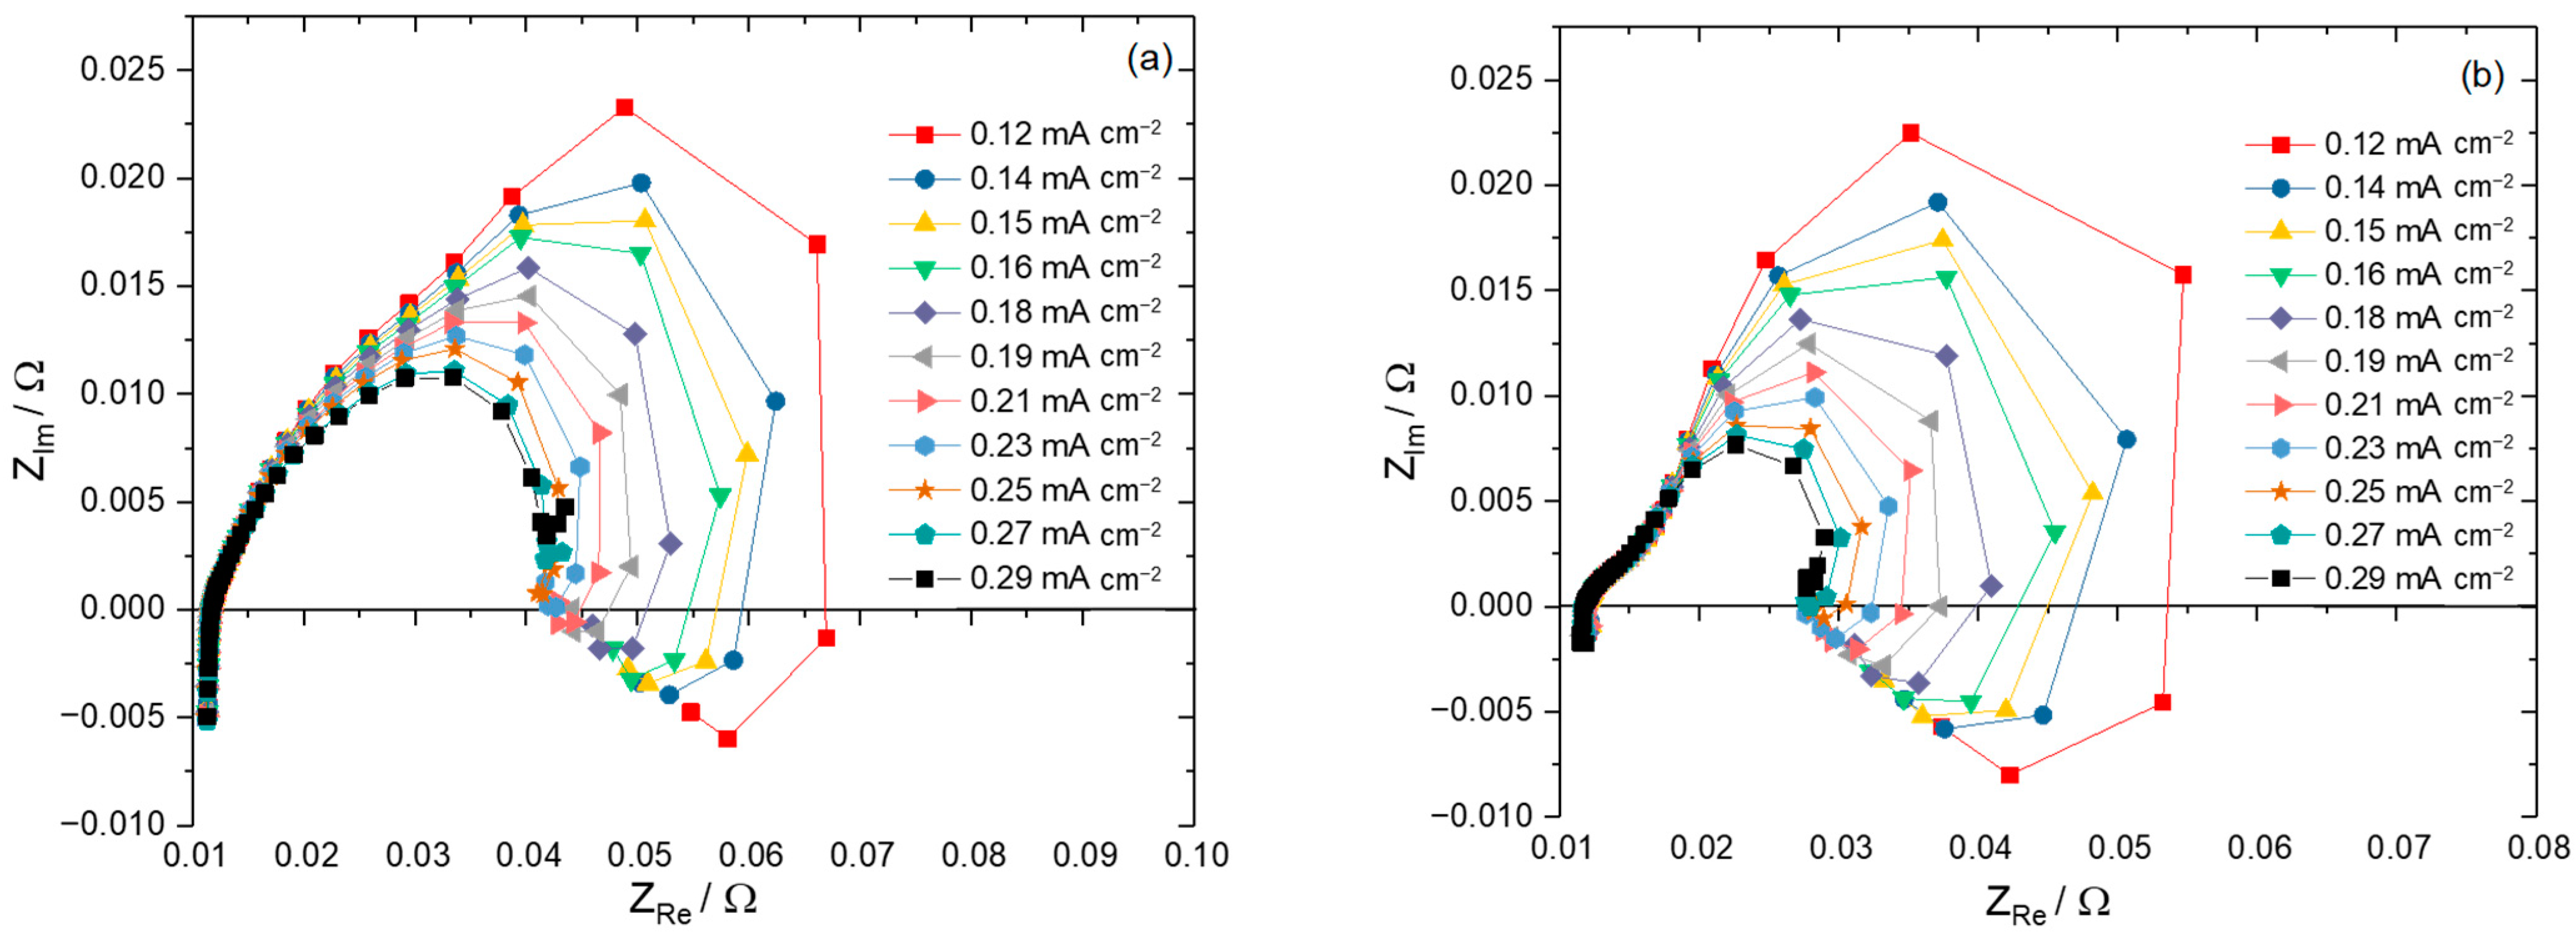
- In the case of this work, there is no ohmic resistance needed as all ohmic resistances (i.e., membrane, bipolar plates, endplates, etc.) are eliminated by the subtraction of anode half-cell impedances from single cell impedances.
- In our measurements, a third phase shift was detected in the Bode plot, which was assumed to be a mass diffusion limitation.
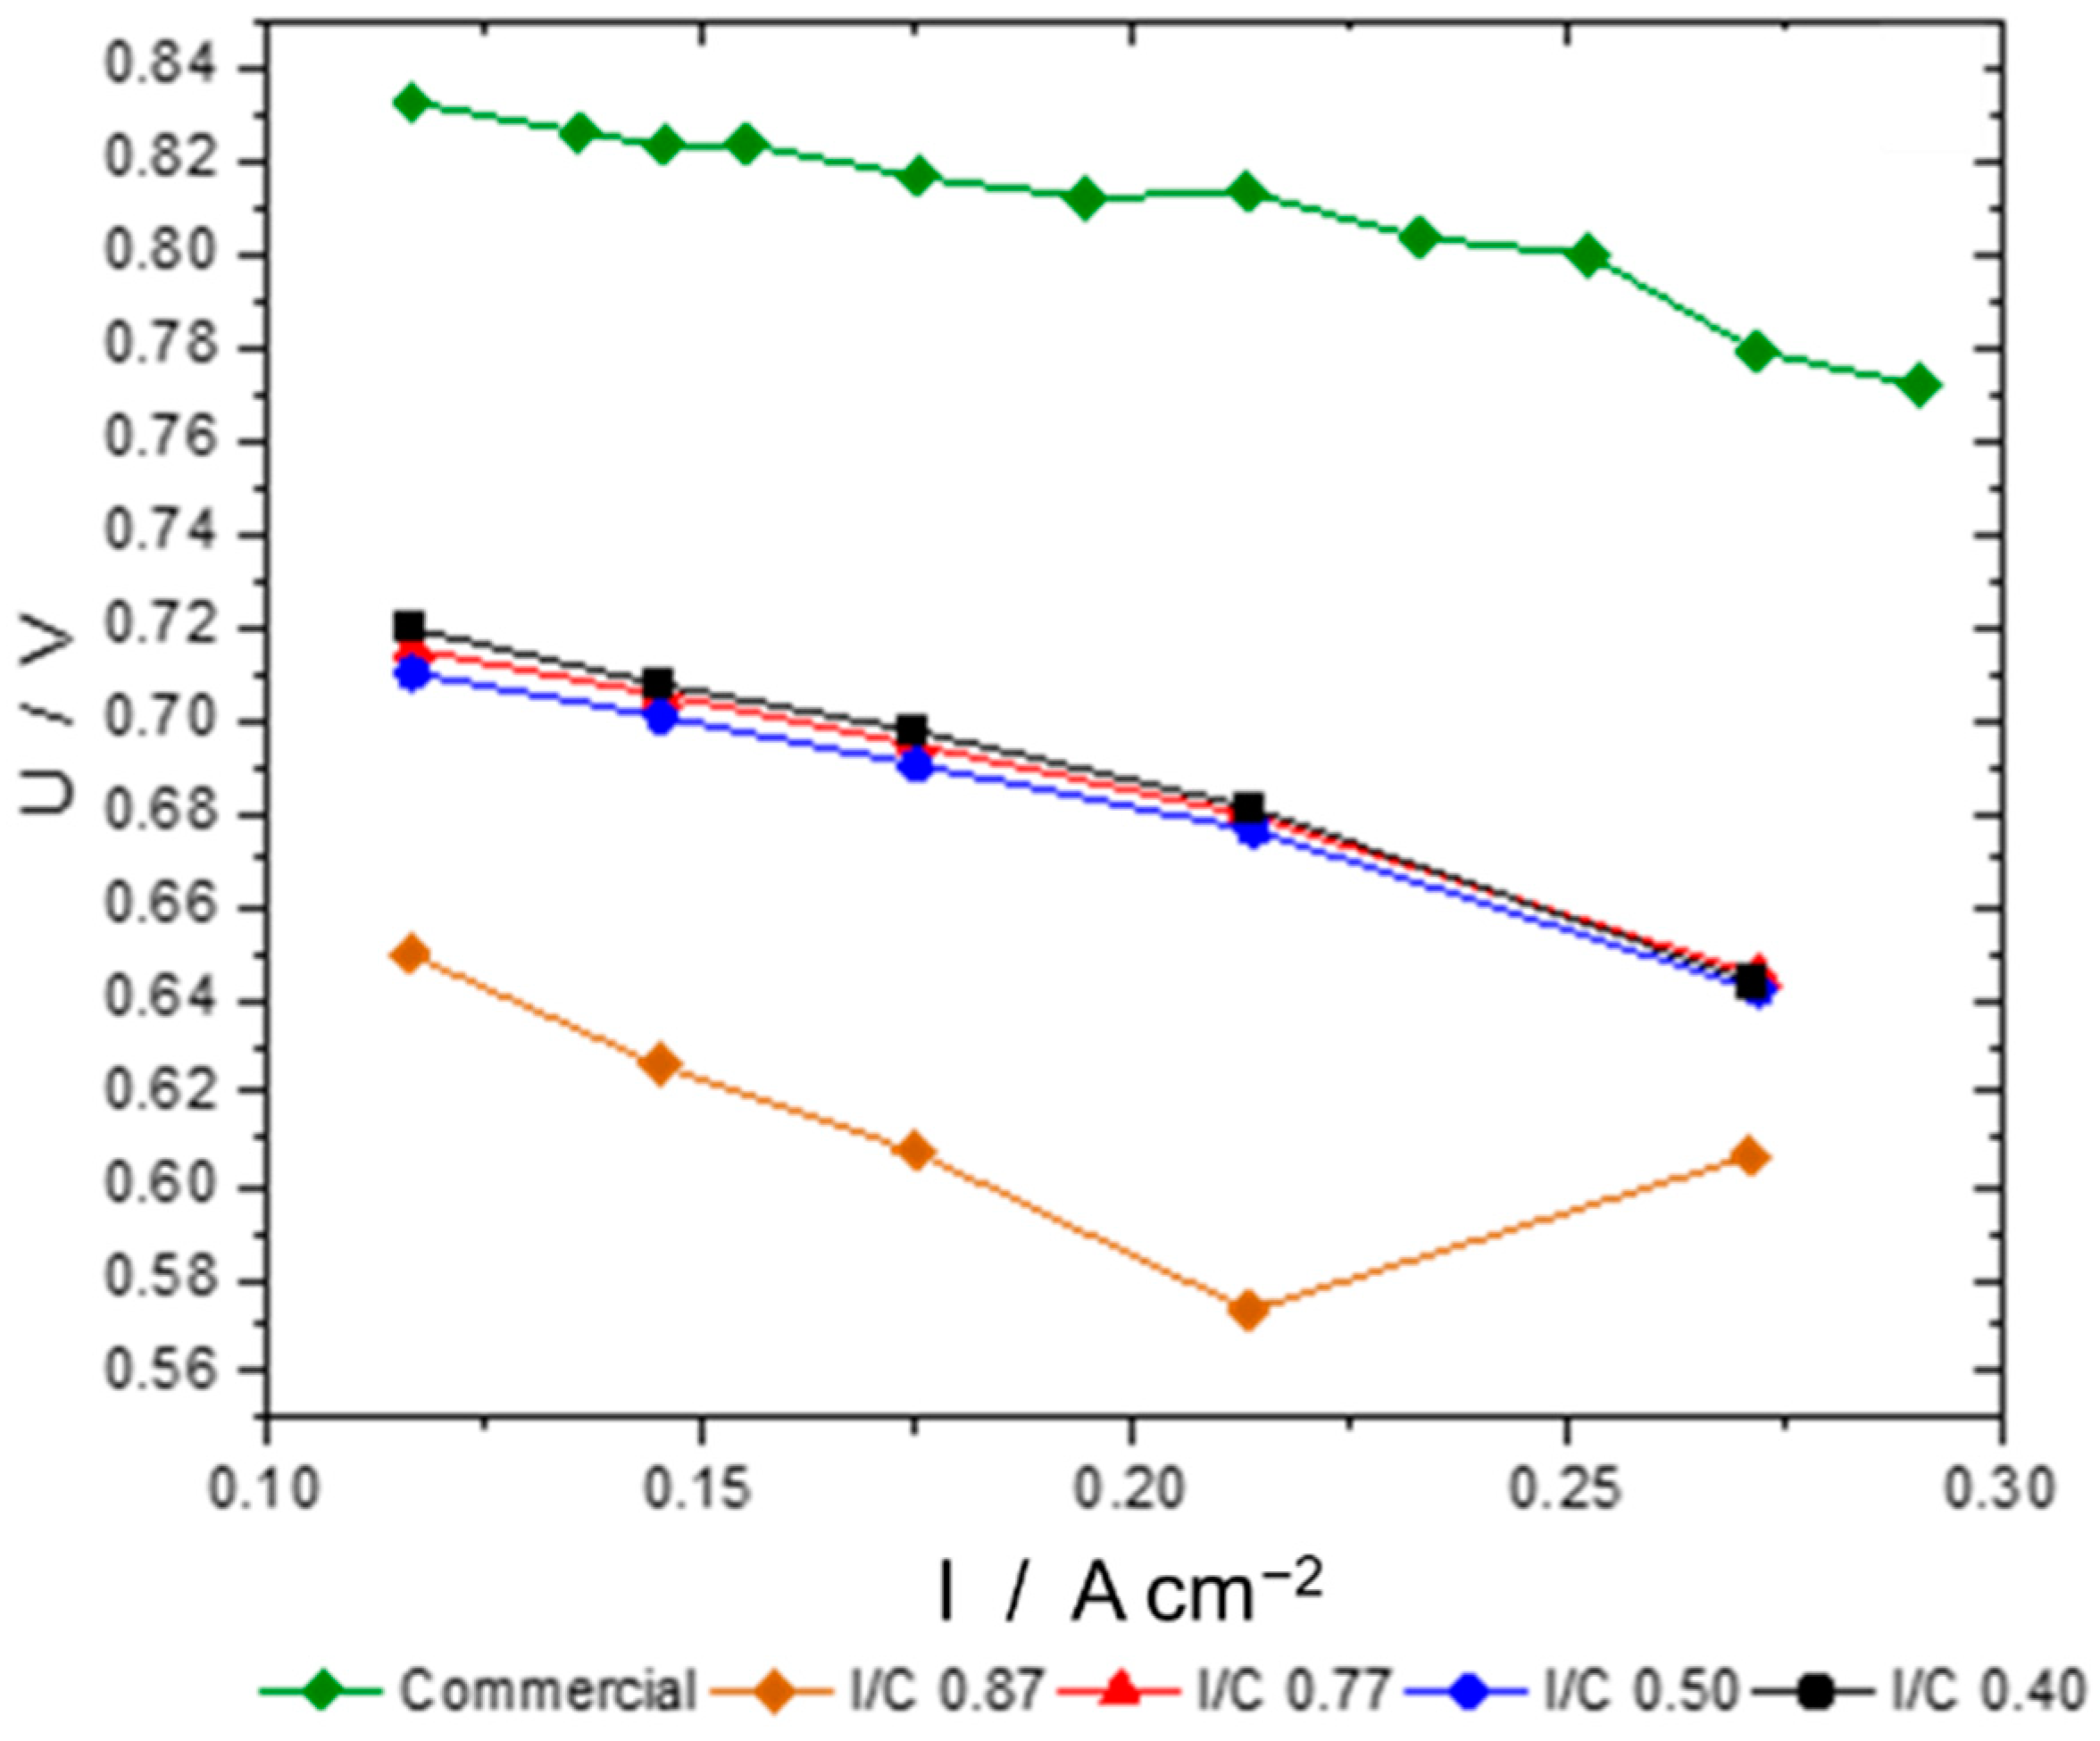
3.3. Catalyst Loading
4. Conclusions
Author Contributions
Funding
Data Availability Statement
Acknowledgments
Conflicts of Interest
Glossary
| List of Symbols | |
| Peak integral | |
| Scan rate | |
| Charge density | |
| Mass loading of PtNi catalyst | |
| Geometric area of the electrode | |
| HUPD | Underpotentially deposited hydrogen |
| RCT | Charge-transfer resistance |
| I/C | Ionomer-to-carbon ratio |
| W/P | Water-to-propanol ratio |
| List of Acronyms | |
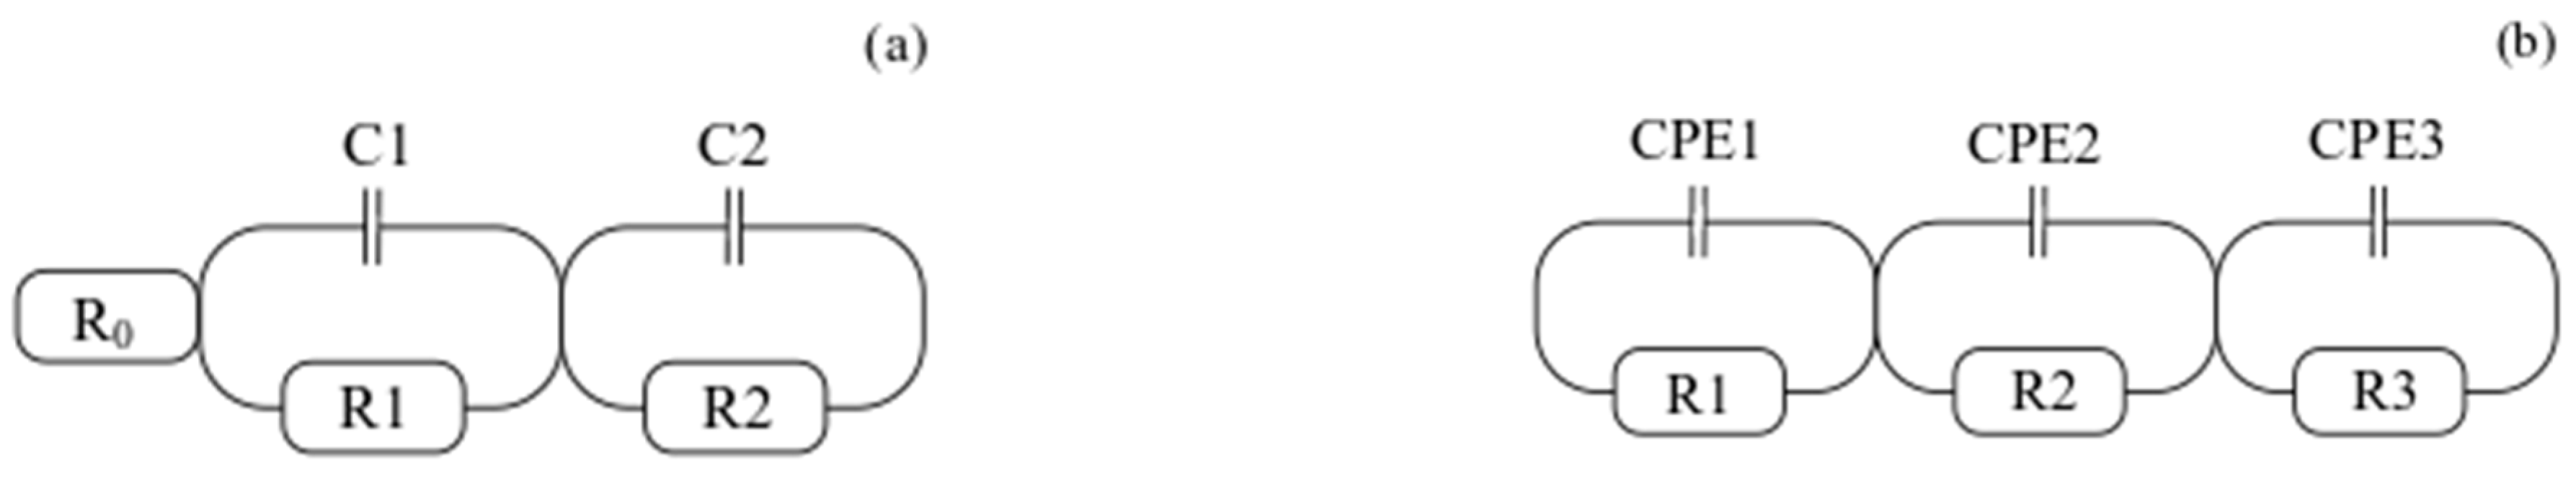
| CPE | Constant phase elements |
| CV | Cyclic voltammetry |
| DFT | Density functional theory |
| DHE | Dynamic hydrogen electrode |
| DMFC | Direct methanol fuel cell |
| ECSA | Electrochemically active surface area |
| EDX | Energy-dispersive X-ray spectroscopy |
| EEC | Equivalent electrical circuit |
| EIS | Electrochemical impedance spectroscopy |
| GDE | Gas diffusion electrode |
| GDL | Gas diffusion layer |
| IEA | International Energy Agency |
| MEA | Membrane electrode assembly |
| ORR | Oxygen reduction reaction |
| PEM | Proton electrolyte membrane |
| PEMFC | Polymer electrolyte membrane fuel cell |
| RHE | Reversible hydrogen electrode |
| RT | Room temperature (~25 °C) |
| SEM | Scanning electron microscopy |
| TEM | Transmission electron microscopy |
| XPS | X-ray photoelectron spectroscopy |
References
- Agency, I.E. World Energy Outlook; OECD: Paris, France, 2004. [Google Scholar]
- Finanzen.net—Platinpreis. Available online: https://www.finanzen.net/rohstoffe/platinpreis (accessed on 20 July 2021).
- Bashyam, R.; Zelenay, P. A class of non-precious metal composite catalysts for fuel cells. In Materials for Sustainable Energy: A Collection of Peer-Reviewed Research and Review Articles from Nature Publishing Group; World Scientific: Singapore, 2011; pp. 247–250. [Google Scholar]
- Othman, R.; Dicks, A.L.; Zhu, Z. Non precious metal catalysts for the PEM fuel cell cathode. Int. J. Hydrog. Energy 2012, 37, 357–372. [Google Scholar] [CrossRef]
- Banham, D.; Ye, S.; Pei, K.; Ozaki, J.-I.; Kishimoto, T.; Imashiro, Y. A review of the stability and durability of non-precious metal catalysts for the oxygen reduction reaction in proton exchange membrane fuel cells. J. Power Sources 2015, 285, 334–348. [Google Scholar] [CrossRef]
- Martinaiou, I.; Monteverde Videla, A.H.A.; Weidler, N.; Kübler, M.; Wallace, W.D.Z.; Paul, S.; Wagner, S.; Shahraei, A.; Stark, R.W.; Specchia, S.; et al. Activity and degradation study of an Fe-N-C catalyst for ORR in Direct Methanol Fuel Cell (DMFC). Appl. Catal. B Environ. 2020, 262, 118217. [Google Scholar] [CrossRef]
- de Sá, M.H.; Moreira, C.S.; Pinto, A.M.F.R.; Oliveira, V.B. Recent Advances in the Development of Nanocatalysts for Direct Methanol Fuel Cells. Energies 2022, 15, 6335. [Google Scholar] [CrossRef]
- Ulas, B.; Yagizatli, Y.; Demir-Kivrak, H. 3—Metal-free catalysts for fuel cell applications. In Carbon-Based Metal Free Catalysts; Asiri, A.M.A., Khan, A., Bhawani, S.A., Abu-Zied, B.M.M., Siengchin, S., Džudžević-Čančar, H., Eds.; Elsevier: Amsterdam, The Netherlands, 2022; pp. 67–109. [Google Scholar]
- Lo Vecchio, C.; Serov, A.; Dicome, M.; Zulevi, B.; Aricò, A.S.; Baglio, V. Investigating the durability of a direct methanol fuel cell equipped with commercial Platinum Group Metal-free cathodic electro-catalysts. Electrochim. Acta 2021, 394, 139108. [Google Scholar] [CrossRef]
- Shi, J.; Shao, H.; Yang, F.; Li, J.; Fan, L.; Cai, W. Dual-template induced multi-scale porous Fe@FeNC oxygen reduction catalyst for high-performance electrochemical devices. Chem. Eng. J. 2022, 445, 136628. [Google Scholar] [CrossRef]
- Thiagarajan, V.; Karthikeyan, P.; Thanarajan, K.; Neelakrishnan, S.; Manoharan, R.; Chen, R.; Fly, A.; Anand, R.; Karuppa Raj, T.R.; Sendhil Kumar, N. Experimental investigation on DMFCs using reduced noble metal loading with NiTiO3 as supportive material to enhance cell performances. Int. J. Hydrog. Energy 2019, 44, 13415–13423. [Google Scholar] [CrossRef]
- Kaur, A.; Kaur, G.; Singh, P.P.; Kaushal, S. Supported bimetallic nanoparticles as anode catalysts for direct methanol fuel cells: A review. Int. J. Hydrog. Energy 2021, 46, 15820–15849. [Google Scholar] [CrossRef]
- Mansor, M.; Timmiati, S.N.; Lim, K.L.; Wong, W.Y.; Kamarudin, S.K.; Nazirah Kamarudin, N.H. Recent progress of anode catalysts and their support materials for methanol electrooxidation reaction. Int. J. Hydrog. Energy 2019, 44, 14744–14769. [Google Scholar] [CrossRef]
- Wang, C.; Chi, M.; Wang, G.; Van der Vliet, D.; Li, D.; More, K.; Wang, H.H.; Schlueter, J.A.; Markovic, N.M.; Stamenkovic, V.R. Correlation between Surface Chemistry and Electrocatalytic Properties of Monodisperse PtxNi1-x Nanoparticles. Adv. Funct. Mater. 2011, 21, 147–152. [Google Scholar] [CrossRef]
- Stamenkovic, V.; Mun, B.S.; Mayrhofer, K.J.; Ross, P.N.; Markovic, N.M.; Rossmeisl, J.; Greeley, J.; Nørskov, J.K. Changing the activity of electrocatalysts for oxygen reduction by tuning the surface electronic structure. Angew. Chem. Int. Ed. 2006, 45, 2897–2901. [Google Scholar] [CrossRef] [PubMed]
- Antolini, E.; Salgado, J.; Gonzalez, E. Carbon supported Pt75M25 (M= Co, Ni) alloys as anode and cathode electrocatalysts for direct methanol fuel cells. J. Electroanal. Chem. 2005, 580, 145–154. [Google Scholar] [CrossRef]
- Toda, T.; Igarashi, H.; Uchida, H.; Watanabe, M. Enhancement of the electroreduction of oxygen on Pt alloys with Fe, Ni, and Co. J. Electrochem. Soc. 1999, 146, 3750–3756. [Google Scholar] [CrossRef]
- Glüsen, A.; Dionigi, F.; Paciok, P.; Heggen, M.; Müller, M.; Gan, L.; Strasser, P.; Dunin-Borkowski, R.E.; Stolten, D. Dealloyed PtNi-Core–Shell Nanocatalysts Enable Significant Lowering of Pt Electrode Content in Direct Methanol Fuel Cells. ACS Catal. 2019, 9, 3764–3772. [Google Scholar] [CrossRef]
- Subbaraman, R.; Strmcnik, D.; Paulikas, A.P.; Stamenkovic, V.R.; Markovic, N.M. Oxygen Reduction Reaction at Three-Phase Interfaces. ChemPhysChem 2010, 11, 2825–2833. [Google Scholar] [CrossRef]
- Andersen, S.M.; Grahl-Madsen, L. Interface contribution to the electrode performance of proton exchange membrane fuel cells–Impact of the ionomer. Int. J. Hydrog. Energy 2016, 41, 1892–1901. [Google Scholar] [CrossRef]
- Antolini, E.; Giorgi, L.; Pozio, A.; Passalacqua, E. Influence of Nafion loading in the catalyst layer of gas-diffusion electrodes for PEFC. J. Power Sources 1999, 77, 136–142. [Google Scholar] [CrossRef]
- Glüsen, A.; Müller, M.; Stolten, D. The Effect of Nafion Content on DMFC Electrode Characteristics. ECS Trans. 2013, 58, 1023–1029. [Google Scholar] [CrossRef]
- Scheepers, F.; Stähler, A.; Stähler, M.; Carmo, M.; Lehnert, W.; Stolten, D. Steering and in situ monitoring of drying phenomena during film fabrication. J. Coat. Technol. Res. 2019, 16, 1213–1221. [Google Scholar] [CrossRef]
- Shang, Z.; Hossain, M.M.; Wycisk, R.; Pintauro, P.N. Poly(phenylene sulfonic acid)-expanded polytetrafluoroethylene composite membrane for low relative humidity operation in hydrogen fuel cells. J. Power Sources 2022, 535, 231375. [Google Scholar] [CrossRef]
- Mao, Q.; Sun, G.; Wang, S.; Sun, H.; Wang, G.; Gao, Y.; Ye, A.; Tian, Y.; Xin, Q. Comparative studies of configurations and preparation methods for direct methanol fuel cell electrodes. Electrochim. Acta 2007, 52, 6763–6770. [Google Scholar] [CrossRef]
- Park, I.-S.; Li, W.; Manthiram, A. Fabrication of catalyst-coated membrane-electrode assemblies by doctor blade method and their performance in fuel cells. J. Power Sources 2010, 195, 7078–7082. [Google Scholar] [CrossRef]
- Rohendi, D.; Syarif, N.; Said, M.; Utami, M.T.; Marcelina, Y. Utilization of catalyst-coated membrane (CCM) and spraying methods in fabrication membrane electrode assembly (MEA) for direct methanol fuel Cell (DMFC) using Pt-Co/C catalyst. J. Phys. Conf. Ser. 2019, 1282, 012065. [Google Scholar] [CrossRef]
- Moganapriya, C.; Rajasekar, R.; Gobinath, V.K.; Mohankumar, A. Fabrication and Properties of the Polymer Electrolyte Membrane (PEM) for Direct Methanol Fuel Cell Applications. In Nanomaterials for Alcohol Fuel Cells; Inamuddin, Rangreez, T.A., Sen, F., Asiri, A.M., Eds.; Materials Research Forum LLC: Millersville, PA, USA, 2019; Volume 49, pp. 164–166. [Google Scholar]
- Engle, R. Maximizing the Use of Platinum Catalyst by Ultrasonic Spray Application. J. Fuel Cell Sci. Technol. 2012, 9, 014501-1–014501-7. [Google Scholar] [CrossRef]
- Zainoodin, A.M.; Tsujiguchi, T.; Masdar, M.S.; Kamarudin, S.K.; Osaka, Y.; Kodama, A. Performance of a direct formic acid fuel cell fabricated by ultrasonic spraying. Int. J. Hydrog. Energy 2018, 43, 6413–6420. [Google Scholar] [CrossRef]
- Yang, Y.J.; Li, W. Ultrasonic assisted coating of multiwalled carbon nanotubes with NiFe-layered double hydroxide for improved electrocatalytic oxygen reduction. J. Electroanal. Chem. 2018, 823, 499–504. [Google Scholar] [CrossRef]
- Stähler, M.; Stähler, A.; Scheepers, F.; Carmo, M.; Stolten, D. A completely slot die coated membrane electrode assembly. Int. J. Hydrog. Energy 2019, 44, 7053–7058. [Google Scholar] [CrossRef]
- Stähler, A.; Stähler, M.; Scheepers, F.; Carmo, M.; Stolten, D. Reusability of decal substrates for the fabrication of catalyst coated membranes. Int. J. Adhes. Adhes. 2020, 98, 102473. [Google Scholar] [CrossRef]
- Sharma, J.; Lyu, X.; Reshetenko, T.; Polizos, G.; Livingston, K.; Li, J.; Wood, D.L.; Serov, A. Catalyst layer formulations for slot-die coating of PEM fuel cell electrodes. Int. J. Hydrog. Energy 2022, 47, 35838–35850. [Google Scholar] [CrossRef]
- Glüsen, A.; Müller, M.; Kimiaie, N.; Konradi, I.; Mergel, J.; Stolten, D. Manufacturing Technologies for Direct Methanol Fuel Cells (DMFCs). In 18th World Hydrogen Energy Conference 2010—WHEC 2010 proceedings; Detlef Stolten, T.G.E., Ed.; Parallel Sessions Book 1: Fuel Cell Basics/Fuel Infrastructures; Forschungszentrum Jülich GmbH: Jülich, Germany, 2010; Volume 78-1, pp. 219–226. [Google Scholar]
- Ahrenstorf, K.; Albrecht, O.; Heller, H.; Kornowski, A.; Görlitz, D.; Weller, H. Colloidal synthesis of NixPt1− x nanoparticles with tuneable composition and size. Small 2007, 3, 271–274. [Google Scholar] [CrossRef]
- Lim, B.H.; Majlan, E.H.; Tajuddin, A.; Husaini, T.; Wan Daud, W.R.; Mohd Radzuan, N.A.; Haque, M.A. Comparison of catalyst-coated membranes and catalyst-coated substrate for PEMFC membrane electrode assembly: A review. Chin. J. Chem. Eng. 2021, 33, 1–16. [Google Scholar] [CrossRef]
- Cooperation, S.T. Ultrasonic Atomization. Available online: https://www.sono-tek.com/ultrasonic-coating/how-ultrasonic-nozzles-work/ (accessed on 30 December 2022).
- Glüsen, A.; Müller, M.; Stolten, D. 45% Cell Efficiency in DMFCs via Process Engineering. Fuel Cells 2020, 20, 507–514. [Google Scholar] [CrossRef]
- Scheepers, F.; Stähler, A.; Stähler, M.; Carmo, M.; Lehnert, W.; Stolten, D. Layer Formation from Polymer Carbon-Black Dispersions. Coatings 2018, 8, 450. [Google Scholar] [CrossRef]
- Singh, Y.; White, R.T.; Najm, M.; Haddow, T.; Pan, V.; Orfino, F.P.; Dutta, M.; Kjeang, E. Tracking the evolution of mechanical degradation in fuel cell membranes using 4D in situ visualization. J. Power Sources 2019, 412, 224–237. [Google Scholar] [CrossRef]
- Mauger, S.A.; Pfeilsticker, J.R.; Wang, M.; Medina, S.; Yang-Neyerlin, A.C.; Neyerlin, K.C.; Stetson, C.; Pylypenko, S.; Ulsh, M. Fabrication of high-performance gas-diffusion-electrode based membrane-electrode assemblies. J. Power Sources 2020, 450, 227581. [Google Scholar] [CrossRef]
- Pickup, P.G.; Li, G. Ionic Conductivity of PEMFC Electrodes: Effect of Nafion Loading. J. Electrochem. Soc. 2003, 150, C745–C752. [Google Scholar]
- Van Cleve, T.; Khandavalli, S.; Chowdhury, A.; Medina, S.; Pylypenko, S.; Wang, M.; More, K.L.; Kariuki, N.; Myers, D.J.; Weber, A.Z.; et al. Dictating Pt-Based Electrocatalyst Performance in Polymer Electrolyte Fuel Cells, from Formulation to Application. ACS Appl. Mater. Interfaces 2019, 11, 46953–46964. [Google Scholar] [CrossRef]
- Moniri, S.; Van Cleve, T.; Linic, S. Pitfalls and best practices in measurements of the electrochemical surface area of platinum-based nanostructured electro-catalysts. J. Catal. 2017, 345, 1–10. [Google Scholar] [CrossRef]
- Shao, M.; Odell, J.H.; Choi, S.-I.; Xia, Y. Electrochemical surface area measurements of platinum-and palladium-based nanoparticles. Electrochem. Commun. 2013, 31, 46–48. [Google Scholar] [CrossRef]
- Müller, J.T.; Urban, P.M.; Hölderich, W.F. Impedance studies on direct methanol fuel cell anodes. J. Power Sources 1999, 84, 157–160. [Google Scholar] [CrossRef]
- Springer, T.; Zawodzinski, T.; Wilson, M.; Gottesfeld, S. Characterization of polymer electrolyte fuel cells using AC impedance spectroscopy. J. Electrochem. Soc. 1996, 143, 587–599. [Google Scholar] [CrossRef]
- Du, C.; Zhao, T.; Xu, C. Simultaneous oxygen-reduction and methanol-oxidation reactions at the cathode of a DMFC: A model-based electrochemical impedance spectroscopy study. J. Power Sources 2007, 167, 265–271. [Google Scholar] [CrossRef]
- Wu, X.; Ma, H.; Chen, S.; Xu, Z.; Sui, A. General equivalent circuits for faradaic electrode processes under electrochemical reaction control. J. Electrochem. Soc. 1999, 146, 1847–1853. [Google Scholar] [CrossRef]
- Furukawa, K.; Okajima, K.; Sudoh, M. Structural control and impedance analysis of cathode for direct methanol fuel cell. J. Power Sources 2005, 139, 9–14. [Google Scholar] [CrossRef]


| Ionomer-to-Carbon Ratio (I/C) | ECSA/m² g−1 |
|---|---|
| 0.87 | 44.7 |
| 0.77 | 50.2 |
| 0.60 | 47.9 |
| 0.50 | 53.0 |
| 0.40 | 43.1 |
| Water-to-Propanol Ratio (W/P) | ECSA/m² g−1 |
|---|---|
| 56/44 | 53.0 |
| 66/34 | 45.6 |
| 76/24 | 46.4 |
Disclaimer/Publisher’s Note: The statements, opinions and data contained in all publications are solely those of the individual author(s) and contributor(s) and not of MDPI and/or the editor(s). MDPI and/or the editor(s) disclaim responsibility for any injury to people or property resulting from any ideas, methods, instructions or products referred to in the content. |
© 2023 by the authors. Licensee MDPI, Basel, Switzerland. This article is an open access article distributed under the terms and conditions of the Creative Commons Attribution (CC BY) license (https://creativecommons.org/licenses/by/4.0/).
Share and Cite
Karaca, A.; Glüsen, A.; Wippermann, K.; Mauger, S.; Yang-Neyerlin, A.C.; Woderich, S.; Gimmler, C.; Müller, M.; Bender, G.; Weller, H.; et al. Oxygen Reduction at PtNi Alloys in Direct Methanol Fuel Cells—Electrode Development and Characterization. Energies 2023, 16, 1115. https://doi.org/10.3390/en16031115
Karaca A, Glüsen A, Wippermann K, Mauger S, Yang-Neyerlin AC, Woderich S, Gimmler C, Müller M, Bender G, Weller H, et al. Oxygen Reduction at PtNi Alloys in Direct Methanol Fuel Cells—Electrode Development and Characterization. Energies. 2023; 16(3):1115. https://doi.org/10.3390/en16031115
Chicago/Turabian StyleKaraca, Ali, Andreas Glüsen, Klaus Wippermann, Scott Mauger, Ami C. Yang-Neyerlin, Steffen Woderich, Christoph Gimmler, Martin Müller, Guido Bender, Horst Weller, and et al. 2023. "Oxygen Reduction at PtNi Alloys in Direct Methanol Fuel Cells—Electrode Development and Characterization" Energies 16, no. 3: 1115. https://doi.org/10.3390/en16031115
APA StyleKaraca, A., Glüsen, A., Wippermann, K., Mauger, S., Yang-Neyerlin, A. C., Woderich, S., Gimmler, C., Müller, M., Bender, G., Weller, H., Carmo, M., & Stolten, D. (2023). Oxygen Reduction at PtNi Alloys in Direct Methanol Fuel Cells—Electrode Development and Characterization. Energies, 16(3), 1115. https://doi.org/10.3390/en16031115