Article

Chemically and Physically Pretreated Straw in Moderate Conditions: Poor Correlation between Biogas Production and Commonly Used Biomass Characterization

1
Université de Technologie de Compiègne, ESCOM, TIMR (Integrated Transformations of Renewable Matter), Centre de Recherche Royallieu—CS 60 319, F-60203 Compiègne CEDEX, France
2
Sorbonne Université, CNRS, Laboratoire de Réactivité de Surface (LRS), 4 place Jussieu, F-75005 Paris, France
*
Authors to whom correspondence should be addressed.
Energies 2023, 16(3), 1146; https://doi.org/10.3390/en16031146
Submission received: 10 December 2022 / Revised: 7 January 2023 / Accepted: 16 January 2023 / Published: 20 January 2023

Abstract

:
Straw is a substantial agricultural by-product for biogas production. Hydrolysis of straw is found to be a rate-limiting step during its anaerobic digestion and could be enhanced by pretreatment. In this paper, the effect of various combinations of particle size reduction, autoclaving, and low-level Fenton reaction was studied on straw for biogas production. Grinding of straw contributed to the maximum increase in the biomethane potential. Only Fenton or only the autoclave process improves the kinetics slightly but does not considerably improve the biomethane potential. Combining autoclaving and low-concentration Fenton pretreatment considerably improves the BMP values. Lignin content, CHNSO elemental analysis, Scanning Electronic Microscopy (SEM), Simon’s staining, infrared spectroscopy (DRIFT and ATR), Nuclear magnetic resonance spectroscopy, and wide-angle X-ray diffraction analysis (WAXD) were used to characterize the physical and chemical changes of straw due to pretreatment. Results show a poor correlation between biogas production and the different physical and chemical biomass characteristics. It makes it difficult to explain the outcome of various pretreatment methods applied to biomass. Without further improvement and development of analytical techniques, the prediction of the biomethane potential of a feedstock with the aid of pretreatment can only be considered in case-by-case studies.

1. Introduction

Straw is a substantial agricultural by-product around the world, making it an attractive substrate for biogas production via anaerobic digestion (AD). The lignocellulosic biomass (LCB) such as straw contains three main polymers called cellulose, hemicellulose, and lignin which are intertwined making it recalcitrant and hindering sugar release [1]. Due to this complex structure, straw has low degradability which results in low biogas yield. The biomass undergoes four steps in the anaerobic digestion process to produce methane. First, hydrolysis occurs where hydrolytic bacteria in the inoculum help to depolymerize carbohydrates (hemicellulose and cellulose), proteins, and lipids into monomers. Second, the fermentative bacteria convert simple sugars into volatile fatty acids (VFA) such as propionic acid and acetic acid, and this step is called acidogenesis. Then, acetogenesis takes place in which the acetogenic bacteria convert the VFA into hydrogen, carbon dioxide, and acetate. Finally, the methanogenic archaea convert acetate (aceticlastic methanogenesis) or hydrogen plus carbon dioxide (hydrogenotrophic methanogenesis) into methane and carbon dioxide [2,3].
Hydrolysis is found to be a rate-limiting step in the conversion process. Nevertheless, a pretreatment step can help to make the organic matter in the feedstock more accessible to microbial attack which increases its biodegradability [1,2,4]. Physical, chemical, physicochemical, and biological pretreatments are generally used alone or in combination to enhance biofuel yield [5]. Generally, physical pretreatment includes mechanical, thermal, and irradiation techniques. Mechanical pretreatment such as grinding helps to reduce the size of biomass which cannot only increase the surface area for microbial degradation but also be useful to intensify the AD process. Size reduction could avoid the problems of floatation and strengthen the mixing, heat, and mass transfer in the downstream process [6,7]. It consequently boosts the digester feeding conditions and reduces the digester size. Thermal pretreatment is carried out by heating the biomass at a certain temperature (50–240 °C) and pressure for enhancing particulate organic matter. Autoclaving is a thermal pretreatment that operates at a temperature of 121 °C and an absolute pressure of 2 bar [8]. When the temperature is elevated to 160–240 °C, it is known as liquid hot water pretreatment. When using moderate temperatures (50–100 °C), the thermal pretreatment is carried out for several hours to days. Even though liquid hot water pretreatment is known to improve hemicellulose hydrolysis, it can result in an inhibitor formation whereas, autoclaving does not produce inhibitors [9,10]. The energy input of physical pretreatment methods should be taken into account which reduces the energy gain from biofuel yield surplus induced by that pretreatment. Chemical pretreatment is further classified as dilute acid, alkaline, oxidative pretreatment, and organic solvent pretreatment. Based on the chemical used and operating parameters, the mode of action of LCB pretreatment varies, primarily removing lignin or hemicellulose [11]. Alkaline pretreatment is considered an effective and low-cost method to improve the biogas performance of lignocellulosic feedstock. NaOH, KOH, and Ca(OH)2 are commonly used chemicals for alkaline pretreatment. Nonetheless, the concern of sodium discharge in the process effluent and digestate limits the NaOH use. On the other hand, KOH (strong base)-treated anaerobic digestate can be used as fertilizers but the high chemical loading and toxicity to microbes are also a concern. Although Ca(OH)2 is low-cost and safe to use, the weak alkali alone cannot improve biomass digestion significantly. Due to the inherent demerits of conventional pretreatments as described previously and in Anukam et Berghel (2021) [12], combining two or more pretreatment techniques will help to conduct the individual steps at mild conditions while reducing the severity of the disadvantages [13,14]. Uellendahl et al. (2008) studied wet oxidation pretreatment for corn, miscanthus, and willow and concluded that the pretreatment was efficient for improving the biogas yield of only miscanthus and willow and not corn [15]. This is because the relative abundance of the three polymers in LCB varies depending on the type, species, and even source of biomass [16]. Each pretreatment method specifically affects the different components of the biomass and the efficiency can vary even if the same pretreatment step is applied to the same biomass from different sources, thereby making it quite difficult to compare [14]. One has to note that it is still not clear why some pretreatment methods are efficient for enhancing biogas production while others are not.
Studying the properties of biomass using characterization techniques could help to determine the feasibility and viability of its products. However, the characterization of biomass is also challenging as each technique has its advantages and disadvantages. Thus, the limitations of one technique are compensated by the merits of other techniques. Consequently, a wide variety of state-of-the-art analytical techniques are required to interpret the efficiency of the pretreatment. The analytical methods need to be chosen based on studying the biomass at different levels—functional groups, structural changes, surface morphology, and fiber elemental content to achieve a full understanding of the physical and chemical underpinnings of biomass as it undergoes bioconversion [12]. Lignin compositional analyses are generally carried out using standardized protocols provided by NREL [17], Van Soest [18], or TAPPI [19] method. Spectroscopic methods such as Fourier-transform infrared spectroscopy (FT-IR)/attenuated total reflectance (ATR), Raman, and nuclear magnetic resonance spectroscopy (NMR) are used to determine variation occurring in functional groups present. To analyze the morphological changes related to enzyme accessibility, scanning electron microscope (SEM), transmission electron microscope (TEM) and atomic force microscope (AFM) are used. X-ray diffraction (XRD) and solid-state NMR techniques provide data on the physical properties of biomass such as crystallinity, crystallite size, and fiber diameter. Size exclusion chromatography (SEC) is used to examine the molecular distribution and polydispersity ratio. Gas chromatography–mass spectrometry (GC-MS) helps to analyze the S/G unit ratio and phenolic content of lignin [20]. The heterogeneity of the biomass calls for diligent sample preparation and careful analysis to have precise analytical results [21]. Based on these analyses, various researchers have concluded different factors or components that influence the methane yield in their study. This contradictory nature of results from various studies makes it difficult to define which characteristics are important for an efficient pretreatment and enhancement of biofuel yield.
Since physical and chemical pretreatments are the widespread strategies to improve biomass digestibility, this paper aims to study their combination in improving the biochemical methane potential (BMP) of straw. Size reduction is unavoidable for preparing the feedstock for biorefinery processes and the most common technique used is grinding [22]. Therefore, the improvement in the performance of AD due to small changes in the extent of size reduction by grinding is assessed. Autoclaving is typically done before biological or enzyme pretreatment to maintain sterility and therefore, its effect on biogas production is also assessed [23]. Of the chemical strategies, Fenton pretreatment is interesting as it mimics the natural process used by fungi to decay lignocellulosic material [24]. Fenton reaction occurs between hydrogen peroxide (H2O2) and ferrous ion (Fe2+), which produces a hydroxyl (·OH) radical capable of oxidizing organic compounds. This degradation of organic compounds subsequently produces more hydroxyl radicals and thereby initiates a chain reaction [25]. Therefore, the objectives of the present study are (1) to apply combined physical and chemical pretreatment methods on straw (2) to realize Biochemical methane potential tests (BMP tests) to seek the relevant biogas enhancement, (3) to perform the characterization of the biomass pretreated or not and (4) to look into the correlation between the biogas production and the biomass characteristics.

2. Materials and Methods
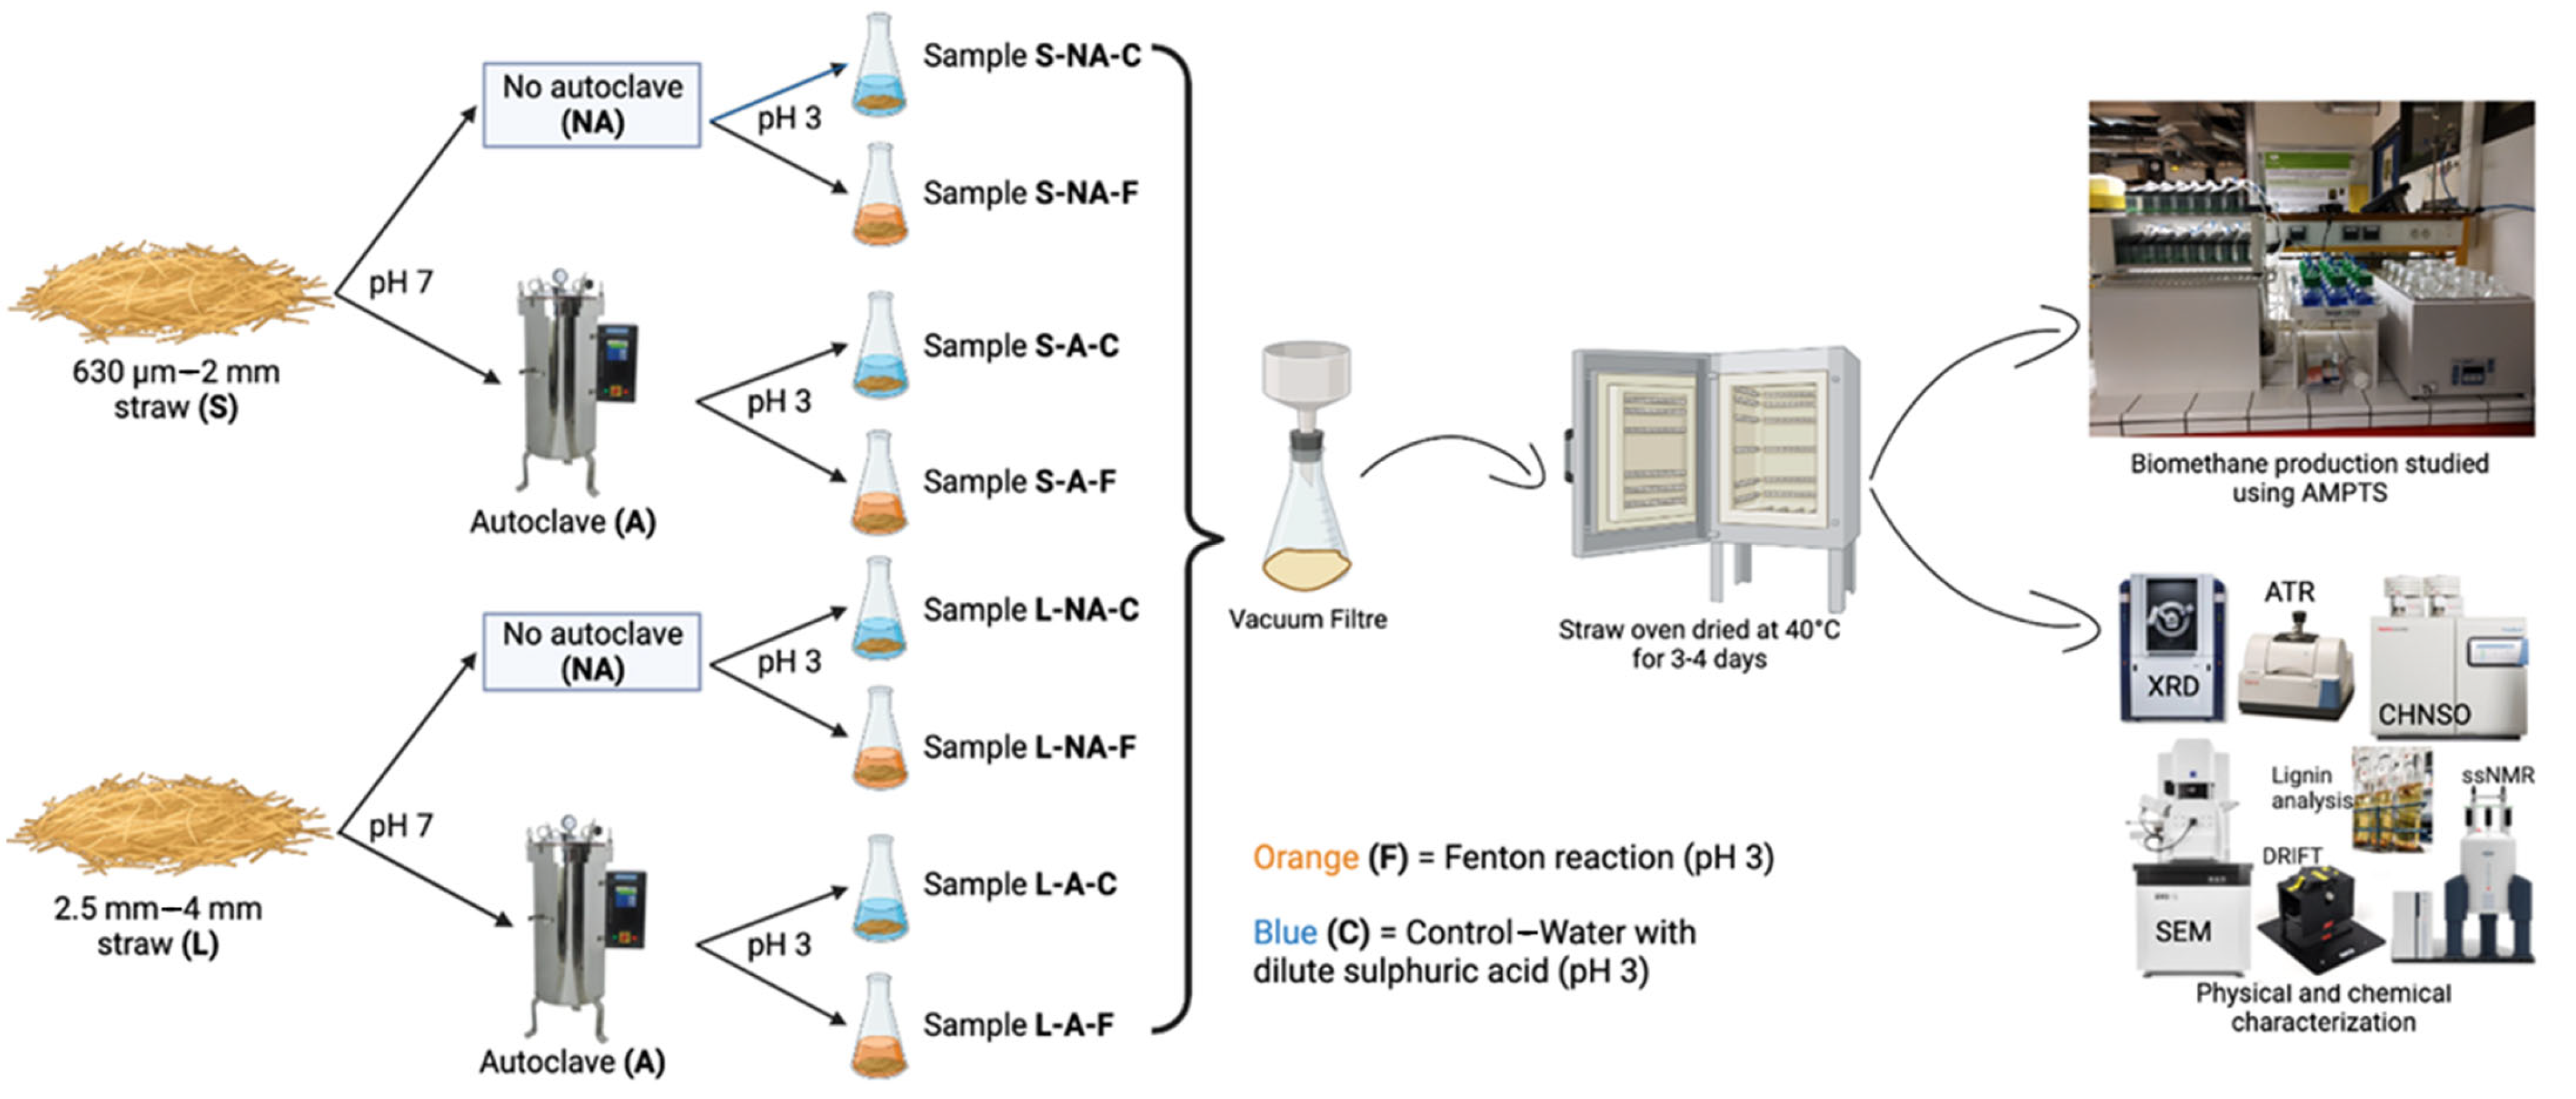
2.1. Materials

All chemicals of reagent grade were obtained and used without further purification, except for Direct Orange (DO, Pontamine Fast Orange 6RN) which was purified according to the procedure described in Section 2.5.2. Ferrous chloride tetrahydrate (FeCl2·4H2O), hydrogen peroxide (H2O2, 30%), and sulfuric acid (H2SO4, 96%) were purchased from VWR, Rosny-sous-Bois cedex, France. Direct Blue (DB, Pontamine Fast Sky Blue 6BX) and DO, sodium phosphate dibasic heptahydrate (Na2HPO4·7H2O, ≥98%), sodium phosphate monobasic monohydrate (NaH2PO4·H2O, ≥98%), sodium chloride (NaCl, ≥99%), hydrochloric acid (HCl, 37%), and sodium hydroxide (NaOH, ≥98%) were obtained from Sigma Aldrich, Saint-Quentin-Fallavier Cedex, France. 100 K ultrafiltration membranes were obtained from Amicon (Amicon Inc., Beverly, MA, USA). Diamond powder average size of 0.6 mm was purchased from Presi (Presi, Eybens, France). Distilled water (18 MΩ·cm) was used to make all the solutions.
Straw samples were obtained from Hamiform (in December 2021), a commercial brand that sells it as bedding for rodents and it mainly consists of wheat straw mixed with other straw.

2.2. Pretreatment

2.2.1. Physical Pretreatment

Straw was ground using a laboratory blender (Waring commercial) and sieved into two-size fractions. The smaller size fraction (denoted as S) consisted of particles obtained by sieving through a 2 mm mesh-size sieve and then again through 630 µm to recover the retentate. While the larger size fraction (denoted as L) consisted of straw particles obtained after sieving first through 4 mm and then through 2.5 mm sieve to recover the retentate.

2.2.2. Autoclaving Process

The two size fractions of biomass were added to different Erlenmeyer flasks and soaked in distilled water to obtain a 5% (w/v) concentration. Half of the total number of flasks of each size fraction were autoclaved (denoted as A) (Vertical Autoclave, LEQUEUX, Paris, France) at 121 °C and 2 bars for 20 min while others were not (denoted as NA).

2.2.3. Fenton Pretreatment

The pH of the suspension of straw in distilled water was then reduced to 3 with dilute sulfuric acid (1 M). 190.65 mg of FeCl2 and 15.3 mL of H2O2 were added to each flask containing 15 g straw and 300 mL of distilled water at pH 3 (denoted as F). The ratio of Fe2+ and H2O2 was chosen based on Kato et al. (2014) [26]. The flasks were then left to shake on an orbital shaker at room temperature for 24 h. The liquid phase was then removed by vacuum filtration and harvested straw was washed with distilled water and dried at 40 °C for 2–3 days. Control (denoted as C) experiments were conducted in the same conditions without any FeCl2 or H2O2. All experiments were conducted in triplicates.

2.3. Chemical and Physio-Chemical Characterization

2.3.1. Determination of the Total Solid and Volatile Contents of Samples

Total solids (TS) and volatile solids (VS) content of the straw fractions and the inoculum were determined after drying the biomass at 105 °C for 20 h and 550 °C for 2 h, respectively. The tests were done in triplicates.

2.3.2. CHNSO Elemental Composition

Carbon (C), hydrogen (H), nitrogen (N), sulfur (S), and oxygen (O) contents were obtained using Flash 2000 FlashSmart Elemental Analyzer (Thermo Fisher Scientific, Courtaboeuf Cedex, France). Approximately 1.0 mg samples each were added to tin containers along with a few mg of Vanadium for C, H, N, and S analysis and silver containers for oxygen analysis. All tests were conducted in triplicates.

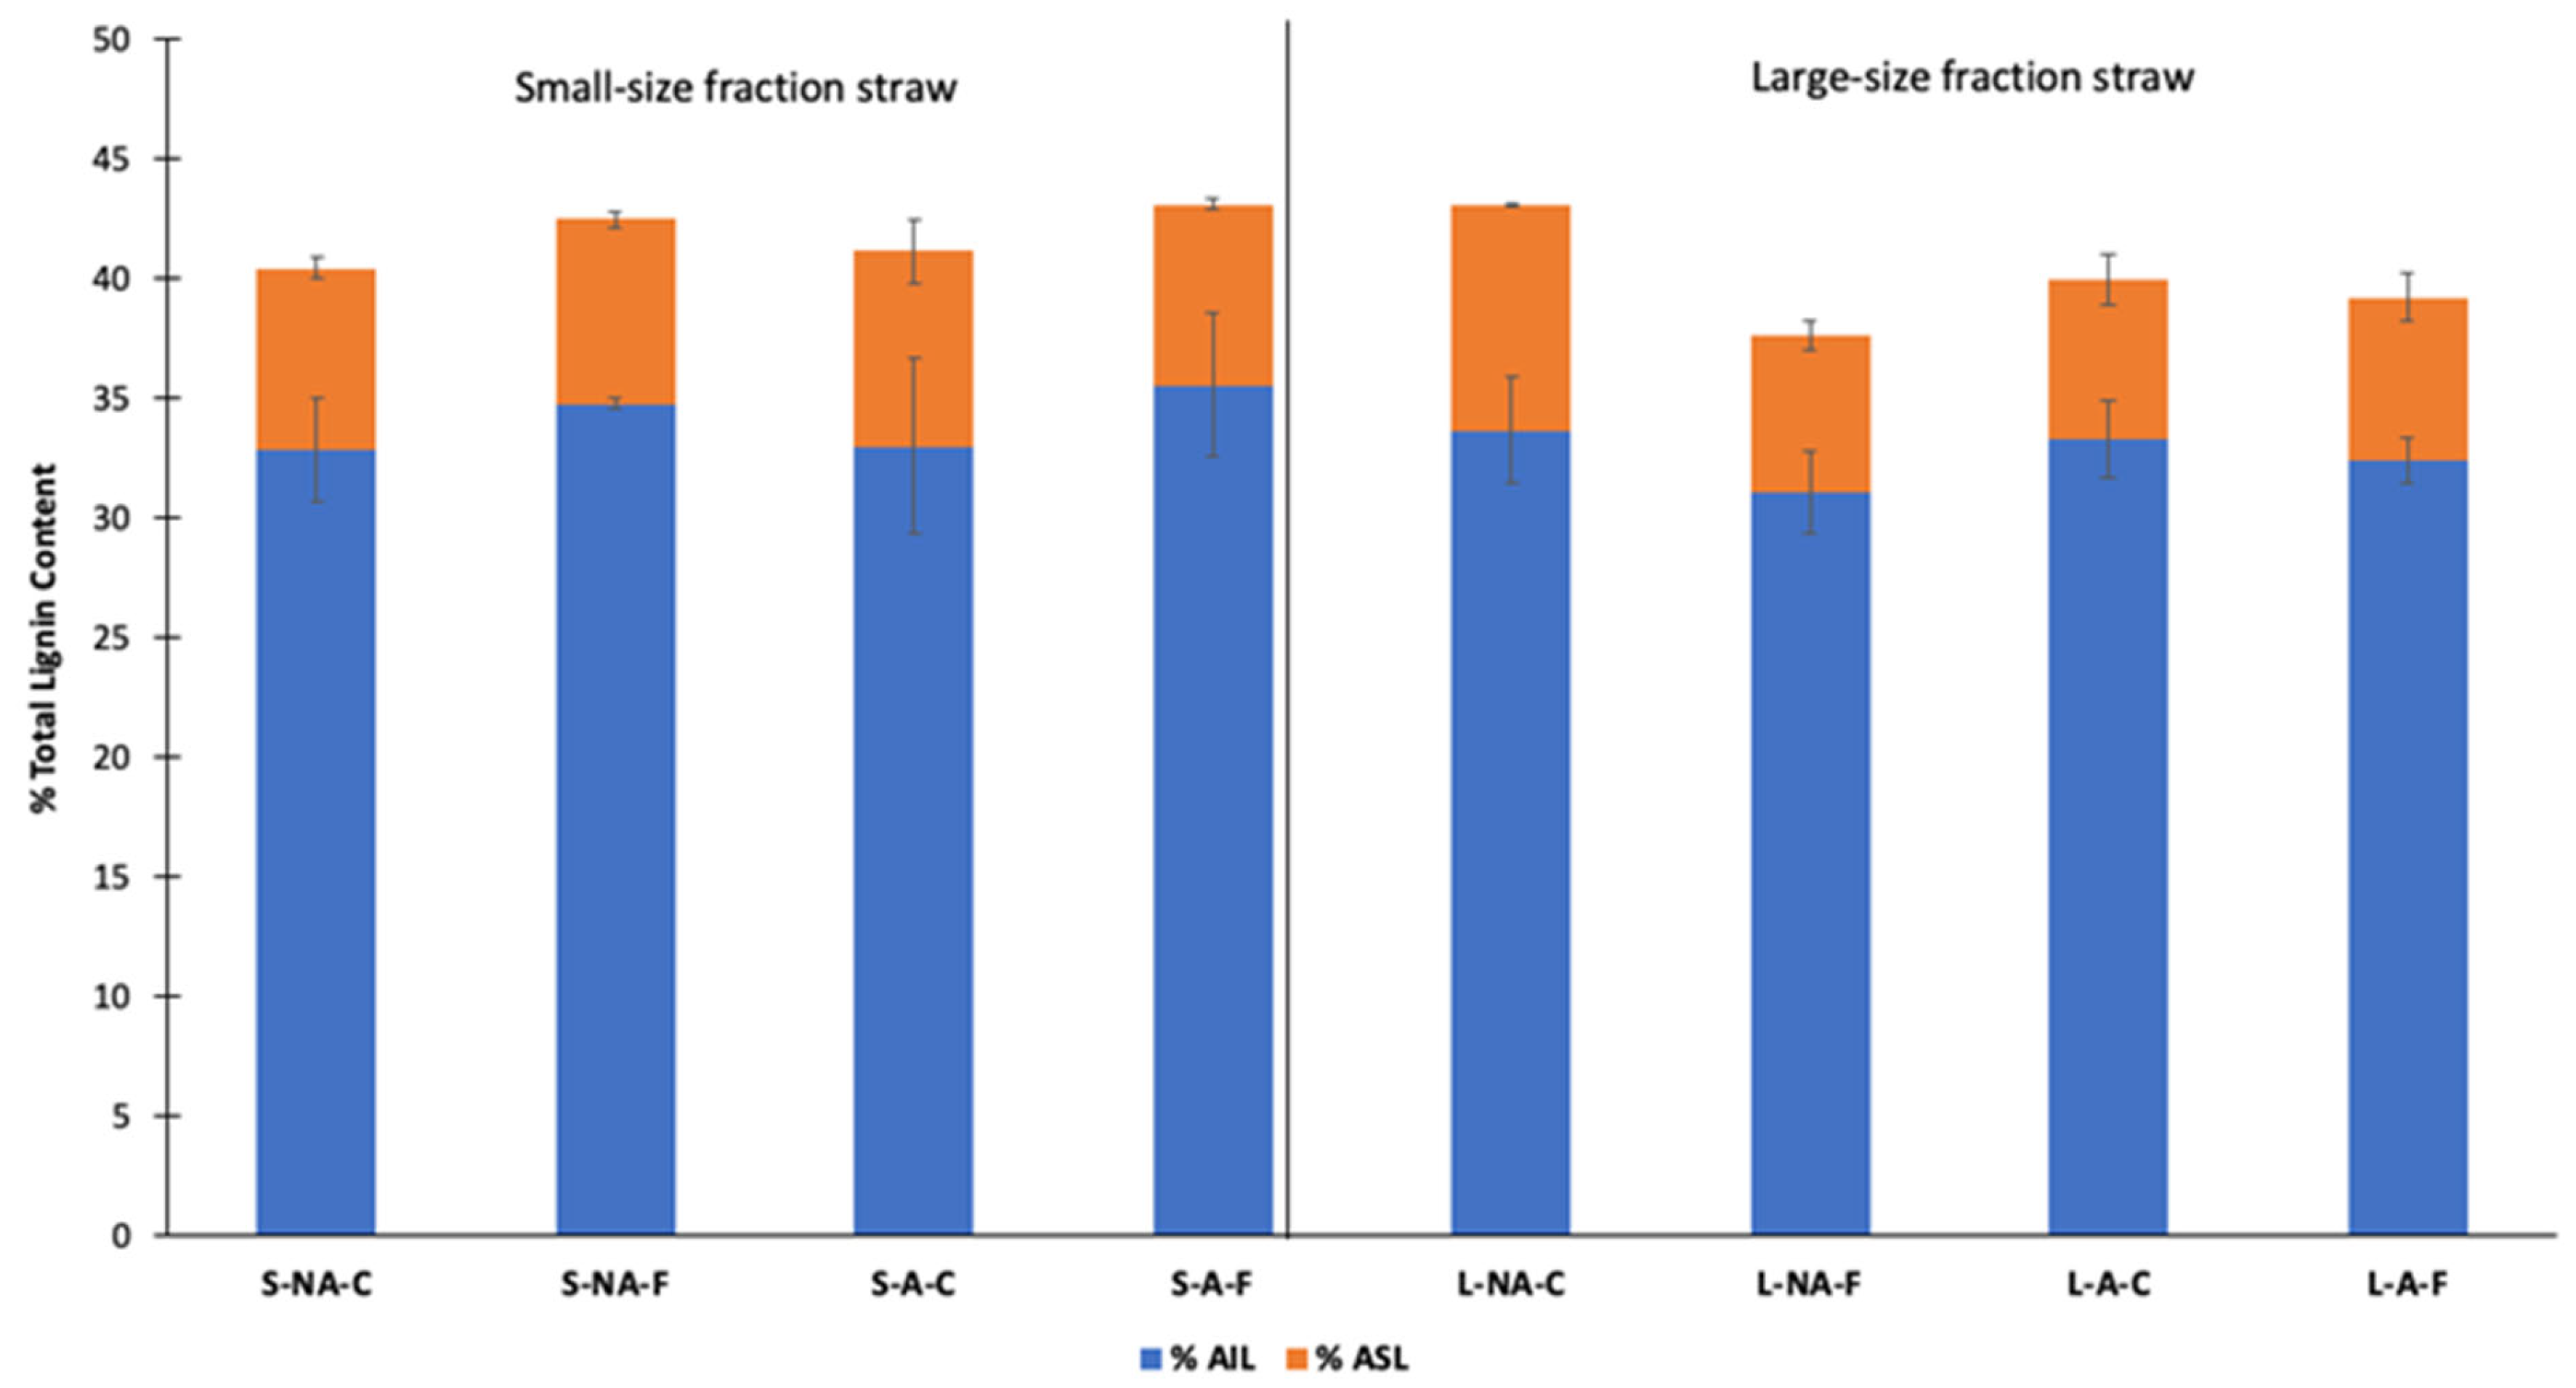
2.3.3. Lignin Composition Analysis

The lignin compositional analysis was conducted using the Laboratory Analytical Procedure (LAP) published by the National Renewable Energy Laboratory (NREL) which is a two-step acid hydrolysis method [17]. In short, 300 ± 10 mg of untreated or pretreated straw was hydrolyzed with 3 mL of 72% (w/w) H2SO4 at 30 °C for 1 h, followed by dilution with distilled water to 4% (w/w) H2SO4 and autoclaved at 121 °C for 1 h. The hydrolysate was then vacuum filtered and the liquid fraction was used for determining the acid-soluble fraction of lignin (ASL) using a UV spectrophotometer at 278 nm (Absorptivity = 30 L/g cm). The solid fraction was washed with distilled water and dried at 105 °C for 15 h and then transferred to a furnace and the temperature was ramped to 575 °C for 3 h. By measuring the weight before and after the ashing in the furnace (Nabertherm), acid-insoluble lignin (AIL) was calculated. The % total lignin content of a sample is calculated as the sum of ASL and AIL. The tests were done in triplicates.

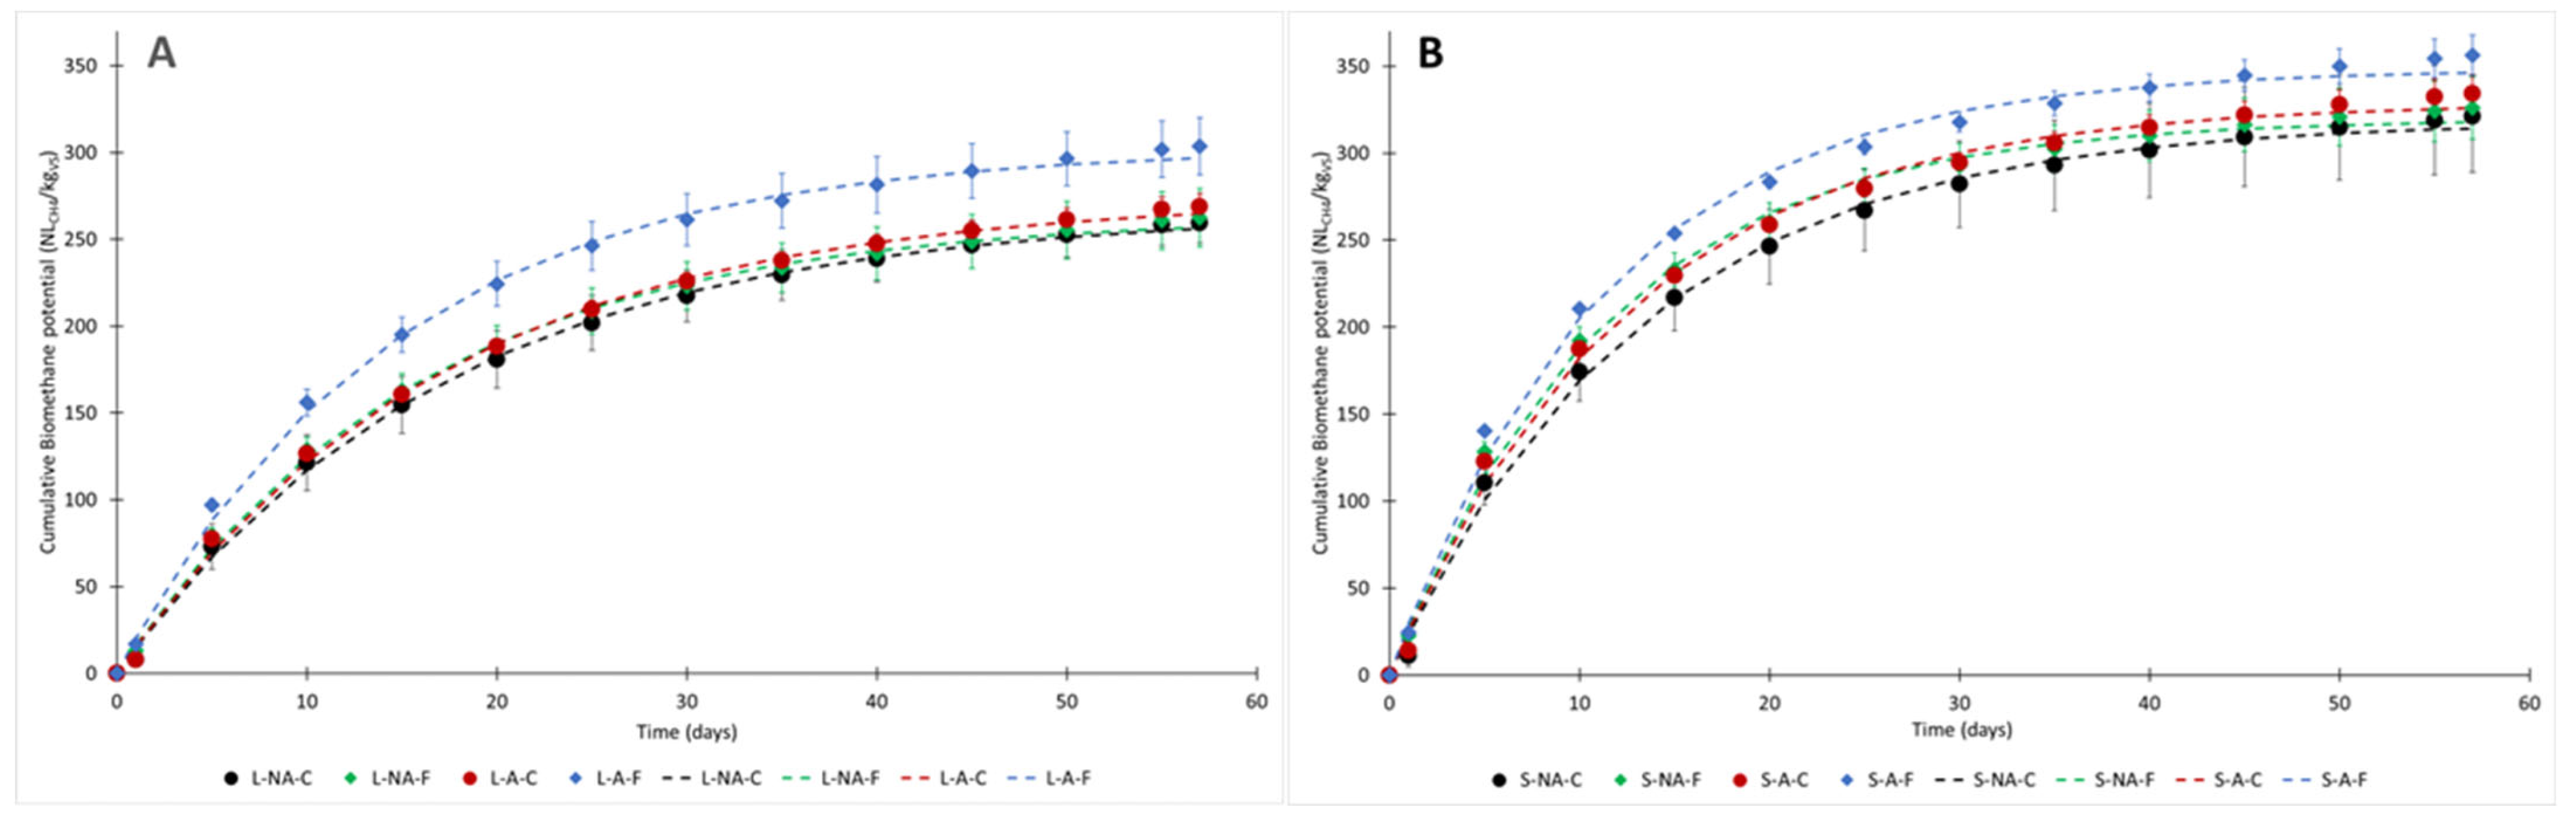
2.4. Biochemical Methane Potential (BMP) Test

2.4.1. Realization of BMP Tests

The BMP tests were performed using an automatic methane potential test system (AMPTS II, Automatic Methane Potential Test System, Bioprocess Control AB, Lund, Sweden). The AMPTS II is a standardized analytical device designed for the online measurement of biomethane obtained from the anaerobic digestion of biodegradable substrates. It consists of 15 parallel reactors of 500 mL each that are connected to separate gas flow meters through an 80 mL trap bottle of 3 M sodium hydroxide solution used for absorbing CO2 from the biogas. The remaining gas after scrubbing is measured using the gas flow counters which are connected to the data analysis and acquisition system. The experiments were conducted with 400 g of the total reaction medium, in which substrates and inoculum were mixed at a weight ratio of 1:3 in terms of volatile solids (VS) at mesophilic conditions (37 °C) with continuous mixing. All tests were performed in triplicate. Total solids (TS) and VS were determined for both substrates and the inoculum as described in Section 2.3.1. Blank samples consisting of only inoculum were also carried in triplicates. The net methane production of the substrate was determined by subtracting the methane production of the blank (inoculum) from the substrate sample (substrate + inoculum). BMP tests were run for 57 days and the cumulative methane production was recorded. The quality of BMP tests was assured by a positive control in triplicate (cellulose + inoculum) as suggested by Holliger et al. (2016) [27].
The inoculum was obtained from a large-scale anaerobic digester digesting agricultural residues located in Coudon (Oise), France. To remove large and undigested particles in the inoculum, it was filtered through a 1 mm porosity sieve and then left to stabilize for a week at room temperature. FOS/TAC, the ratio of volatile fatty acids (Fluchtige Organische Sauren in German) to total alkalinity (Total Anorganic Carbon in German) [28], was determined using the Titralab AT1000 series (HACH) instrument. The inoculum had a FOS/TAC ratio of 0.13 ± 0.02 and the percentage of TS and VS were 7.5 ± 0.2 and 65.2 ± 0.5.

2.4.2. Statistical Analysis and Kinetics of Biomethane Production

Statistical significance in the difference between the net biomethane production between all the samples was studied using ANOVA (single factor test) at 0.05 level in XLSTAT (Addinsoft, Paris, France), an add-in software on Microsoft Excel.
To better understand the influence of the pretreatment methods used on the anaerobic digestion efficiency, a first-order kinetic model (Equation (1)) was used as the degradation of biomass is assumed to follow a first-order decay.
V   t = V max   1 exp kt
where t [days] is the incubation time, V [NLCH4/kg VS] is the cumulative volume of biomethane at time t (d), Vmax [NLCH4/kg VS] is the maximum cumulative volume at the end of the BMP test, and k (d−1) is the specific rate constant [29]. The values of the first-order kinetic constants obtained from the best fit of the data based on the correlation coefficient (R2) values are reported. Non-linear regression was carried out by Scilab (Dassault Systèmes, Vélizy-Villacoublay, France) in order to extract the kinetic parameters (k and Vmax) of the first-order model.

2.5. Advanced Characterization Techniques

2.5.1. Scanning Electron Microscopy (SEM)—Energy Dispersive Spectroscopy (EDS)

The surface morphologies of raw and pretreated straw were characterized by SEM using Quanta 250 FEG system (FEI Company, Hillsboro, OR, USA). Before SEM observation, a thin layer of 5 nm thickness of platinum was coated on the samples to have higher resolution and magnification and to avoid beam damage to sensitive samples. EDS was used for elemental identification on the surface of the straw.

2.5.2. Simons’ Staining

Simons’ staining was performed according to the modified method proposed by R. Chandra et al. (2008) [30]. In a preliminary step, DO dye (Pontamine Fast Orange 6RN) was fractionated to recover only the high molecular weight fraction of the commercial product which is a mixture of polydispersed compounds. Therefore, a DO solution (1% w/v) in water was fractionated by ultrafiltration through a 100 K membrane using an Amicon ultrafiltration apparatus (Amicon Inc., Beverly, MA, USA) under a gas pressure of 28 psi. Only the retentate was used in further experiments. To calculate the concentration of DO dye after ultrafiltration, a known volume (1.0 mL) of the solution was dried in a 50 °C oven for 5 days and the weight of the solid residue was measured.
To measure the amount of adsorbed dye on the fiber, 20 mg of each wheat straw sample was weighed into a 2 mL Eppendorf tube, and 2.0 mL of a solution was added. The composition of the solution, for a total volume of 2 mL, was the following: 0.2 mL of PBS solution (phosphate-buffered saline solution, pH 6, 0.3M PO4, 1.4 mM NaCl), 0.6 mL of DO solution (10.0 mg/mL), 0.6 mL of DB solution (10.0 mg/mL) and 0.6 mL of water. Tubes were incubated at 70 °C for 6 h, with shaking at 200 rpm. After the incubation period, the tubes were centrifuged at 10,000 rpm for 5 min and 20 µL of the supernatant was diluted to 2 mL, placed in a cuvette, and the absorbance was read on a Libra Biochrom S60 UV–vis spectrophotometer (Biochrom LTD, Cambridge, UK) at 624 and 455 nm. The amount of each dye adsorbed on the fiber (mg dye/g fiber) was determined using the difference in the concentration of the initially added dye and the concentration of the dye in the supernatant—this latter corresponds to the free dye (mg dye/mL solution).
To calculate the corresponding concentration of each dye (CO and CB) from the absorbance, two Lambert-Beer law equations (as given in Equation (2)) for binary mixture must be solved simultaneously where L is the pathlength which is represented by the width of the cuvette (cm) and ε is the extinction coefficient of each component at the respective wavelength. The extinction coefficients for DO and DB dyes were calculated by preparing standard curves of each dye and measuring the slope of their absorbance at 455 and 624 nm. The values calculated and used in this study were εDO/455nm = 25.364, εDB/455nm = 6.255, εDO/624nm = 0.73, and εDB/624nm = 65.524 L g−1 cm−1.
A 455 nm = ε DO / 455 nm   L   C O + ε DB / 455 nm   L   C B A 624 nm = ε DO / 624 nm   L   C O + ε DB / 624 nm   L   C B
The amount of each dye necessary to reach saturation was previously determined by measuring the dye absorption isotherm for the untreated straw. The ratio of the amount of adsorbed orange dye to the amount of adsorbed blue dye (DO/DB) has been used as an estimation of substrate porosity. In short, the affinity of DO for the straw is likely to be higher when the porosity of the solid is enhanced, thus facilitating the diffusion of the large dye into the pores [31,32].

2.5.3. Infrared Spectroscopy

  • Diffuse Reflectance (DRIFT)
To perform DRIFT and WAXD characterizations (as explained in Section 2.5.4), the sample size was further reduced using a blender and sieved (mesh size between 0.355 mm and 0.125 mm).
Infrared spectra for all samples were collected using an FTIR spectrometer (Bruker IFS66V, Bruker, Billerica, MA, USA) equipped with a diffuse reflectance accessory (DRIFT, Collector—Spectratech, Thermo Fisher Scientific, Waltham, MA, USA). The latter is a high-temperature cell equipped with ZnSe windows and with gas inlet and outlet connection. Samples were size reduced and dispersed in diamond powder, with a 1:1 sample/diamond ratio (mg sample/mg diamond). Samples were then placed into a macro cup, ensuring the removal of the excess sample, and smoothening the sample surface. All DRIFT spectra were collected at a set temperature of 50 °C and under argon flux, to reduce the spectral contribution of atmospheric carbon dioxide and water vapor. Spectra were obtained from 600 cm−1 to 4000 cm−1, with a scan resolution of 1 cm−1 and averaging 128 scans/spectrum. The (pseudo) absorbance was obtained by measuring the reflectance of diamond powder as a reference sample, according to the theory developed by Kubelka and Munk [33,34].
  • Attenuated Total Reflectance (ATR)
The presence of various functional groups was assayed using a Nicolet iS5-iD3 ATR spectrometer (Thermo Fisher Scientific, Waltham, MA, USA). For this, analysis was performed over the spectral range of 4000–400 cm−1 with 16 scans.

2.5.4. Wide-Angle X-ray Diffraction Analysis (WAXD)

WAXD measurements were performed using a D8 Discover diffractometer (Bruker, Billerica, MA, USA) with a CuKα radiation (α = 1.542 Å) operating at 40 kV and 30 mA. The source slit was 6 mm and the detector slit was 9 mm. The scan was obtained from 10 to 50 degrees 2θ in 0.25 degrees steps for 1 s per step.
To calculate the crystallinity index (CI) of cellulose, four crystalline peaks (corresponding Miller indices 110, 1 1 ¯ 0, 102, and 200) in the 2θ range between 13 and 25° were considered as well as a broad Gaussian amorphous peak. The fitting of the diffraction pattern was performed by a curve-fitting process using Fityk software version 1.3.1 [35,36,37]. The area of the four crystalline peaks (Acr) and the total area (crystalline and amorphous peaks, Asample) are used to calculate the crystallinity as shown below [35]:
CI = A cr A sample
Cellulose microfibril crystallite size is obtained by the width of the diffraction peak associated with the specific reflecting plane (200), L200, calculated using the Scherrer equation [38]:
L 200 = 0.9   λ β 200   cos θ
where λ is the X-ray wavelength in Å, β200 is the angular full-width at half maximum intensity (FWHM) in radians of the peak at 22.0 radians (corresponding to the 200 Miller indices) and θ is the scattering angle.

2.5.5. Nuclear Magnetic Resonance Spectroscopy (NMR)

Solid-state magic angle spinning nuclear magnetic resonance (MAS NMR) experiments were performed on a Bruker Avance 500 spectrometer (Bruker, Billerica, MA, USA) with 11.7 Tesla magnets and 4 mm zirconia rotors, spinning at the rate of 14 kHz. The resonance frequency of 1H and 13C were 500.16 MHz and 125.78 MHz, respectively. Chemical shifts, δ, were reported relative to adamantane powder (38.52 ppm). 13C quantitative spectra were recorded with the multiple Cross-Polarization (multi-CP) sequence proposed by Johnson and Schmidt-Rohr [39]. Eight CP periods were used, with a length of 1 s between each of them. The contact time was 1 ms and the π/2 pulse duration for 1H and 13C was 3.1 ms. Recycle delay and height power decoupling were 5 s and 70 kHz, respectively.
Schematic representation of the pretreatment steps followed and the naming of the samples used in the following sections are given in Figure 1.

3. Results

The ground and sieved straw was separated into two size fractions and accordingly pretreated by autoclave and Fenton reaction (see Figure 1). On the pretreated samples and the controls for each pretreatment, BMP measurement (as described in Section 2.4) was carried out. Characterization using a range of techniques as explained the Section 2.3 and Section 2.5 was realized in order to understand the changes that the biomass undergoes during the pretreatment. The relevant results will be presented in this chapter.

3.1. Physio-Chemical and Chemical Characterization

3.1.1. TS, VS, and Elemental Composition

The TS, VS (%TS), and elemental composition are shown in Table 1. As observed in the analysis, the biomass contains a higher proportion of C, O, and H contents, which shows the higher energy potential (i.e., calorific value) of straw. Nevertheless, C is very high compared to N, and therefore the C/N ratio is very high for the anaerobic digestion of straw, suggesting a lack of nitrogen source when performing anaerobic digestion. This can be adjusted by co-digestion with nitrogen-rich substrates, such as animal manure [40]. Using simplified algebraic equations, the theoretical amount of biogas can be calculated from the relative amounts of C, H, N, S, and O. Based on Boyle’s formula as given in Achinas and Euverink (2016) [41], a theoretical BMP of 475 ± 3 NLCH4/kg VS was obtained for control straw samples. However, this calculation takes into account assumptions, such as the complete conversion of biomass and ideal conditions and it does not consider the energy demand of the microbes or the non-degradable fraction [41].

3.1.2. Lignin Content Changes in Straw

From Figure 2, it can be observed that the proportion of lignin is enhanced after both autoclave or Fenton reaction pretreatment, as well as their combination for small-size particles. This could be due to the lignification of silica bodies [42] and/or the presence of lignin in stomatal cell walls [43]. As can be seen from SEM analysis in Section 3.3.1, there are more silica bodies and stomata in the pretreated straw of small-size fractions as compared to the large-size fractions. This increase of the lignin proportion was noticed to be even higher for the Fenton reaction-treated samples, showing that the oxidation reactions are not always selective towards lignin degradation [40]. However, lignin degradation due to the different pretreatment conditions is observed in the large-size fraction. Nevertheless, higher lignin degradation does not always translate into a higher percentage of BMP enhancement (as seen in Section 3.2). This is because lignin is not detrimental to the further degradation of the biomass during AD since it is known that depolymerization of lignin takes place during this process, and could even be improved in presence of a suitable microbial community [44].

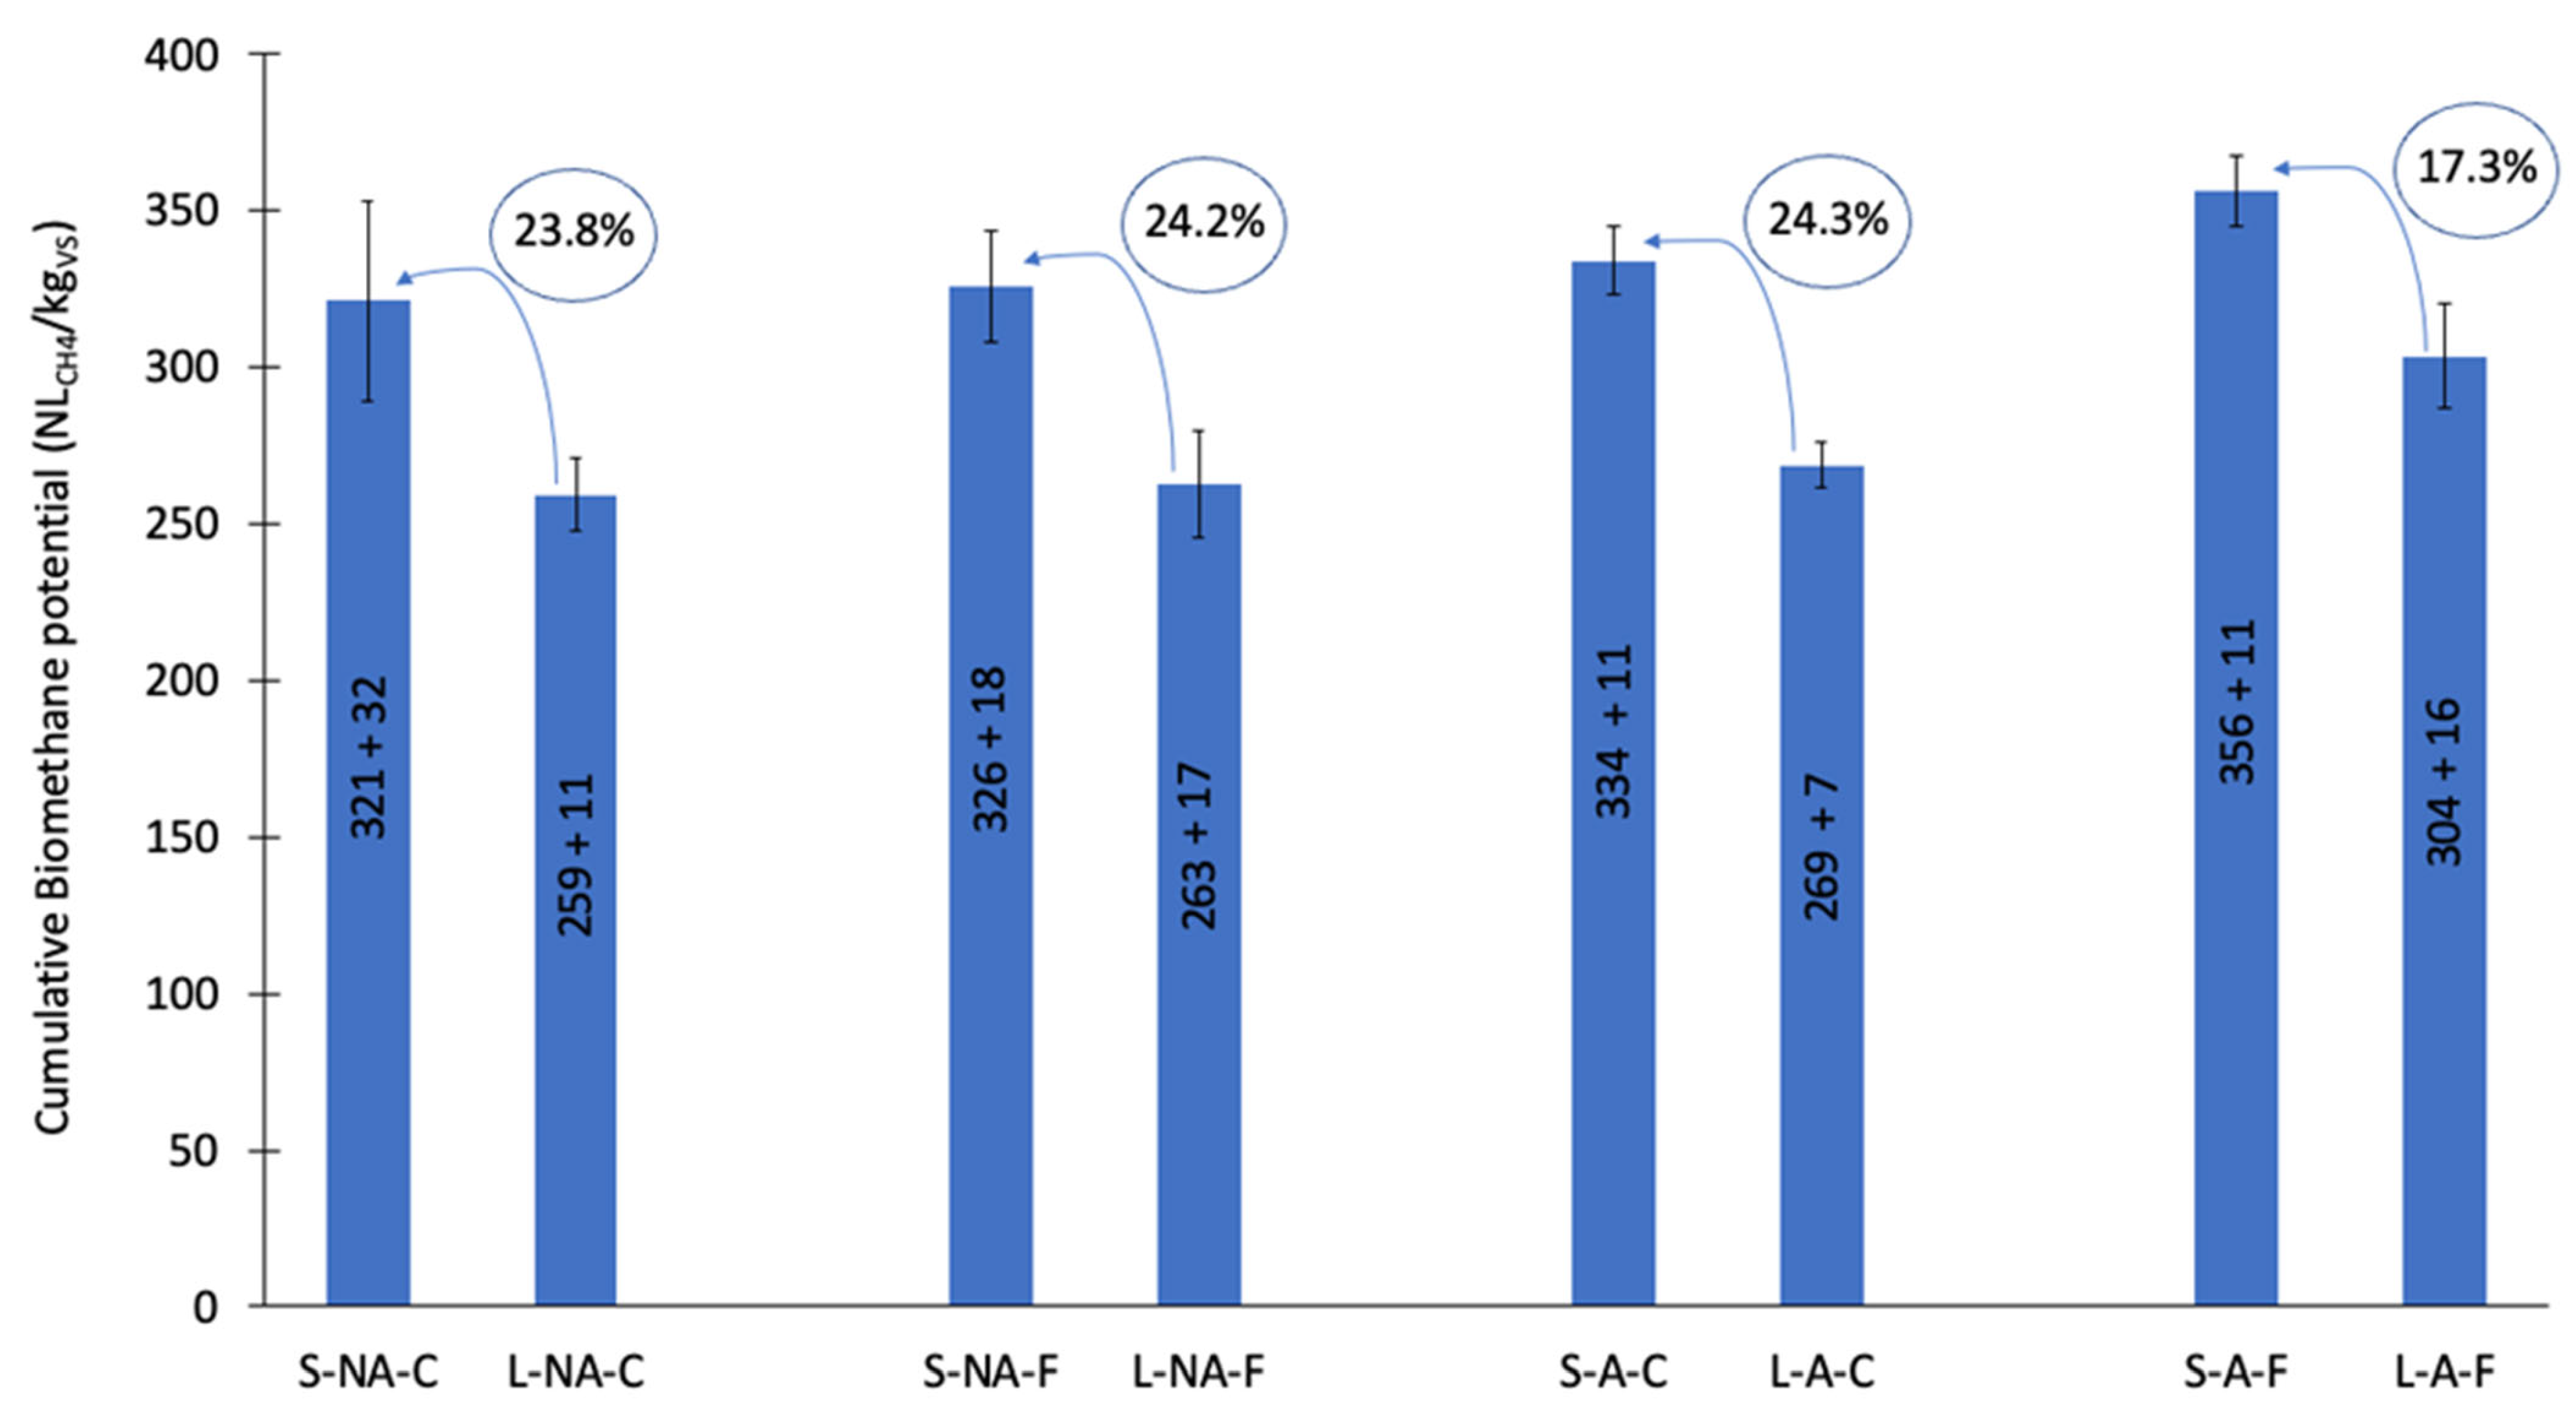
3.2. Biochemical Methane Potential (BMP)

The cumulative methane production curves obtained from the BMP tests for large and small-size fractions are shown in Figure 3A,B respectively. It can be observed that most of the biomethane was produced in the first 30 days and then the production slowed down. There was no lag phase observed since the inoculum is well adapted to agricultural residues. The total cumulative methane yield after 57 days for all samples is represented in Figure 4.
Overall, the cumulative methane yield is significantly higher for the small-size fraction straw whatever the pretreatment as compared to the large-size fraction straw. A maximum increase in methane yield due to particle size reduction was found to be 24.3% (p < 0.05) (as shown in Figure 4). The hydrolysis rates (k) (as seen in Table 2) were also significantly increased up to 39% (p < 0.05) for Fenton pretreated samples due to size reduction. It can be assumed that the reduced particle size increases the surface area for bio-accessibility of the solid straw, and therefore the methane production rate and final methane yield. This is similar to the findings of Menardo et al. (2012) where the reduction of the particle size of wheat straw from 5 cm to 0.2 cm led to a methane yield increase of 17% [45]. However, Dumas et al. (2015) [46] found no change in the methane potential value due to micronization (when the median diameter of wheat straw was reduced from 759 mm to 48 mm). However, they observed an improvement in the biodegradation kinetics when the median diameter of wheat straw was reduced from 759 mm to 200 mm, below which there was no significant increase in the kinetics as well [46].
Autoclaving the straw samples only improved the cumulative methane yield by 4% (p = 0.982) for S-A-C and 3.6% (p = 0.997) for L-A-C as compared to S-NA-C and L-NA-C respectively. The slight effect of the thermal pretreatment could result from the autoclaving temperature used (121 °C), thus preventing any complete hydrolysis [47]. In the present work, based on Table 2, it can be observed that the 1st order rate constant (k) increased by 6.6% (p = 0.821) and 1.7% (p = 1.0) for autoclaved small-size and large-size straw fractions respectively, compared to the control experiment. These results are in the range obtained in another study where the increase in BMP due to autoclaving of food waste was 4.67% [10]. However, in another study on the effect of autoclaving on biogas production for agricultural biomass (barley straw and sugarcane bagasse), a negative effect on the BMP was observed even though the kinetics was improved while the converse was true for forestry samples (Hazel and Acacia) [23]. Therefore, the effect of autoclaving on BMP varies with each biomass and the effect of the thermal pretreatment on kinetics has to be taken into account even if there is no significant increase in BMP.
When only Fenton pretreatment was carried out with very low concentrations of Fe2+ and H2O2, the cumulative biomethane increase was only 1.5% (p = 1.0) and 1.2% (p = 1.0) whereas the kinetic constant increase was 17.1% (p = 0.017) and 8.5% (p = 0.624) for S-NA-F and L-NA-F correspondingly. Therefore, Fenton pretreatment only significantly influenced the kinetics of small-size fractions. However, when the biomass was autoclaved and then followed by Fenton pretreatment, the cumulative biomethane increase was 10.9% (p = 0.299) and 17% (p = 0.112) respectively for small and large-size fraction straws. The synergy of autoclaving and Fenton pretreatment help to achieve improved hydrolysis and thereby increase the biomethane potential of straw. The combined pretreatment (autoclave and Fenton) improved the kinetic constant (k) by 17.1% (p = 0.017) and 19% (p = 0.067) for small- and large-size fraction straws. Overall, autoclaving combined with low-concentration chemical pretreatment can help considerably enhance the kinetics and the cumulative biomethane potential than individual pretreatments.

3.3. Physical Characterization of Straw

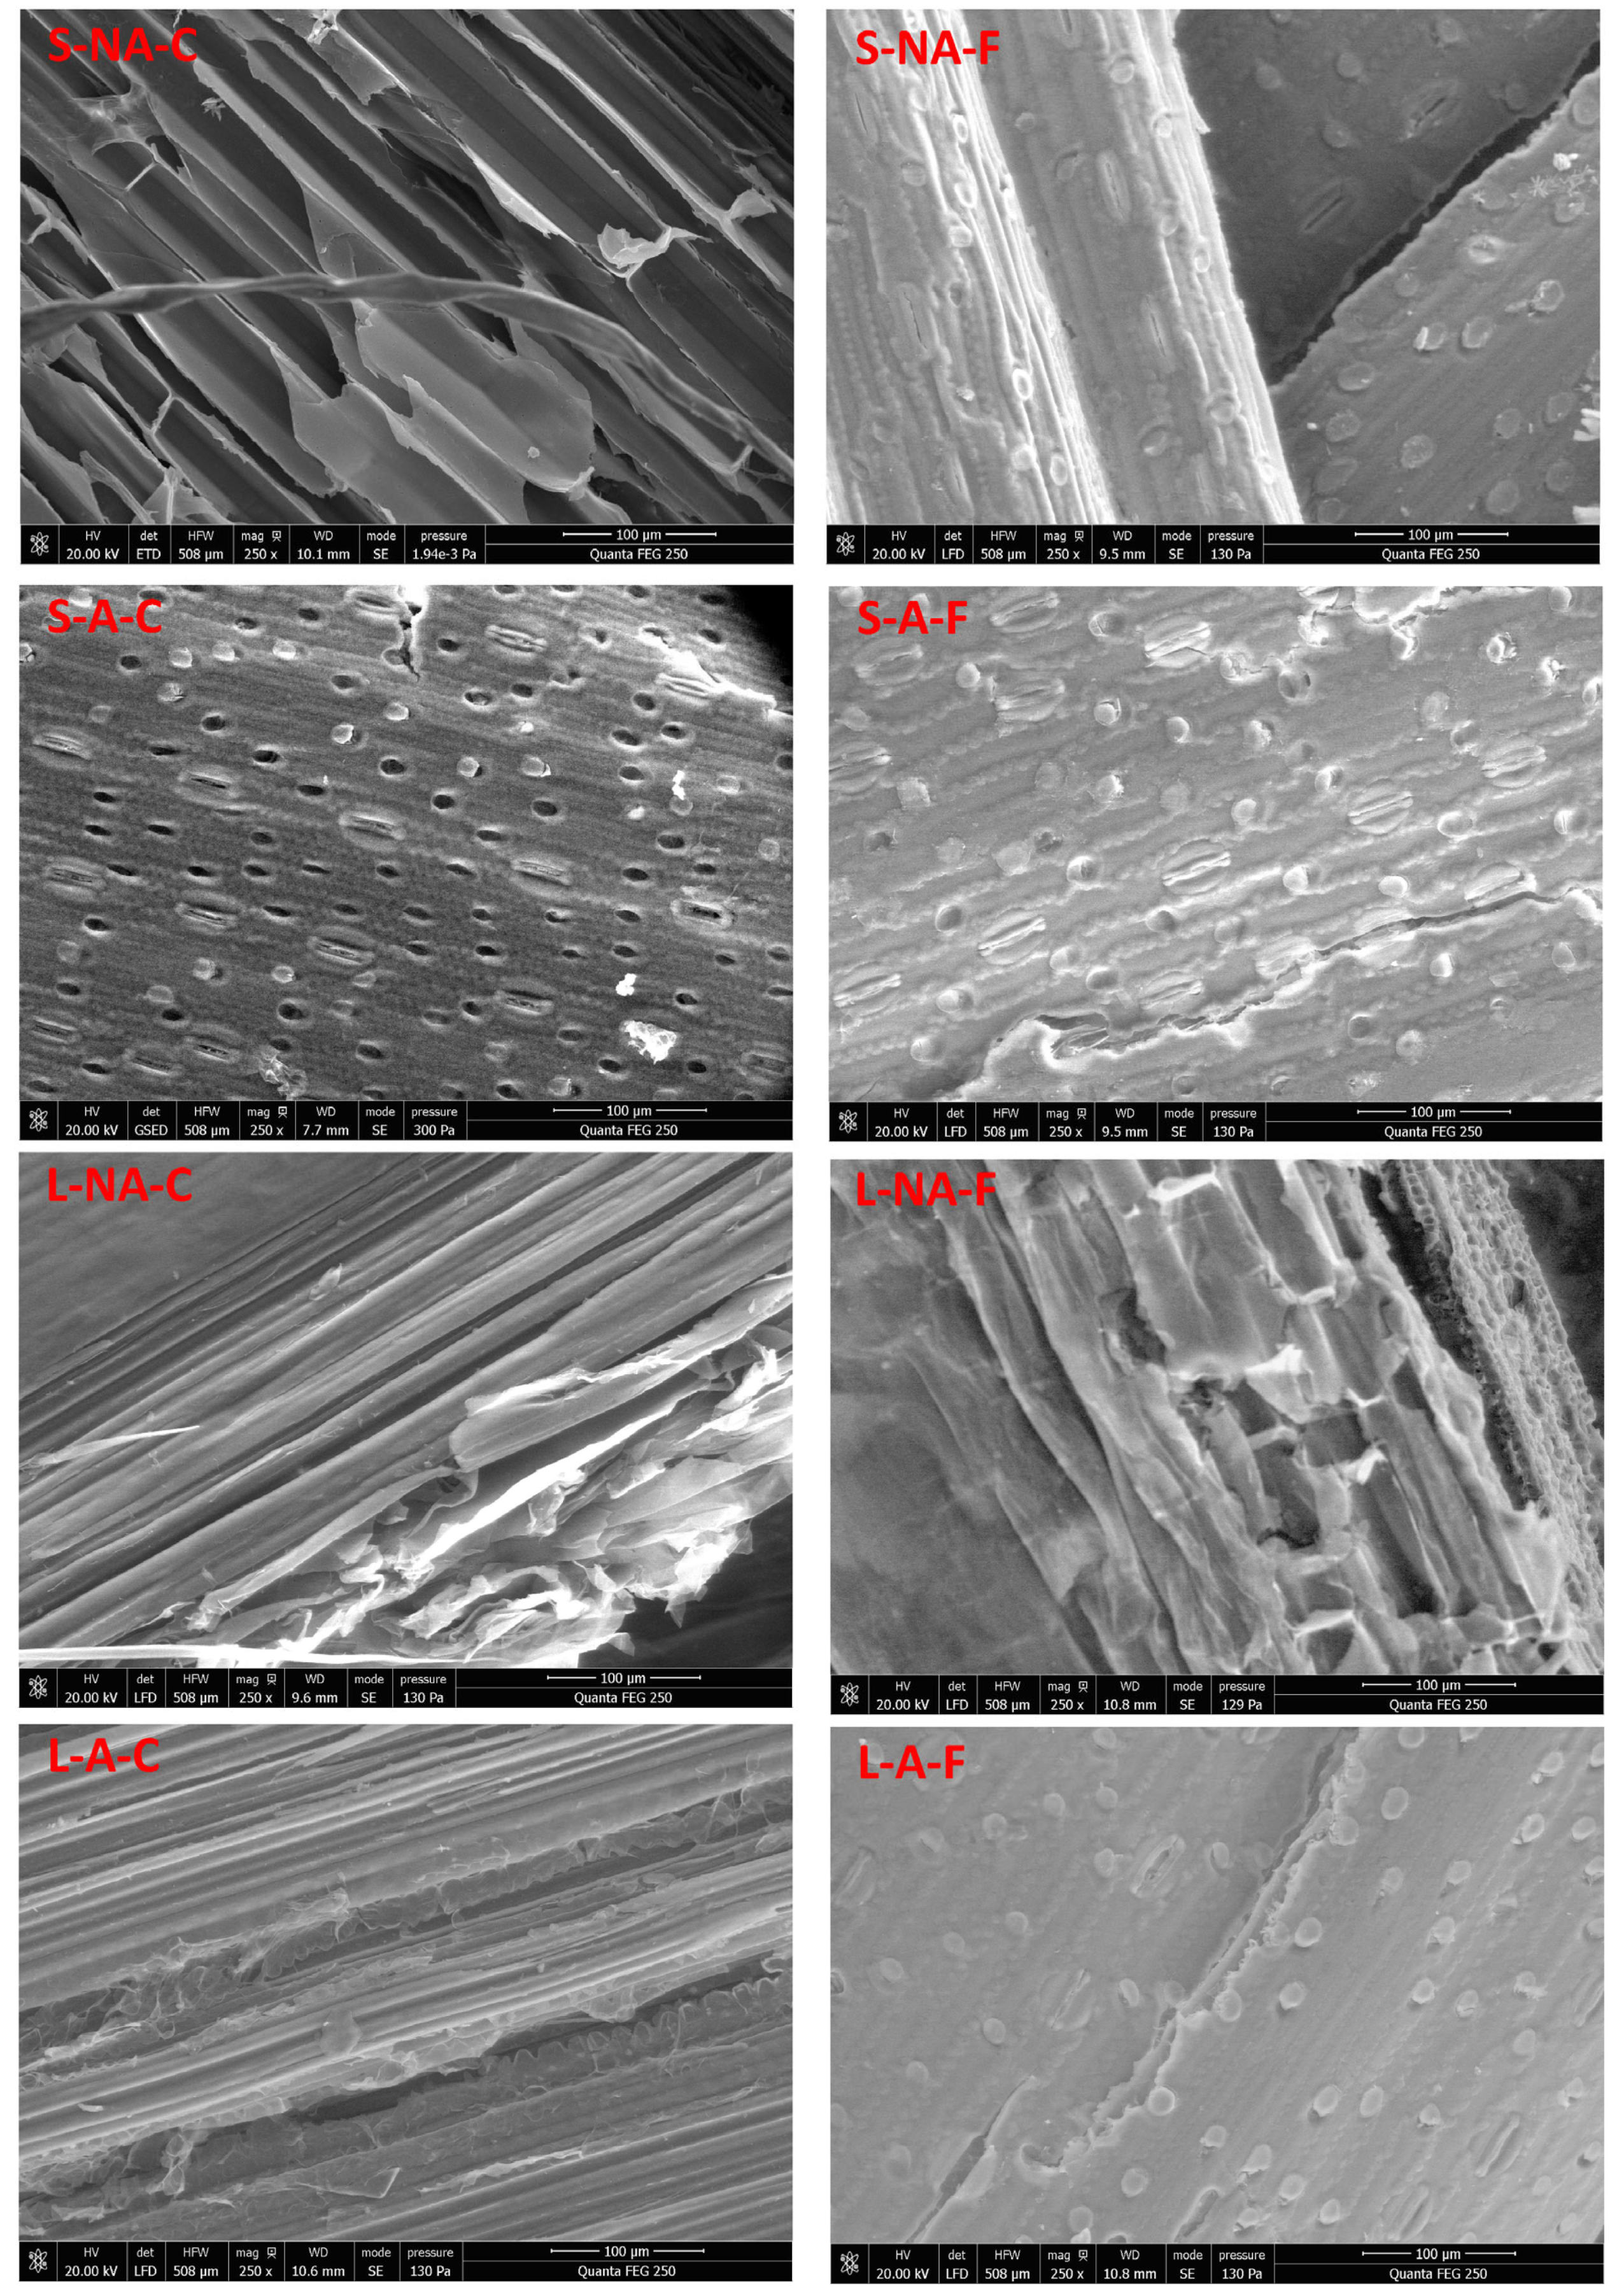
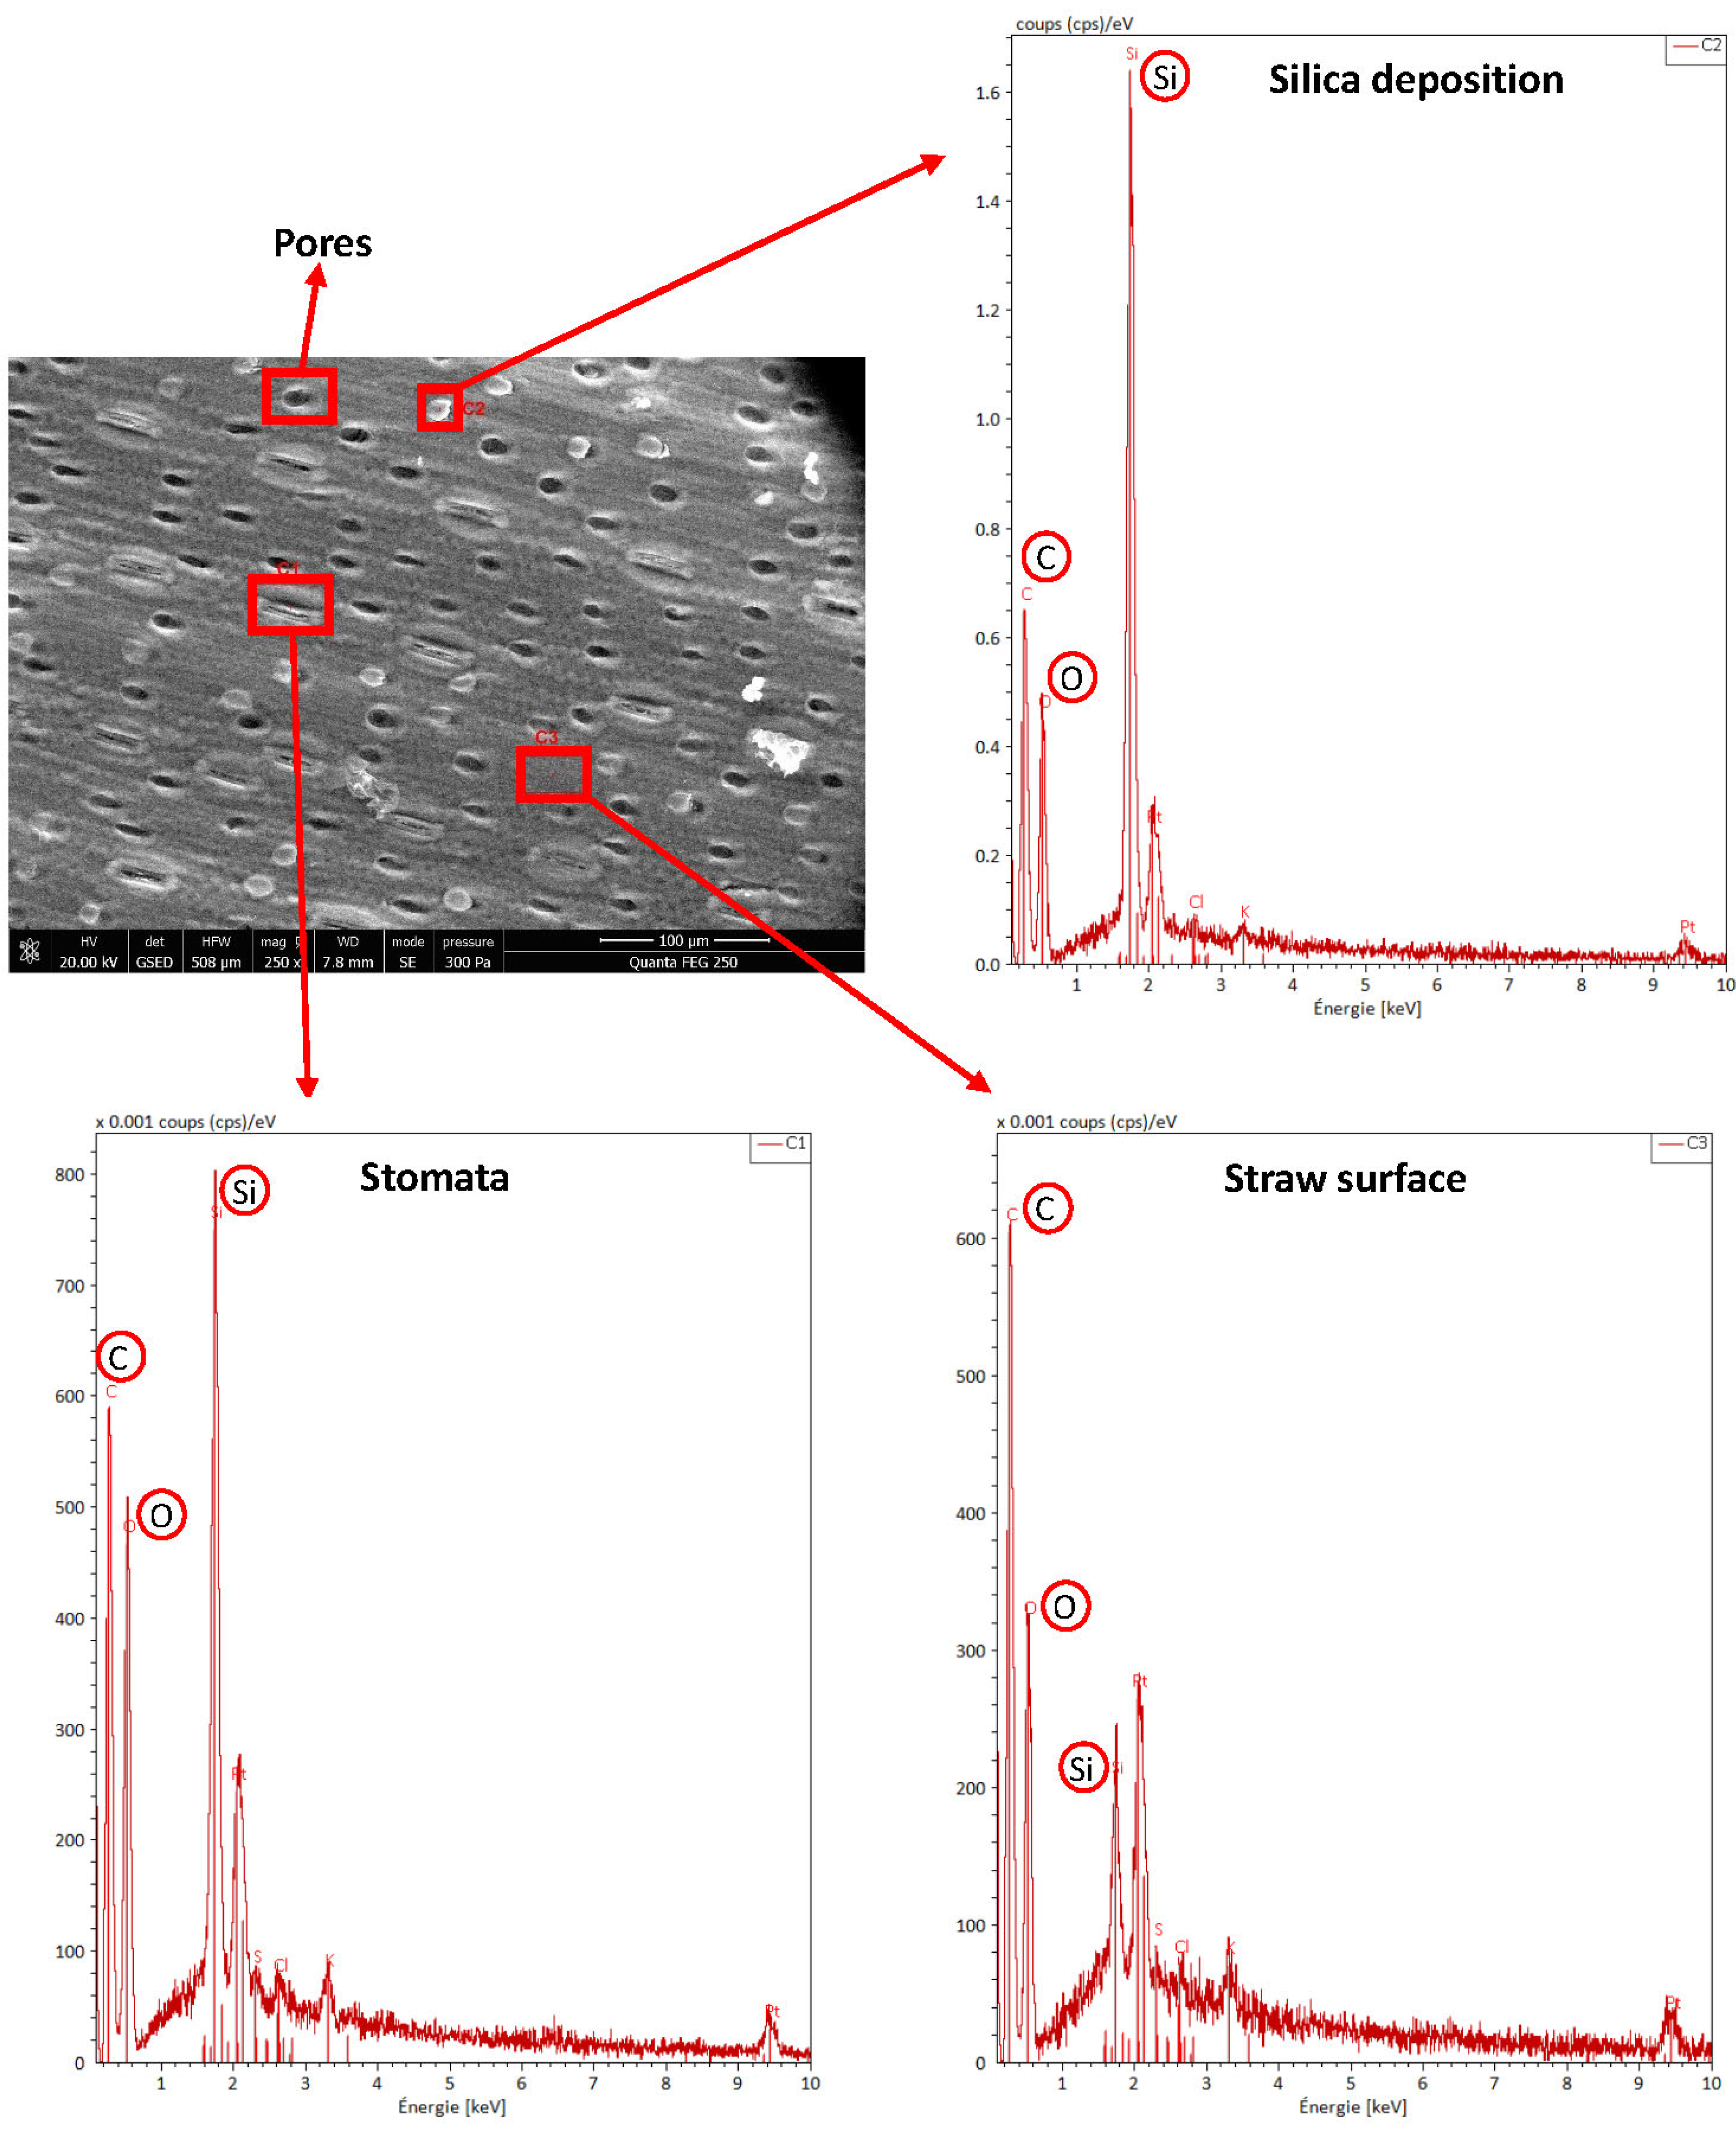
3.3.1. Surface Morphology Analysis by SEM-EDS

In Figure 5, it can be seen that control samples (S-NA-C and L-NA-C) have a very smooth, rigid surface which is the waxy layer covering the epidermal cells. This organized structure makes it difficult for the enzymes to penetrate and hard to digest [48]. In the case of small-size straw fraction, the autoclave process and addition of Fenton reagents partially degraded the epidermis and caused the stomata and silica bodies (as depicted in Figure 6) to be exposed and macro pores to be created (S-NA-F, S-A-C, and S-A-F). The pores are created due to the dissolution of lignin and hemicellulose as Fenton’s reagents preferentially degrade hemicellulose and lignin [49].
From Figure 6, it can be seen that the stomata also have high silica content because they help to reduce transpiration through stomatal pores [50]. The higher concentration of platinum in the spectra of EDS is due to the coating used for better resolution of images as mentioned in Section 2.5.1. From Figure 5, for the large-size straw fractions—L-NA-F and L-A-C, there were not much of structural changes observed as compared to its control (L-NA-C). However, the combined pretreatment of autoclave and Fenton process (L-A-F), did modify the structure and degrade the epidermal cells to expose the stomata and silica bodies. The difference in the surface morphology after different pretreatment conditions between the small size and large size fractions could be due to physical pretreatment. As small-size fraction provides more surface area for further pretreatment to act on, it could cause significant morphological changes to the surface. The more surface area obtained due to size reduction and the creation of pores could have provided more access for microorganisms during anaerobic digestion which resulted in better biogas potential in small-size fractions as compared to large-size fractions. Although, SEM analysis is quantitative and obtaining an effective characterization is challenging, it provides an overview of the structure that other analytical techniques do not provide [51]. Additional SEM images for each of the conditions studied are provided in the Supplementary Materials (refer to Figures S8–S15).

3.3.2. Porosity Indicator by Simon’s Staining

Simons’ staining test is an interesting method used to evaluate any structural variation occurring in biomass ultrastructure upon pretreatment [52]. With this test, it is possible to evaluate the variation in the pore size distribution of the lignocellulosic samples [30,31]. For this analysis, two dyes are applied: Direct Blue (DB) 1—a monomeric dye with a molecular diameter of approximately 1 nm—and Direct Orange (DO) 15—a polymeric dye with a molecular diameter of approximately 5 to 36 nm. Due to the difference in size and the higher binding affinity of DO, the DO molecules enter the larger pore and the surface while the DB molecules populate the smaller pores of the biomass [31,53,54]. Upon pretreatment of the biomass which might cause an increase in the pore size, DO will enter to a greater extent the enlarged pores. Accordingly, the ratio of the absorbed orange dye to the blue dye (DO/DB) can be used to estimate the pore size distribution of the lignocellulosic samples [32]. The DO/DB ratio for large and small size fractions upon autoclave and/or Fenton reaction is shown in Figure 7.
Results indicate that the Fenton reaction produces a significant increase in porosity, but the method does not point out any relevant differences between large and small fractions, and autoclaved and not autoclaved samples, as confirmed by a three-way ANOVA test (at 0.05 level). However, it must be emphasized that although Simons’ staining test is reported to be an indicator of changes in the material in terms of porosity occurring upon chemical and/or physical pretreatments, it remains a qualitative indicator.

3.4. Spectroscopic Analysis of Straw

Changes in the chemical composition of the biomass can occur as a consequence of a pretreatment. Such changes, when significant enough to be detected, can be highlighted by comparing the infrared spectra of lignocellulosic samples before and after the pretreatment and by assigning peaks to the functional groups that are characteristic of each component (cellulose, hemicellulose, and lignin). Thus, the reduction, disappearance, or frequency shift of a peak can be interpreted as a modification or complete/partial removal of the corresponding component [55,56,57,58,59,60]. Herein we used two infrared spectroscopies, diffuse reflectance (DRIFT) and attenuated total reflectance (ATR) spectroscopy, to try to evidence any spectral variation occurring in straw samples upon autoclaving and/or Fenton reaction.

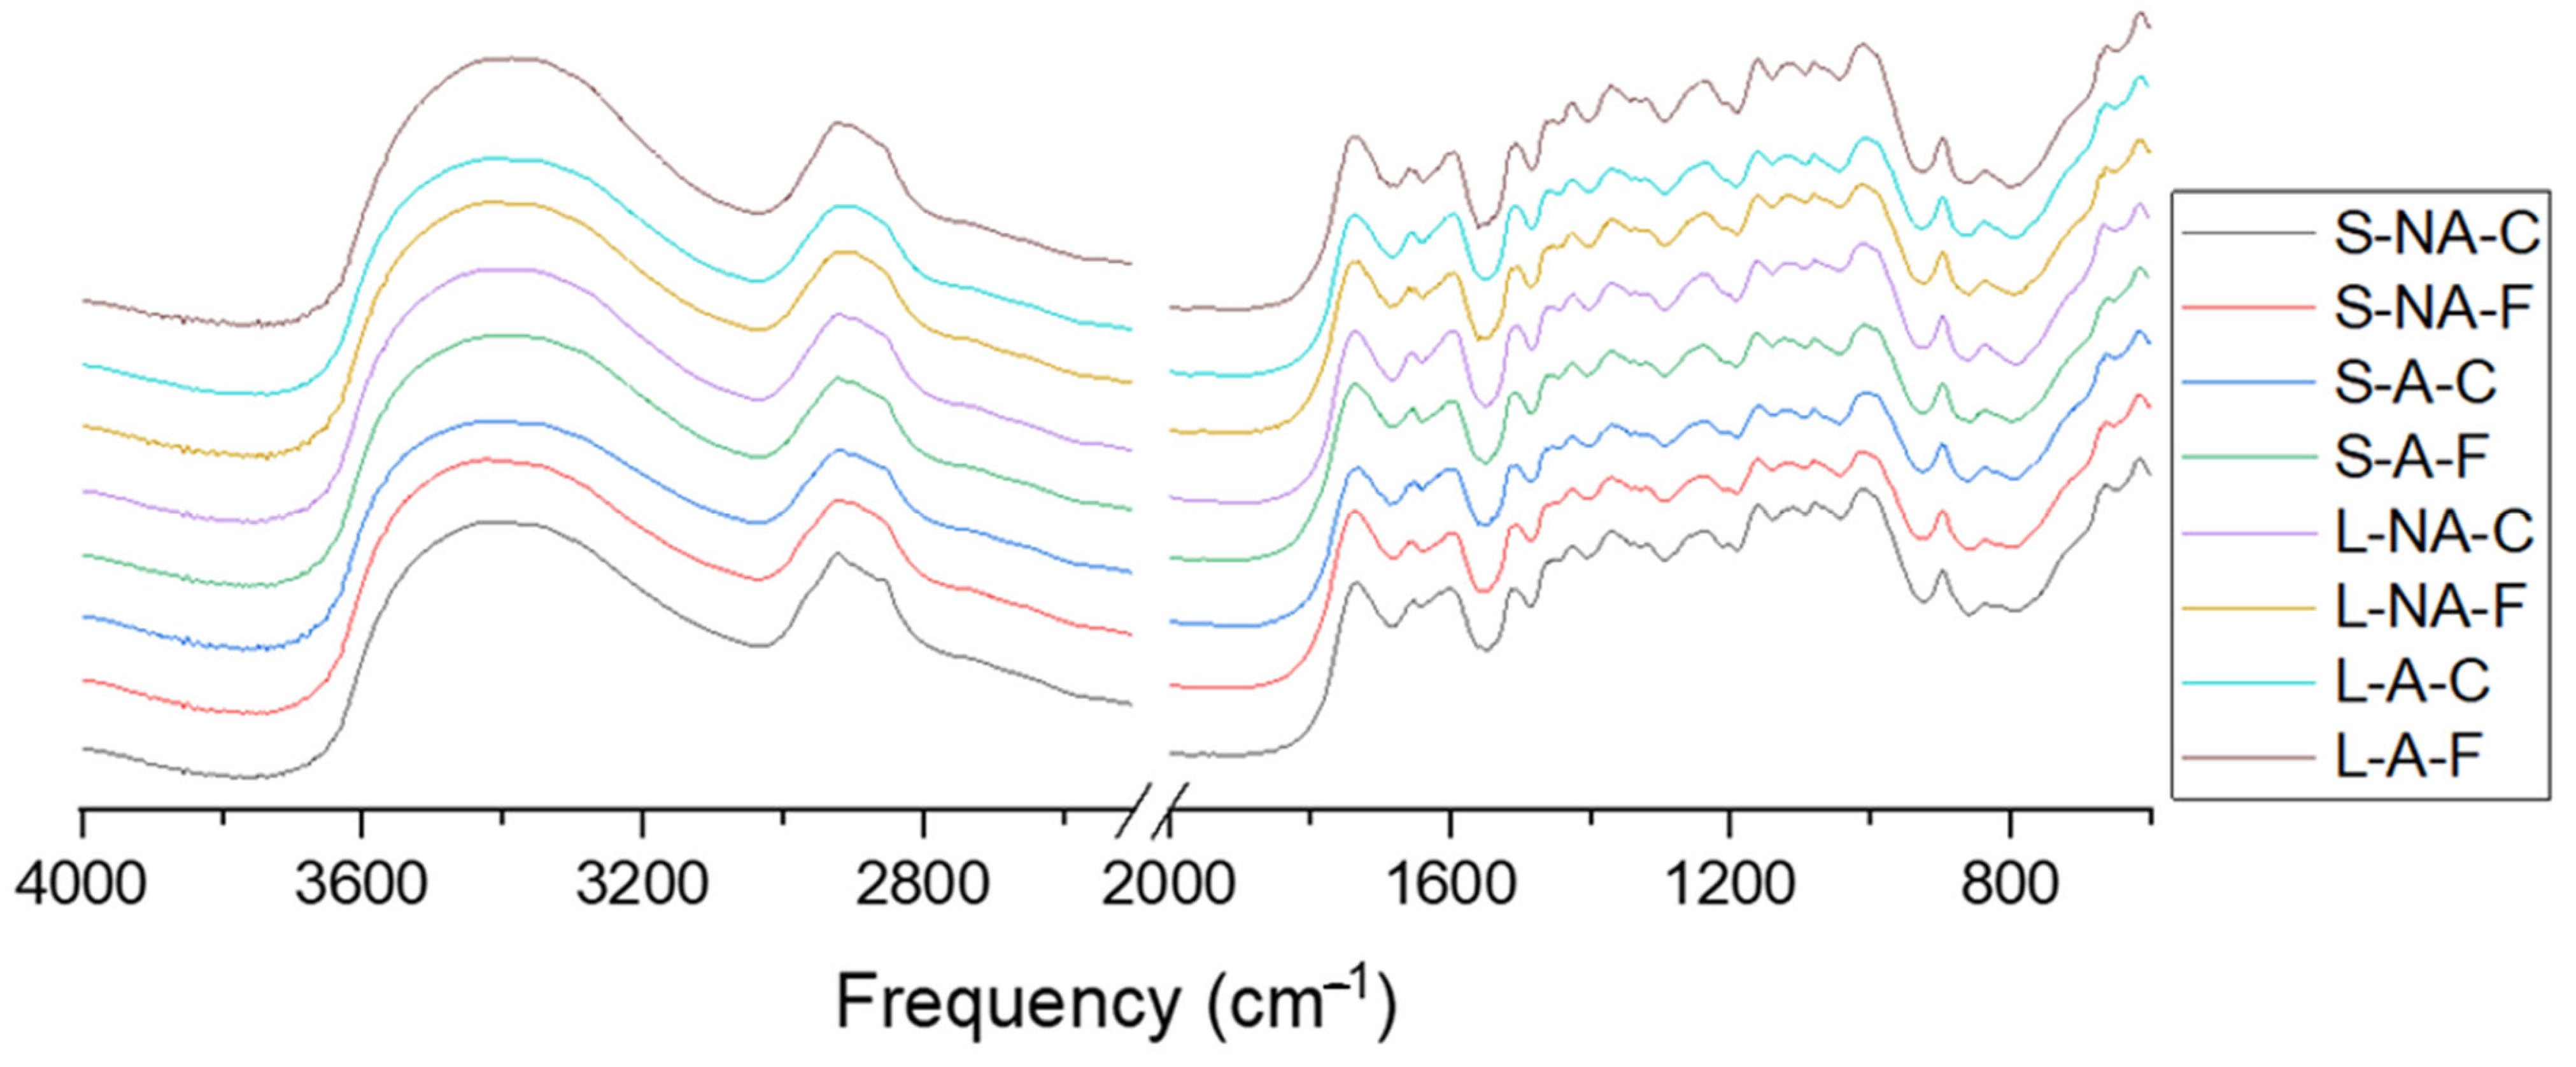
3.4.1. DRIFT Spectroscopy

DRIFT spectroscopy was mainly used because of the possibility of controlling the experimental conditions [61,62] such as the temperature and the moisture of the gas surrounding the sample. To improve the spectra quality some precautions were taken: the diffusion was enhanced by reducing the size of the samples (particle size ranges between 125 and 355 µm) [61,63] and the intensity was controlled by conveniently diluting the sample with an inert material, i.e., diamond powder. The spectral contributions of atmospheric carbon dioxide and water vapor were reduced by fluxing an inert gas at 50 °C. The DRIFT spectra for all pre-treated samples are shown in Figure 8. Spectra obtained were very similar, indicating that either the mild chemical pre-treatment or the autoclave conditions do not induce any significant variations in the chemical composition of the lignocellulosic biomass, or the method is not sensitive enough to detect them.

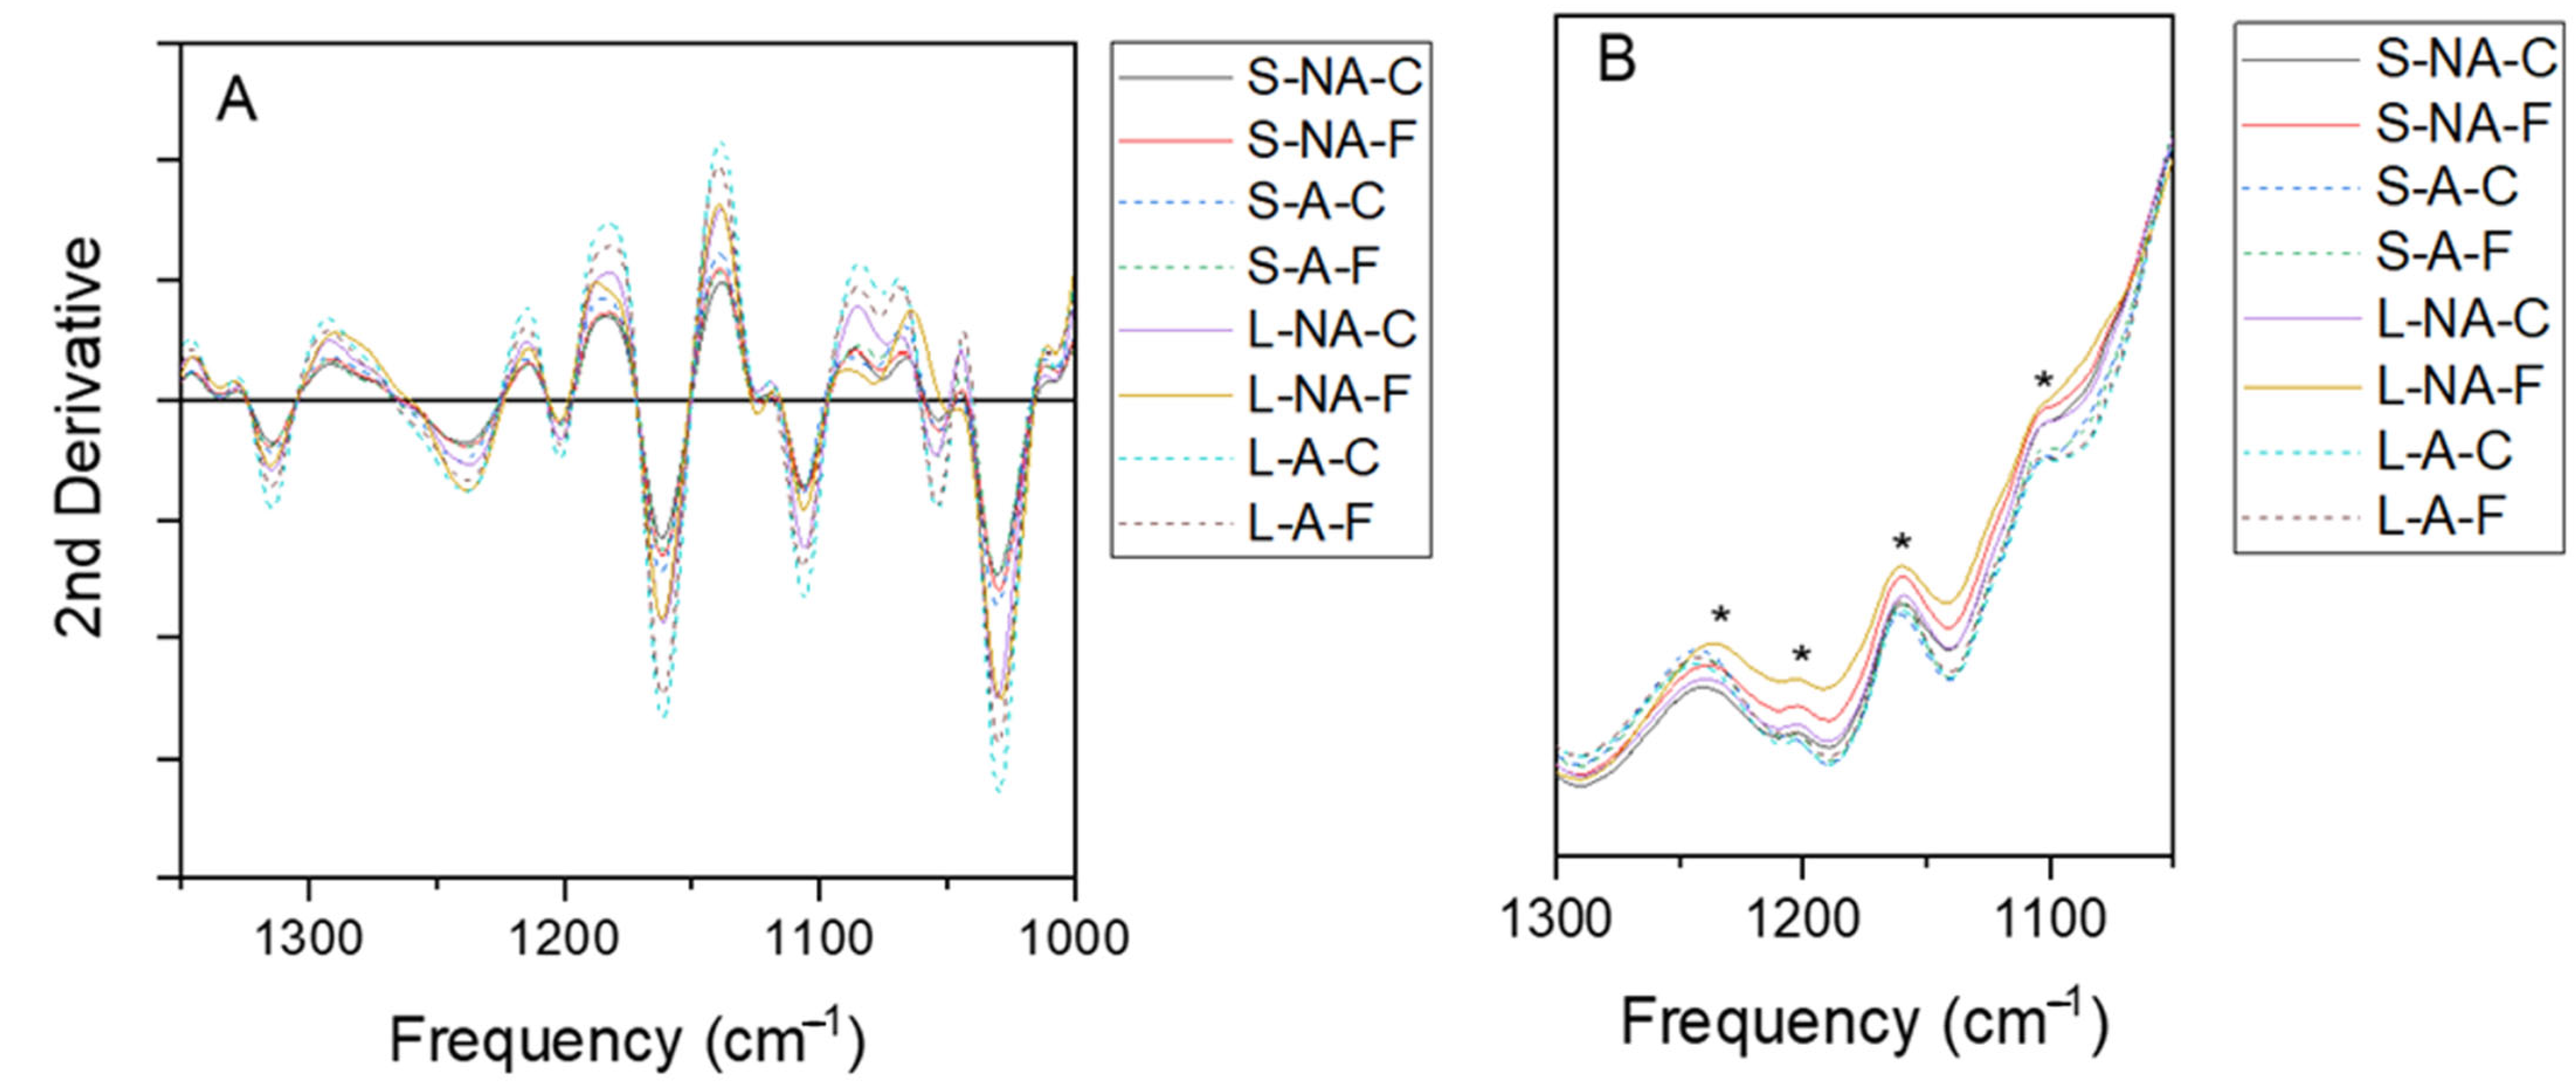
3.4.2. ATR Spectroscopy

In addition, ATR spectroscopy was used because this technique is even more rapid and does not require any sample preparation. Moreover, it was suggested as the best mode for Fourier transform infrared (FTIR) analysis of lignocellulose biomass under most circumstances [61]. The normalized ATR spectra for all the samples are shown in Figure 9. The ATR spectra confirm that no obvious modifications in the FTIR data after the pretreatment are observed.
However, to accentuate any possible difference between samples, all spectra were also pre-processed and plotted in second derivative mode as reported in Krongtaew et al. (2010) [64] (reported in the Supplementary Materials). Interestingly, when pointing out the most variable regions in the second derivative ATR spectra of the whole set of biomass samples (Figure 10A), and then coming back to the corresponding regions in the ATR spectrum (Figure 10B), some differences become visible in a fingerprint region in the range of 1300–1050 cm−1. Based on such differences, spectra can be separated into two groups, depending on whether they were autoclaved or not. Namely, the bands at 1235 cm−1 and 1200 cm−1, both related to the OH out-of-plane vibration mode of cellulose [65], are broadened and shifted at lower frequencies for samples not subjected to autoclave. Moreover, the band at 1160 cm−1, related to the antisymmetric bridge stretching of C-O-C of cellulose and hemicellulose [60], is sharper after the autoclaved samples. Lastly, the intensity of the band at 1100 cm−1, related to the amorphous cellulose [60,66], was reduced after the autoclave. These data suggest that slight, also significant, differences in the cellulose and/or hemicellulose can be evidenced by second derivative ATR-FTIR spectra after autoclave.

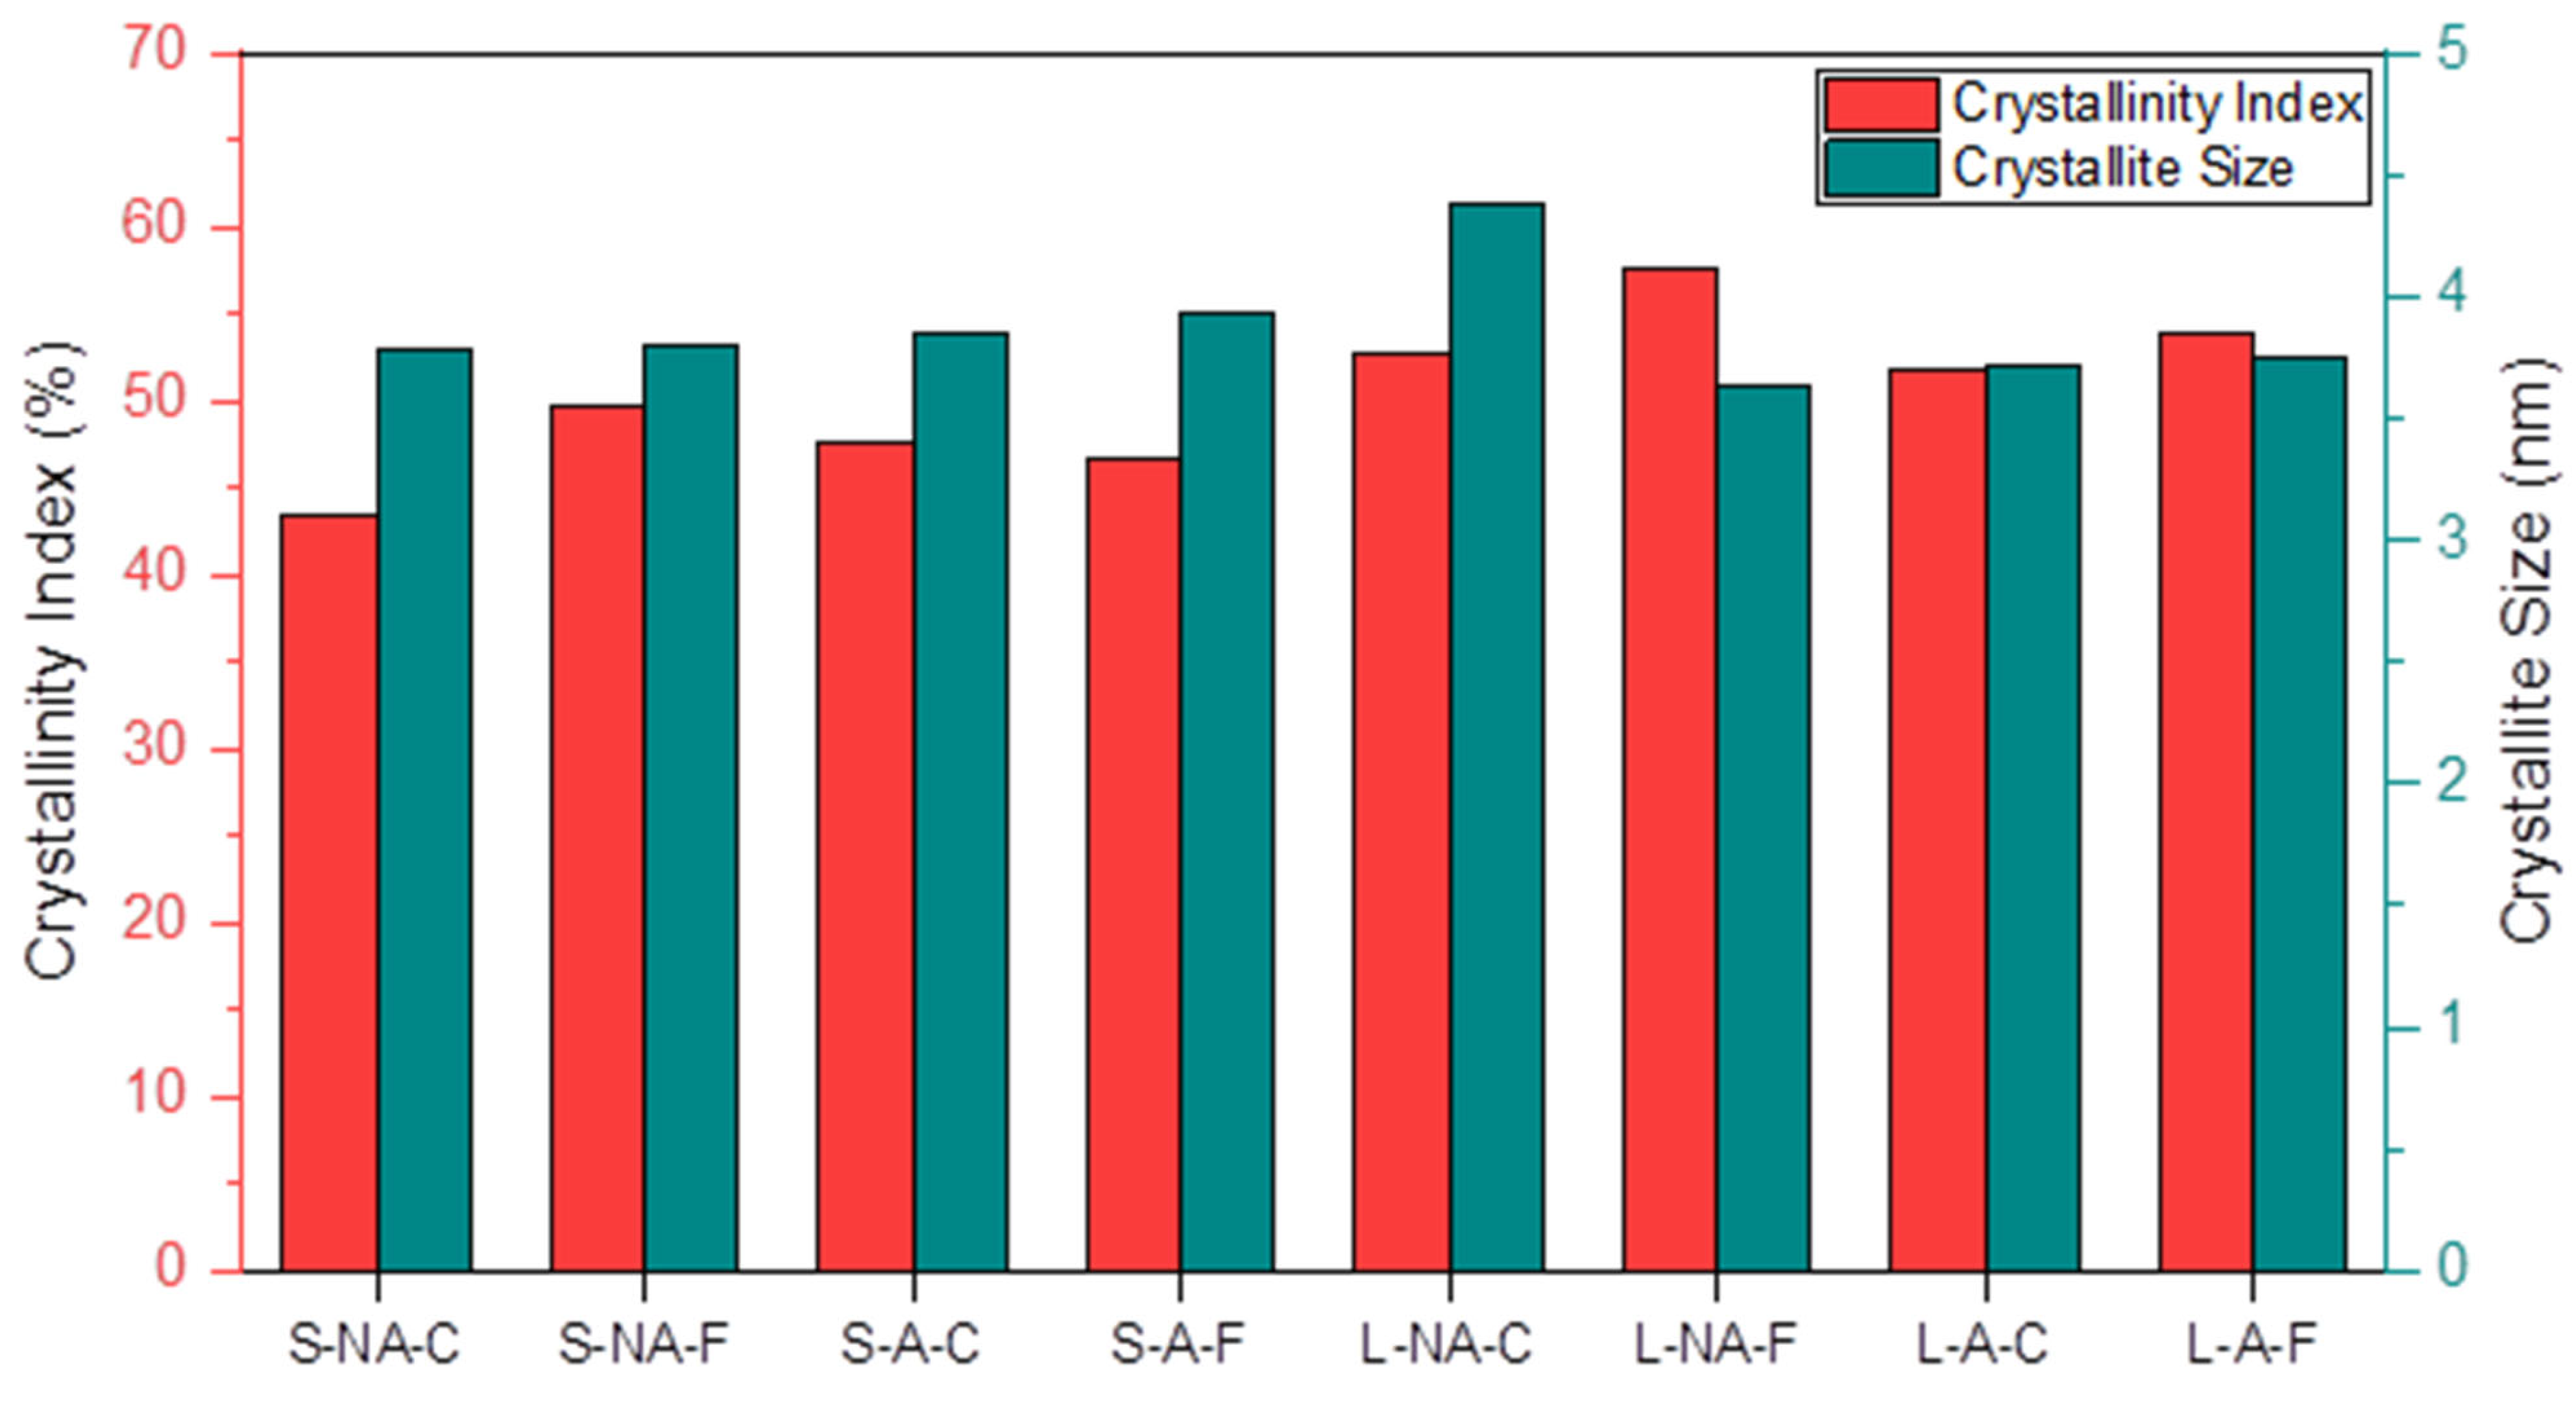
3.5. Cellulose Crystallinity and Crystallite Size by X-ray Diffraction

The cellulose crystallinity (Crystallinity Index, CI) which is an estimation of the relative amounts of crystalline (ordered) and amorphous (less ordered) part of the biomass is a key parameter often used to characterize the biomass after pretreatment [67]. X-ray diffraction is a widely used technique to determine the CI of the biomass and, in turn, to interpret changes in the solid structure after pretreatments.
Here, the cellulose crystallinity index (CI) was obtained with a curve-fitting process of the X-ray diffraction spectrum into amorphous and crystalline contributions (for more details see Supplementary Materials) [36,67,68]. This technique (Figure 11) shows that CI is around 40% for all straw samples. It can therefore be concluded that the pretreatment conditions studied are not enough drastic to cause conspicuous variations of the cellulose crystallinity.
Another important measurable parameter related to cellulose supramolecular structure is its crystallite size. The average crystallite size can be calculated by applying the Scherrer formula, which directly correlates the crystallite size to the width of the crystalline peak (002) [38,67]. As shown in Figure 11, autoclaving and Fenton pretreatment do not affect the cellulose crystallite size, which remains approximately in the 40 Å-range. As reported by Simon [52], a crystallite size beyond 40 Å indicates both the coalescence of neighboring microfibrils with the loss of interstitial water and the reduction of amorphous cellulose proportion in the material.
Overall, from XRD data, no significant changes in the CI nor the crystallite size could be evidenced after straw pretreatment. However, it can be concluded that the chosen pretreatment conditions do not lead to a decrease in the amorphous content of the straw, which could be detrimental to its further enzymatic hydrolysis during anaerobic digestion.

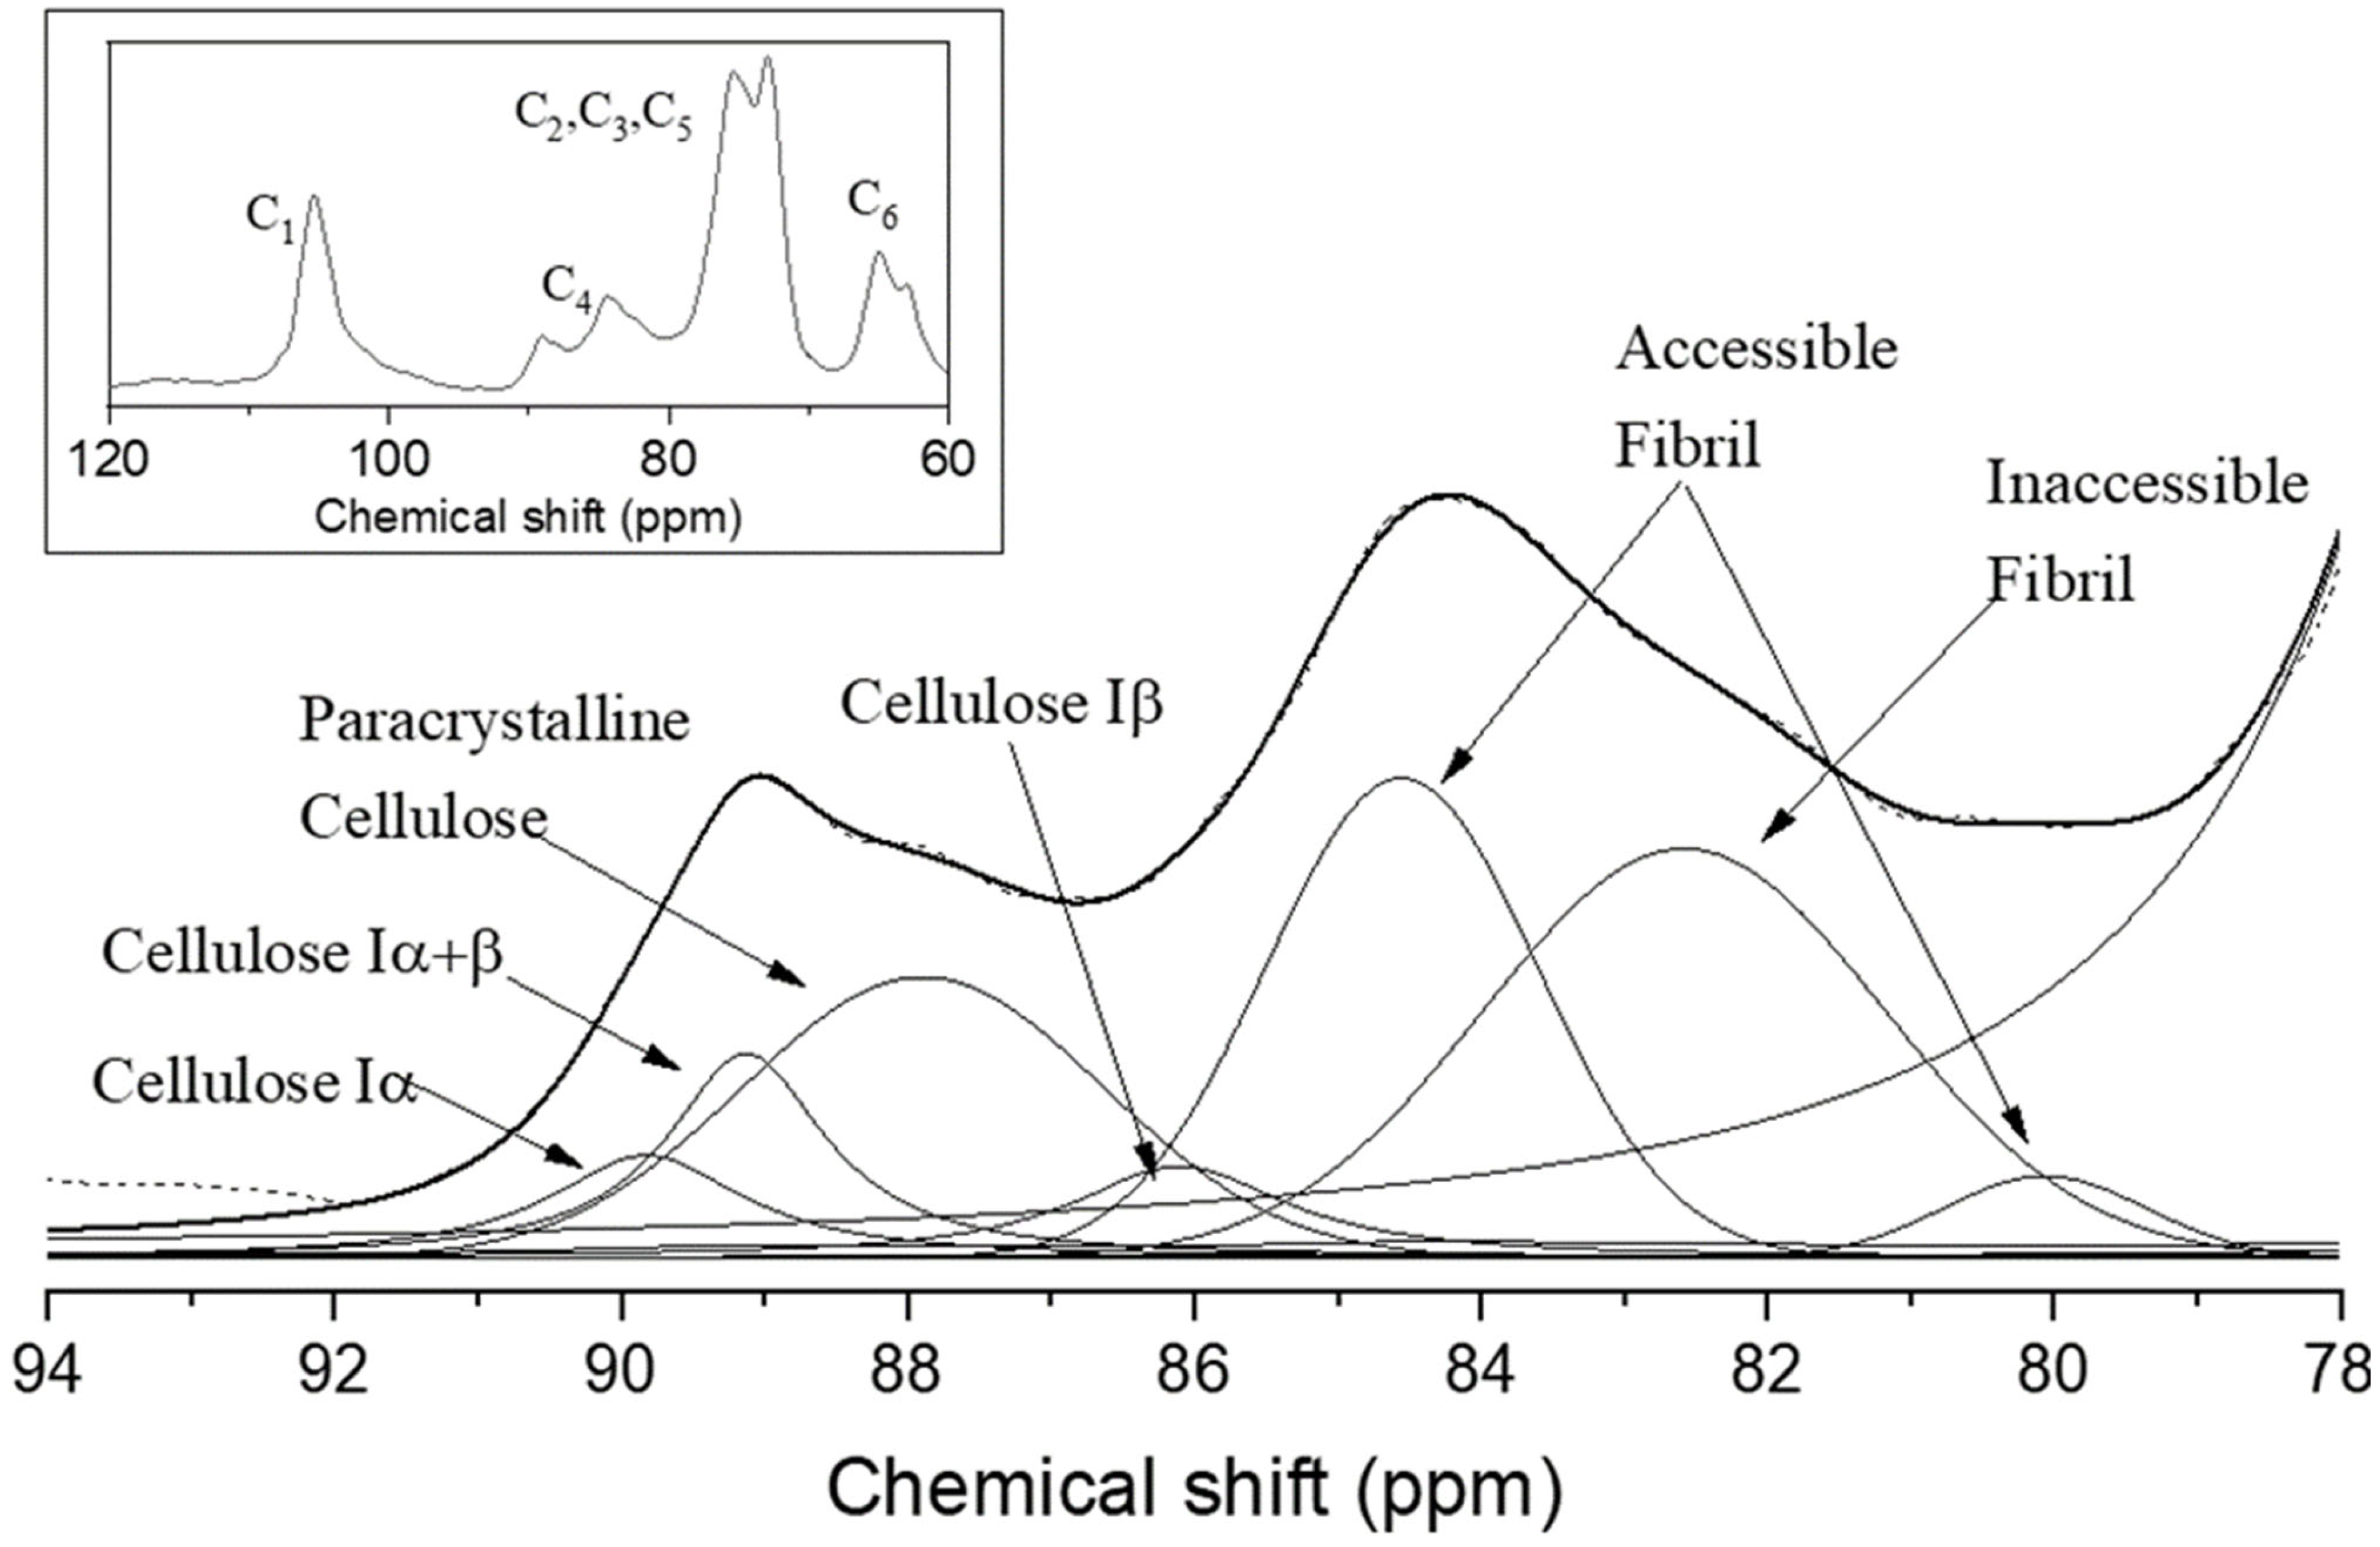
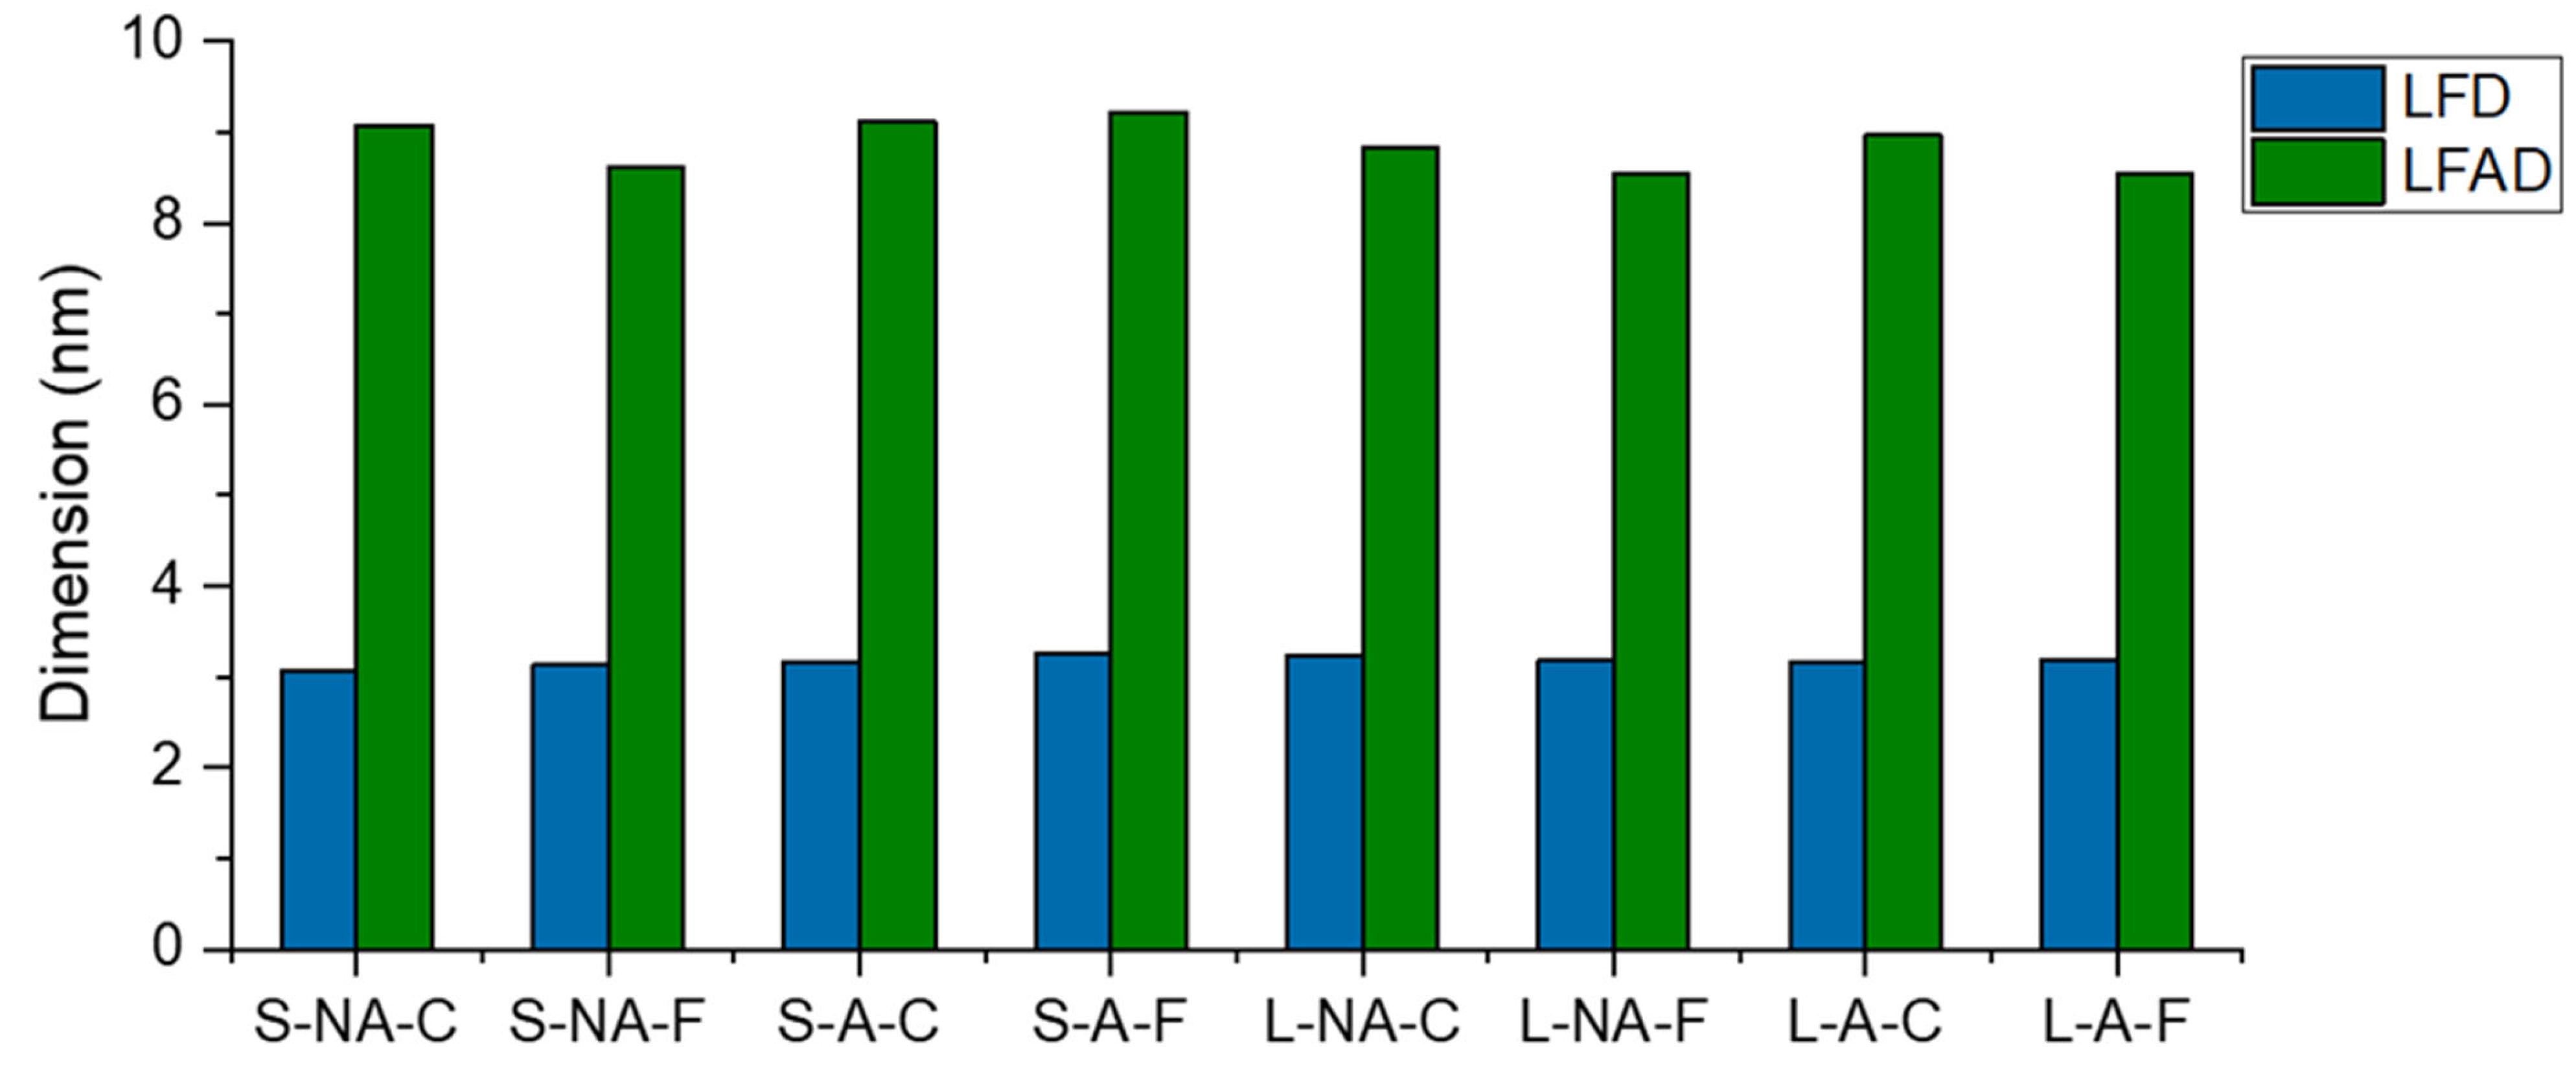
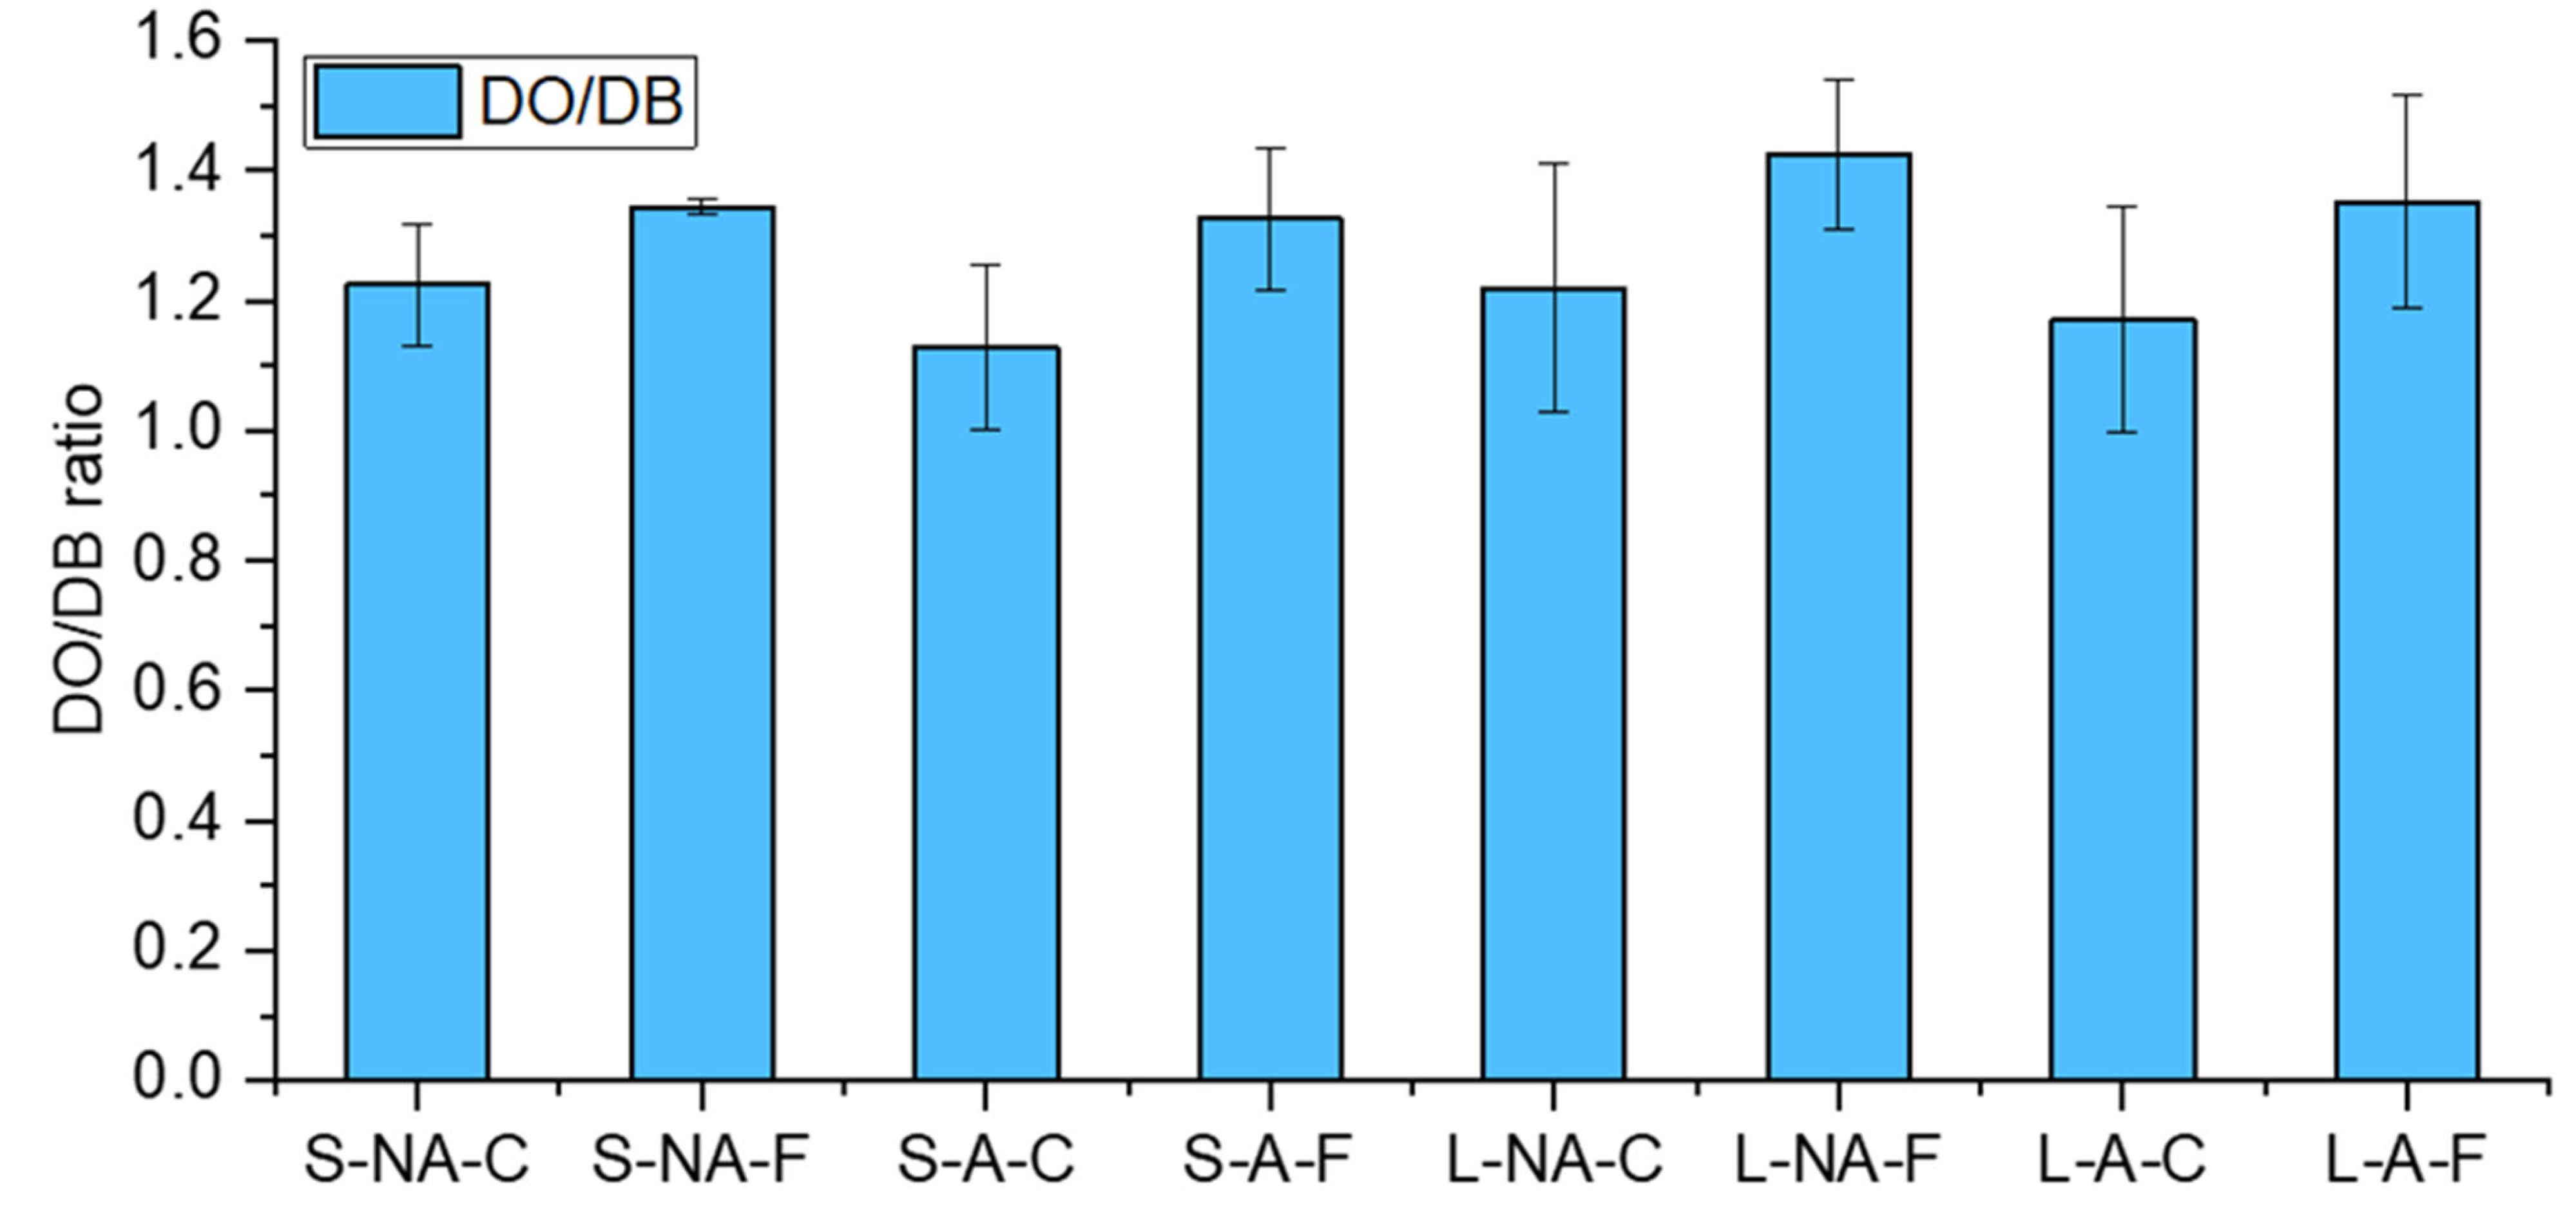
3.6. Multi-CP MAS 13C NMR Spectroscopy

Among the techniques used to estimate crystalline index, solid-state 13C NMR (ssNMR) was reported to be very powerful, leading to more relevant information compared to XRD because it makes it possible to access the CI of cellulose while CI calculated from XRD data reflects the CI of the whole biomass. However, because hemicellulose, lignin, and disordered cellulose domain together contribute toward the amorphous part of the NMR signal, it is necessary to be able to evaluate their relative contributions [67]. A pioneering work from Iversen and co-workers [69], reported the presence of cellulose forms with decreasing degrees of crystallinity—namely crystalline, para-crystalline, and amorphous cellulose—and proposed to use of ssNMR to estimate their relative proportions. In addition, the same group demonstrated that ssNMR can discriminate between amorphous cellulose at accessible and at inaccessible fibril surfaces [70]. This method, primarily applied to study pure cellulose, has been later applied to study lignocellulosic biomasses [68,71,72].
Here we used the method proposed by Berardinelli et al. (2015) to obtain information on the cellulose crystallinity index of sugarcane bagasse samples by using a spectral editing procedure that removes the lignin signals from the ssNMR spectrum of lignocellulosic biomass [68]. In their work multi-CP MAS 13C NMR was preferred to CP MAS since it provides quantitative data [39,68]. In the present work, the lignin spectrum was obtained from the multi-CP MAS 13C NMR analysis of the precipitated supernatant obtained from an untreated straw sample after a two-step procedure (1% H2SO4 + 4% NaOH, the detailed procedure is reported in the Supplementary Materials), with the evident advantage of avoiding any chemical treatment that could cause changes in the cellulose crystallinity.
One example of the resulting multi-CP MAS 13C NMR spectrum of a straw sample after subtraction of the lignin contribution is shown in Figure S5 in the Supplementary Materials. The contributions of hemicellulose and cellulose to the signal are in the 20–180 ppm region, with cellulose peaks in the region between 60 and 120 ppm (inset in Figure 12). Beginning from the lower chemical shift (δ), the region between 60 and 70 ppm shows two peaks assigned to the C6 carbon of cellulose and hemicellulose, the lower chemical shift being assigned to non-crystalline cellulose and cellulose while the higher chemical shift peaks were assigned to crystalline cellulose. The 70–80 ppm region is a cluster assigned to the C2, C3, and C5 carbons of cellulose and hemicellulose. The regions between 80 and 92 ppm, and between 102 and 108, are associated with the C4 and anomeric C1 carbons of cellulose and hemicellulose, respectively [73,74].
The C4-carbon region (Figure 12) was used to extract information concerning the cellulose CI of the solid straw samples before and after pretreatment [68,70,75]. More in detail, the region typical of the less ordered cellulose (80–85 ppm) is decomposed into three peaks, assigned to accessible (δ approximately at 80 and 84.5 ppm) and inaccessible (δ approximately at 82.5 ppm) cellulose at the fibril surface. On the other hand, the region typical of the more ordered cellulose (85–92 ppm) contains 4 signals assigned to cellulose crystalline allomorphs Iα and Iβ (δ approximately at 86, 89, and 90 ppm), and to the cellulose para-crystalline (δ approximately at 88 ppm). The spectral fitting of the C4-carbon region was performed for all the samples using the model and method reported by Larsson et al. (1997) [69,75]. The contribution of hemicellulose in the 80–85 ppm range was embedded with the lower chemical shift part of the peak of the C2, C3, and C5 carbons cluster. The fitting of the NMR spectrum was performed with the following constraints imposed for all the samples: decomposition into seven peaks with identical maximum positions and FWMH. The result of the fittings of the solid straw samples before and after pretreatment and their assignments are compiled in the Supplementary Materials.
The crystallinity index of cellulose could then be calculated as the ratio of the intensity of the fitted peaks assigned to crystalline cellulose (85–92 ppm) to the intensity of the seven peaks assigned to cellulose in the 80–92 region. The results are shown in Figure 13. The cellulose CI for all samples is approximately 40%, which is in agreement with the WAXD analysis (in Section 3.5) and with the data reported in the literature [76]. The CI remains nearly constant for all the samples, whatever their size or their pre-treatment type, suggesting that the cellulose crystallinity is not altered by the pretreatment.
In addition to the CI calculation, spectral fitting is also useful to estimate the supramolecular structures of cellulose [70,77,78,79]. Indeed, cellulose is structured in fibrils with a crystalline core surrounded by a non-crystalline cellulose layer. From the fraction q the intensity of non-crystalline surface cellulose (accessible and inaccessible cellulose) to the total cellulose, and by using a simple fibril model with a square cross-section, the average lateral fibril dimension (LFD) can be computed:
q = 4 n 4 n 2
LFD = n × c  
where n is the number of cellulose polymers perpendicular to the cross-section along one side of the square fibril cross-section, and c is a conversion factor of 0.57 nm per cellulose polymer [70,77].
Moreover, since cellulose fibrils aggregate, only a fraction of the non-crystalline cellulose is accessible to the solvent. Therefore, by considering the fraction q of only the accessible non-crystalline surface cellulose to the total cellulose, and by using the same fibril model with a square cross-section, the lateral fibril aggregate dimension (LFAD) can also be computed with the same equation. The results of this analysis are shown in Figure 14 and indicate that pretreatment conditions have no significant effects on both the fibril dimension (LFD) and the microfibril, or fibril bundle, dimension (LFAD). This was expected since there is no significant variation in the relative amount of accessible and inaccessible cellulose at the fibril surface (See Table S1 in the Supporting Information). As also reported elsewhere [80], WAXD cellulose crystallite results and NMR LFD results provide a similar trend, even if the WAXD crystallite size results are underestimated in comparison with the NMR LFD.

3.7. Discussion and Perspectives

From this study, it is observed that size reduction does not affect the crystallite size, crystallinity index, or porosity. However, there is a significant increase (up to 24%) in the BMP and a drastic increase in the kinetics (up to 39%) due to just a small decrease in the particle size range. Although the methane content of autoclaved or low-concentration Fenton pretreatment varied, they were not significantly different. Nevertheless, the successive pretreatment using autoclave and Fenton increased the kinetics and the BMP. This means that autoclaving plays a key role in enhancing Fenton reactions. This factor should not be ignored when one performs relevant studies as autoclaving is a general practice prior to the study of the effect of biological pretreatment of biomass on biofuel yield. Autoclaving or Fenton pretreatment was shown to affect the surface of the biomass according to SEM image analysis. Even though there were more morphological changes observed in the small-size fraction samples after autoclaving or Fenton pretreatment, the lignin proportion did not decrease in the samples nor was the cellulose crystallinity affected. Moreover, large-size fractions showed lignin degradation, yet, their methane potential is lower than that of the small-size fraction. These results show that the size reduction provides more surface area for microbial attack during the downstream process which is more important than the lignin degradation efficiency of the pretreatment process. However, it is to be re-iterated that Menardo et al. (2012) could only achieve a 17% increase in biogas yield due to a size reduction from 5 cm to 0.2 mm of wheat straw and Dumas et al. (2015) did not see any increase in BMP due to micronization of wheat straw. Therefore, there is a threshold at which the increase in BMP due to size reduction varies [45,46]. This threshold represents the extent to which heat and mass transfer phenomena do not limit the whole biogas production any longer. In this study, combining size reduction, autoclaving and Fenton pretreatment helped to obtain 75% of the theoretical BMP and significantly increased the kinetics by 53%. When Moset et al. (2018) studied the pretreatment of wheat straw for BMP enhancement, they highlighted that a mild combined mechanical, thermal, and chemical pretreatment allowed them to achieve greater efficiency [81]. Nevertheless, the energy output to input ratio cannot be overlooked for the successful implementation of a pretreatment process.
Uellendahl et al. (2008) studied the energy balance and cost-benefit analysis of biogas production of corn, miscanthus, and willow with and without wet oxidation pretreatment. They concluded that based on the biomass yields obtained in Denmark, the pretreatment of miscanthus and willow shows a positive net ratio of energy output to input as compared to corn while having lower costs for the biomass supply chain and conversion to biogas. This was because the biogas potential of corn did not improve after wet oxidation while there was a significant increase for miscanthus and willow. Moreover, the cost of production of miscanthus and willow is considerably lower as they require less fertilizer and pesticide application than corn, thereby making it a more sustainable choice to use for biogas production [15]. Therefore, the choice of pretreatment should be based on the capability to reduce the cost of operation, inhibit toxic compound formation, reusability of the chemical used during the process, and which should be environment friendly [82].
In recent years, there have been numerous research studies on different pretreatment methods to enhance the digestibility of lignocellulosic material (such as straw and spent coffee). Size reduction is an unavoidable step in preparing the feedstock for the biorefinery process. Many researchers use ground biomass passed through a 2 mm sieve for their pretreatment studies. In such a practice, the stochastic nature of the grinding and sieving process may cause randomness in results from different research groups. Oyedeji et al. (2020) reviewed the influence of grinding equipment and biomass properties on size reduction and discussed the inconsistency when comparing the results obtained from different analytical methods [22]. There are also various other factors described in these literature studies, such as an increase in the surface area [7,46,83,84], a decrease in the lignin content [85,86], reduced crystallinity of cellulose [87,88,89], and pore size of the substrate in relation to size in enzymes [90,91,92] which are essential to improve the hydrolysis and thereby increase biofuel yield. However, Ferreira et al. (2014) [93] concluded that cutting the wheat straw to 30–50 mm produced 10.4% higher methane production than grinding the wheat straw to less than 1 mm. Some researchers [94,95] have also reported no lignin degradation or increased lignin content after chemical pretreatment and yet improvement in the enzymatic digestibility of the biomass. Contradictory to some literature mentioned before, Grethlein (1985), Kim et Holtzapple (2006) and Pu et al. (2013) [96,97,98] have reported that an increased degree of crystallinity because of the removal of amorphous components did not negatively affect enzymatic hydrolysis. Similarly, Zhang et Lynd (2004) [99] also concluded that even if the pore size of the substrate is bigger than that of the enzyme, it is likely that the enzyme is trapped in these pores and therefore, results in a lower hydrolysis rate. This contradictory nature of analytical results makes it difficult to determine which characteristics are most important to declare a pretreatment method as successful [100]. It is also to be noted that the various characterization techniques used require very few milligrams of the biomass, which is not always representative of the heterogeneous biomass which in turn could lead to biases in the results. One should also pay attention to the particle size used for biomass characterization studies. Standard protocols for lignin analysis [17] require the biomass particle size to be restricted as deviation from it may result in low or high bias in the results. If analytical protocols call for much size reduction, it could be so overwhelming that the effect of pretreatment would be no more obvious. In this article, we have underscored that the efficiency of pretreatment cannot be explained only using analytical studies but an in-depth analysis of the bioenergy production is needed to validate the choice of pretreatment. The question remains whether the experimentally validated results from pretreatment studies will help to create simulation tools to predict the performance of feedstock. Amon et al. (2007), Dandikas et al. (2014), Thomsen et al. (2014) and Triolo et al. (2011) [101,102,103,104] have all developed models for BMP prediction of lignocellulosic biomass, each based on a component they found to significantly influence the methane yield but none of them have considered pretreated biomass so far since the correlation is not very direct.
Ultimately, a poor correlation is found between the biogas production and the characterization results despite the various technologies used. The understanding of the mechanism behind the biogas yield change due to pretreatment is still not clear. The authors call for further research into the improvement of current biomass characterization techniques, such as infrared spectrometry, microscopic analysis, NMR, and accessibility studies. Researchers are also encouraged to develop novel surface analytical methods with a multidisciplinary collaboration between surface chemistry and (bio)chemical engineering science.

4. Conclusions

A combination of particle size reduction (<2 mm), autoclaving (121 °C at 2 bars for 20 min), and Fenton reaction (1.047 mM of Fe2+ and 0.1475 M of H2O2) produced the highest methane potential (356 ± 11 NLCH4/kg VS). Grinding of straw contributed to the maximum increase in the biomethane potential. Only Fenton or only the autoclave process improves the kinetics slightly but does not considerably improve the biomethane potential. Combining autoclaving and low-concentration Fenton pretreatment considerably improves the BMP values. Therefore, the synergy of combined pretreatments is better than single pretreatment. The intricacy of the lignocellulosic matrix and heterogeneity in physicochemical composition within the species makes it complex to study.
However, the poor correlation between biogas production and the different physical and chemical biomass characteristics makes it difficult to explain the outcome of various pretreatment methods applied to biomass. Without further improvement and development of analytical techniques, the prediction of the biomethane potential of a feedstock with the aid of pretreatment can only be considered in case-by-case studies.

Supplementary Materials

The following supporting information can be downloaded at: https://www.mdpi.com/article/10.3390/en16031146/s1, Figure S1: Second derivative spectra from DRIFT spectra of pretreated samples and controls. Figure S2: Second derivative spectra from ATR spectra of pretreated samples and controls. Figure S3: Multi-CP spectrum of S-NA-C sample (black line) and after the first (red line) and second treatment (blue line). The spectra are normalized with respect to the maximum peak at 73 ppm. The dotted lines represent the scaled Multi-CP spectrum of the precipitated supernatant (lignin) resulting from the second treatment. Figure S4: 13C multi-CP MAS NMR spectra of the samples. Intensity has been scaled in dependence of the weight of each sample. Figure S5: 13C multi-CP MAS NMR spectra of the samples normalized with respect to the peak at maximum intensity (73 ppm, 0-1 Normalization). The spectra show the assignment peaks to the carbon in a glucopyranose repeat unit (glucose, C 1-6), to the hemicellulose (H), and to the lignin (L). Figure S6: The results of the spectral fitting of the C4-region of S-NA-C. The dotted lines represent the experimental spectrum. The fitted lines and their superposition are shown as solid lines. Figure S7: Results from spectral fitting of the WAXD diffractograms for S-NA-C. The dotted line represents the amorphous gaussian curve. The experimental line, the fitted lines, and their superposition are shown as solid lines. Figure S8: SEM images of S-NA-C taken at different maginifications. Figure S9: SEM images of S-NA-F taken at different maginifications. Figure S10: SEM images of S-A-C taken at different maginifications. Figure S11: SEM images of S-A-F taken at different maginifications. Figure S12: SEM images of L-NA-C taken at different maginifications. Figure S13: SEM images of L-NA-F taken at different maginifications. Figure S14: SEM images of L-A-C taken at different maginifications. Figure S15: SEM images of L-A-F taken at different maginifications. Table S1: The results of the spectral fitting of the C4-region for small and large size straws. Table S2: Crystallinity Index and Crystallite size obtained from spectral fitting of the WAXD diffractograms.

Author Contributions

Conceptualization, S.M., V.C., C.C., A.F., E.L., X.L., C.J. and A.P.; methodology, S.M., V.C., C.C., A.F., E.L., V.H., J.-M.K., Y.M., X.L., C.J. and A.P.; validation, C.C., A.F., E.L., V.H., J.-M.K., Y.M., X.L., C.J. and A.P.; formal analysis, S.M., V.C., C.C., A.F., E.L., V.H., J.-M.K., Y.M., X.L., C.J. and A.P.; investigation, S.M. and V.C.; writing—original draft preparation, S.M. and V.C.; writing—review and editing, S.M. and V.C., C.C., A.F., E.L., X.L., C.J. and A.P.; visualization, S.M. and V.C.; supervision, C.C., A.F., E.L., X.L., C.J. and A.P.; project administration, C.C., X.L., C.J. and A.P.; funding acquisition, C.C., A.F., X.L., C.J. and A.P. All authors have read and agreed to the published version of the manuscript.

Funding

This project was funded by the French Ministry of Higher Education, Research, and Innovation (MESRI) and the initiative of “Maîtrise des systems technologiques sûrs et durables” (MSTD) of the Alliance of Sorbonne University.

Data Availability Statement

Not applicable.

Acknowledgments

We would like to thank Thierry Ribeiro and Laura André from Institut Polytechnique UniLaSalle (Beauvais) for providing us with AMPTS devices to conduct our studies. We are also grateful to Adama Konate, UTC for performing the SEM analysis. The authors thank Stéphane Mottelet for his valuable contribution to the realization of non-linear regression in Scilab. The authors also thank Josefine Schnee (LRS, Sorbonne University) for her kindness and technical help with WAXD analysis.

Conflicts of Interest

The authors declare no conflict of interest. The funders had no role in the design of the study; in the collection, analyses, or interpretation of data; in the writing of the manuscript; or in the decision to publish the results.

References

  1. Sun, L.; Müller, B.; Schnürer, A. Biogas Production from Wheat Straw: Community Structure of Cellulose-Degrading Bacteria. Energy Sustain. Soc. 2013, 3, 15. [Google Scholar] [CrossRef] [Green Version]
  2. Adney, W.S.; Rivard, C.J.; Shiang, M.; Himmel, M.E. Anaerobic Digestion of Lignocellulosic Biomass and Wastes: Cellulases and Related Enzymes. Appl. Biochem. Biotechnol. 1991, 30, 165–183. [Google Scholar] [CrossRef] [PubMed]
  3. Wang, Z.; Wang, S.; Hu, Y.; Du, B.; Meng, J.; Wu, G.; Liu, H.; Zhan, X. Distinguishing Responses of Acetoclastic and Hydrogenotrophic Methanogens to Ammonia Stress in Mesophilic Mixed Cultures. Water Res. 2022, 224, 119029. [Google Scholar] [CrossRef] [PubMed]
  4. Li, Y.; Chen, Y.; Wu, J. Enhancement of Methane Production in Anaerobic Digestion Process: A Review. Appl. Energy 2019, 240, 120–137. [Google Scholar] [CrossRef]
  5. Baruah, J.; Nath, B.K.; Sharma, R.; Kumar, S.; Deka, R.C.; Baruah, D.C.; Kalita, E. Recent Trends in the Pretreatment of Lignocellulosic Biomass for Value-Added Products. Front. Energy Res. 2018, 6, 141. [Google Scholar] [CrossRef]
  6. Coarita Fernandez, H.; Amaya Ramirez, D.; Teixeira Franco, R.; Buffière, P.; Bayard, R. Methods for the Evaluation of Industrial Mechanical Pretreatments before Anaerobic Digesters. Molecules 2020, 25, 860. [Google Scholar] [CrossRef] [Green Version]
  7. Kaur, M. Effect of Particle Size on Enhancement of Biogas Production from Crop Residue. Mater. Today Proc. 2022, 57, 1950–1954. [Google Scholar] [CrossRef]
  8. Feng, R.; Li, Q.; Zaidi, A.A.; Peng, H.; Shi, Y. Effect of Autoclave Pretreatment on Biogas Production through Anaerobic Digestion of Green Algae. Period. Polytech. Chem. Eng. 2021, 65, 483–492. [Google Scholar] [CrossRef]
  9. Antczak, A.; Szadkowski, J.; Szadkowska, D.; Zawadzki, J. Assessment of the Effectiveness of Liquid Hot Water and Steam Explosion Pretreatments of Fast-Growing Poplar (Populus trichocarpa) Wood. Wood Sci. Technol. 2022, 56, 87–109. [Google Scholar] [CrossRef]
  10. Deepanraj, B.; Sivasubramanian, V.; Jayaraj, S. Effect of Substrate Pretreatment on Biogas Production through Anaerobic Digestion of Food Waste. Int. J. Hydrogen Energy 2017, 42, 26522–26528. [Google Scholar] [CrossRef]
  11. Abraham, A.; Mathew, A.K.; Park, H.; Choi, O.; Sindhu, R.; Parameswaran, B.; Pandey, A.; Park, J.H.; Sang, B.-I. Pretreatment Strategies for Enhanced Biogas Production from Lignocellulosic Biomass. Bioresour. Technol. 2020, 301, 122725. [Google Scholar] [CrossRef]
  12. Anukam, A.; Berghel, J. Biomass Pretreatment and Characterization: A Review. In Biotechnological Applications of Biomass; Peixoto Basso, T., Olitta Basso, T., Carlos Basso, L., Eds.; IntechOpen: London, UK, 2021; ISBN 978-1-83881-180-8. [Google Scholar]
  13. Kumar, A.K.; Sharma, S. Recent Updates on Different Methods of Pretreatment of Lignocellulosic Feedstocks: A Review. Bioresour. Bioprocess. 2017, 4, 7. [Google Scholar] [CrossRef] [Green Version]
  14. Meenakshisundaram, S.; Fayeulle, A.; Leonard, E.; Ceballos, C.; Pauss, A. Fiber Degradation and Carbohydrate Production by Combined Biological and Chemical/Physicochemical Pretreatment Methods of Lignocellulosic Biomass—A Review. Bioresour. Technol. 2021, 331, 125053. [Google Scholar] [CrossRef]
  15. Uellendahl, H.; Wang, G.; Møller, H.B.; Jørgensen, U.; Skiadas, I.V.; Gavala, H.N.; Ahring, B.K. Energy Balance and Cost-Benefit Analysis of Biogas Production from Perennial Energy Crops Pretreated by Wet Oxidation. Water Sci. Technol. 2008, 58, 1841–1847. [Google Scholar] [CrossRef] [Green Version]
  16. Bajpai, P. Structure of Lignocellulosic Biomass. In Pretreatment of Lignocellulosic Biomass for Biofuel Production; Springer Briefs in Molecular Science; Springer: Singapore, 2016; ISBN 978-981-10-0687-6. [Google Scholar]
  17. Sluiter, A.; Hames, B.; Ruiz, R.; Scarlata, C.; Sluiter, J.; Templeton, D.; Crocker, D. Determination of Structural Carbohydrates and Lignin in Biomass; National Renewable Energy Laboratory: Golden, CO, USA, 2012. [Google Scholar]
  18. Van Soest, P.J.; Wine, R.H. Determination of Lignin and Cellulose in Acid-Detergent Fiber with Permanganate. J. Assoc. Off. Anal. Chem. 1968, 51, 780–785. [Google Scholar] [CrossRef]
  19. Technical Committee ISO/TC 6. Paper, board and pulps. In Pulps—Determination of Lignin Content—Acid Hydrolysis Method; ISO: Geneva, Switzerland, 2020. [Google Scholar]
  20. Meenakshisundaram, S.; Léonard, E.; Ceballos, C.; Fayeulle, A. Lignin Fungal Depolymerization: From Substrate Characterization to Oligomers Valorization. In Fungal Biopolymers and Biocomposites; Deshmukh, S.K., Deshpande, M.V., Sridhar, K.R., Eds.; Springer Nature: Singapore, 2022; pp. 329–391. ISBN 978-981-19099-9-3. [Google Scholar]
  21. Dayton, D.C.; Foust, T.D. Biomass Characterization. In Analytical Methods for Biomass Characterization and Conversion; Elsevier: Amsterdam, The Netherlands, 2020; pp. 19–35. ISBN 978-0-12-815605-6. [Google Scholar]
  22. Oyedeji, O.; Gitman, P.; Qu, J.; Webb, E. Understanding the Impact of Lignocellulosic Biomass Variability on the Size Reduction Process: A Review. ACS Sustain. Chem. Eng. 2020, 8, 2327–2343. [Google Scholar] [CrossRef]
  23. Liu, X.; Hiligsmann, S.; Gourdon, R.; Bayard, R. Anaerobic Digestion of Lignocellulosic Biomasses Pretreated with Ceriporiopsis Subvermispora. J. Environ. Manag. 2017, 193, 154–162. [Google Scholar] [CrossRef]
  24. Jung, Y.H.; Kim, H.K.; Park, H.M.; Park, Y.-C.; Park, K.; Seo, J.-H.; Kim, K.H. Mimicking the Fenton Reaction-Induced Wood Decay by Fungi for Pretreatment of Lignocellulose. Bioresour. Technol. 2015, 179, 467–472. [Google Scholar] [CrossRef]
  25. Bhange, V.P.; William, S.P.; Sharma, A.; Gabhane, J.; Vaidya, A.N.; Wate, S.R. Pretreatment of Garden Biomass Using Fenton’s Reagent: Influence of Fe2+ and H2O2 Concentrations on Lignocellulose Degradation. J. Environ. Health Sci. Eng. 2015, 13, 12. [Google Scholar] [CrossRef] [Green Version]
  26. Kato, D.M.; Elía, N.; Flythe, M.; Lynn, B.C. Pretreatment of Lignocellulosic Biomass Using Fenton Chemistry. Bioresour. Technol. 2014, 162, 273–278. [Google Scholar] [CrossRef]
  27. Holliger, C.; Alves, M.; Andrade, D.; Angelidaki, I.; Astals, S.; Baier, U.; Bougrier, C.; Buffière, P.; Carballa, M.; de Wilde, V.; et al. Towards a Standardization of Biomethane Potential Tests. Water Sci. Technol. 2016, 74, 2515–2522. [Google Scholar] [CrossRef] [PubMed]
  28. Nkuna, R.; Roopnarain, A.; Rashama, C.; Adeleke, R. Insights into Organic Loading Rates of Anaerobic Digestion for Biogas Production: A Review. Crit. Rev. Biotechnol. 2021, 42, 487–507. [Google Scholar] [CrossRef] [PubMed]
  29. Li, P.; Li, W.; Sun, M.; Xu, X.; Zhang, B.; Sun, Y. Evaluation of Biochemical Methane Potential and Kinetics on the Anaerobic Digestion of Vegetable Crop Residues. Energies 2018, 12, 26. [Google Scholar] [CrossRef] [Green Version]
  30. Chandra, R.; Ewanick, S.; Hsieh, C.; Saddler, J.N. The Characterization of Pretreated Lignocellulosic Substrates Prior to Enzymatic Hydrolysis, Part 1: A Modified Simons’ Staining Technique. Biotechnol. Prog. 2008, 24, 1178–1185. [Google Scholar] [CrossRef]
  31. Chandra, R.P.; Esteghlalian, A.R.; Saddler, J.N. Assessing Substrate Accessibility to Enzymatic Hydrolysis by Cellulases. In Characterization of Lignocellulosic Materials; Hu, T.Q., Ed.; Blackwell Publishing Ltd.: Oxford, UK, 2008; pp. 60–80. ISBN 978-1-4443-0542-5. [Google Scholar]
  32. Yu, X.; Atalla, R.H. A Staining Technique for Evaluating the Pore Structure Variations of Microcrystalline Cellulose Powders. Powder Technol. 1998, 98, 135–138. [Google Scholar] [CrossRef]
  33. Kubelka, P. New Contributions to the Optics of Intensely Light-Scattering Materials. Part I. J. Opt. Soc. Am. 1948, 38, 448–457. [Google Scholar] [CrossRef]
  34. Sirita, J.; Phanichphant, S.; Meunier, F.C. Quantitative Analysis of Adsorbate Concentrations by Diffuse Reflectance FT-IR. Anal. Chem. 2007, 79, 3912–3918. [Google Scholar] [CrossRef] [Green Version]
  35. Ahvenainen, P.; Kontro, I.; Svedström, K. Comparison of Sample Crystallinity Determination Methods by X-ray Diffraction for Challenging Cellulose I Materials. Cellulose 2016, 23, 1073–1086. [Google Scholar] [CrossRef] [Green Version]
  36. Murthy, N.S.; Minor, H. General Procedure for Evaluating Amorphous Scattering and Crystallinity from X-ray Diffraction Scans of Semicrystalline Polymers. Polymer 1990, 31, 996–1002. [Google Scholar] [CrossRef]
  37. Wojdyr, M. Fityk: A General-purpose Peak Fitting Program. J. Appl. Crystallogr. 2010, 43, 1126–1128. [Google Scholar] [CrossRef]
  38. Cullity, B.D.; Stock, S.R. Elements of X-ray Diffraction, 3rd ed.; Pearson India Education Services: Bengaluru, India, 2015; ISBN 978-93-325-3516-9. [Google Scholar]
  39. Johnson, R.L.; Schmidt-Rohr, K. Quantitative Solid-State 13C NMR with Signal Enhancement by Multiple Cross Polarization. J. Magn. Reson. 2014, 239, 44–49. [Google Scholar] [CrossRef]
  40. Croce, S.; Wei, Q.; D’Imporzano, G.; Dong, R.; Adani, F. Anaerobic Digestion of Straw and Corn Stover: The Effect of Biological Process Optimization and Pre-Treatment on Total Bio-Methane Yield and Energy Performance. Biotechnol. Adv. 2016, 34, 1289–1304. [Google Scholar] [CrossRef] [PubMed]
  41. Achinas, S.; Euverink, G.J.W. Theoretical Analysis of Biogas Potential Prediction from Agricultural Waste. Resour.-Effic. Technol. 2016, 2, 143–147. [Google Scholar] [CrossRef] [Green Version]
  42. Guerriero, G.; Hausman, J.-F.; Legay, S. Silicon and the Plant Extracellular Matrix. Front. Plant Sci. 2016, 7, 463. [Google Scholar] [CrossRef] [Green Version]
  43. Shtein, I.; Shelef, Y.; Marom, Z.; Zelinger, E.; Schwartz, A.; Popper, Z.A.; Bar-On, B.; Harpaz-Saad, S. Stomatal Cell Wall Composition: Distinctive Structural Patterns Associated with Different Phylogenetic Groups. Ann. Bot. 2017, 119, 1021–1033. [Google Scholar] [CrossRef] [Green Version]
  44. Mulat, D.G.; Horn, S.J. Biogas Production from Lignin via Anaerobic Digestion. In Energy and Environment Series; Beckham, G.T., Ed.; Royal Society of Chemistry: Cambridge, UK, 2018; ISBN 978-1-78262-554-4. [Google Scholar]
  45. Menardo, S.; Airoldi, G.; Balsari, P. The Effect of Particle Size and Thermal Pre-Treatment on the Methane Yield of Four Agricultural by-Products. Bioresour. Technol. 2012, 104, 708–714. [Google Scholar] [CrossRef]
  46. Dumas, C.; Silva Ghizzi Damasceno, G.; Barakat, A.; Carrère, H.; Steyer, J.-P.; Rouau, X. Effects of Grinding Processes on Anaerobic Digestion of Wheat Straw. Ind. Crop. Prod. 2015, 74, 450–456. [Google Scholar] [CrossRef] [Green Version]
  47. Scherzinger, M.; Kulbeik, T.; Kaltschmitt, M. Autoclave Pre-Treatment of Green Wastes—Effects of Temperature, Residence Time and Rotation Speed on Fuel Properties. Fuel 2020, 273, 117796. [Google Scholar] [CrossRef]
  48. Ma, H.; Fu, P.; Zhao, J.; Lin, X.; Wu, W.; Yu, Z.; Xia, C.; Wang, Q.; Gao, M.; Zhou, J. Pretreatment of Wheat Straw Lignocelluloses by Deep Eutectic Solvent for Lignin Extraction. Molecules 2022, 27, 7955. [Google Scholar] [CrossRef] [PubMed]
  49. Li, J.; Feng, P.; Xiu, H.; Li, J.; Yang, X.; Ma, F.; Li, X.; Zhang, X.; Kozliak, E.; Ji, Y. Morphological Changes of Lignin during Separation of Wheat Straw Components by the Hydrothermal-Ethanol Method. Bioresour. Technol. 2019, 294, 122157. [Google Scholar] [CrossRef] [PubMed]
  50. Ueno, O.; Agarie, S. Silica Deposition in Cell Walls of the Stomatal Apparatus of Rice Leaves. Plant Prod. Sci. 2005, 8, 71–73. [Google Scholar] [CrossRef]
  51. Karimi, K.; Taherzadeh, M.J. A Critical Review on Analysis in Pretreatment of Lignocelluloses: Degree of Polymerization, Adsorption/Desorption, and Accessibility. Bioresour. Technol. 2016, 203, 348–356. [Google Scholar] [CrossRef] [Green Version]
  52. Simons, F.L. A Stain for Use in the Microscopy of Beaten Fibers. Tappi J. 1950, 33, 312–314. [Google Scholar]
  53. Esteghlalian, A.R.; Bilodeau, M.; Mansfield, S.D.; Saddler, J.N. Do Enzymatic Hydrolyzability and Simons’ Stain Reflect the Changes in the Accessibility of Lignocellulosic Substrates to Cellulase Enzymes? Biotechnol. Prog. 2001, 17, 1049–1054. [Google Scholar] [CrossRef]
  54. Yu, X.; Minor, J.L.; Atalla, R.H. Mechanism of Action of Simons’ Stain. Tappi J. 1995, 78, 175–180. [Google Scholar]
  55. Rodrigues, R.C.L.B.; Green Rodrigues, B.; Vieira Canettieri, E.; Acosta Martinez, E.; Palladino, F.; Wisniewski, A., Jr.; Rodrigues, D., Jr. Comprehensive Approach of Methods for Microstructural Analysis and Analytical Tools in Lignocellulosic Biomass Assessment—A Review. Bioresour. Technol. 2022, 348, 126627. [Google Scholar] [CrossRef]
  56. Mamilla, J.L.K.; Novak, U.; Grilc, M.; Likozar, B. Natural Deep Eutectic Solvents (DES) for Fractionation of Waste Lignocellulosic Biomass and Its Cascade Conversion to Value-Added Bio-Based Chemicals. Biomass Bioenergy 2019, 120, 417–425. [Google Scholar] [CrossRef]
  57. Auxenfans, T.; Crônier, D.; Chabbert, B.; Paës, G. Understanding the Structural and Chemical Changes of Plant Biomass Following Steam Explosion Pretreatment. Biotechnol. Biofuels 2017, 10, 36. [Google Scholar] [CrossRef] [Green Version]
  58. Sun, Q.; Foston, M.; Meng, X.; Sawada, D.; Pingali, S.V.; O’Neill, H.M.; Li, H.; Wyman, C.E.; Langan, P.; Ragauskas, A.J.; et al. Effect of Lignin Content on Changes Occurring in Poplar Cellulose Ultrastructure during Dilute Acid Pretreatment. Biotechnol. Biofuels 2014, 7, 150. [Google Scholar] [CrossRef] [Green Version]
  59. He, Y.; Pang, Y.; Liu, Y.; Li, X.; Wang, K. Physicochemical Characterization of Rice Straw Pretreated with Sodium Hydroxide in the Solid State for Enhancing Biogas Production. Energy Fuels 2008, 22, 2775–2781. [Google Scholar] [CrossRef]
  60. Stewart, D.; Wilson, H.M.; Hendra, P.J.; Morrison, I.M. Fourier-Transform Infrared and Raman Spectroscopic Study of Biochemical and Chemical Treatments of Oak Wood (Quercus Rubra) and Barley (Hordeum Vulgare) Straw. J. Agric. Food Chem. 1995, 43, 2219–2225. [Google Scholar] [CrossRef]
  61. Gogna, M.; Goacher, R.E. Comparison of Three Fourier Transform Infrared Spectroscopy Sampling Techniques for Distinction between Lignocellulose Samples. BioResources 2017, 13, 846–860. [Google Scholar] [CrossRef]
  62. Larkin, P. Infrared and Raman Spectroscopy; Elsevier: Amsterdam, The Netherlands, 2011; ISBN 978-0-12-386984-5. [Google Scholar]
  63. Faix, O.; Böttcher, J.H. The Influence of Particle Size and Concentration in Transmission and Diffuse Reflectance Spectroscopy of Wood. Holz Als Roh-Werkst. 1992, 50, 221–226. [Google Scholar] [CrossRef]
  64. Krongtaew, C.; Messner, K.; Ters, T.; Fackler, K. Characterization of Key Parameters for Biotechnological Lignocellulose Conversion Assessed by FT-NIR Spectroscopy. Part I: Qualitative Analysis of Pretreated Straw. BioResources 2010, 5, 2063–2080. [Google Scholar]
  65. Schwanninger, M.; Rodrigues, J.C.; Pereira, H.; Hinterstoisser, B. Effects of Short-Time Vibratory Ball Milling on the Shape of FT-IR Spectra of Wood and Cellulose. Vib. Spectrosc. 2004, 36, 23–40. [Google Scholar] [CrossRef]
  66. Nelson, M.L.; O’Connor, R.T. Relation of Certain Infrared Bands to Cellulose Crystallinity and Crystal Latticed Type. Part I. Spectra of Lattice Types I, II, III and of Amorphous Cellulose. J. Appl. Polym. Sci. 1964, 8, 1311–1324. [Google Scholar] [CrossRef]
  67. Park, S.; Baker, J.O.; Himmel, M.E.; Parilla, P.A.; Johnson, D.K. Cellulose Crystallinity Index: Measurement Techniques and Their Impact on Interpreting Cellulase Performance. Biotechnol. Biofuels 2010, 3, 10. [Google Scholar] [CrossRef] [Green Version]
  68. Bernardinelli, O.D.; Lima, M.A.; Rezende, C.A.; Polikarpov, I.; de Azevedo, E.R. Quantitative 13C MultiCP Solid-State NMR as a Tool for Evaluation of Cellulose Crystallinity Index Measured Directly inside Sugarcane Biomass. Biotechnol. Biofuels 2015, 8, 110. [Google Scholar] [CrossRef] [Green Version]
  69. Larsson, P.T.; Wickholm, K.; Iversen, T. A CP/MAS13C NMR Investigation of Molecular Ordering in Celluloses. Carbohydr. Res. 1997, 302, 19–25. [Google Scholar] [CrossRef]
  70. Wickholm, K.; Larsson, P.T.; Iversen, T. Assignment of Non-Crystalline Forms in Cellulose I by CP/MAS 13C NMR Spectroscopy. Carbohydr. Res. 1998, 312, 123–129. [Google Scholar] [CrossRef]
  71. Hult, E.-L.; Larsson, P.T.; Iversen, T. A Comparative CP/MAS 13C-NMR Study of Cellulose Structure in Spruce Wood and Kraft Pulp. Cellulose 2000, 7, 35–55. [Google Scholar] [CrossRef]
  72. Foston, M.B.; Hubbell, C.A.; Ragauskas, A.J. Cellulose Isolation Methodology for NMR Analysis of Cellulose Ultrastructure. Materials 2011, 4, 1985–2002. [Google Scholar] [CrossRef] [PubMed] [Green Version]
  73. Atalla, R.H.; VanderHart, D.L. The Role of Solid State 13C NMR Spectroscopy in Studies of the Nature of Native Celluloses. Solid State Nucl. Magn. Reson. 1999, 15, 1–19. [Google Scholar] [CrossRef] [PubMed]
  74. Rezende, C.A.; de Lima, M.A.; Maziero, P.; de Azevedo, E.R.; Garcia, W.; Polikarpov, I. Chemical and Morphological Characterization of Sugarcane Bagasse Submitted to a Delignification Process for Enhanced Enzymatic Digestibility. Biotechnol. Biofuels 2011, 4, 54. [Google Scholar] [CrossRef] [PubMed] [Green Version]
  75. Ghosh, M.; Prajapati, B.P.; Suryawanshi, R.K.; Kishor Dey, K.; Kango, N. Study of the Effect of Enzymatic Deconstruction on Natural Cellulose by NMR Measurements. Chem. Phys. Lett. 2019, 727, 105–115. [Google Scholar] [CrossRef]
  76. Liu, R.; Yu, H.; Huang, Y. Structure and Morphology of Cellulose in Wheat Straw. Cellulose 2005, 12, 25–34. [Google Scholar] [CrossRef]
  77. Hult, E.-L.; Larsson, P.; Iversen, T. Cellulose Fibril Aggregation—An Inherent Property of Kraft Pulps. Polymer 2001, 42, 3309–3314. [Google Scholar] [CrossRef]
  78. Zuckerstätter, G.; Terinte, N.; Sixta, H.; Schuster, K.C. Novel Insight into Cellulose Supramolecular Structure through 13C CP-MAS NMR Spectroscopy and Paramagnetic Relaxation Enhancement. Carbohydr. Polym. 2013, 93, 122–128. [Google Scholar] [CrossRef]
  79. Chunilall, V.; Bush, T.; Larsson, P.T.; Iversen, T.; Kindness, A. A CP/MAS 13C-NMR Study of Cellulose Fibril Aggregation in Eucalyptus Dissolving Pulps during Drying and the Correlation between Aggregate Dimensions and Chemical Reactivity. Holzforschung 2010, 64, 693–698. [Google Scholar] [CrossRef]
  80. Sun, Q.; Foston, M.; Sawada, D.; Pingali, S.V.; O’Neill, H.M.; Li, H.; Wyman, C.E.; Langan, P.; Pu, Y.; Ragauskas, A.J. Comparison of Changes in Cellulose Ultrastructure during Different Pretreatments of Poplar. Cellulose 2014, 21, 2419–2431. [Google Scholar] [CrossRef]
  81. Moset, V.; de Almeida Neves Xavier, C.; Feng, L.; Wahid, R.; Møller, H.B. Combined Low Thermal Alkali Addition and Mechanical Pre-Treatment to Improve Biogas Yield from Wheat Straw. J. Clean. Prod. 2018, 172, 1391–1398. [Google Scholar] [CrossRef]
  82. Beig, B.; Riaz, M.; Raza Naqvi, S.; Hassan, M.; Zheng, Z.; Karimi, K.; Pugazhendhi, A.; Atabani, A.E.; Thuy Lan Chi, N. Current Challenges and Innovative Developments in Pretreatment of Lignocellulosic Residues for Biofuel Production: A Review. Fuel 2021, 287, 119670. [Google Scholar] [CrossRef]
  83. Dai, X.; Hua, Y.; Dai, L.; Cai, C. Particle Size Reduction of Rice Straw Enhances Methane Production under Anaerobic Digestion. Bioresour. Technol. 2019, 293, 122043. [Google Scholar] [CrossRef]
  84. Sharma, S.K.; Mishra, I.M.; Sharma, M.P.; Saini, J.S. Effect of Particle Size on Biogas Generation from Biomass Residues. Biomass 1988, 17, 251–263. [Google Scholar] [CrossRef]
  85. Chandler, J.; Jewell, W. Predicting Methane Fermentation Biodegradability; Final Report; Department of Agricultural Engineering Cornell University Ithaca: New York, NY, USA, 1980. [Google Scholar] [CrossRef]
  86. Xu, N.; Liu, S.; Xin, F.; Zhou, J.; Jia, H.; Xu, J.; Jiang, M.; Dong, W. Biomethane Production from Lignocellulose: Biomass Recalcitrance and Its Impacts on Anaerobic Digestion. Front. Bioeng. Biotechnol. 2019, 7, 191. [Google Scholar] [CrossRef]
  87. Hall, M.; Bansal, P.; Lee, J.H.; Realff, M.J.; Bommarius, A.S. Cellulose Crystallinity—A Key Predictor of the Enzymatic Hydrolysis Rate: Cellulose Crystallinity. FEBS J. 2010, 277, 1571–1582. [Google Scholar] [CrossRef]
  88. Ma, S.; Wang, H.; Li, J.; Fu, Y.; Zhu, W. Methane Production Performances of Different Compositions in Lignocellulosic Biomass through Anaerobic Digestion. Energy 2019, 189, 116190. [Google Scholar] [CrossRef]
  89. Taherdanak, M.; Zilouei, H. Improving Biogas Production from Wheat Plant Using Alkaline Pretreatment. Fuel 2014, 115, 714–719. [Google Scholar] [CrossRef]
  90. Meng, X.; Foston, M.; Leisen, J.; DeMartini, J.; Wyman, C.E.; Ragauskas, A.J. Determination of Porosity of Lignocellulosic Biomass before and after Pretreatment by Using Simons’ Stain and NMR Techniques. Bioresour. Technol. 2013, 144, 467–476. [Google Scholar] [CrossRef]
  91. Peciulyte, A.; Karlström, K.; Larsson, P.T.; Olsson, L. Impact of the Supramolecular Structure of Cellulose on the Efficiency of Enzymatic Hydrolysis. Biotechnol. Biofuels 2015, 8, 56. [Google Scholar] [CrossRef] [Green Version]
  92. Thompson, D.N.; Chen, H.-C.; Grethlein, H.E. Comparison of Pretreatment Methods on the Basis of Available Surface Area. Bioresour. Technol. 1992, 39, 155–163. [Google Scholar] [CrossRef]
  93. Ferreira, L.C.; Nilsen, P.J.; Fdz-Polanco, F.; Pérez-Elvira, S.I. Biomethane Potential of Wheat Straw: Influence of Particle Size, Water Impregnation and Thermal Hydrolysis. Chem. Eng. J. 2014, 242, 254–259. [Google Scholar] [CrossRef]
  94. Hsu, T.-C.; Guo, G.-L.; Chen, W.-H.; Hwang, W.-S. Effect of Dilute Acid Pretreatment of Rice Straw on Structural Properties and Enzymatic Hydrolysis. Bioresour. Technol. 2010, 101, 4907–4913. [Google Scholar] [CrossRef] [PubMed]
  95. Yan, X.; Wang, Z.; Zhang, K.; Si, M.; Liu, M.; Chai, L.; Liu, X.; Shi, Y. Bacteria-Enhanced Dilute Acid Pretreatment of Lignocellulosic Biomass. Bioresour. Technol. 2017, 245, 419–425. [Google Scholar] [CrossRef] [PubMed]
  96. Grethlein, H.E. The Effect of Pore Size Distribution on the Rate of Enzymatic Hydrolysis of Cellulosic Substrates. Nat. Biotechnol. 1985, 3, 155–160. [Google Scholar] [CrossRef]
  97. Kim, S.; Holtzapple, M.T. Effect of Structural Features on Enzyme Digestibility of Corn Stover. Bioresour. Technol. 2006, 97, 583–591. [Google Scholar] [CrossRef]
  98. Pu, Y.; Hu, F.; Huang, F.; Davison, B.H.; Ragauskas, A.J. Assessing the Molecular Structure Basis for Biomass Recalcitrance during Dilute Acid and Hydrothermal Pretreatments. Biotechnol. Biofuels 2013, 6, 15. [Google Scholar] [CrossRef] [Green Version]
  99. Zhang, Y.-H.P.; Lynd, L.R. Toward an Aggregated Understanding of Enzymatic Hydrolysis of Cellulose: Noncomplexed Cellulase Systems. Biotechnol. Bioeng. 2004, 88, 797–824. [Google Scholar] [CrossRef]
  100. Hendriks, A.T.W.M.; Zeeman, G. Pretreatments to Enhance the Digestibility of Lignocellulosic Biomass. Bioresour. Technol. 2009, 100, 10–18. [Google Scholar] [CrossRef]
  101. Amon, T.; Amon, B.; Kryvoruchko, V.; Zollitsch, W.; Mayer, K.; Gruber, L. Biogas Production from Maize and Dairy Cattle Manure—Influence of Biomass Composition on the Methane Yield. Agric. Ecosyst. Environ. 2007, 118, 173–182. [Google Scholar] [CrossRef]
  102. Dandikas, V.; Heuwinkel, H.; Lichti, F.; Drewes, J.E.; Koch, K. Correlation between Biogas Yield and Chemical Composition of Energy Crops. Bioresour. Technol. 2014, 174, 316–320. [Google Scholar] [CrossRef]
  103. Thomsen, S.T.; Spliid, H.; Østergård, H. Statistical Prediction of Biomethane Potentials Based on the Composition of Lignocellulosic Biomass. Bioresour. Technol. 2014, 154, 80–86. [Google Scholar] [CrossRef]
  104. Triolo, J.M.; Sommer, S.G.; Møller, H.B.; Weisbjerg, M.R.; Jiang, X.Y. A New Algorithm to Characterize Biodegradability of Biomass during Anaerobic Digestion: Influence of Lignin Concentration on Methane Production Potential. Bioresour. Technol. 2011, 102, 9395–9402. [Google Scholar] [CrossRef]
Figure 1. Schematic representation of the experimental flow in this study.
Energies 16 01146 g001
Figure 2. Total lignin content (%) as a sum of acid-soluble (ASL) and acid-insoluble (AIL) fractions in pre-treated samples as compared to their corresponding controls.
Energies 16 01146 g002
Figure 3. Cumulative biomethane production over time for the large-size straw fraction (A) and small-size straw fraction (B). The markers represent the average cumulative biomethane potential (with standard deviations as error bars) and the dotted lines represent the 1st order modeled curves.
Energies 16 01146 g003
Figure 4. Total cumulative methane yield after 57 days.
Energies 16 01146 g004
Figure 5. SEM images of the control and pretreated straw taken at 250× magnification.
Energies 16 01146 g005
Figure 6. SEM-EDS analysis of the S-A-C straw sample.
Energies 16 01146 g006
Figure 7. Ratio of orange dye to blue dye for control and pretreated straw obtained using Simon’s staining technique.
Energies 16 01146 g007
Figure 8. DRIFT spectra of control and pretreated samples.
Energies 16 01146 g008
Figure 9. Normalized ATR spectra of the control and pretreated samples.
Energies 16 01146 g009
Figure 10. (A) Second derivative analysis of ATR spectra in the range 1350–1000 cm−1. (B) ATR spectra of controlled and pretreated samples in the range 1300–1050 cm−1. The resulting bands modified upon autoclave are indicated with a star (*).
Energies 16 01146 g010
Figure 11. Crystallinity index and crystallite size of control and pretreated straw obtained using WAXD.
Energies 16 01146 g011
Figure 12. Fitting of the C4-region S-NA- straw sample). The dotted lines represent the experimental spectrum. The fitted lines and their superposition (ticker line) are shown as solid lines. In the inset on the top left, the NMR spectral region of S-NA-C with the cellulose peaks attribution [73].
Energies 16 01146 g012
Figure 13. Cellulose crystallinity obtained by NMR analysis of the C4-carbon region of cellulose.
Energies 16 01146 g013
Figure 14. Lateral Fibril Dimension (LFD) and Lateral Fibril Aggregate Dimension (LFAD) for the different samples as determined by NMR analysis of the C4-carbon region of cellulose.
Energies 16 01146 g014
Table 1. Total solids (TS), Volatile solids (VS(%TS)), and elemental composition (C, H, N, S, O) of control and pretreated straw.
Sample%TSVS (%TS)% C (%TS)% H (%TS)% N (%TS)% S (%TS)% O (%TS)
S-NA-C97.8 ± 0.498.0 ± 0.044.7 ± 0.55.8 ± 0.00.3 ± 0.00.3 ± 0.540.4 ± 0.1
S-NA-F97.0 ± 0.598.1 ± 0.344.7 ± 0.65.7 ± 0.00.3 ± 0.00.1 ± 0.142.7 ± 0.2
S-A-C96.0 ± 0.598.6 ± 0.345.1 ± 1.15.7 ± 0.10.3 ± 0.00.4 ± 0.343.6 ± 0.5
S-A-F96.0 ± 0.998.6 ± 0.343.6 ± 0.65.5 ± 0.10.3 ± 0.00.0 ± 0.044.2 ± 0.2
L-NA-C95.8 ± 0.398.7 ± 0.444.8 ± 0.15.7 ± 0.10.2 ± 0.10.2 ± 0.240.1 ± 0.1
L-NA-F94.4 ± 0.398.6 ± 0.344.3 ± 0.55.6 ± 0.00.2 ± 0.10.0 ± 0.043.0 ± 0.9
L-A-C96.2 ± 0.399.5 ± 0.045.1 ± 1.25.7 ± 0.10.2 ± 0.10.0 ± 0.039.6 ± 0.8
L-A-F94.7 ± 0.398.8 ± 0.344.2 ± 0.45.6 ± 0.10.4 ± 0.30.3 ± 0.343.6 ± 0.6
Table 2. Parameters of first-order kinetic.
SampleVmax (NLCH4/kg VS)k (d−1)R2 (–)
S-NA-C318 ± 290.076 ± 00.997
S-NA-F320 ± 160.089 ± 0.0020.995
S-A-C329 ± 100.081 ± 0.0050.996
S-A-F348 ± 100.089 ± 0.0040.994
L-NA-C266 ± 60.058 ± 0.0080.998
L-NA-F264 ± 170.064 ± 0.0020.998
L-A-C274 ± 80.059 ± 0.0030.998
L-A-F303 ± 170.069 ± 0.0020.997
Disclaimer/Publisher’s Note: The statements, opinions and data contained in all publications are solely those of the individual author(s) and contributor(s) and not of MDPI and/or the editor(s). MDPI and/or the editor(s) disclaim responsibility for any injury to people or property resulting from any ideas, methods, instructions or products referred to in the content.

